|
|||||||||||||||||||||||||||||||||||||||||||||||||||||||||||||||||||||||||||||||||||||||||||||||||||||||||||||||||||||||||||||||||||||||||||||||||||||||||||||||||||||||||||||||||||||||||||||||||||||||||||||||||||||||||||||||||||||||||||||||||||||||||||||||||||||||||||||||||||||||||||||||||||||||||||||||||
| |
| Phenotypic Information (metabolism pathway, cancer, disease, phenome) |
| |
| |
| Gene-Gene Network Information: Co-Expression Network, Interacting Genes & KEGG |
| |
|


| Gene Summary for PIGP |
| Basic gene info. | Gene symbol | PIGP |
| Gene name | phosphatidylinositol glycan anchor biosynthesis, class P | |
| Synonyms | DCRC|DCRC-S|DSCR5|DSRC | |
| Cytomap | UCSC genome browser: 21q22.2 | |
| Genomic location | chr21 :38437663-38445458 | |
| Type of gene | protein-coding | |
| RefGenes | NM_153681.2, NM_153682.2,NR_028352.1, | |
| Ensembl id | ENSG00000185808 | |
| Description | Down syndrome critical region gene 5Down syndrome critical region protein 5Down syndrome critical region protein CPIG-Pphosphatidylinositol N-acetylglucosaminyltransferase subunit Pphosphatidylinositol glycan, class Pphosphatidylinositol-glycan bios | |
| Modification date | 20141207 | |
| dbXrefs | MIM : 605938 | |
| HGNC : HGNC | ||
| Ensembl : ENSG00000185808 | ||
| HPRD : 05806 | ||
| Vega : OTTHUMG00000086653 | ||
| Protein | UniProt: go to UniProt's Cross Reference DB Table | |
| Expression | CleanEX: HS_PIGP | |
| BioGPS: 51227 | ||
| Gene Expression Atlas: ENSG00000185808 | ||
| The Human Protein Atlas: ENSG00000185808 | ||
| Pathway | NCI Pathway Interaction Database: PIGP | |
| KEGG: PIGP | ||
| REACTOME: PIGP | ||
| ConsensusPathDB | ||
| Pathway Commons: PIGP | ||
| Metabolism | MetaCyc: PIGP | |
| HUMANCyc: PIGP | ||
| Regulation | Ensembl's Regulation: ENSG00000185808 | |
| miRBase: chr21 :38,437,663-38,445,458 | ||
| TargetScan: NM_153681 | ||
| cisRED: ENSG00000185808 | ||
| Context | iHOP: PIGP | |
| cancer metabolism search in PubMed: PIGP | ||
| UCL Cancer Institute: PIGP | ||
| Assigned class in ccmGDB | C | |
| Top |
| Phenotypic Information for PIGP(metabolism pathway, cancer, disease, phenome) |
| Cancer | CGAP: PIGP |
| Familial Cancer Database: PIGP | |
| * This gene is included in those cancer gene databases. |
|
|
|
|
|
| . | |||||||||||||||||||||||||||||||||||||||||||||||||||||||||||||||||||||||||||||||||||||||||||||||||||||||||||||||||||||||||||||||||||||||||||||||||||||||||||||||||||||||||||||||||||||||||||||||||||||||||||||||||||||||||||||||||||||||||||||||||||||||||||||||||||||||||||||||||||||||||||||||||||||||||||
Oncogene 1 | Significant driver gene in | ||||||||||||||||||||||||||||||||||||||||||||||||||||||||||||||||||||||||||||||||||||||||||||||||||||||||||||||||||||||||||||||||||||||||||||||||||||||||||||||||||||||||||||||||||||||||||||||||||||||||||||||||||||||||||||||||||||||||||||||||||||||||||||||||||||||||||||||||||||||||||||||||||||||||||||||||
| cf) number; DB name 1 Oncogene; http://nar.oxfordjournals.org/content/35/suppl_1/D721.long, 2 Tumor Suppressor gene; https://bioinfo.uth.edu/TSGene/, 3 Cancer Gene Census; http://www.nature.com/nrc/journal/v4/n3/abs/nrc1299.html, 4 CancerGenes; http://nar.oxfordjournals.org/content/35/suppl_1/D721.long, 5 Network of Cancer Gene; http://ncg.kcl.ac.uk/index.php, 1Therapeutic Vulnerabilities in Cancer; http://cbio.mskcc.org/cancergenomics/statius/ |
| REACTOME_METABOLISM_OF_PROTEINS | |
| OMIM | |
| Orphanet | |
| Disease | KEGG Disease: PIGP |
| MedGen: PIGP (Human Medical Genetics with Condition) | |
| ClinVar: PIGP | |
| Phenotype | MGI: PIGP (International Mouse Phenotyping Consortium) |
| PhenomicDB: PIGP | |
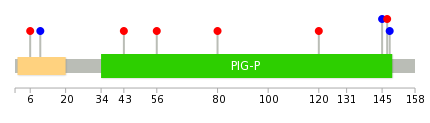
| Mutations for PIGP |
| * Under tables are showing count per each tissue to give us broad intuition about tissue specific mutation patterns.You can go to the detailed page for each mutation database's web site. |
| There's no structural variation information in COSMIC data for this gene. |
| * From mRNA Sanger sequences, Chitars2.0 arranged chimeric transcripts. This table shows PIGP related fusion information. |
| ID | Head Gene | Tail Gene | Accession | Gene_a | qStart_a | qEnd_a | Chromosome_a | tStart_a | tEnd_a | Gene_a | qStart_a | qEnd_a | Chromosome_a | tStart_a | tEnd_a |
| AV753487 | PIGP | 1 | 407 | 21 | 38444504 | 38444910 | KIAA1199 | 401 | 594 | 15 | 81177832 | 81178026 | |
| Top |
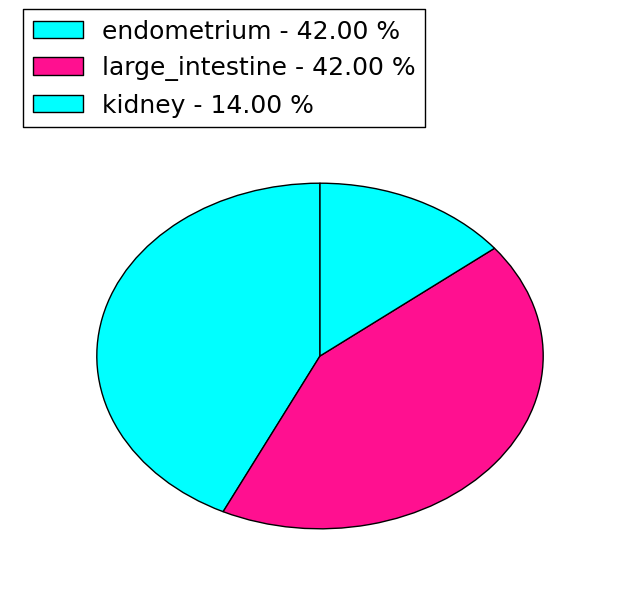
| Mutation type/ Tissue ID | brca | cns | cerv | endome | haematopo | kidn | Lintest | liver | lung | ns | ovary | pancre | prost | skin | stoma | thyro | urina | |||
| Total # sample | 1 | |||||||||||||||||||
| GAIN (# sample) | 1 | |||||||||||||||||||
| LOSS (# sample) |
| cf) Tissue ID; Tissue type (1; Breast, 2; Central_nervous_system, 3; Cervix, 4; Endometrium, 5; Haematopoietic_and_lymphoid_tissue, 6; Kidney, 7; Large_intestine, 8; Liver, 9; Lung, 10; NS, 11; Ovary, 12; Pancreas, 13; Prostate, 14; Skin, 15; Stomach, 16; Thyroid, 17; Urinary_tract) |
| Top |
|
 |
| Top |
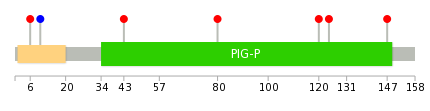
| Stat. for Non-Synonymous SNVs (# total SNVs=7) | (# total SNVs=2) |
 |  |
(# total SNVs=0) | (# total SNVs=0) |
| Top |
| * When you move the cursor on each content, you can see more deailed mutation information on the Tooltip. Those are primary_site,primary_histology,mutation(aa),pubmedID. |
| GRCh37 position | Mutation(aa) | Unique sampleID count |
| chr21:38437924-38437924 | p.Q145Q | 1 |
| chr21:38438000-38438000 | p.K120T | 1 |
| chr21:38439669-38439669 | p.V80D | 1 |
| chr21:38441913-38441913 | p.V56M | 1 |
| chr21:38444761-38444761 | p.L43I | 1 |
| chr21:38444809-38444809 | p.E27* | 1 |
| chr21:38444858-38444858 | p.L10L | 1 |
| chr21:38444871-38444871 | p.T6I | 1 |
| chr21:38437915-38437915 | p.F148F | 1 |
| chr21:38437918-38437918 | p.F147L | 1 |
| Top |
|
 |
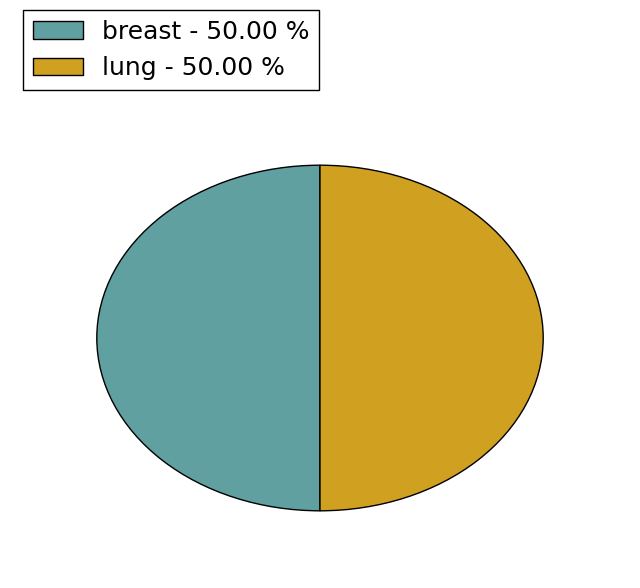
| Point Mutation/ Tissue ID | 1 | 2 | 3 | 4 | 5 | 6 | 7 | 8 | 9 | 10 | 11 | 12 | 13 | 14 | 15 | 16 | 17 | 18 | 19 | 20 |
| # sample | 1 | 2 | 1 | 3 | ||||||||||||||||
| # mutation | 1 | 2 | 1 | 3 | ||||||||||||||||
| nonsynonymous SNV | 2 | 1 | 3 | |||||||||||||||||
| synonymous SNV | 1 |
| cf) Tissue ID; Tissue type (1; BLCA[Bladder Urothelial Carcinoma], 2; BRCA[Breast invasive carcinoma], 3; CESC[Cervical squamous cell carcinoma and endocervical adenocarcinoma], 4; COAD[Colon adenocarcinoma], 5; GBM[Glioblastoma multiforme], 6; Glioma Low Grade, 7; HNSC[Head and Neck squamous cell carcinoma], 8; KICH[Kidney Chromophobe], 9; KIRC[Kidney renal clear cell carcinoma], 10; KIRP[Kidney renal papillary cell carcinoma], 11; LAML[Acute Myeloid Leukemia], 12; LUAD[Lung adenocarcinoma], 13; LUSC[Lung squamous cell carcinoma], 14; OV[Ovarian serous cystadenocarcinoma ], 15; PAAD[Pancreatic adenocarcinoma], 16; PRAD[Prostate adenocarcinoma], 17; SKCM[Skin Cutaneous Melanoma], 18:STAD[Stomach adenocarcinoma], 19:THCA[Thyroid carcinoma], 20:UCEC[Uterine Corpus Endometrial Carcinoma]) |
| Top |
| * We represented just top 10 SNVs. When you move the cursor on each content, you can see more deailed mutation information on the Tooltip. Those are primary_site, primary_histology, mutation(aa), pubmedID. |
| Genomic Position | Mutation(aa) | Unique sampleID count |
| chr21:38438000 | p.Q124H,PIGP | 1 |
| chr21:38439669 | p.K120T,PIGP | 1 |
| chr21:38444761 | p.V80D,PIGP | 1 |
| chr21:38444858 | p.L43I,PIGP | 1 |
| chr21:38444871 | p.L10L | 1 |
| chr21:38437918 | p.T6I | 1 |
| chr21:38437987 | p.F147L,PIGP | 1 |
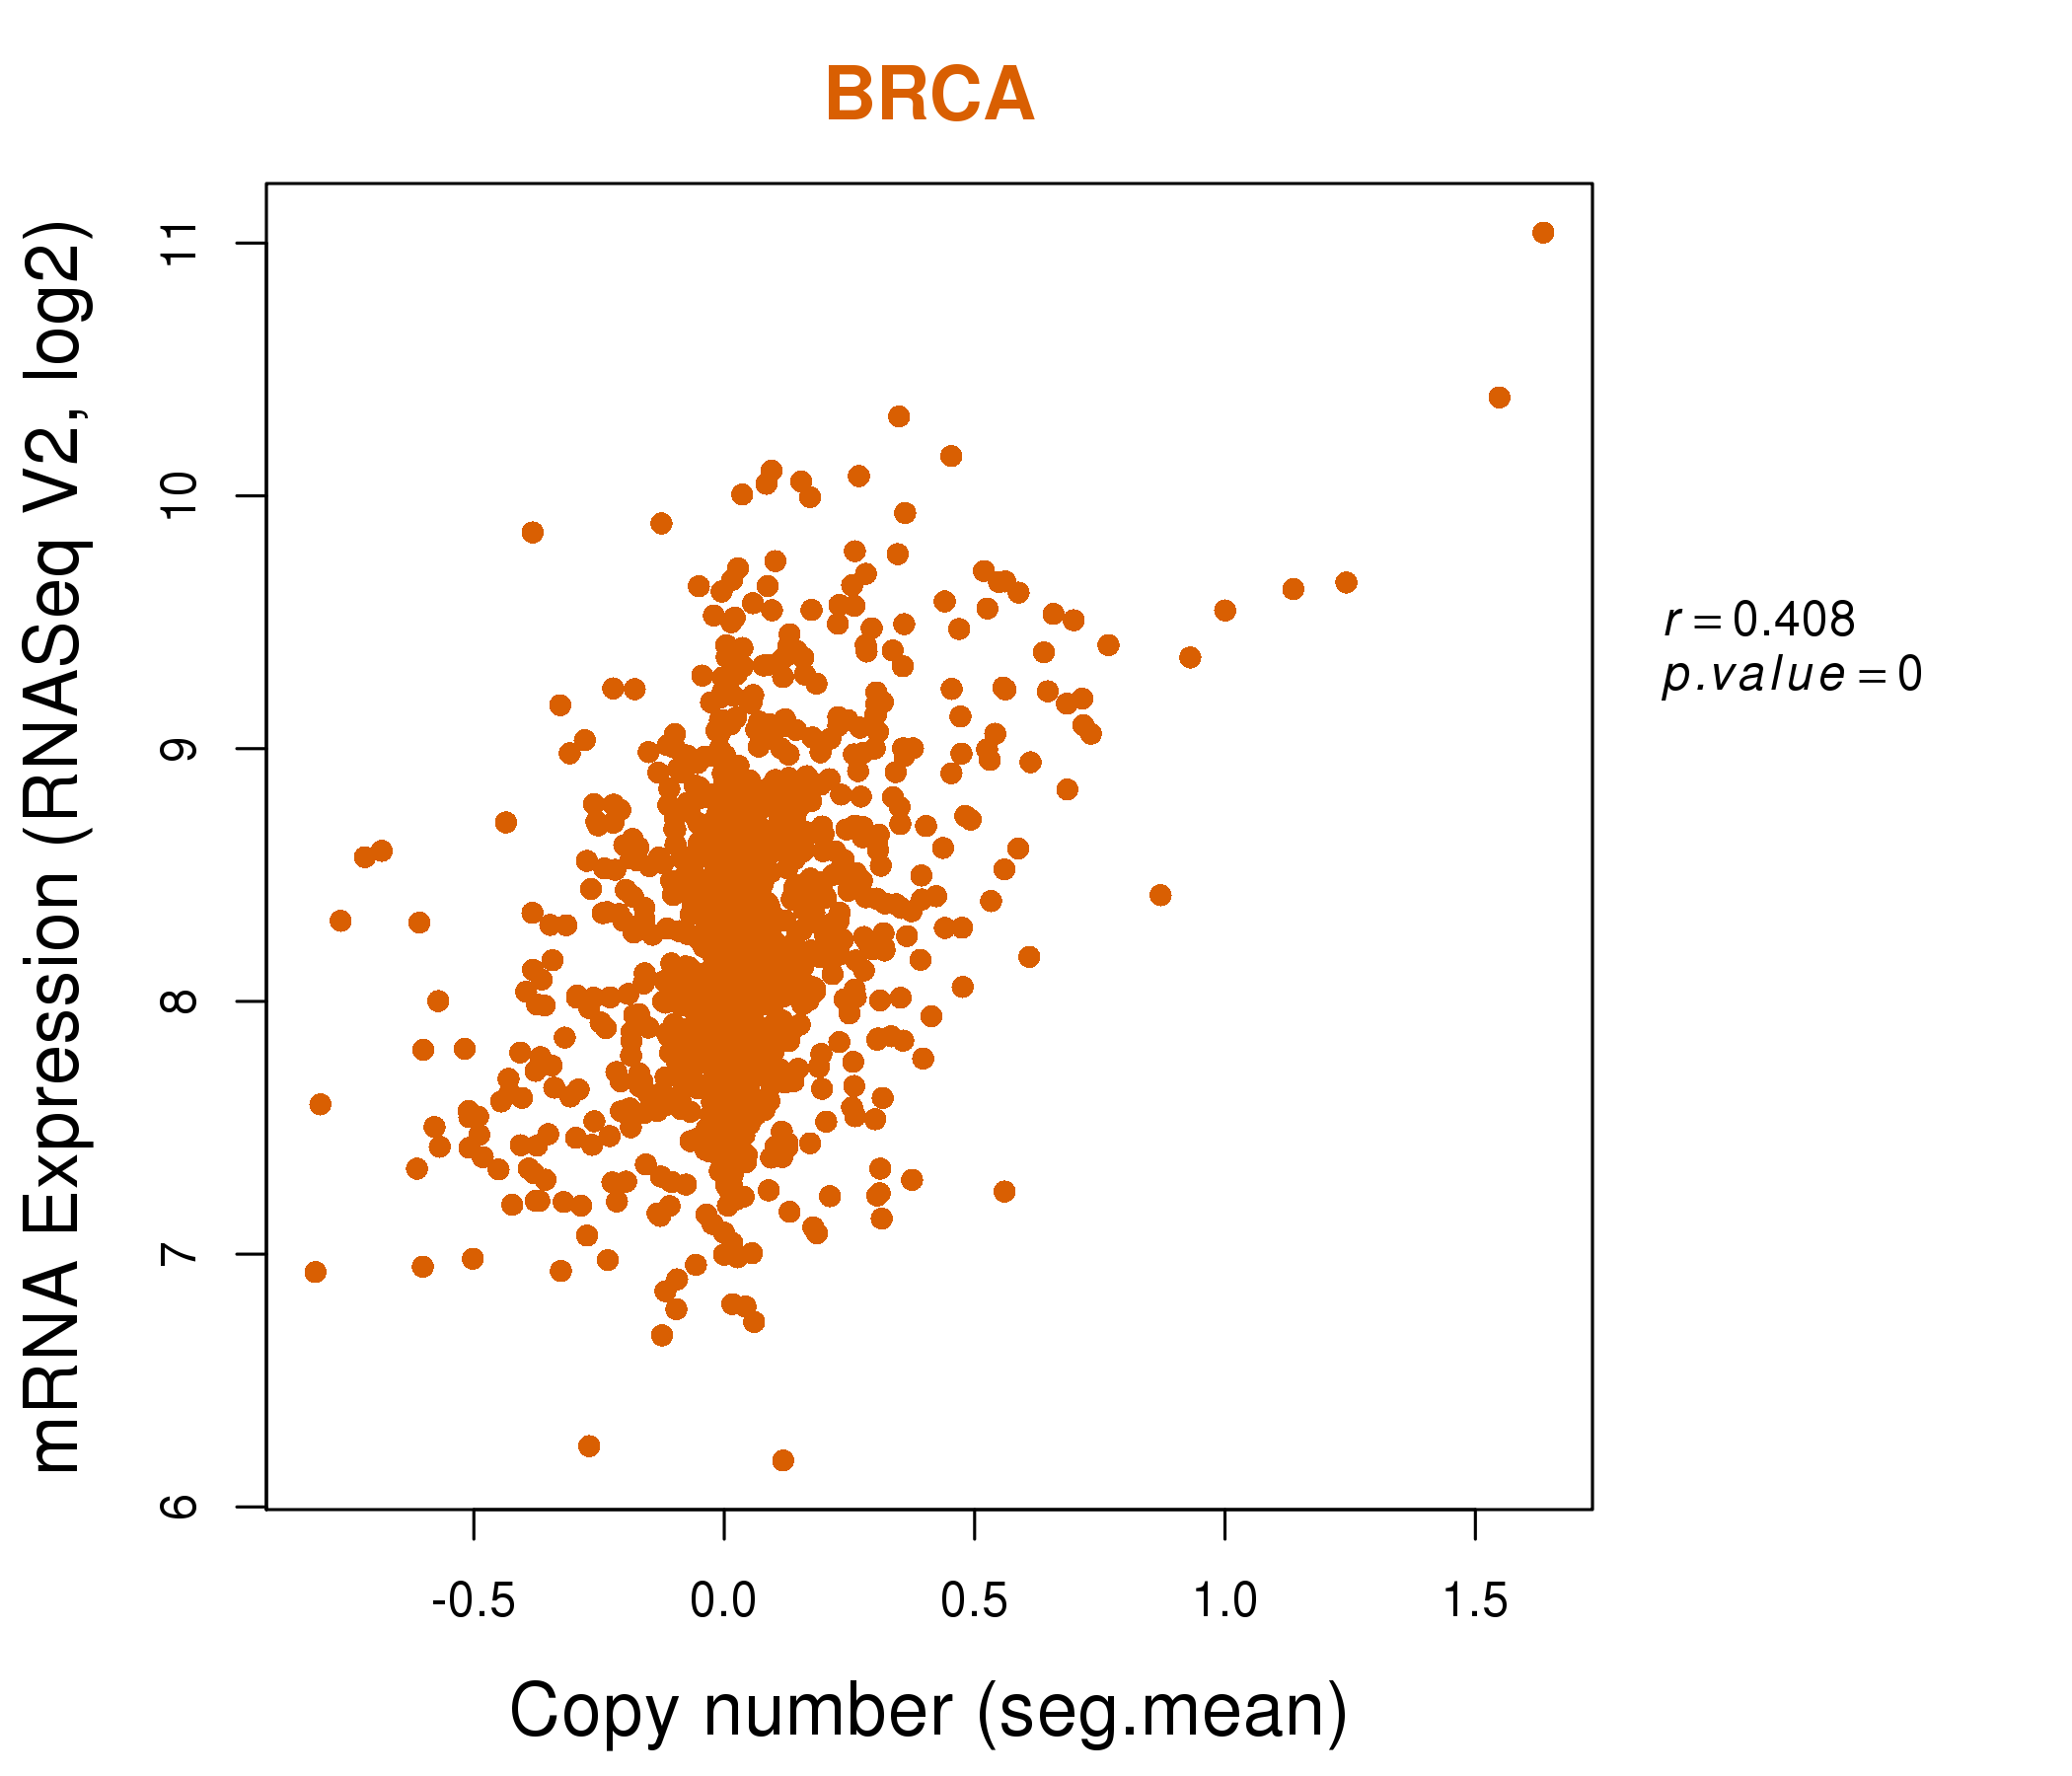
| * Copy number data were extracted from TCGA using R package TCGA-Assembler. The URLs of all public data files on TCGA DCC data server were gathered on Jan-05-2015. Function ProcessCNAData in TCGA-Assembler package was used to obtain gene-level copy number value which is calculated as the average copy number of the genomic region of a gene. |
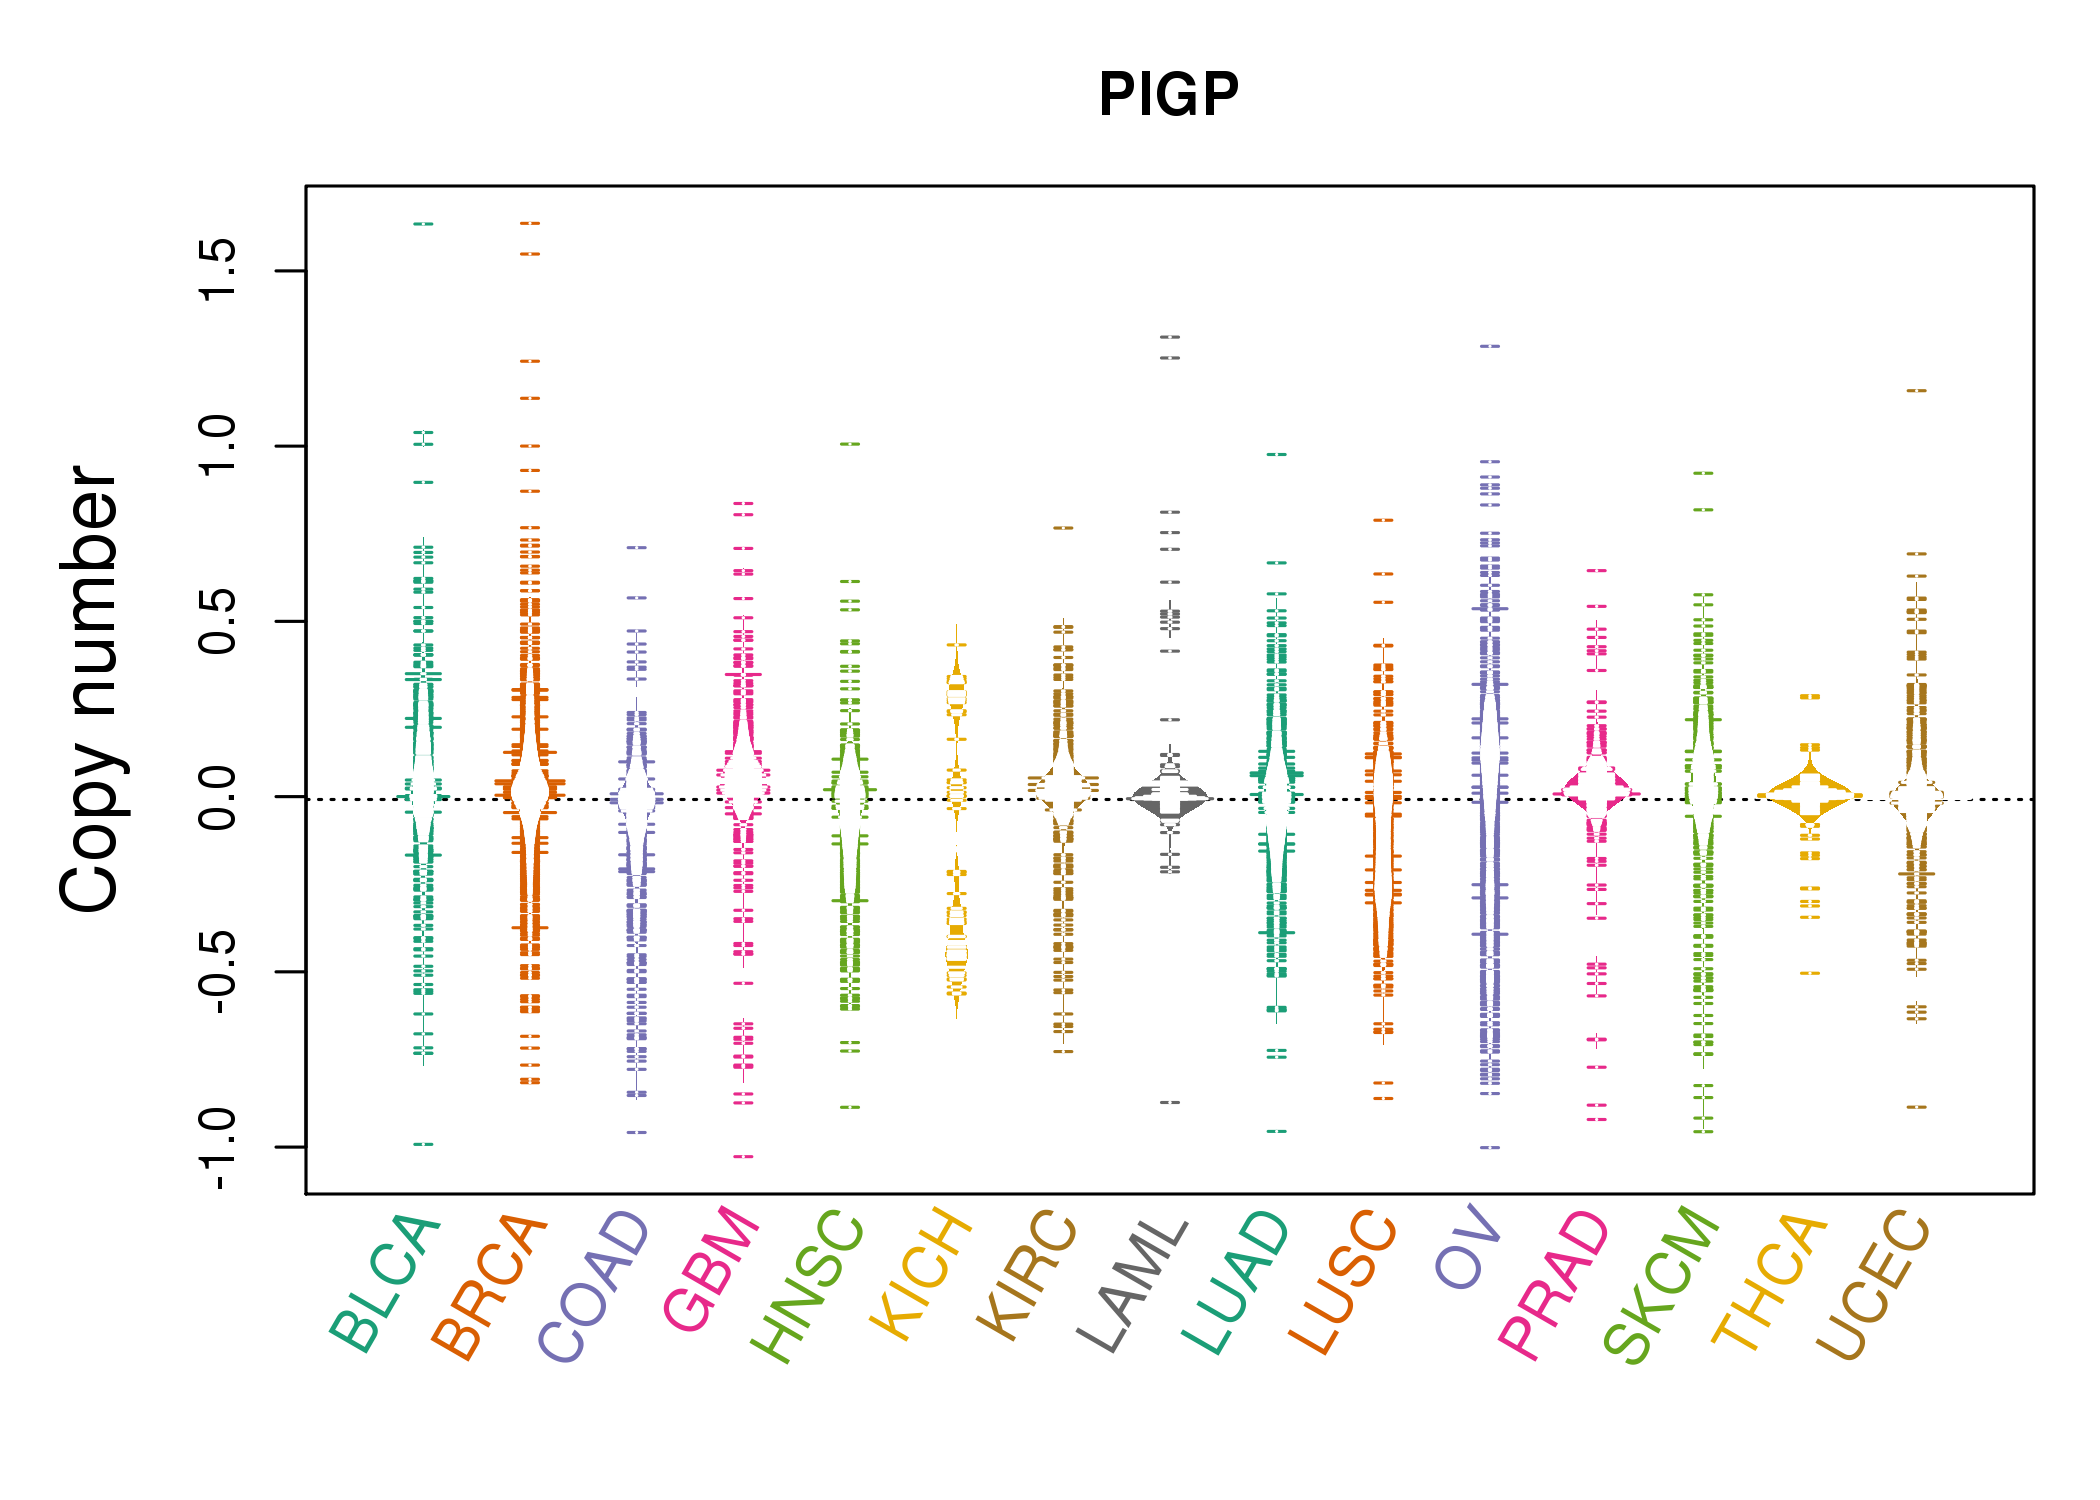 |
| cf) Tissue ID[Tissue type]: BLCA[Bladder Urothelial Carcinoma], BRCA[Breast invasive carcinoma], CESC[Cervical squamous cell carcinoma and endocervical adenocarcinoma], COAD[Colon adenocarcinoma], GBM[Glioblastoma multiforme], Glioma Low Grade, HNSC[Head and Neck squamous cell carcinoma], KICH[Kidney Chromophobe], KIRC[Kidney renal clear cell carcinoma], KIRP[Kidney renal papillary cell carcinoma], LAML[Acute Myeloid Leukemia], LUAD[Lung adenocarcinoma], LUSC[Lung squamous cell carcinoma], OV[Ovarian serous cystadenocarcinoma ], PAAD[Pancreatic adenocarcinoma], PRAD[Prostate adenocarcinoma], SKCM[Skin Cutaneous Melanoma], STAD[Stomach adenocarcinoma], THCA[Thyroid carcinoma], UCEC[Uterine Corpus Endometrial Carcinoma] |
| Top |
| Gene Expression for PIGP |
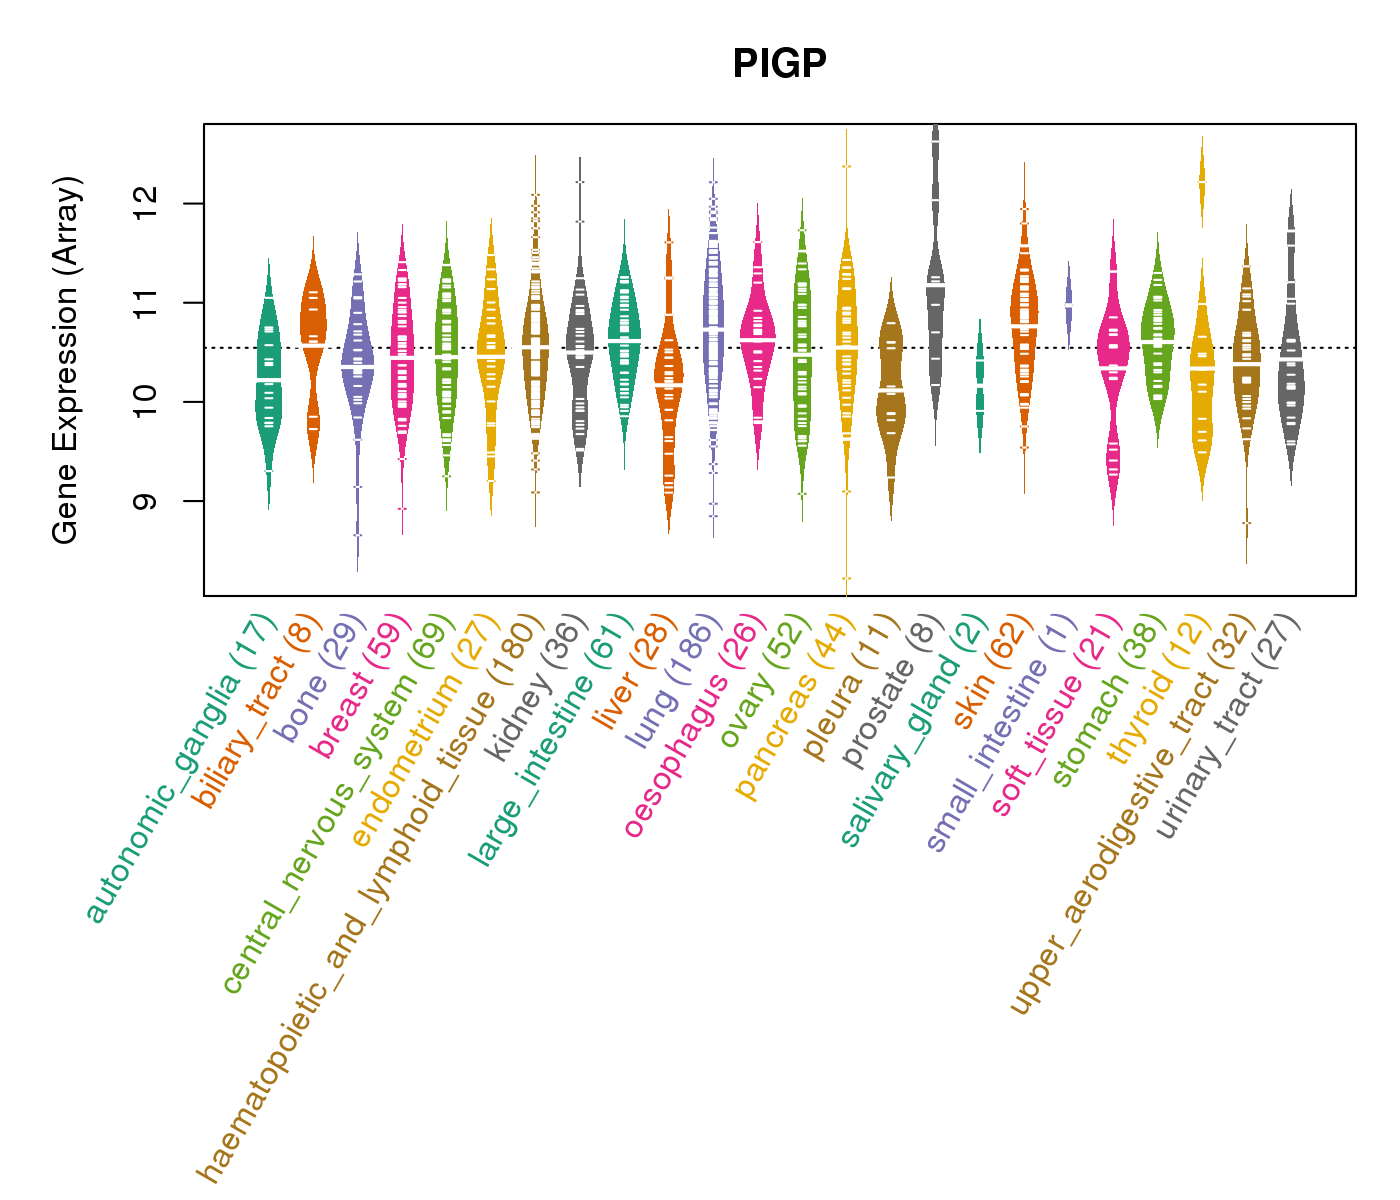
| * CCLE gene expression data were extracted from CCLE_Expression_Entrez_2012-10-18.res: Gene-centric RMA-normalized mRNA expression data. |
 |
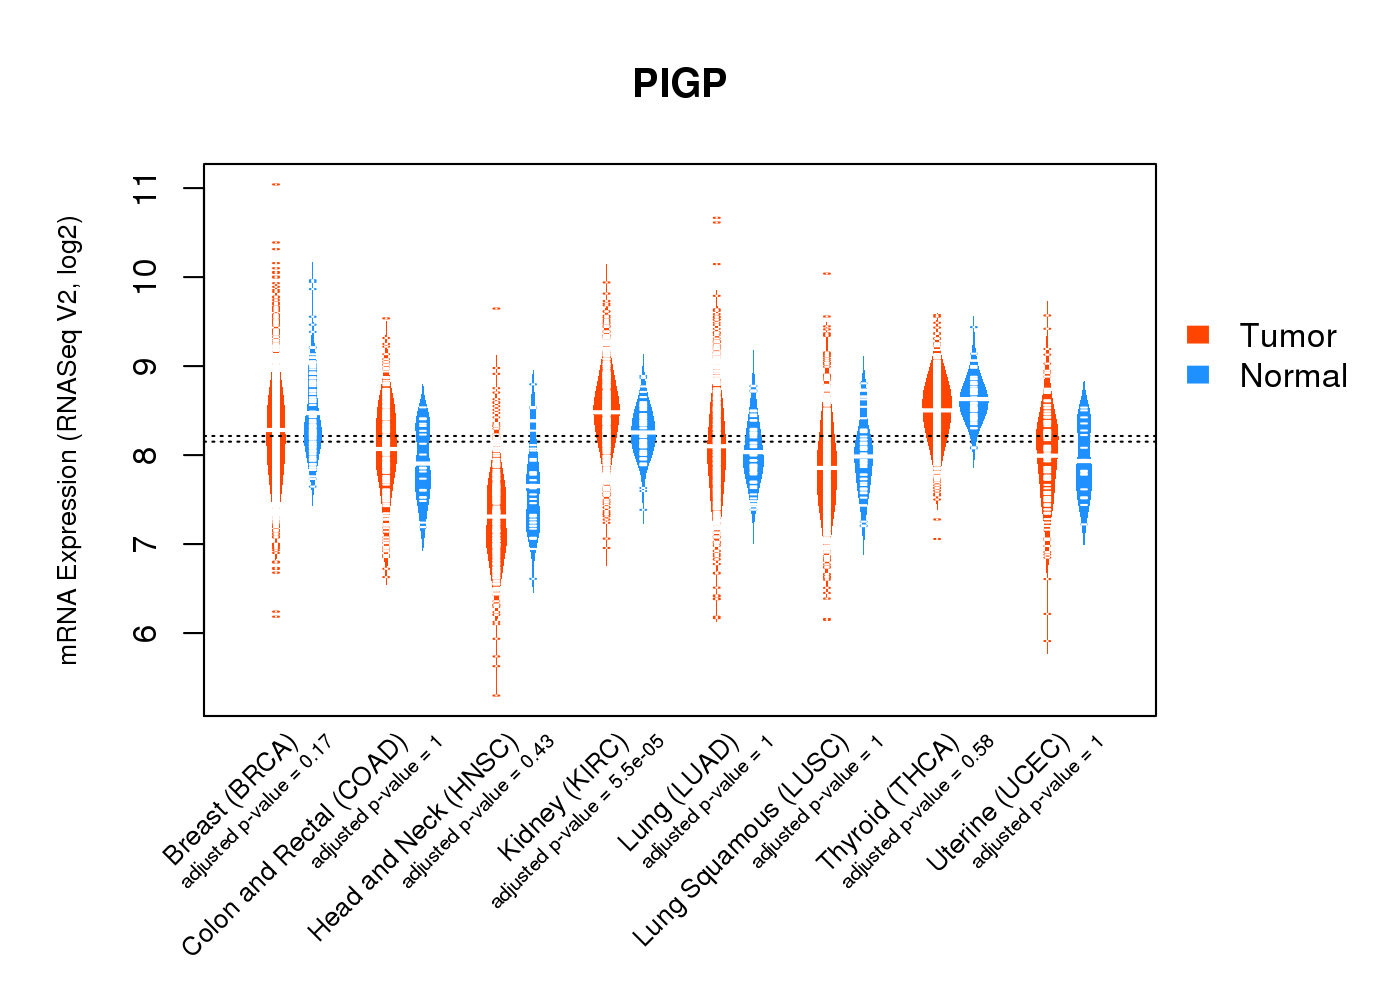
| * Normalized gene expression data of RNASeqV2 was extracted from TCGA using R package TCGA-Assembler. The URLs of all public data files on TCGA DCC data server were gathered at Jan-05-2015. Only eight cancer types have enough normal control samples for differential expression analysis. (t test, adjusted p<0.05 (using Benjamini-Hochberg FDR)) |
 |
| Top |
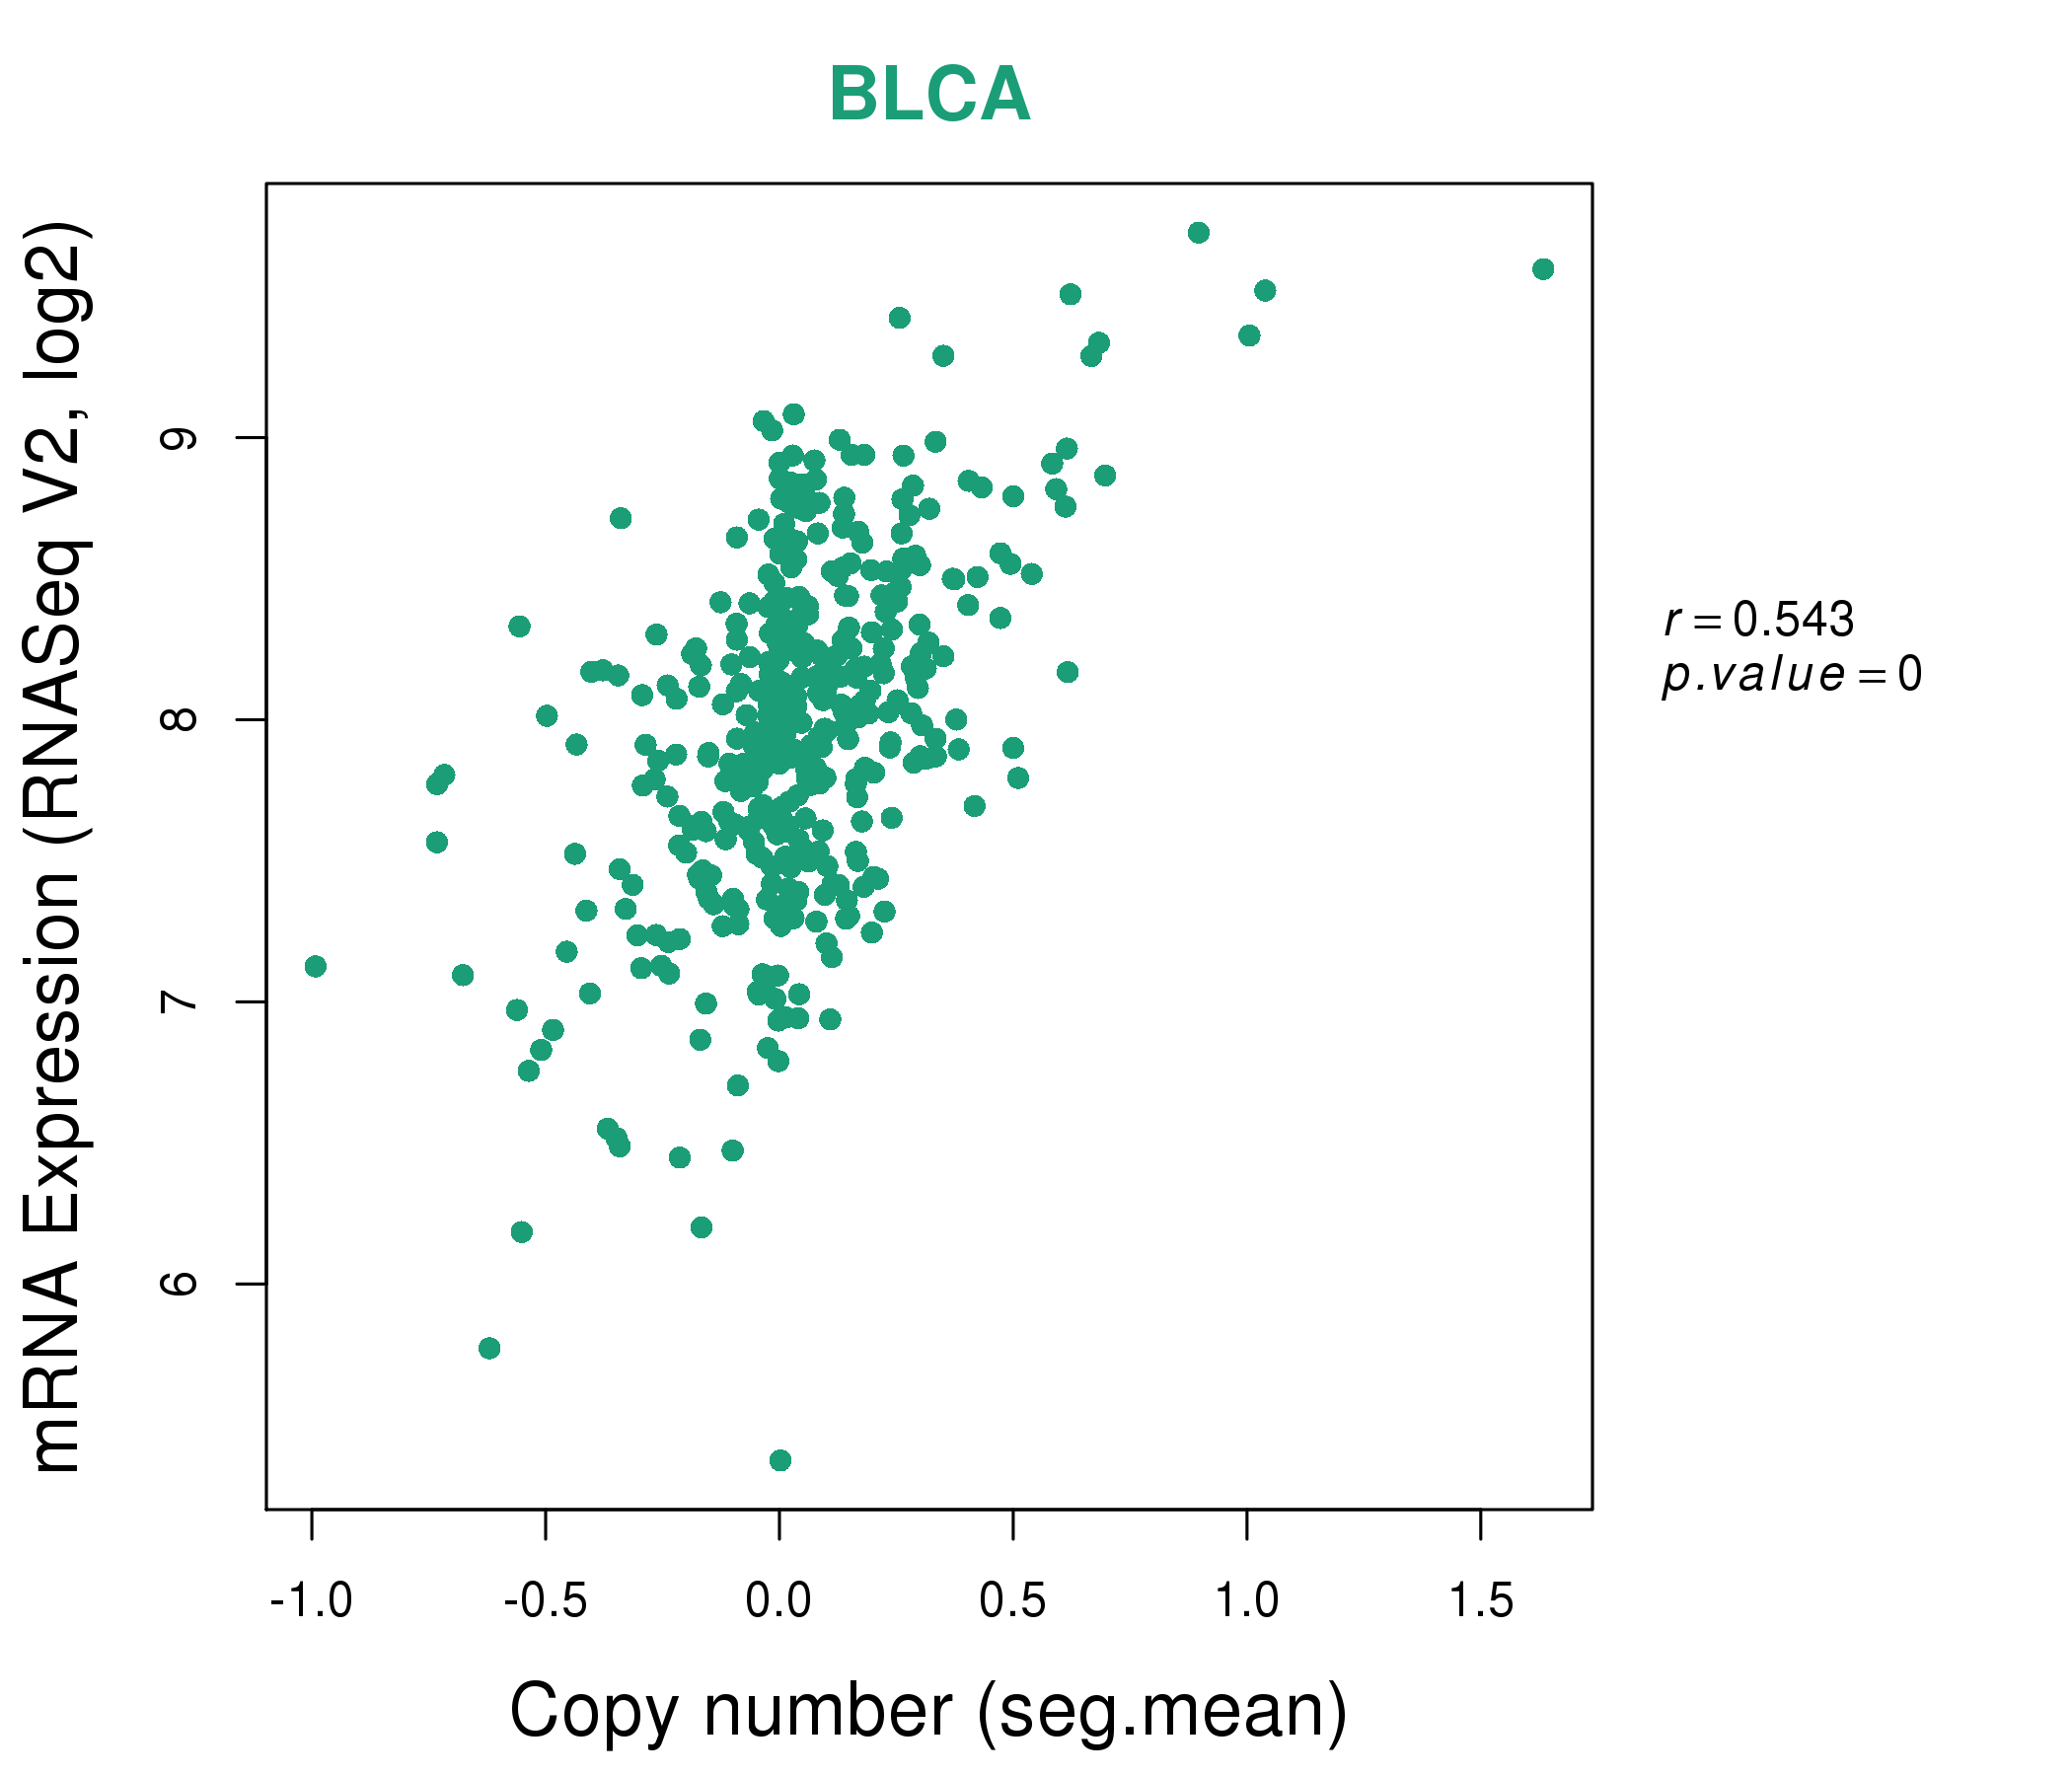
| * This plots show the correlation between CNV and gene expression. |
: Open all plots for all cancer types
 |
|
 |
|

| Top |
| Gene-Gene Network Information |
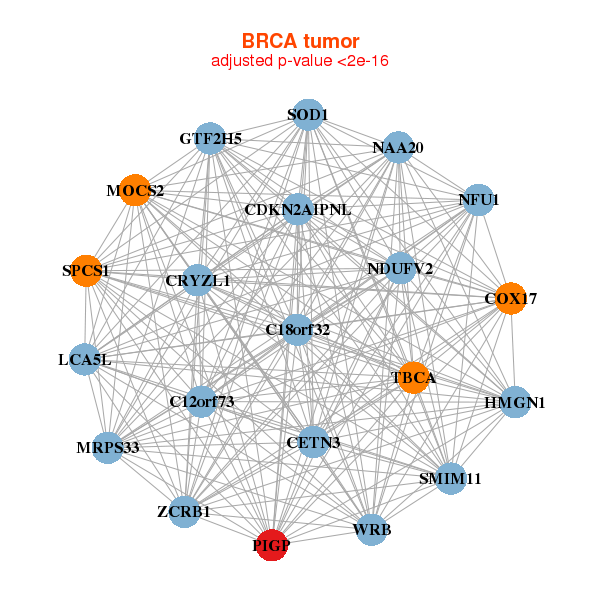
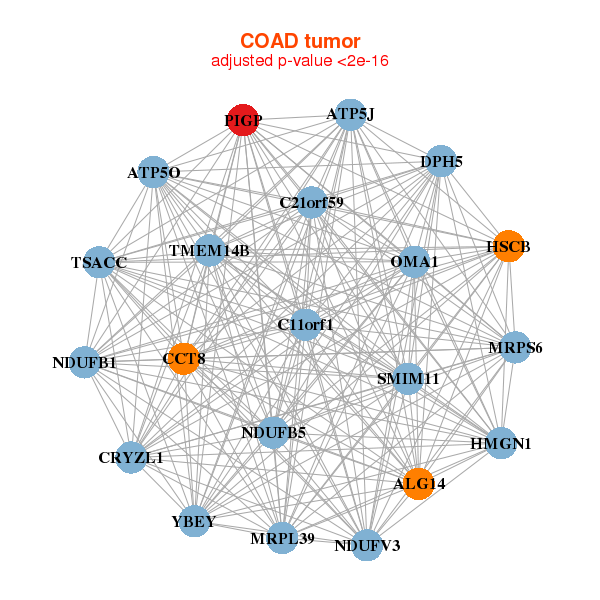
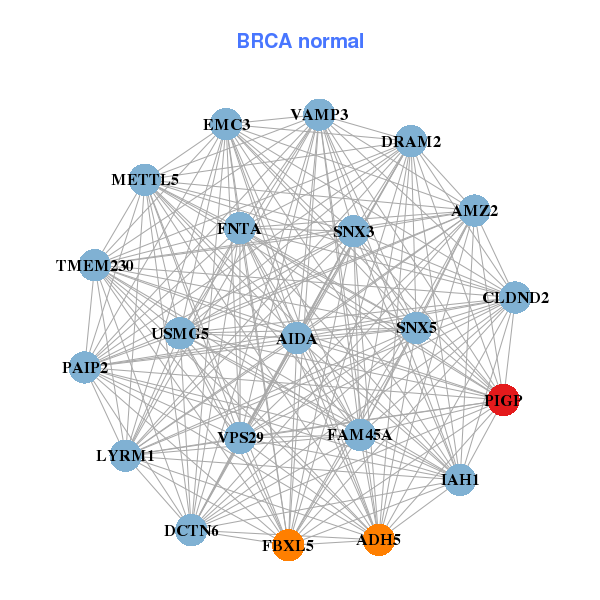
| * Co-Expression network figures were drawn using R package igraph. Only the top 20 genes with the highest correlations were shown. Red circle: input gene, orange circle: cell metabolism gene, sky circle: other gene |
: Open all plots for all cancer types
 |
|
| C12orf73,C18orf32,CDKN2AIPNL,CETN3,COX17,CRYZL1,SMIM11, GTF2H5,HMGN1,LCA5L,MOCS2,MRPS33,NAA20,NDUFV2, NFU1,PIGP,SOD1,SPCS1,TBCA,WRB,ZCRB1 | ADH5,AIDA,AMZ2,TMEM230,CLDND2,DCTN6,DRAM2, FAM45A,FBXL5,FNTA,IAH1,LYRM1,METTL5,PAIP2, PIGP,SNX3,SNX5,EMC3,USMG5,VAMP3,VPS29 |
 |
|
| ALG14,ATP5J,ATP5O,C11orf1,TSACC,YBEY,C21orf59, CCT8,CRYZL1,DPH5,SMIM11,HMGN1,HSCB,MRPL39, MRPS6,NDUFB1,NDUFB5,NDUFV3,OMA1,PIGP,TMEM14B | C11orf58,BRK1,CRYZL1,FAM104B,SMIM11,IFT46,METTL5, MFF,MRPS6,N6AMT2,NMD3,PAIP1,PCBD1,PCNP, PIGP,RBMX2,SNX3,TCEAL8,THYN1,VPS72,YBX1 |
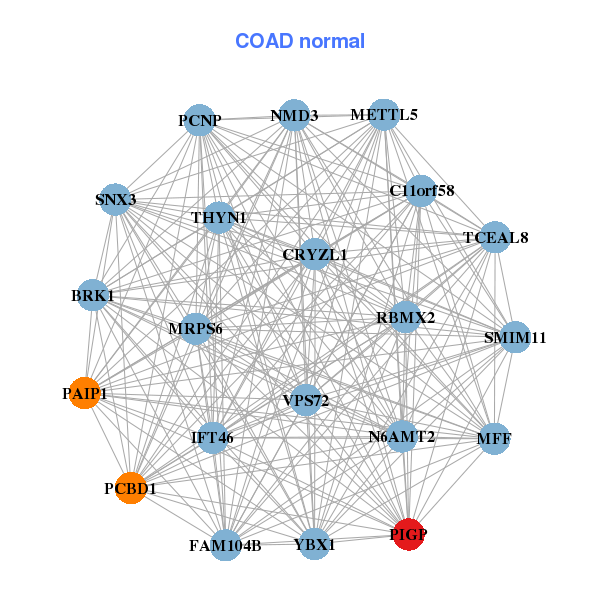
| * Co-Expression network figures were drawn using R package igraph. Only the top 20 genes with the highest correlations were shown. Red circle: input gene, orange circle: cell metabolism gene, sky circle: other gene |
: Open all plots for all cancer types
| Top |
: Open all interacting genes' information including KEGG pathway for all interacting genes from DAVID
| Top |
| Pharmacological Information for PIGP |
| There's no related Drug. |
| Top |
| Cross referenced IDs for PIGP |
| * We obtained these cross-references from Uniprot database. It covers 150 different DBs, 18 categories. http://www.uniprot.org/help/cross_references_section |
: Open all cross reference information
|
Copyright © 2016-Present - The Univsersity of Texas Health Science Center at Houston @ |