|
|||||||||||||||||||||||||||||||||||||||||||||||||||||||||||||||||||||||||||||||||||||||||||||||||||||||||||||||||||||||||||||||||||||||||||||||||||||||||||||||||||||||||||||||||||||||||||||||||||||||||||||||||||||||||||||||||||||||||||||||||||||||||||||||||||||||||||||||||||||||||||||||||||||||||||||||||||||||||||||||||||||||||||||
| |
| Phenotypic Information (metabolism pathway, cancer, disease, phenome) |
| |
| |
| Gene-Gene Network Information: Co-Expression Network, Interacting Genes & KEGG |
| |
|


| Gene Summary for PIPOX |
| Basic gene info. | Gene symbol | PIPOX |
| Gene name | pipecolic acid oxidase | |
| Synonyms | LPIPOX | |
| Cytomap | UCSC genome browser: 17q11.2 | |
| Genomic location | chr17 :27369917-27384236 | |
| Type of gene | protein-coding | |
| RefGenes | NM_016518.2, | |
| Ensembl id | ENSG00000179761 | |
| Description | L-pipecolate oxidaseL-pipecolic acid oxidasePSOperoxisomal sarcosine oxidase | |
| Modification date | 20141207 | |
| dbXrefs | HGNC : HGNC | |
| Ensembl : ENSG00000179761 | ||
| HPRD : 17853 | ||
| Vega : OTTHUMG00000132679 | ||
| Protein | UniProt: go to UniProt's Cross Reference DB Table | |
| Expression | CleanEX: HS_PIPOX | |
| BioGPS: 51268 | ||
| Gene Expression Atlas: ENSG00000179761 | ||
| The Human Protein Atlas: ENSG00000179761 | ||
| Pathway | NCI Pathway Interaction Database: PIPOX | |
| KEGG: PIPOX | ||
| REACTOME: PIPOX | ||
| ConsensusPathDB | ||
| Pathway Commons: PIPOX | ||
| Metabolism | MetaCyc: PIPOX | |
| HUMANCyc: PIPOX | ||
| Regulation | Ensembl's Regulation: ENSG00000179761 | |
| miRBase: chr17 :27,369,917-27,384,236 | ||
| TargetScan: NM_016518 | ||
| cisRED: ENSG00000179761 | ||
| Context | iHOP: PIPOX | |
| cancer metabolism search in PubMed: PIPOX | ||
| UCL Cancer Institute: PIPOX | ||
| Assigned class in ccmGDB | C | |
| Top |
| Phenotypic Information for PIPOX(metabolism pathway, cancer, disease, phenome) |
| Cancer | CGAP: PIPOX |
| Familial Cancer Database: PIPOX | |
| * This gene is included in those cancer gene databases. |
|
|
|
|
|
| . | |||||||||||||||||||||||||||||||||||||||||||||||||||||||||||||||||||||||||||||||||||||||||||||||||||||||||||||||||||||||||||||||||||||||||||||||||||||||||||||||||||||||||||||||||||||||||||||||||||||||||||||||||||||||||||||||||||||||||||||||||||||||||||||||||||||||||||||||||||||||||||||||||||||||||||||||||||||||||||||||||||||||
Oncogene 1 | Significant driver gene in | ||||||||||||||||||||||||||||||||||||||||||||||||||||||||||||||||||||||||||||||||||||||||||||||||||||||||||||||||||||||||||||||||||||||||||||||||||||||||||||||||||||||||||||||||||||||||||||||||||||||||||||||||||||||||||||||||||||||||||||||||||||||||||||||||||||||||||||||||||||||||||||||||||||||||||||||||||||||||||||||||||||||||||||
| cf) number; DB name 1 Oncogene; http://nar.oxfordjournals.org/content/35/suppl_1/D721.long, 2 Tumor Suppressor gene; https://bioinfo.uth.edu/TSGene/, 3 Cancer Gene Census; http://www.nature.com/nrc/journal/v4/n3/abs/nrc1299.html, 4 CancerGenes; http://nar.oxfordjournals.org/content/35/suppl_1/D721.long, 5 Network of Cancer Gene; http://ncg.kcl.ac.uk/index.php, 1Therapeutic Vulnerabilities in Cancer; http://cbio.mskcc.org/cancergenomics/statius/ |
| KEGG_GLYCINE_SERINE_AND_THREONINE_METABOLISM | |
| OMIM | |
| Orphanet | |
| Disease | KEGG Disease: PIPOX |
| MedGen: PIPOX (Human Medical Genetics with Condition) | |
| ClinVar: PIPOX | |
| Phenotype | MGI: PIPOX (International Mouse Phenotyping Consortium) |
| PhenomicDB: PIPOX | |
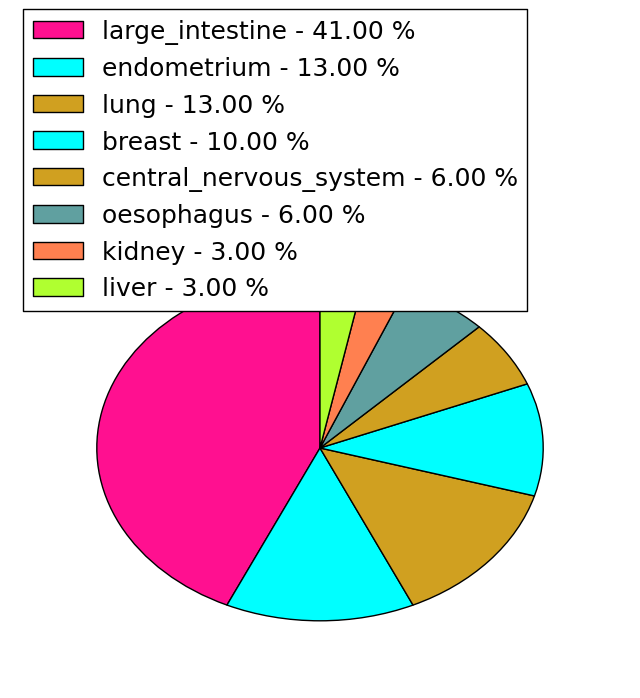
| Mutations for PIPOX |
| * Under tables are showing count per each tissue to give us broad intuition about tissue specific mutation patterns.You can go to the detailed page for each mutation database's web site. |
| - Statistics for Tissue and Mutation type | Top |
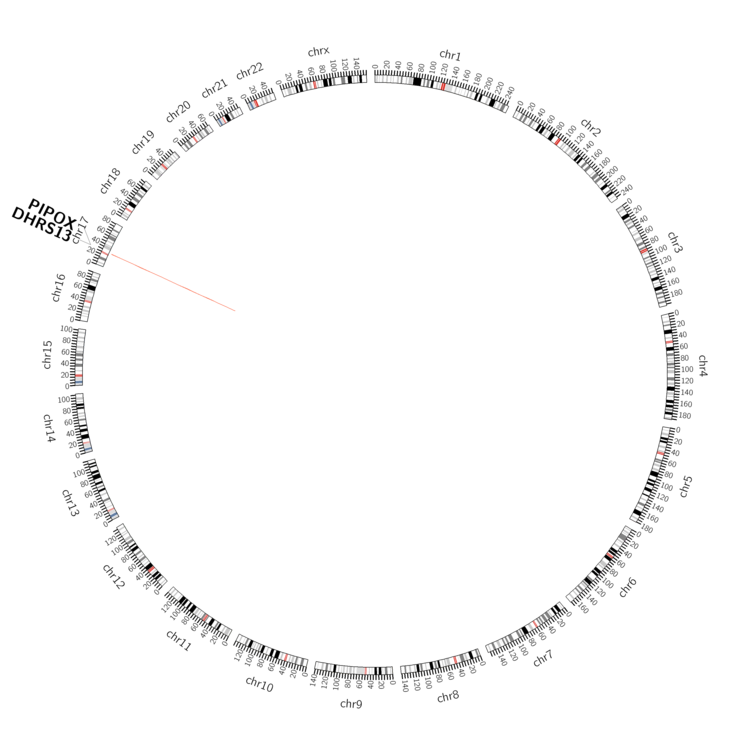 |
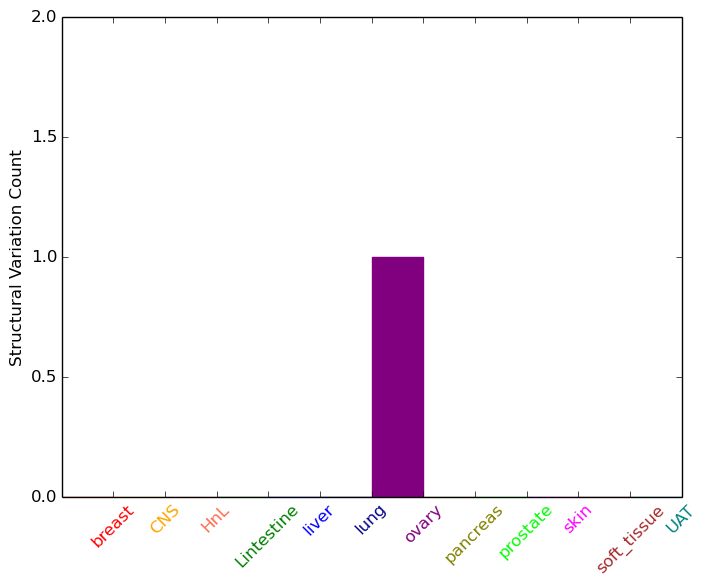
| - For Inter-chromosomal Variations |
| There's no inter-chromosomal structural variation. |
| - For Intra-chromosomal Variations |
| * Intra-chromosomal variantions includes 'intrachromosomal amplicon to amplicon', 'intrachromosomal amplicon to non-amplified dna', 'intrachromosomal deletion', 'intrachromosomal fold-back inversion', 'intrachromosomal inversion', 'intrachromosomal tandem duplication', 'Intrachromosomal unknown type', 'intrachromosomal with inverted orientation', 'intrachromosomal with non-inverted orientation'. |
 |
| Sample | Symbol_a | Chr_a | Start_a | End_a | Symbol_b | Chr_b | Start_b | End_b |
| ovary | PIPOX | chr17 | 27377564 | 27377584 | DHRS13 | chr17 | 27229115 | 27229135 |
| cf) Tissue number; Tissue name (1;Breast, 2;Central_nervous_system, 3;Haematopoietic_and_lymphoid_tissue, 4;Large_intestine, 5;Liver, 6;Lung, 7;Ovary, 8;Pancreas, 9;Prostate, 10;Skin, 11;Soft_tissue, 12;Upper_aerodigestive_tract) |
| * From mRNA Sanger sequences, Chitars2.0 arranged chimeric transcripts. This table shows PIPOX related fusion information. |
| ID | Head Gene | Tail Gene | Accession | Gene_a | qStart_a | qEnd_a | Chromosome_a | tStart_a | tEnd_a | Gene_a | qStart_a | qEnd_a | Chromosome_a | tStart_a | tEnd_a |
| AA704520 | SETD2 | 1 | 241 | 3 | 47139412 | 47139652 | PIPOX | 234 | 526 | 17 | 27382101 | 27383271 | |
| Top |
| Mutation type/ Tissue ID | brca | cns | cerv | endome | haematopo | kidn | Lintest | liver | lung | ns | ovary | pancre | prost | skin | stoma | thyro | urina | |||
| Total # sample | 2 | 1 | ||||||||||||||||||
| GAIN (# sample) | 2 | 1 | ||||||||||||||||||
| LOSS (# sample) |
| cf) Tissue ID; Tissue type (1; Breast, 2; Central_nervous_system, 3; Cervix, 4; Endometrium, 5; Haematopoietic_and_lymphoid_tissue, 6; Kidney, 7; Large_intestine, 8; Liver, 9; Lung, 10; NS, 11; Ovary, 12; Pancreas, 13; Prostate, 14; Skin, 15; Stomach, 16; Thyroid, 17; Urinary_tract) |
| Top |
|
 |
| Top |
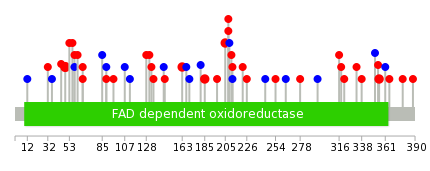
| Stat. for Non-Synonymous SNVs (# total SNVs=29) | (# total SNVs=8) |
 |  |
(# total SNVs=0) | (# total SNVs=0) |
| Top |
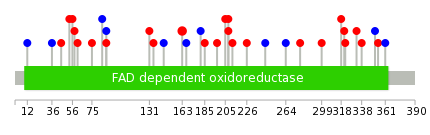
| * When you move the cursor on each content, you can see more deailed mutation information on the Tooltip. Those are primary_site,primary_histology,mutation(aa),pubmedID. |
| GRCh37 position | Mutation(aa) | Unique sampleID count |
| chr17:27371908-27371908 | p.H49L | 3 |
| chr17:27380567-27380567 | p.W205S | 2 |
| chr17:27383213-27383213 | p.P355S | 2 |
| chr17:27380440-27380440 | p.R163* | 2 |
| chr17:27379941-27379941 | p.Q89Q | 2 |
| chr17:27380441-27380441 | p.R163Q | 2 |
| chr17:27380507-27380507 | p.T185M | 2 |
| chr17:27370279-27370279 | p.V12V | 1 |
| chr17:27371958-27371958 | p.R66W | 1 |
| chr17:27381694-27381694 | p.Y264Y | 1 |
| Top |
|
 |
| Point Mutation/ Tissue ID | 1 | 2 | 3 | 4 | 5 | 6 | 7 | 8 | 9 | 10 | 11 | 12 | 13 | 14 | 15 | 16 | 17 | 18 | 19 | 20 |
| # sample | 3 | 1 | 8 | 1 | 1 | 1 | 2 | 1 | 5 | 4 | 8 | |||||||||
| # mutation | 3 | 1 | 8 | 1 | 1 | 1 | 2 | 1 | 6 | 4 | 8 | |||||||||
| nonsynonymous SNV | 1 | 1 | 7 | 1 | 1 | 1 | 2 | 1 | 3 | 4 | 3 | |||||||||
| synonymous SNV | 2 | 1 | 3 | 5 |
| cf) Tissue ID; Tissue type (1; BLCA[Bladder Urothelial Carcinoma], 2; BRCA[Breast invasive carcinoma], 3; CESC[Cervical squamous cell carcinoma and endocervical adenocarcinoma], 4; COAD[Colon adenocarcinoma], 5; GBM[Glioblastoma multiforme], 6; Glioma Low Grade, 7; HNSC[Head and Neck squamous cell carcinoma], 8; KICH[Kidney Chromophobe], 9; KIRC[Kidney renal clear cell carcinoma], 10; KIRP[Kidney renal papillary cell carcinoma], 11; LAML[Acute Myeloid Leukemia], 12; LUAD[Lung adenocarcinoma], 13; LUSC[Lung squamous cell carcinoma], 14; OV[Ovarian serous cystadenocarcinoma ], 15; PAAD[Pancreatic adenocarcinoma], 16; PRAD[Prostate adenocarcinoma], 17; SKCM[Skin Cutaneous Melanoma], 18:STAD[Stomach adenocarcinoma], 19:THCA[Thyroid carcinoma], 20:UCEC[Uterine Corpus Endometrial Carcinoma]) |
| Top |
| * We represented just top 10 SNVs. When you move the cursor on each content, you can see more deailed mutation information on the Tooltip. Those are primary_site, primary_histology, mutation(aa), pubmedID. |
| Genomic Position | Mutation(aa) | Unique sampleID count |
| chr17:27380441 | p.Q89Q | 2 |
| chr17:27379941 | p.R163Q | 2 |
| chr17:27380577 | p.L36L | 1 |
| chr17:27382876 | p.S197N | 1 |
| chr17:27380065 | p.A354V | 1 |
| chr17:27380587 | p.R45Q | 1 |
| chr17:27370279 | p.W205S | 1 |
| chr17:27383203 | p.L361L | 1 |
| chr17:27380077 | p.R53Q | 1 |
| chr17:27381578 | p.Q208R | 1 |
| * Copy number data were extracted from TCGA using R package TCGA-Assembler. The URLs of all public data files on TCGA DCC data server were gathered on Jan-05-2015. Function ProcessCNAData in TCGA-Assembler package was used to obtain gene-level copy number value which is calculated as the average copy number of the genomic region of a gene. |
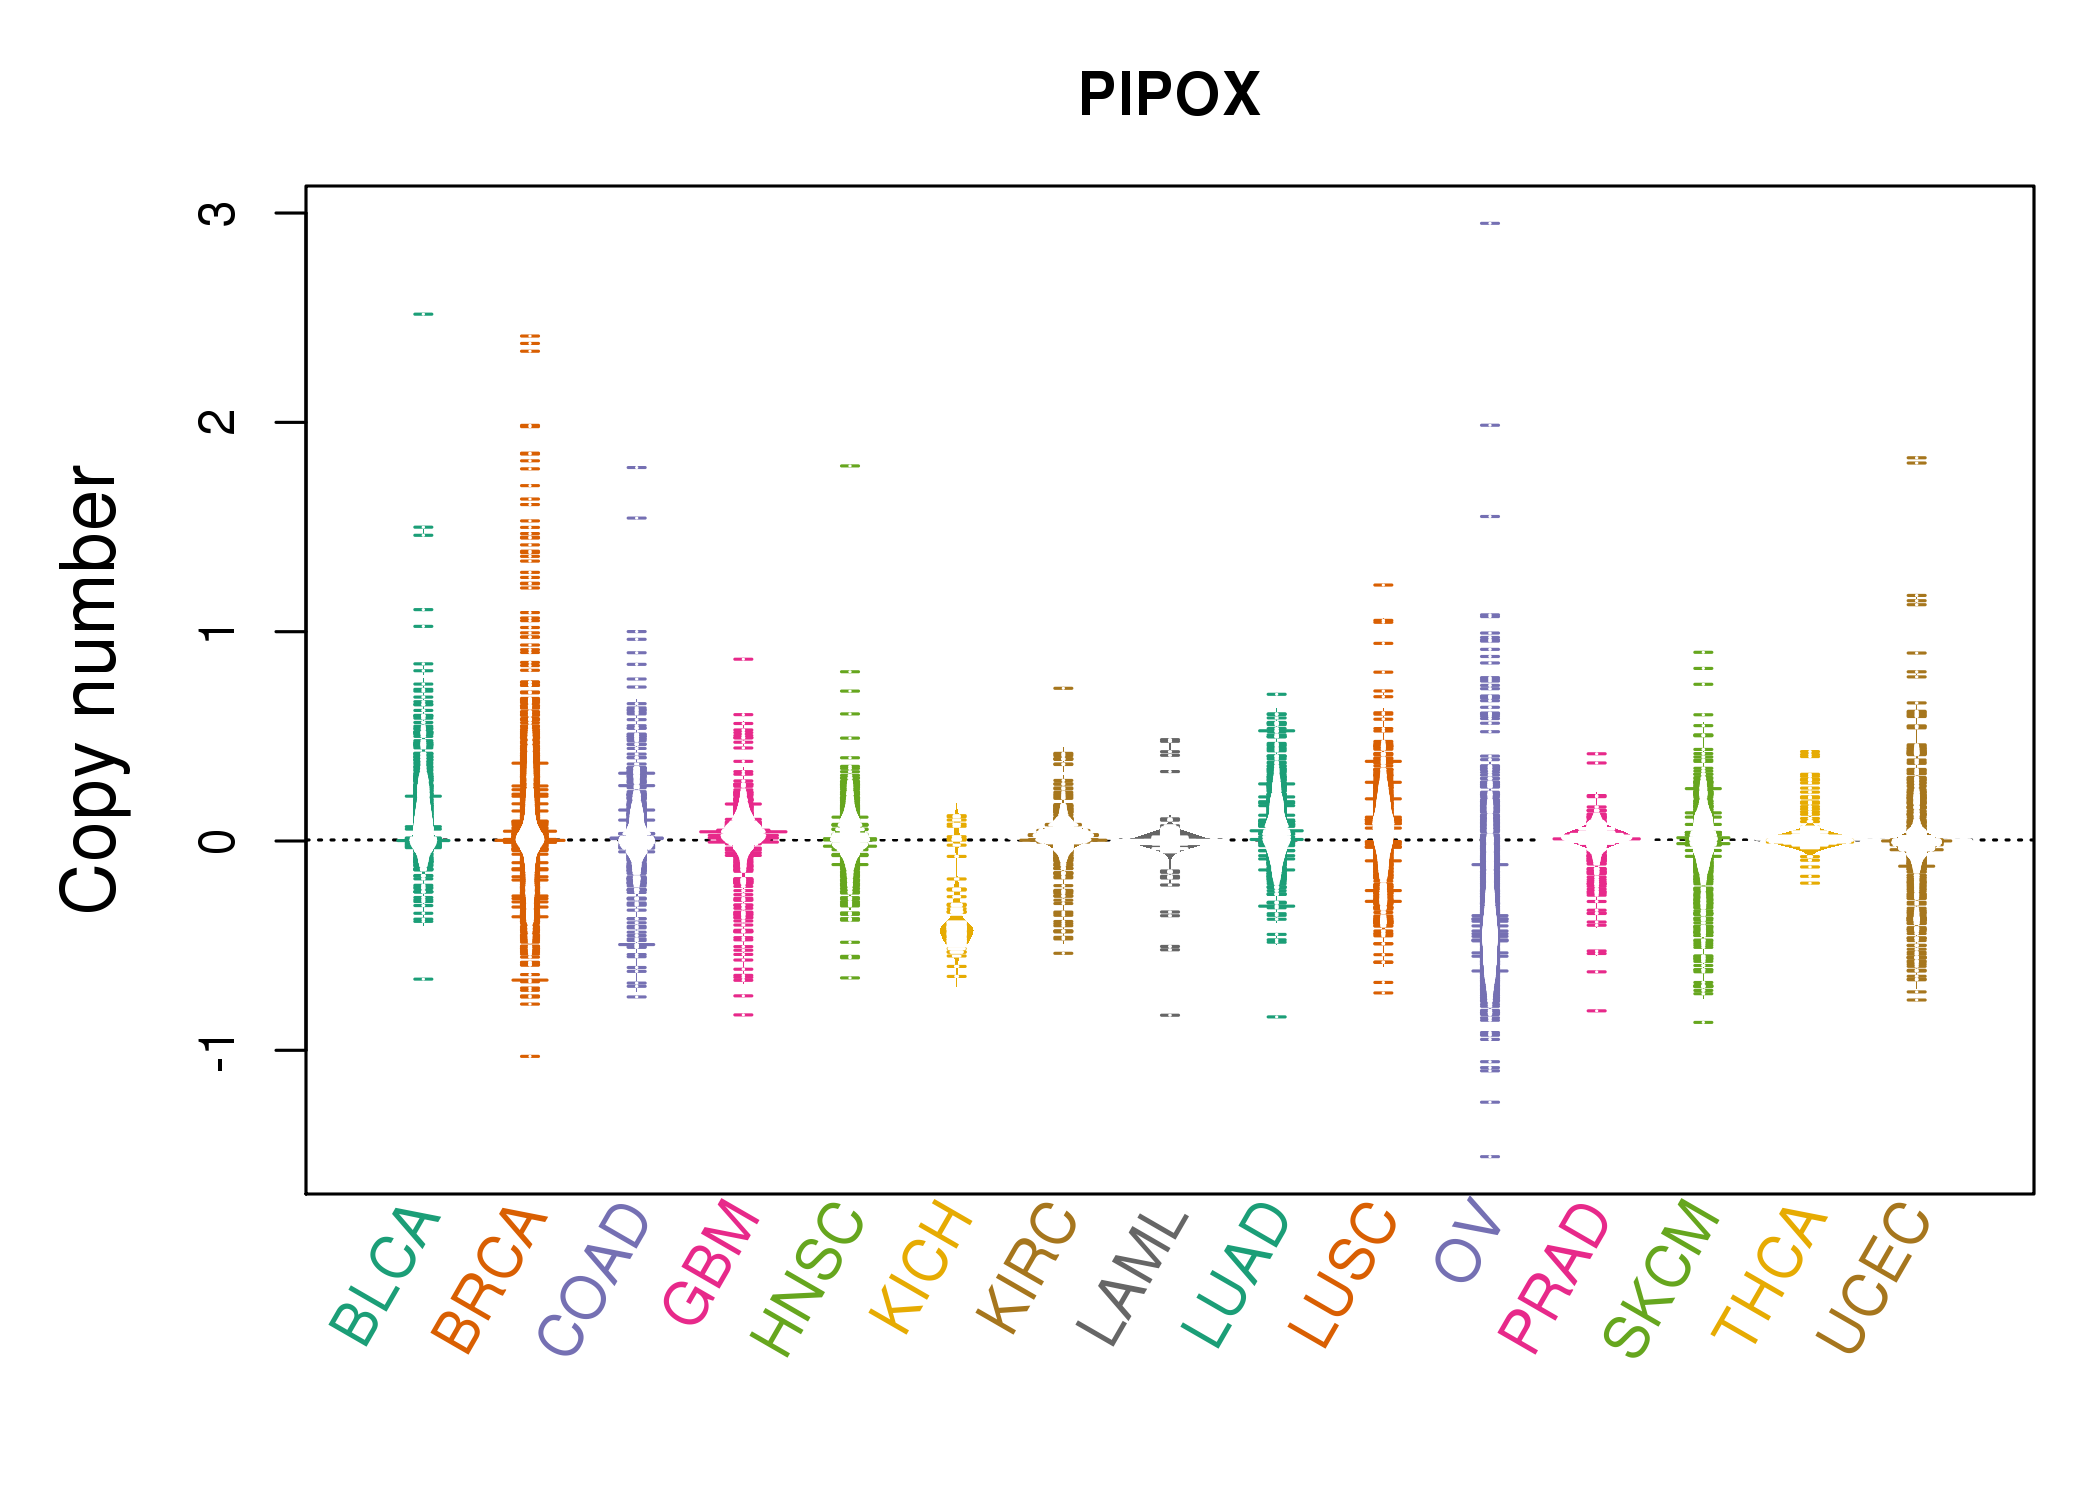 |
| cf) Tissue ID[Tissue type]: BLCA[Bladder Urothelial Carcinoma], BRCA[Breast invasive carcinoma], CESC[Cervical squamous cell carcinoma and endocervical adenocarcinoma], COAD[Colon adenocarcinoma], GBM[Glioblastoma multiforme], Glioma Low Grade, HNSC[Head and Neck squamous cell carcinoma], KICH[Kidney Chromophobe], KIRC[Kidney renal clear cell carcinoma], KIRP[Kidney renal papillary cell carcinoma], LAML[Acute Myeloid Leukemia], LUAD[Lung adenocarcinoma], LUSC[Lung squamous cell carcinoma], OV[Ovarian serous cystadenocarcinoma ], PAAD[Pancreatic adenocarcinoma], PRAD[Prostate adenocarcinoma], SKCM[Skin Cutaneous Melanoma], STAD[Stomach adenocarcinoma], THCA[Thyroid carcinoma], UCEC[Uterine Corpus Endometrial Carcinoma] |
| Top |
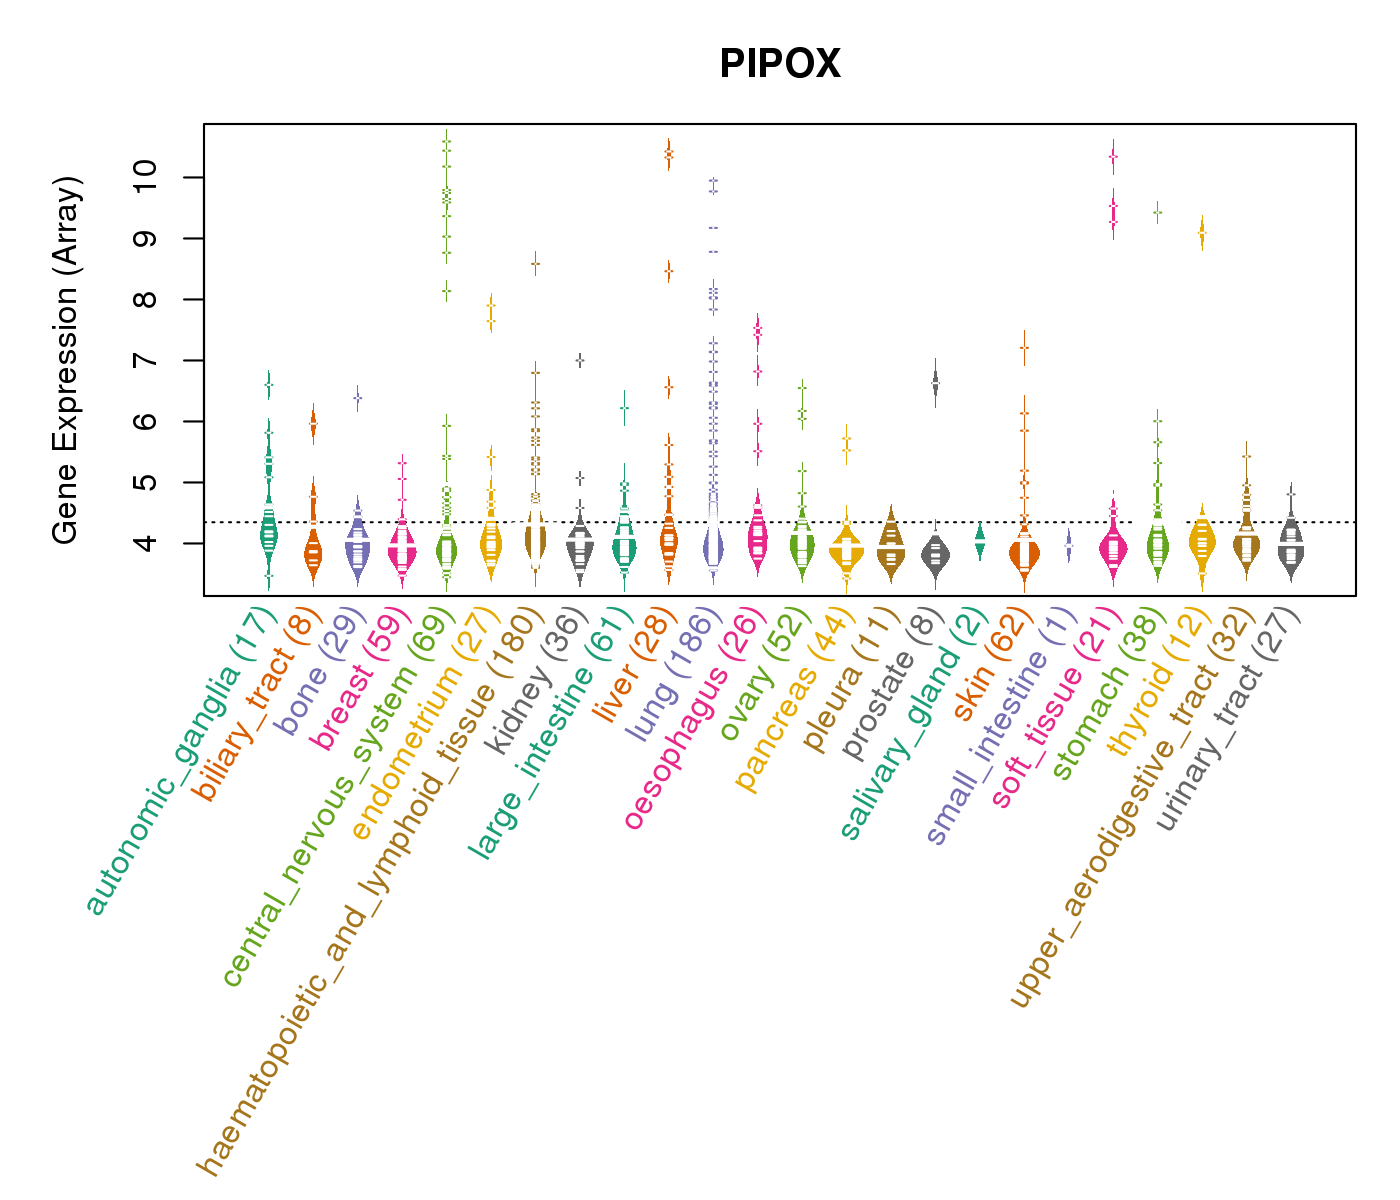
| Gene Expression for PIPOX |
| * CCLE gene expression data were extracted from CCLE_Expression_Entrez_2012-10-18.res: Gene-centric RMA-normalized mRNA expression data. |
 |
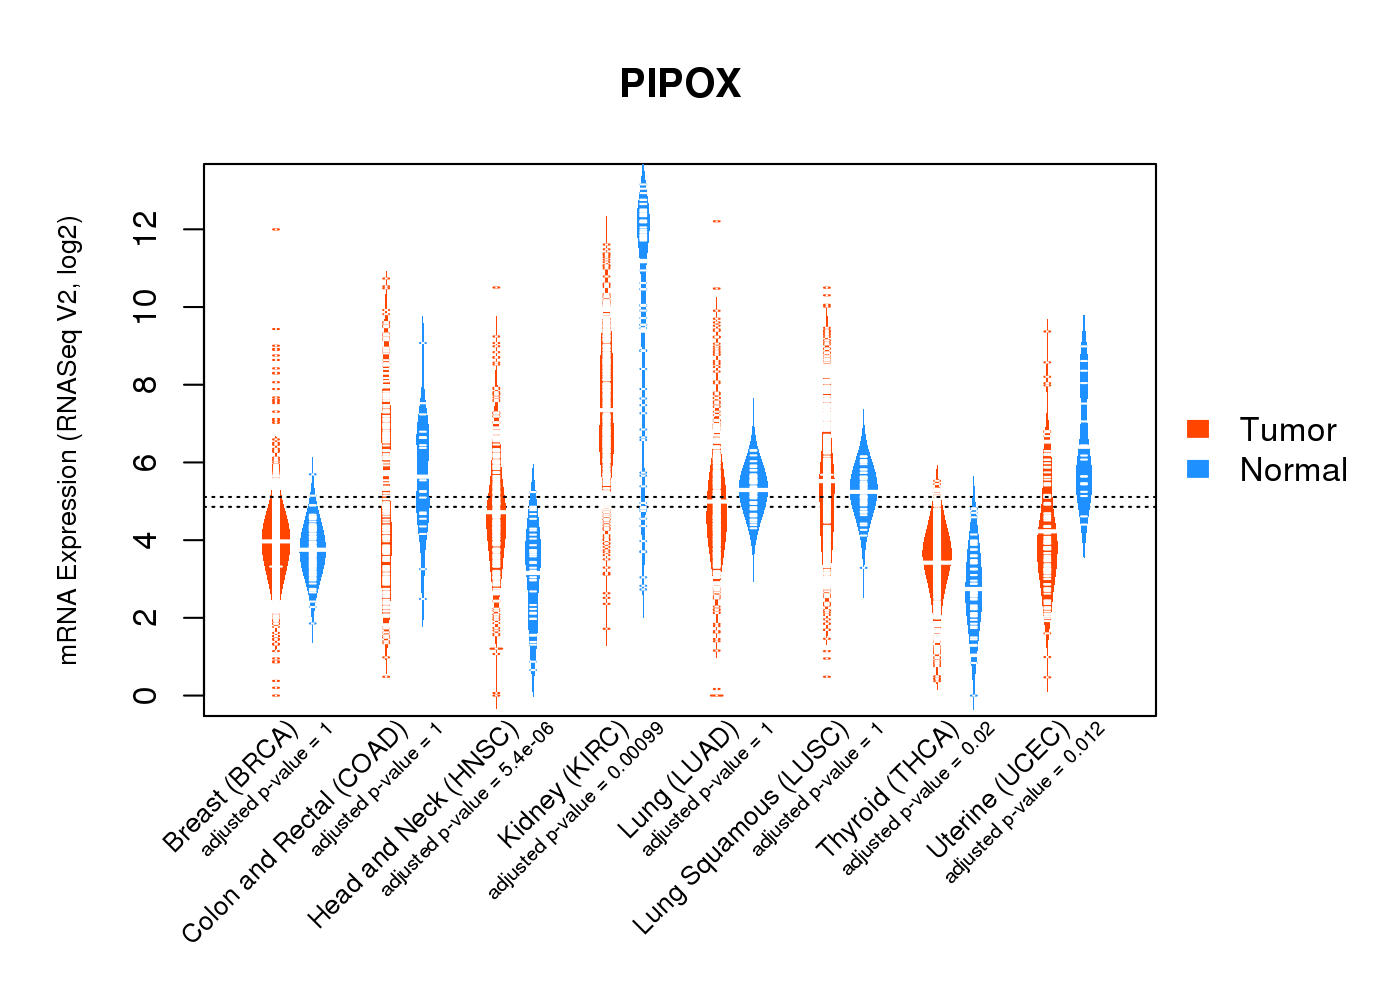
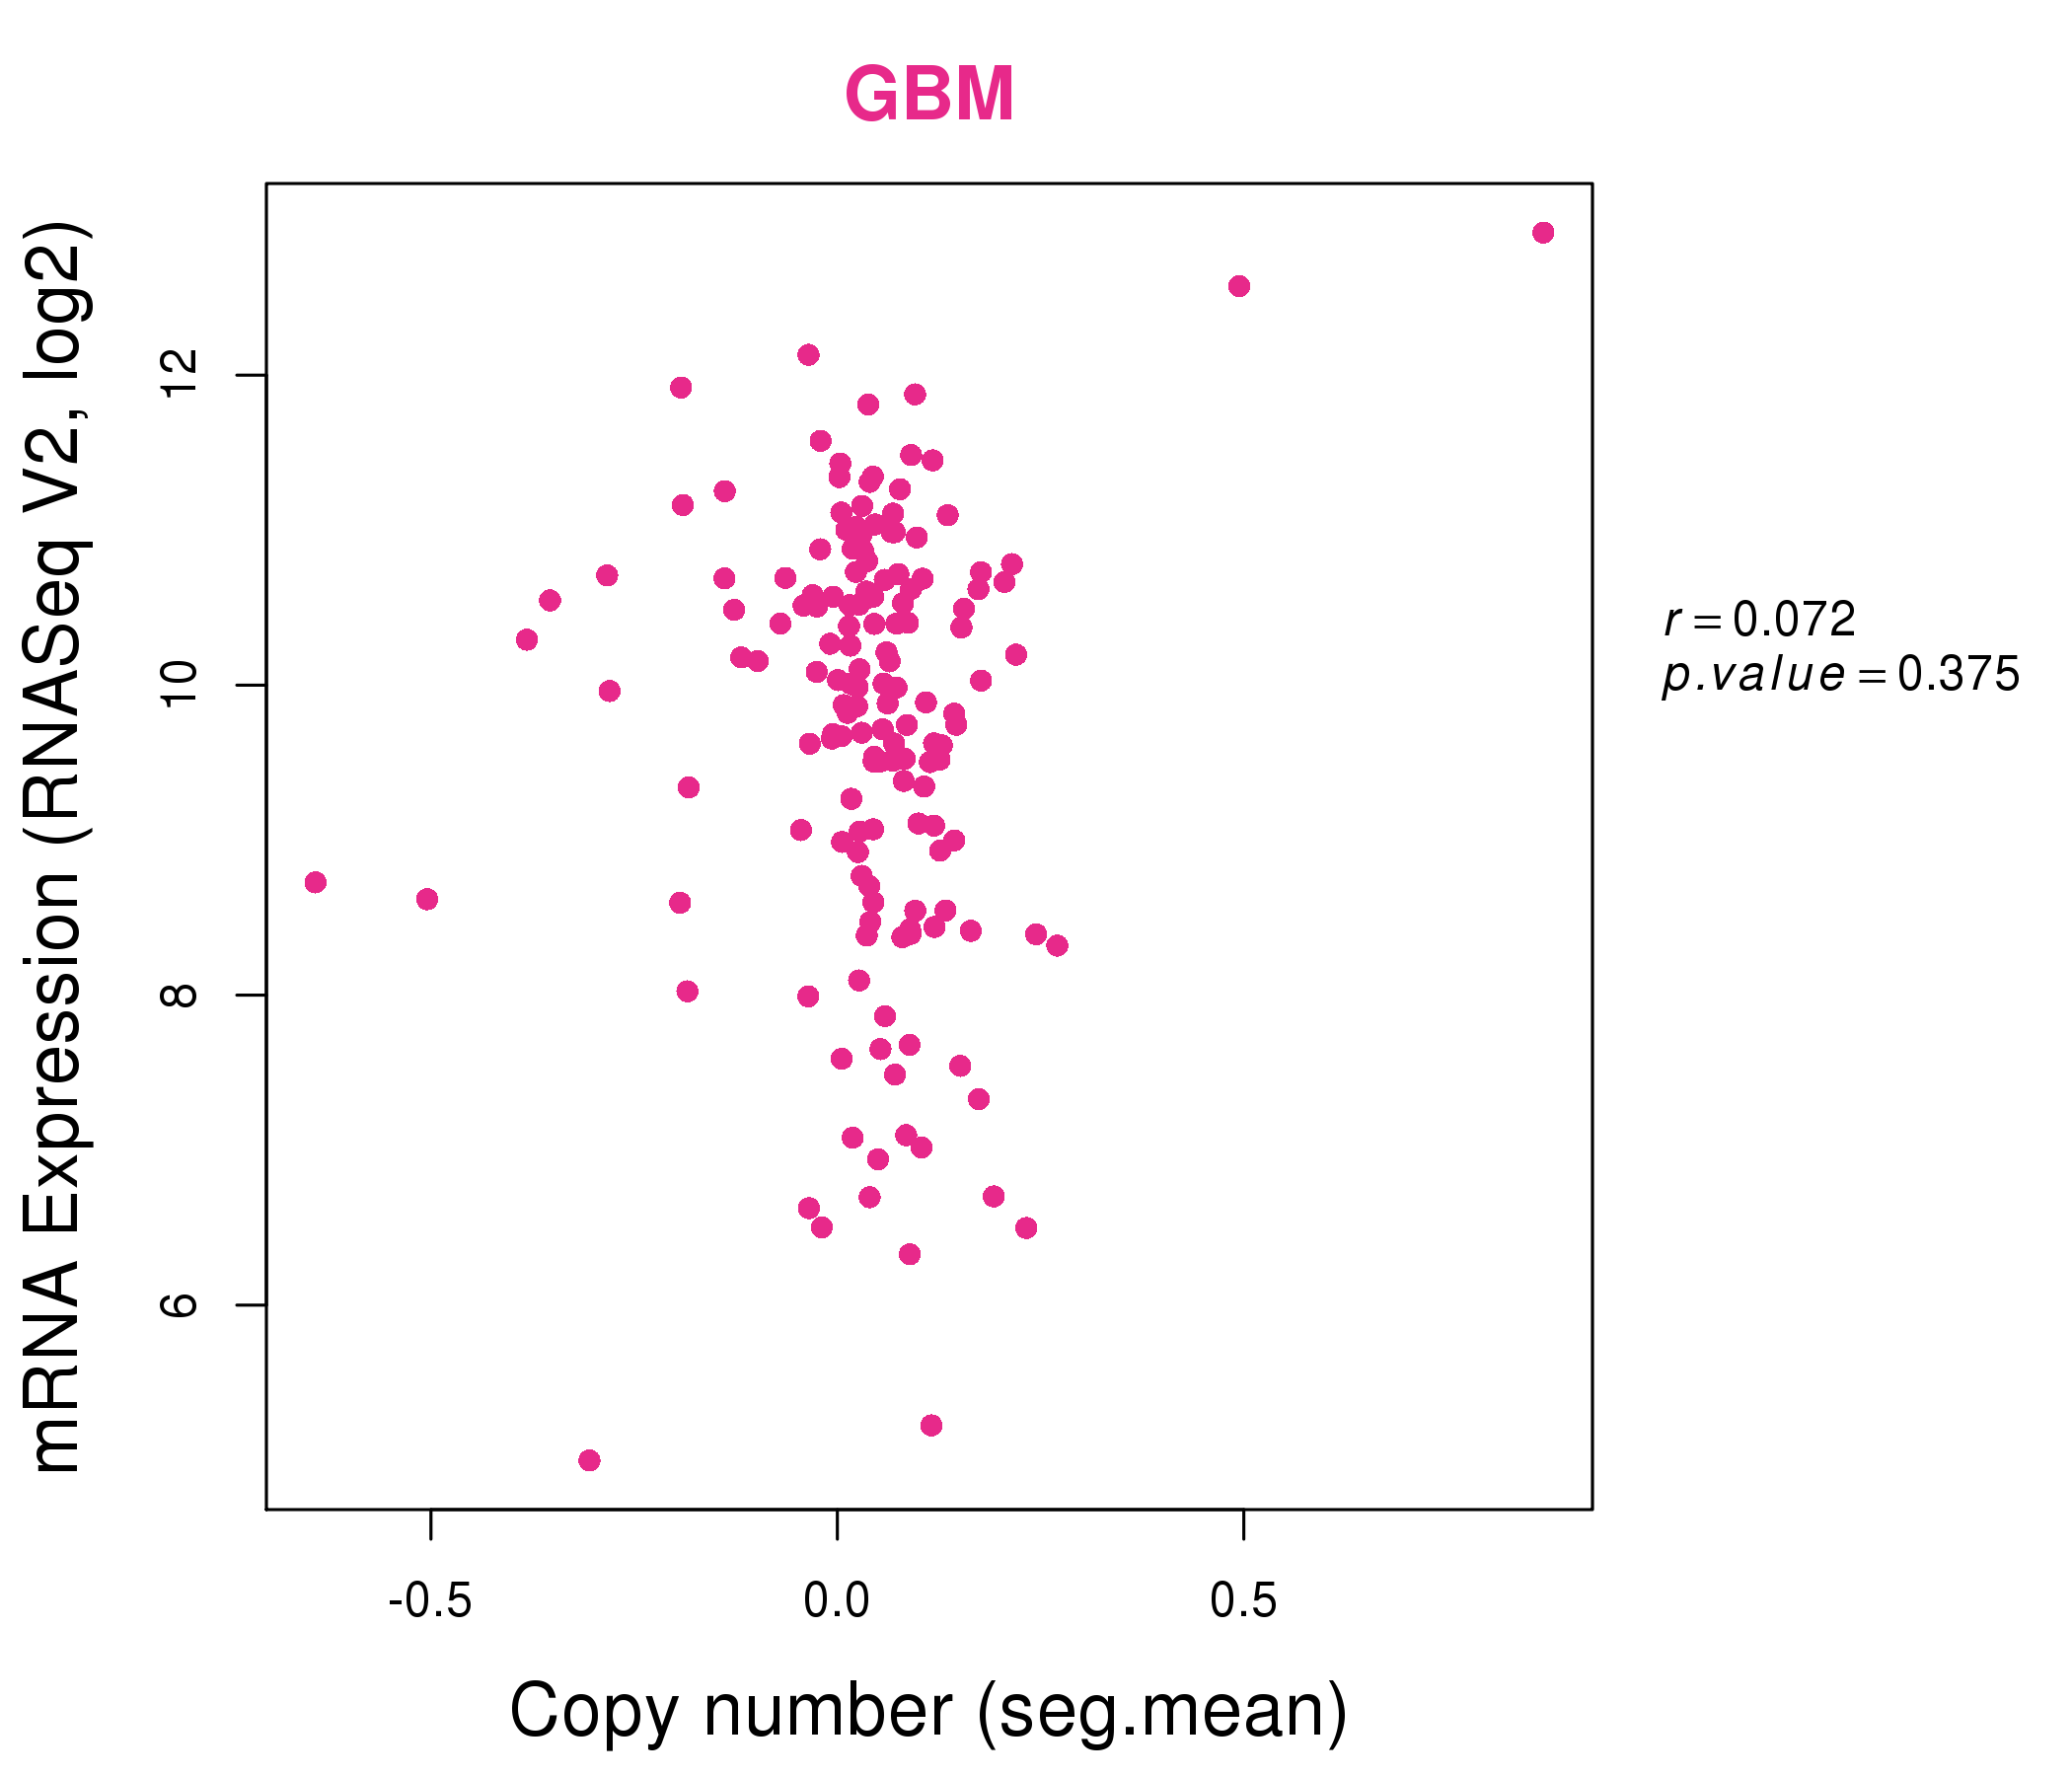
| * Normalized gene expression data of RNASeqV2 was extracted from TCGA using R package TCGA-Assembler. The URLs of all public data files on TCGA DCC data server were gathered at Jan-05-2015. Only eight cancer types have enough normal control samples for differential expression analysis. (t test, adjusted p<0.05 (using Benjamini-Hochberg FDR)) |
 |
| Top |
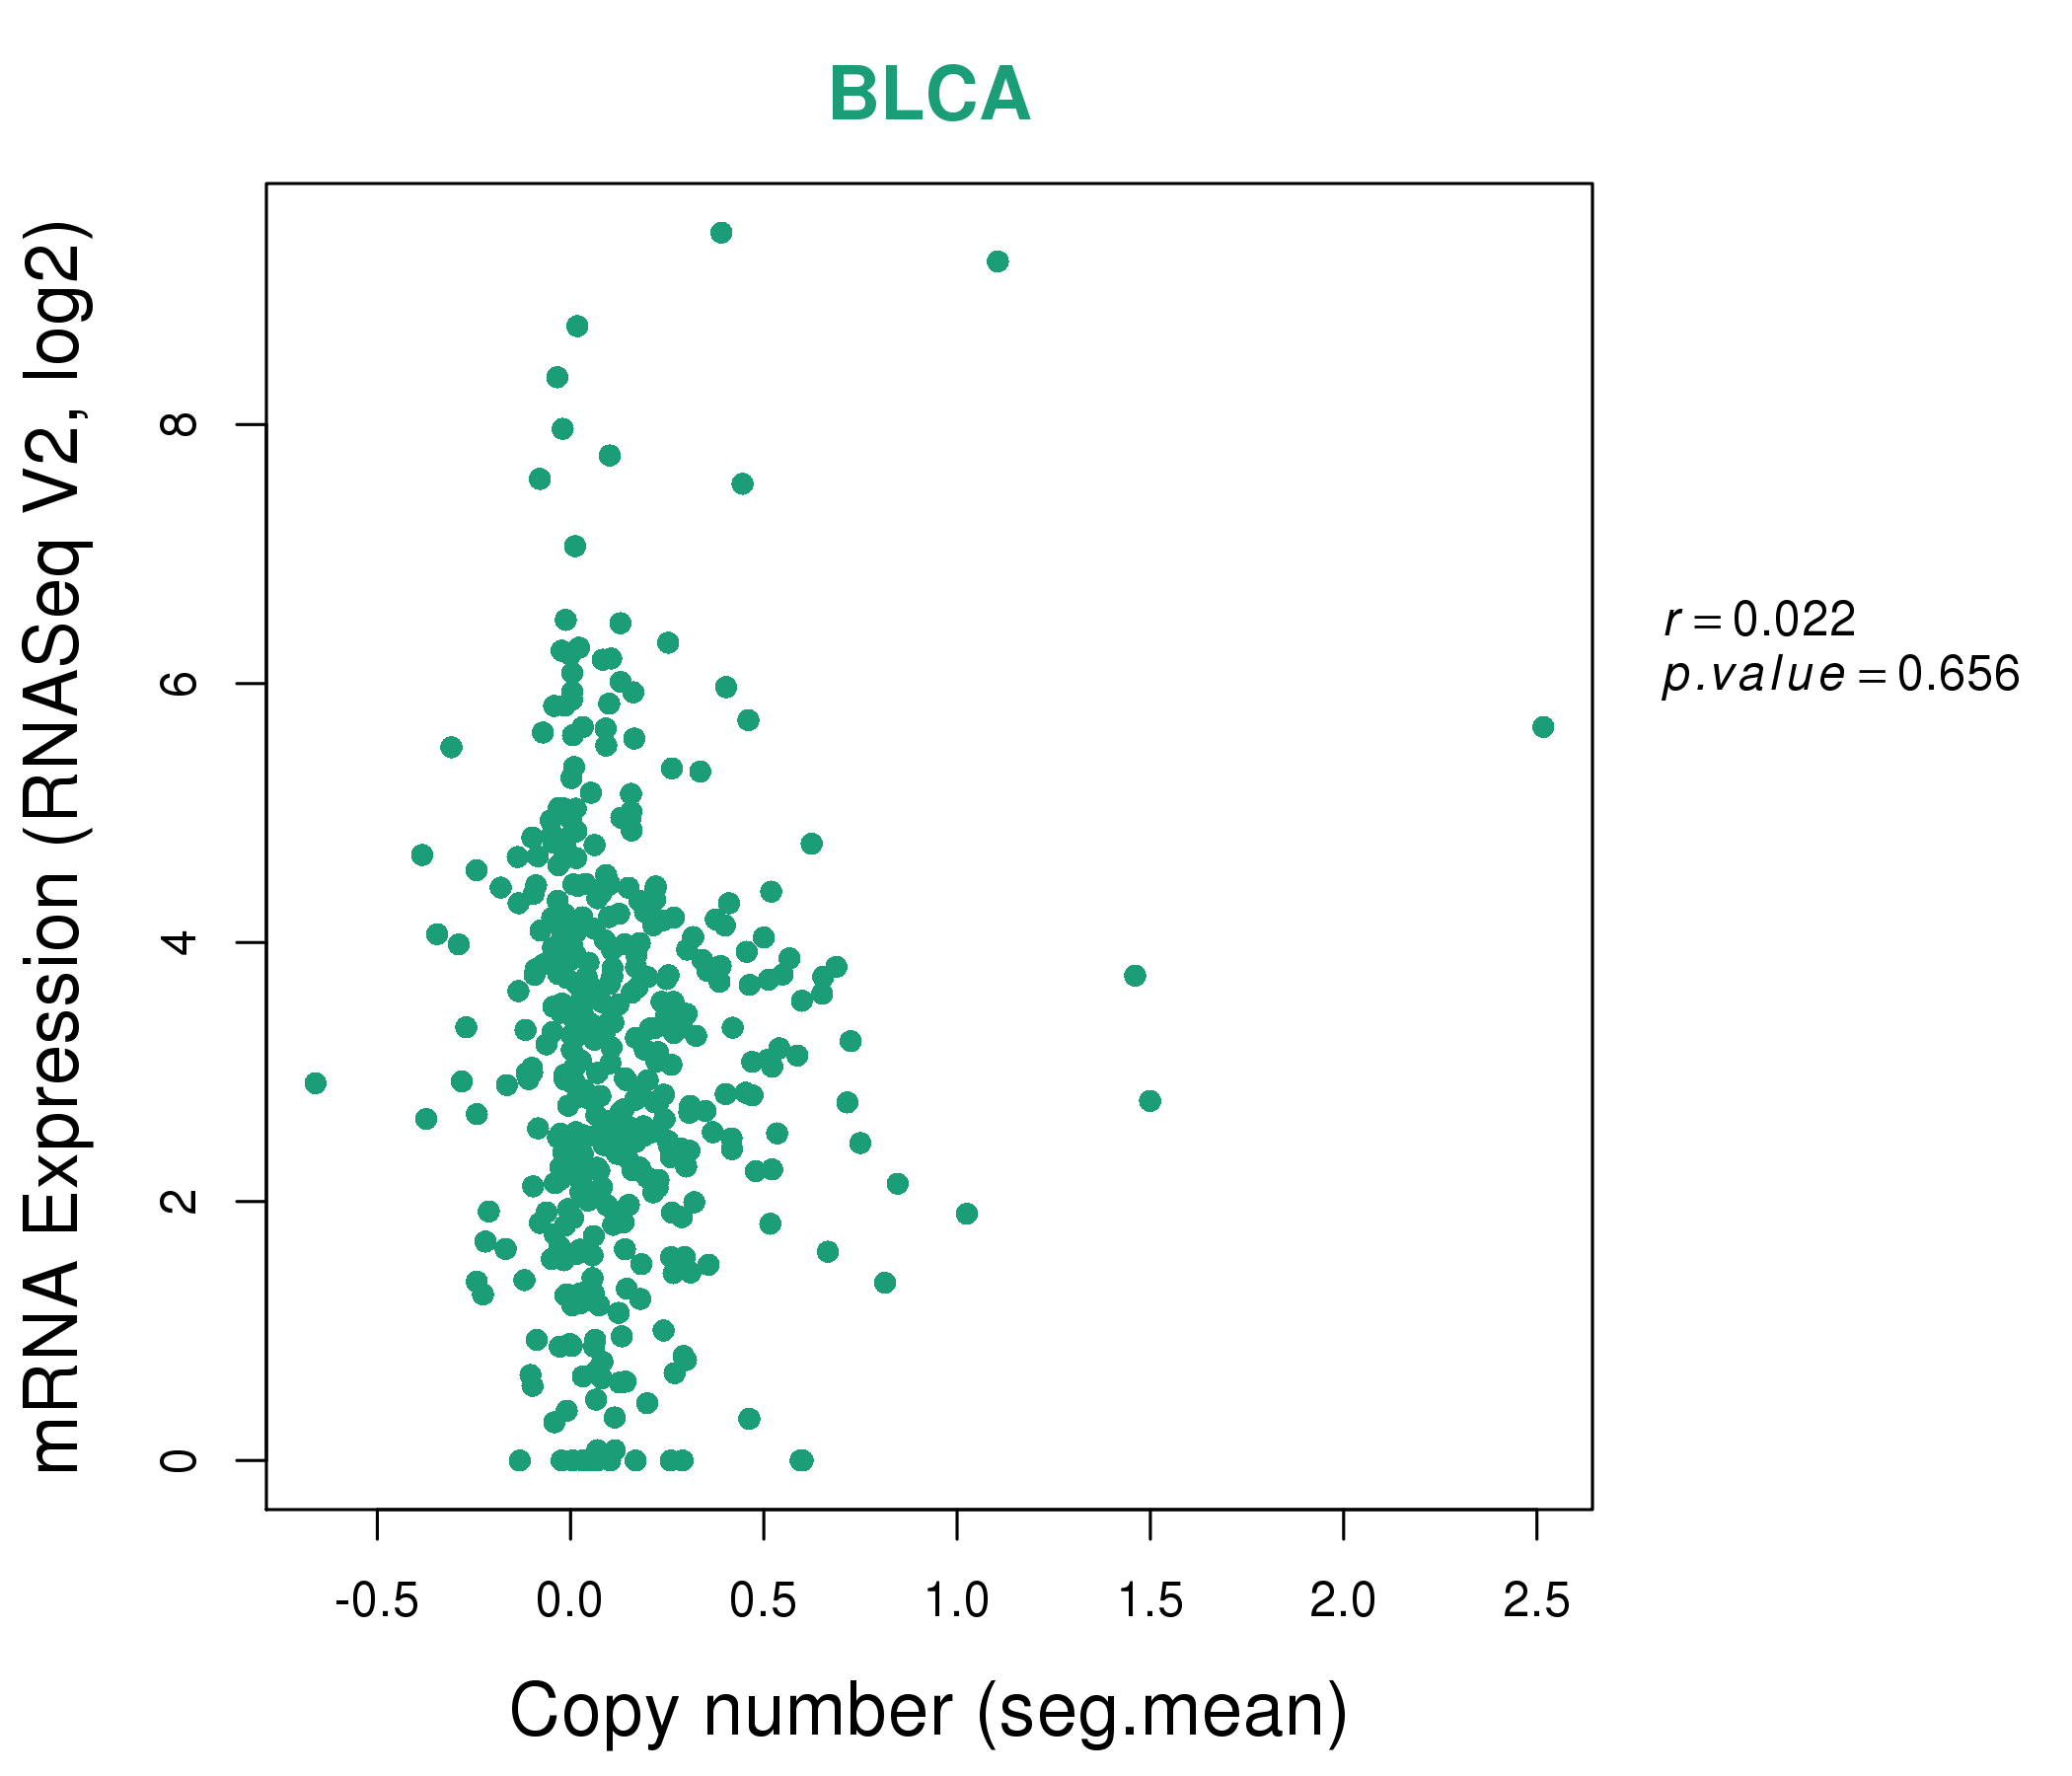
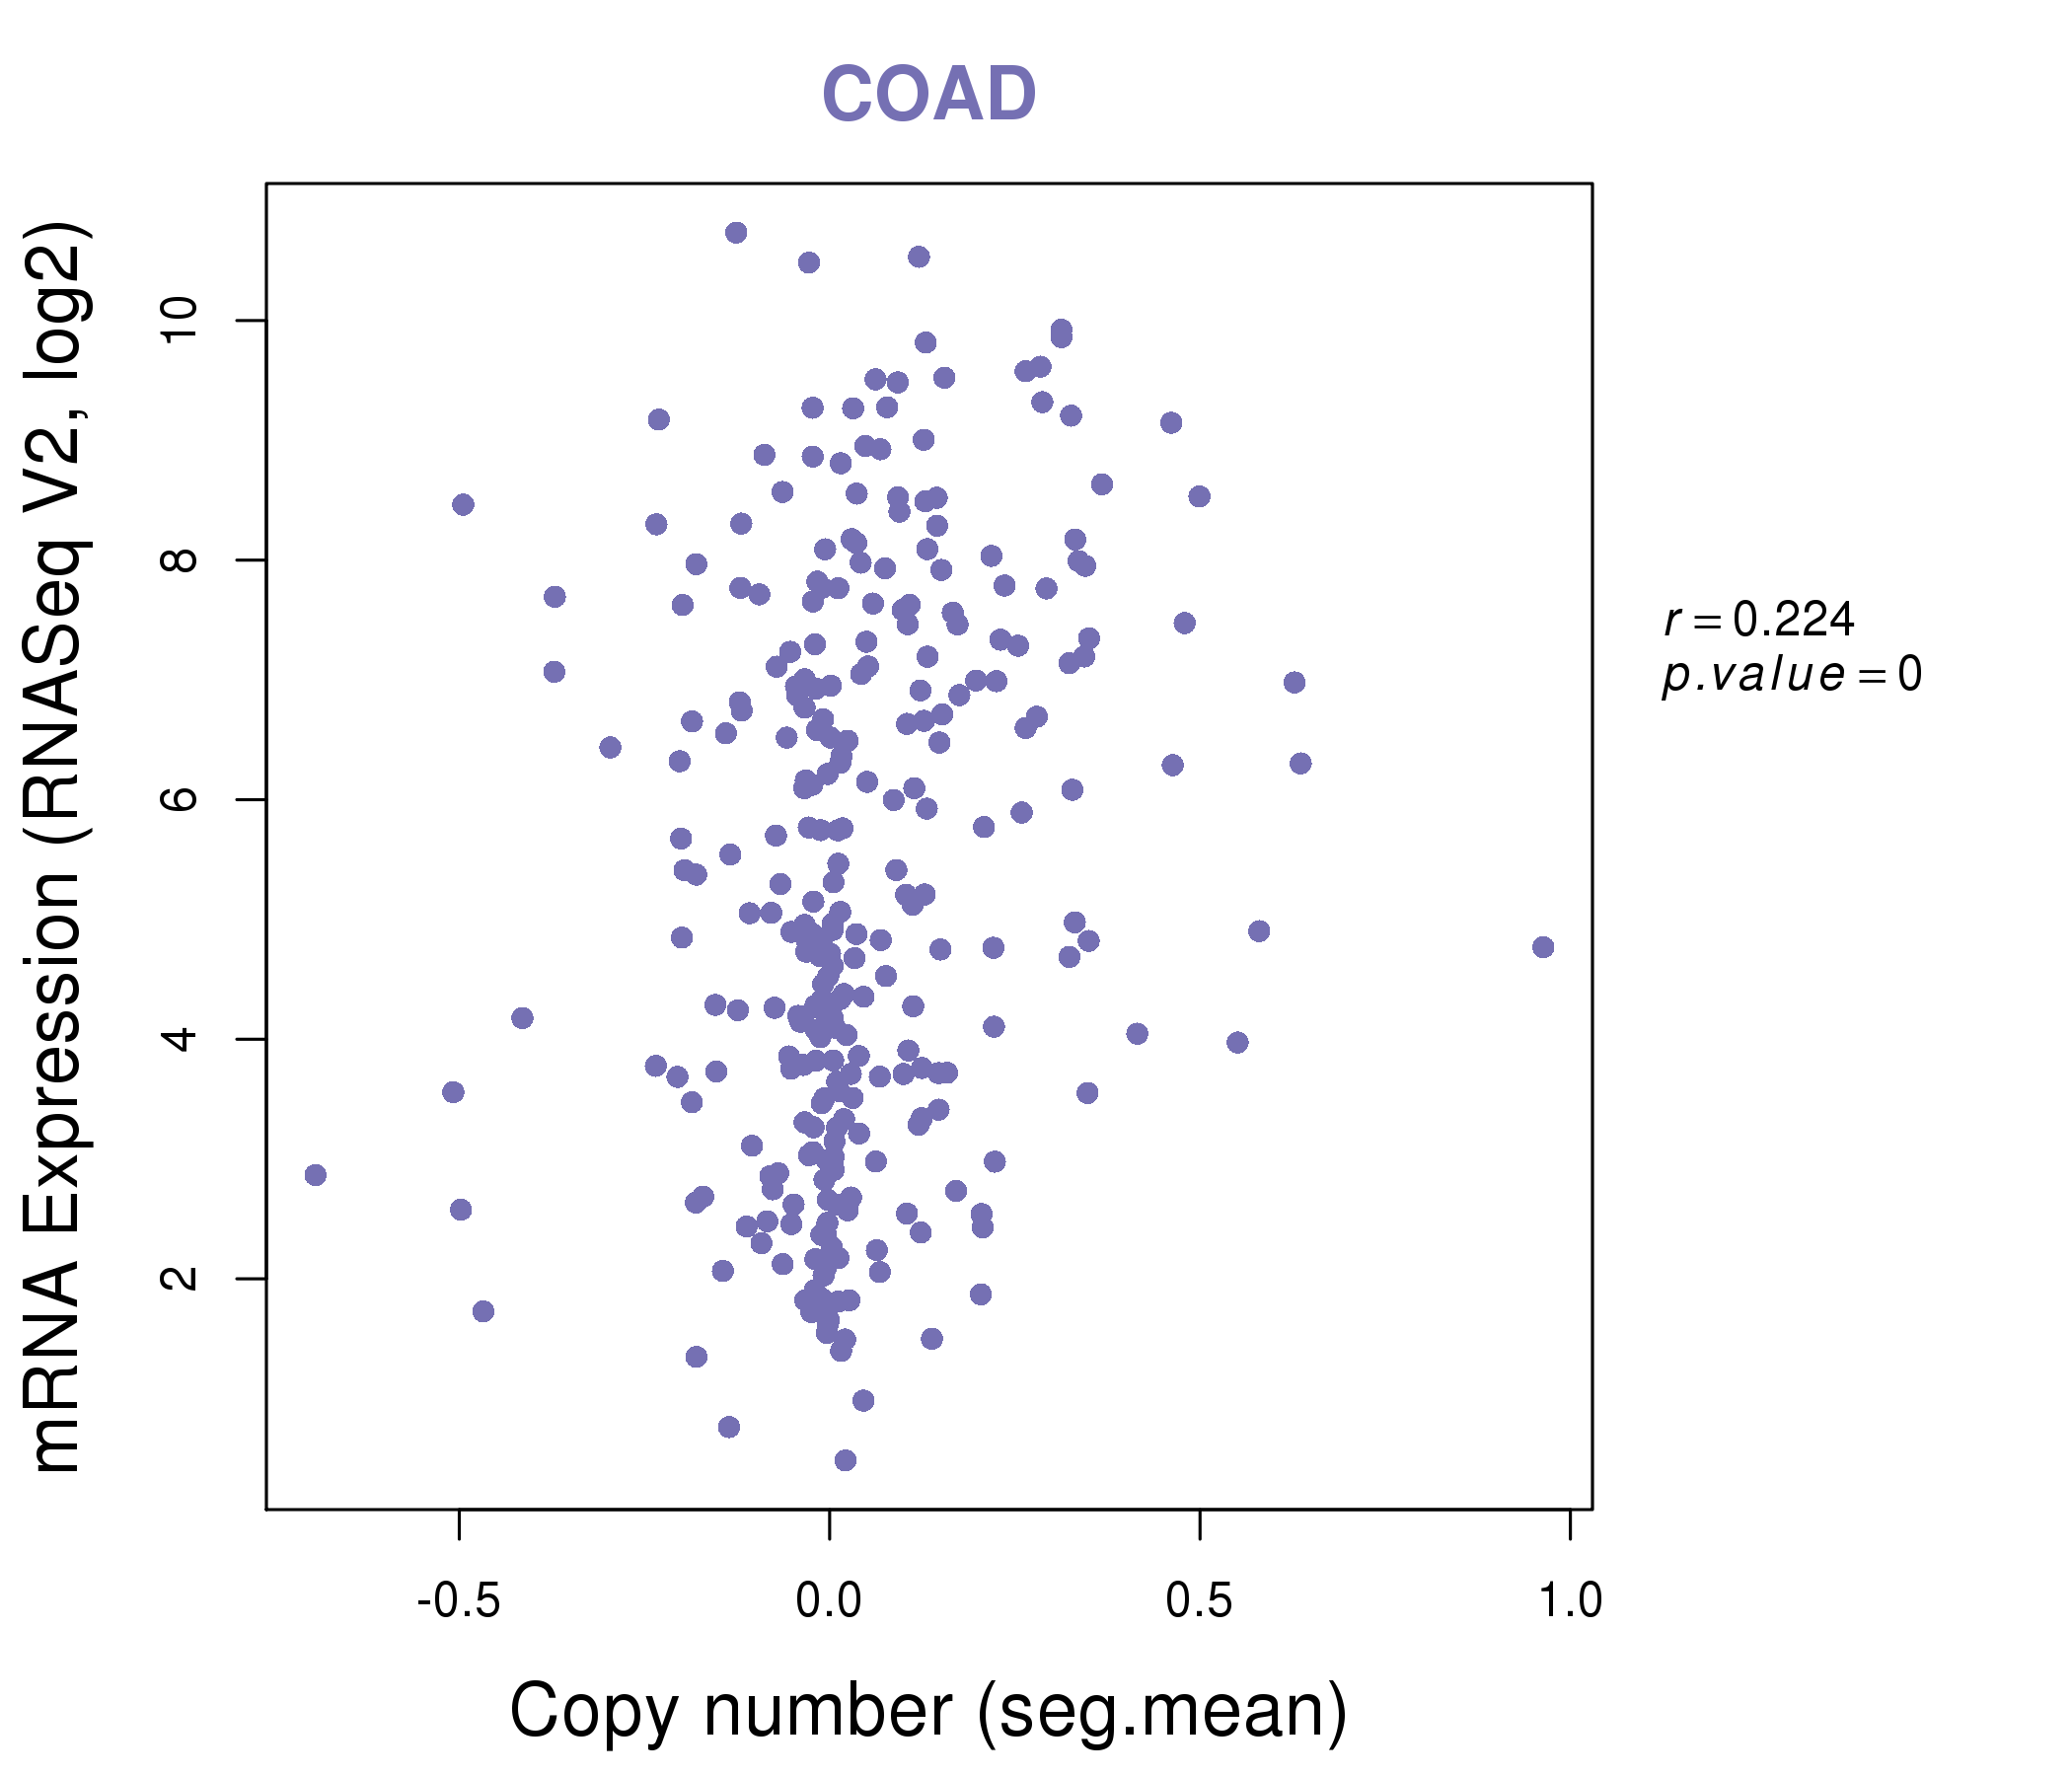
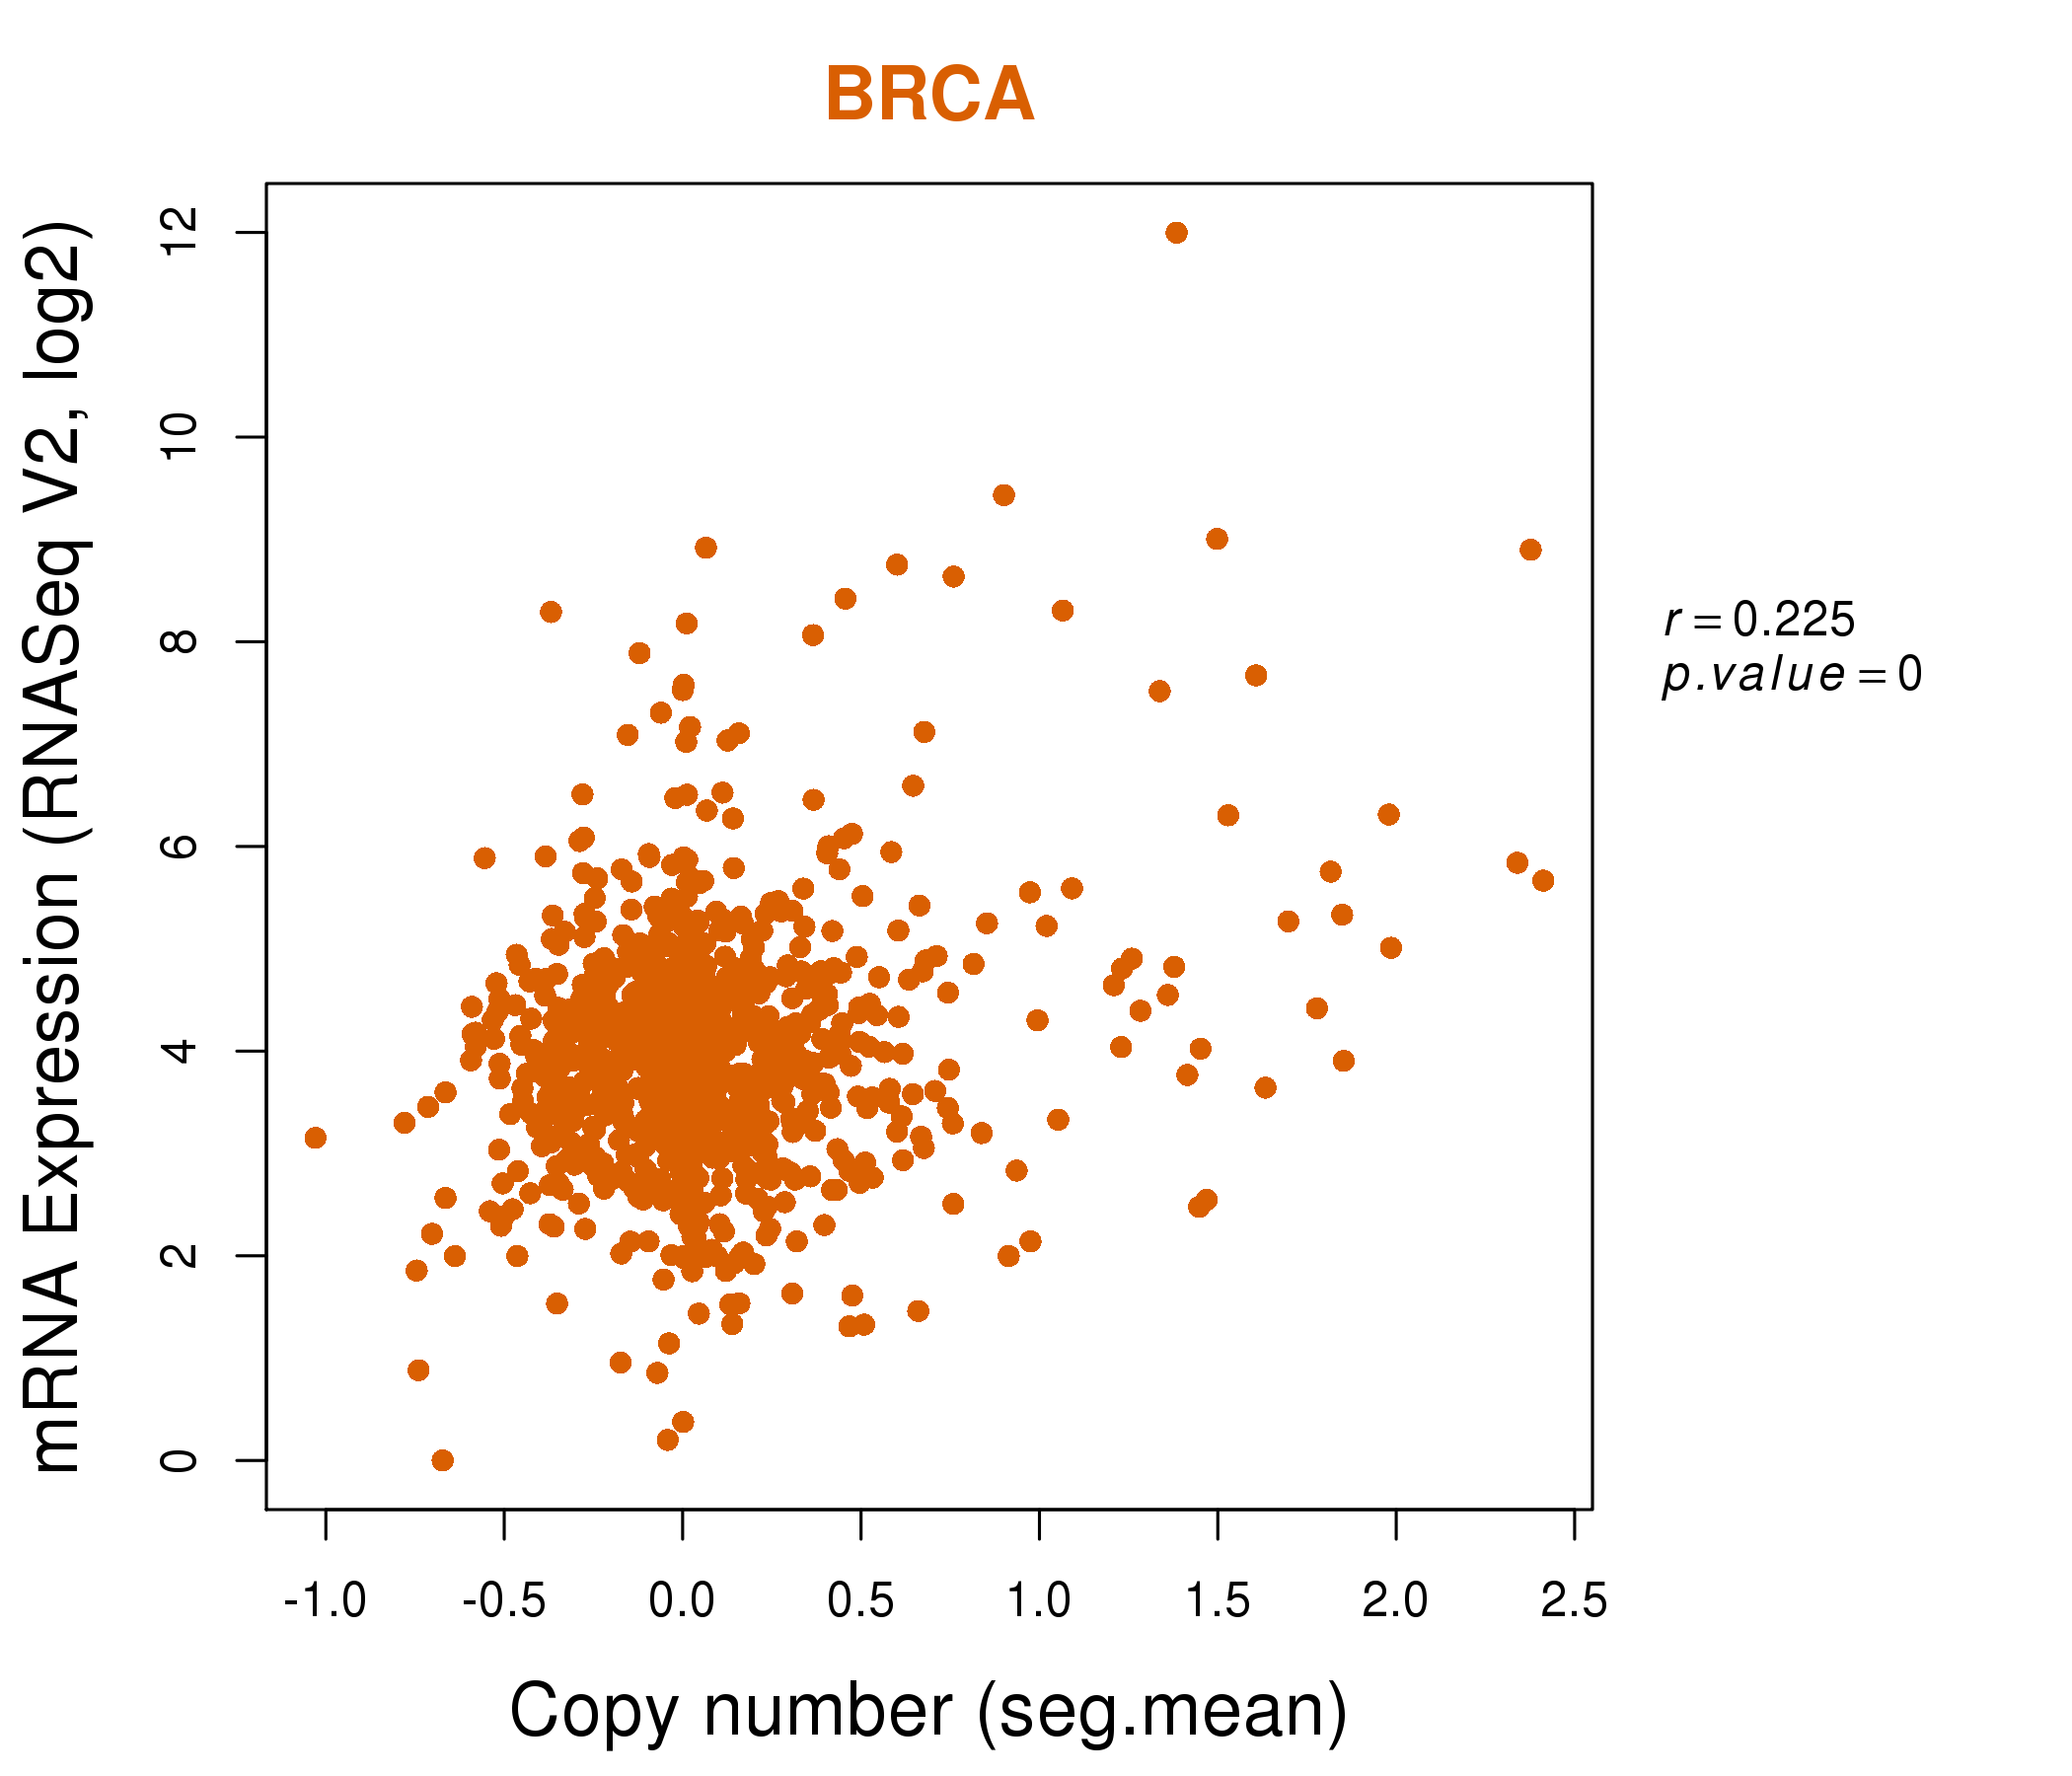
| * This plots show the correlation between CNV and gene expression. |
: Open all plots for all cancer types
 |
|
 |
|
| Top |
| Gene-Gene Network Information |
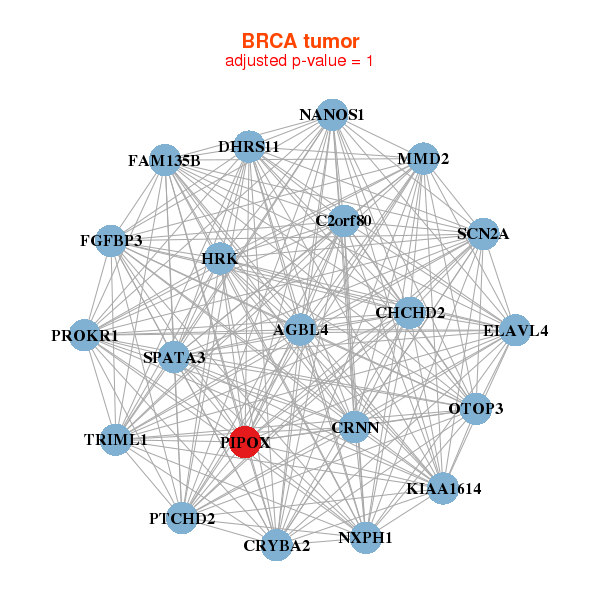
| * Co-Expression network figures were drawn using R package igraph. Only the top 20 genes with the highest correlations were shown. Red circle: input gene, orange circle: cell metabolism gene, sky circle: other gene |
: Open all plots for all cancer types
 |
| ||||
| AGBL4,C2orf80,CHCHD2,CRNN,CRYBA2,DHRS11,ELAVL4, FAM135B,FGFBP3,HRK,KIAA1614,MMD2,NANOS1,NXPH1, OTOP3,PIPOX,PROKR1,PTCHD2,SCN2A,SPATA3,TRIML1 | ARHGAP30,BTK,SCIMP,DOK3,FERMT3,FGD2,GPSM3, HLA-DMB,IL18,IRF5,KCNAB2,LGALS9,LILRB1,MYO1F, PARVG,PIK3R6,PIPOX,PLCB2,SASH3,SLAMF8,WAS | ||||
 |
| ||||
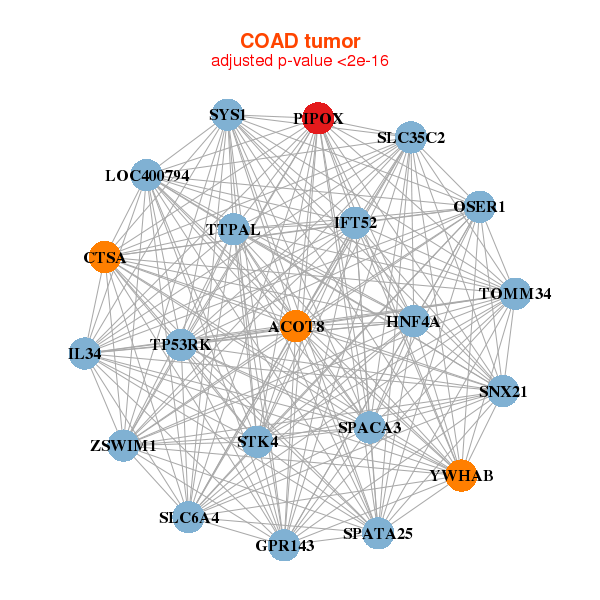
| ACOT8,OSER1,SPATA25,CTSA,GPR143,HNF4A,IFT52, IL34,LOC400794,PIPOX,SLC35C2,SLC6A4,SNX21,SPACA3, STK4,SYS1,TOMM34,TP53RK,TTPAL,YWHAB,ZSWIM1 | C3orf18,CAMK2G,CASQ2,CSRP1,ILK,KCNMB1,KCTD8, LGALS1,LMO3,MYL9,MYLK,PDLIM3,PDLIM7,PIPOX, PNCK,TAGLN,TMEM35,TPM1,TPM2,TSPAN2,TUBA1A |
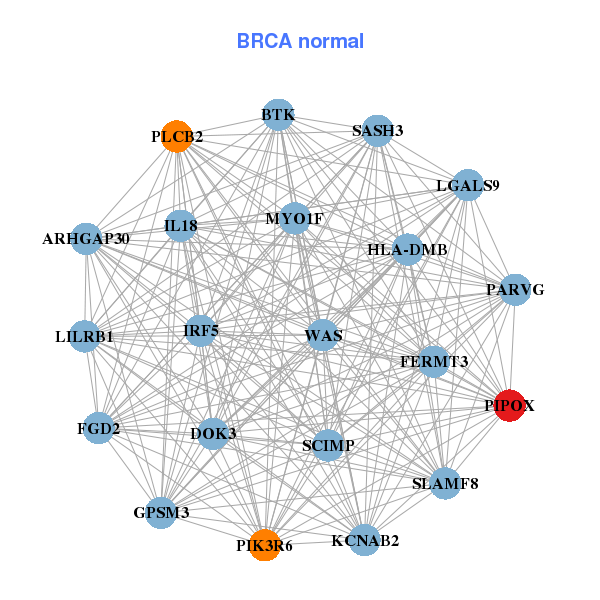
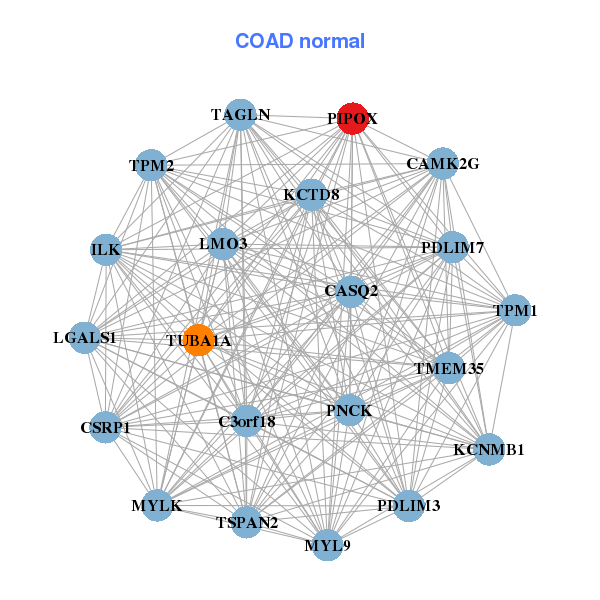
| * Co-Expression network figures were drawn using R package igraph. Only the top 20 genes with the highest correlations were shown. Red circle: input gene, orange circle: cell metabolism gene, sky circle: other gene |
: Open all plots for all cancer types
| Top |
: Open all interacting genes' information including KEGG pathway for all interacting genes from DAVID
| Top |
| Pharmacological Information for PIPOX |
| DB Category | DB Name | DB's ID and Url link |
| * Gene Centered Interaction Network. |
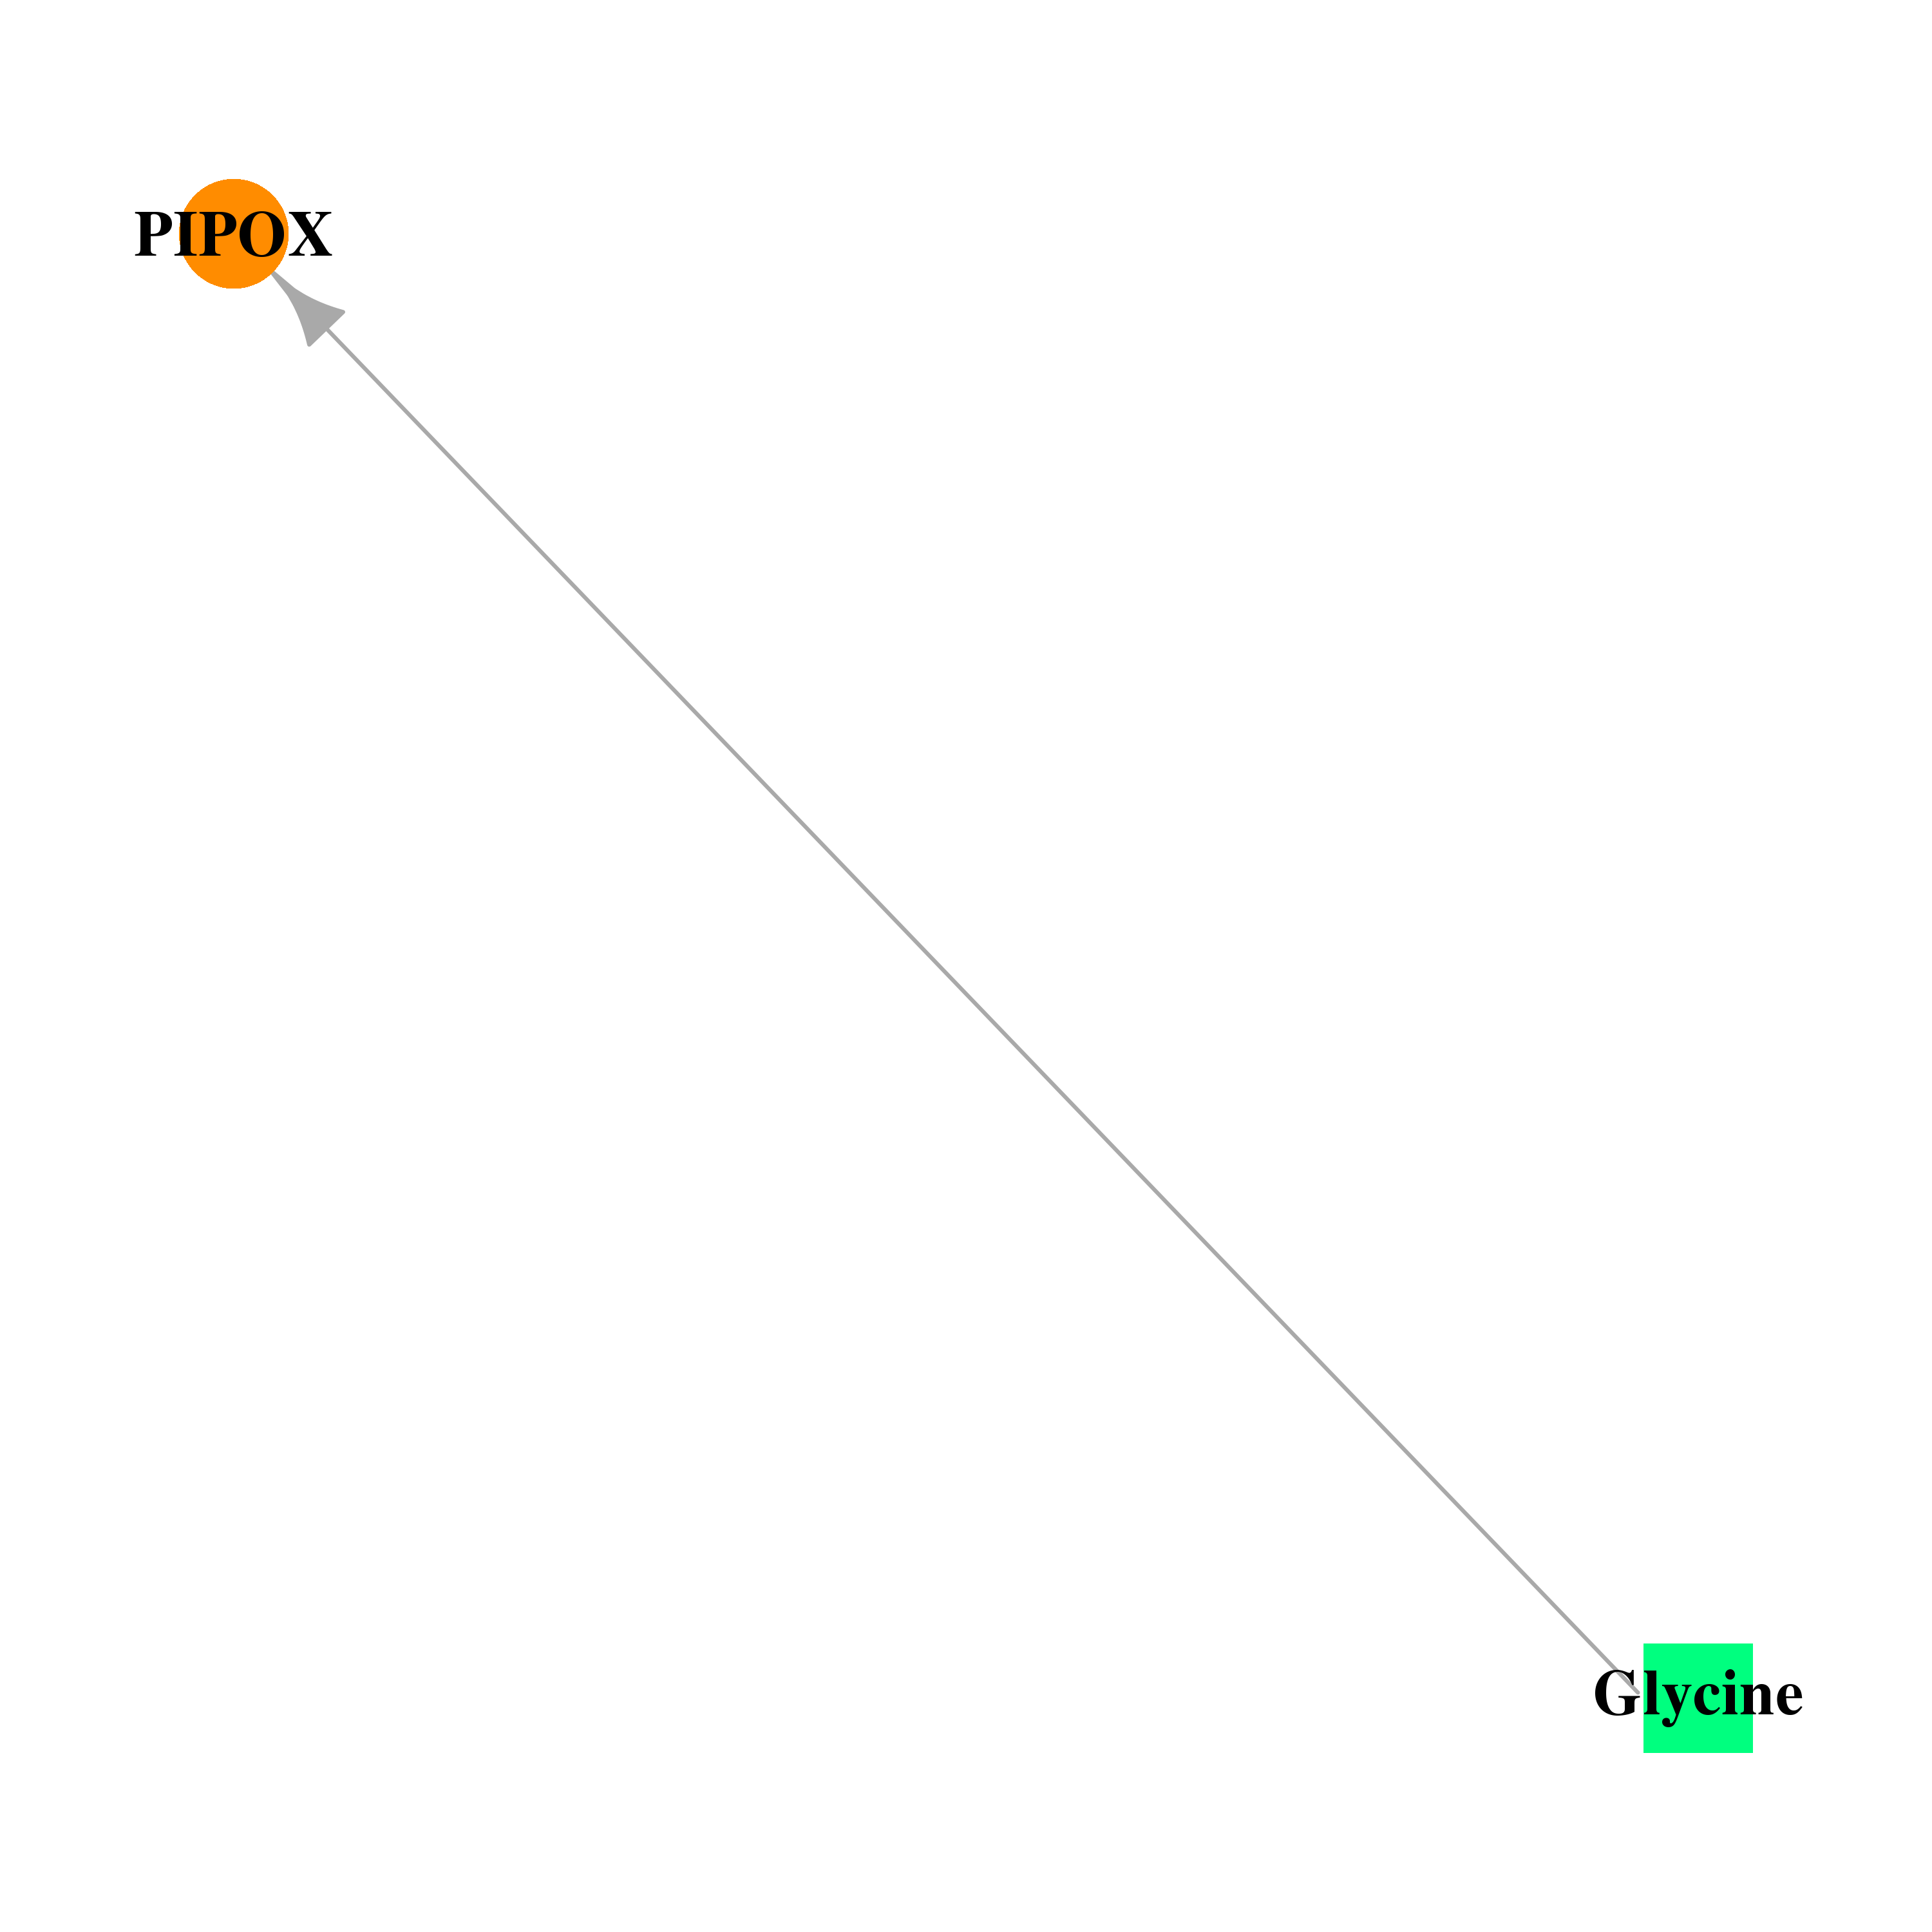 |
| * Drug Centered Interaction Network. |
| DrugBank ID | Target Name | Drug Groups | Generic Name | Drug Centered Network | Drug Structure |
| DB00145 | pipecolic acid oxidase | approved; nutraceutical | Glycine |  |  |
| Top |
| Cross referenced IDs for PIPOX |
| * We obtained these cross-references from Uniprot database. It covers 150 different DBs, 18 categories. http://www.uniprot.org/help/cross_references_section |
: Open all cross reference information
|
Copyright © 2016-Present - The Univsersity of Texas Health Science Center at Houston @ |