|
||||||||||||||||||||||||||||||||||||||||||||||||||||||||||||||||||||||||||||||||||||||||||||||||||||||||||||||||||||||||||||||||||||||||||||||||||||||||||||||||||||||||||||||||||||||||||||||||||||||||||||||||||||||||||||||||||||||||||||||||||||||||||||||||||||||||||||||||||||||||||||||||||||||||||||||||||||||||||
| |
| Phenotypic Information (metabolism pathway, cancer, disease, phenome) |
| |
| |
| Gene-Gene Network Information: Co-Expression Network, Interacting Genes & KEGG |
| |
|


| Gene Summary for GMPR2 |
| Top |
| Phenotypic Information for GMPR2(metabolism pathway, cancer, disease, phenome) |
| Cancer | CGAP: GMPR2 |
| Familial Cancer Database: GMPR2 | |
| * This gene is included in those cancer gene databases. |
|
|
|
|
|
|
| ||||||||||||||||||||||||||||||||||||||||||||||||||||||||||||||||||||||||||||||||||||||||||||||||||||||||||||||||||||||||||||||||||||||||||||||||||||||||||||||||||||||||||||||||||||||||||||||||||||||||||||||||||||||||||||||||||||||||||||||||||||||||||||||||||||||||||||||||||||||||||||||||||||||||||||||||||||
Oncogene 1 | Significant driver gene in | |||||||||||||||||||||||||||||||||||||||||||||||||||||||||||||||||||||||||||||||||||||||||||||||||||||||||||||||||||||||||||||||||||||||||||||||||||||||||||||||||||||||||||||||||||||||||||||||||||||||||||||||||||||||||||||||||||||||||||||||||||||||||||||||||||||||||||||||||||||||||||||||||||||||||||||||||||||||||
| cf) number; DB name 1 Oncogene; http://nar.oxfordjournals.org/content/35/suppl_1/D721.long, 2 Tumor Suppressor gene; https://bioinfo.uth.edu/TSGene/, 3 Cancer Gene Census; http://www.nature.com/nrc/journal/v4/n3/abs/nrc1299.html, 4 CancerGenes; http://nar.oxfordjournals.org/content/35/suppl_1/D721.long, 5 Network of Cancer Gene; http://ncg.kcl.ac.uk/index.php, 1Therapeutic Vulnerabilities in Cancer; http://cbio.mskcc.org/cancergenomics/statius/ |
| KEGG_PURINE_METABOLISM REACTOME_METABOLISM_OF_NUCLEOTIDES REACTOME_PURINE_METABOLISM | |
| OMIM | |
| Orphanet | |
| Disease | KEGG Disease: GMPR2 |
| MedGen: GMPR2 (Human Medical Genetics with Condition) | |
| ClinVar: GMPR2 | |
| Phenotype | MGI: GMPR2 (International Mouse Phenotyping Consortium) |
| PhenomicDB: GMPR2 | |
| Mutations for GMPR2 |
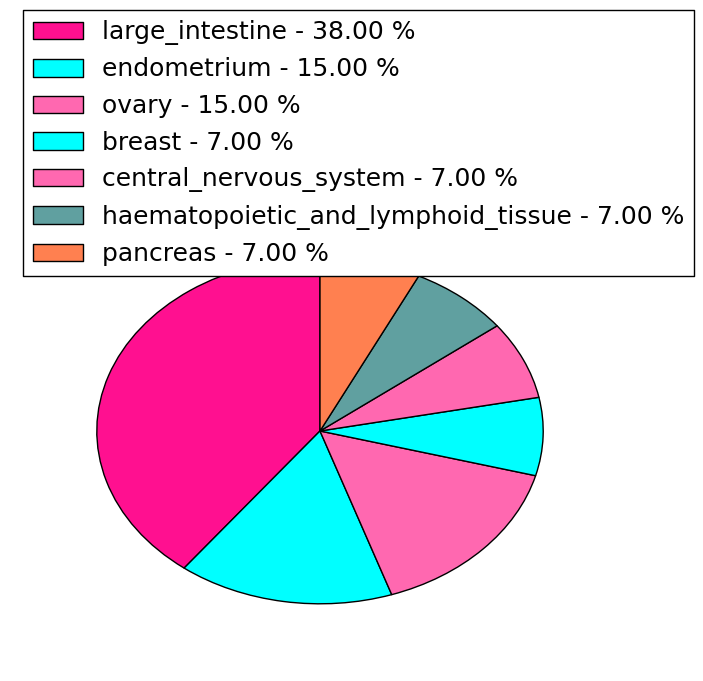
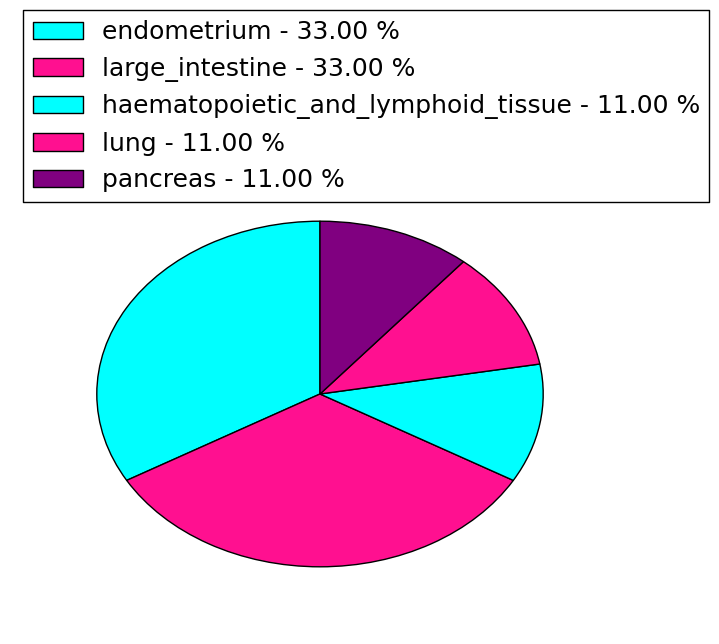
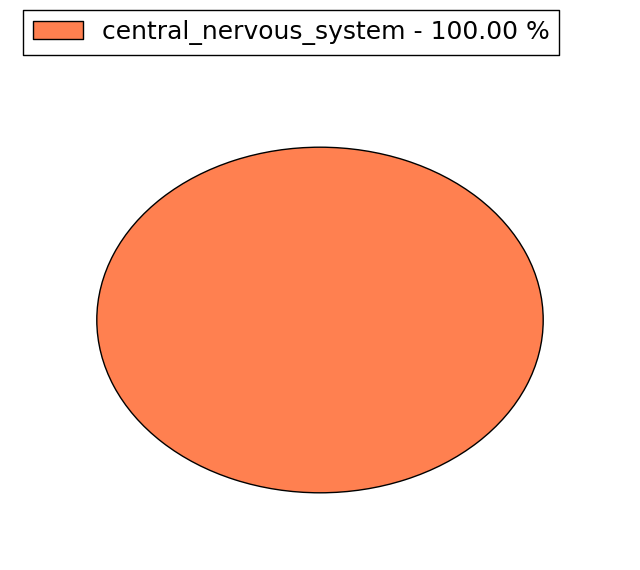
| * Under tables are showing count per each tissue to give us broad intuition about tissue specific mutation patterns.You can go to the detailed page for each mutation database's web site. |
| There's no structural variation information in COSMIC data for this gene. |
| * From mRNA Sanger sequences, Chitars2.0 arranged chimeric transcripts. This table shows GMPR2 related fusion information. |
| ID | Head Gene | Tail Gene | Accession | Gene_a | qStart_a | qEnd_a | Chromosome_a | tStart_a | tEnd_a | Gene_a | qStart_a | qEnd_a | Chromosome_a | tStart_a | tEnd_a |
| AK075025 | GMPR2 | 1 | 1165 | 14 | 24701666 | 24707667 | STOML2 | 1161 | 2064 | 9 | 35099893 | 35101490 | |
| BF916399 | JUN | 1 | 123 | 1 | 59247923 | 59248045 | GMPR2 | 116 | 288 | 14 | 24708184 | 24708356 | |
| Top |
| Mutation type/ Tissue ID | brca | cns | cerv | endome | haematopo | kidn | Lintest | liver | lung | ns | ovary | pancre | prost | skin | stoma | thyro | urina | |||
| Total # sample | 1 | |||||||||||||||||||
| GAIN (# sample) | 1 | |||||||||||||||||||
| LOSS (# sample) |
| cf) Tissue ID; Tissue type (1; Breast, 2; Central_nervous_system, 3; Cervix, 4; Endometrium, 5; Haematopoietic_and_lymphoid_tissue, 6; Kidney, 7; Large_intestine, 8; Liver, 9; Lung, 10; NS, 11; Ovary, 12; Pancreas, 13; Prostate, 14; Skin, 15; Stomach, 16; Thyroid, 17; Urinary_tract) |
| Top |
|
 |
| Top |
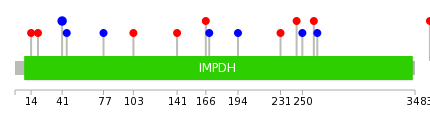
| Stat. for Non-Synonymous SNVs (# total SNVs=13) | (# total SNVs=9) |
 |  |
(# total SNVs=1) | (# total SNVs=0) |
 |
| Top |
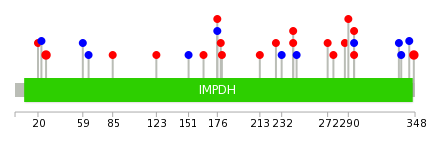
| * When you move the cursor on each content, you can see more deailed mutation information on the Tooltip. Those are primary_site,primary_histology,mutation(aa),pubmedID. |
| GRCh37 position | Mutation(aa) | Unique sampleID count |
| chr14:24707977-24707977 | p.A347V | 2 |
| chr14:24702539-24702539 | p.R27Q | 2 |
| chr14:24706339-24706339 | p.I176M | 2 |
| chr14:24702518-24702518 | p.K20R | 1 |
| chr14:24706347-24706347 | p.G179E | 1 |
| chr14:24707610-24707610 | p.R286* | 1 |
| chr14:24702528-24702528 | p.T23T | 1 |
| chr14:24706350-24706350 | p.I180S | 1 |
| chr14:24707797-24707797 | p.A287V | 1 |
| chr14:24706359-24706359 | p.? | 1 |
| Top |
|
 |
| Point Mutation/ Tissue ID | 1 | 2 | 3 | 4 | 5 | 6 | 7 | 8 | 9 | 10 | 11 | 12 | 13 | 14 | 15 | 16 | 17 | 18 | 19 | 20 |
| # sample | 1 | 5 | 1 | 2 | 2 | 3 | 2 | 5 | ||||||||||||
| # mutation | 1 | 4 | 1 | 2 | 2 | 3 | 2 | 6 | ||||||||||||
| nonsynonymous SNV | 1 | 2 | 1 | 2 | 2 | 1 | 3 | |||||||||||||
| synonymous SNV | 2 | 2 | 1 | 1 | 3 |
| cf) Tissue ID; Tissue type (1; BLCA[Bladder Urothelial Carcinoma], 2; BRCA[Breast invasive carcinoma], 3; CESC[Cervical squamous cell carcinoma and endocervical adenocarcinoma], 4; COAD[Colon adenocarcinoma], 5; GBM[Glioblastoma multiforme], 6; Glioma Low Grade, 7; HNSC[Head and Neck squamous cell carcinoma], 8; KICH[Kidney Chromophobe], 9; KIRC[Kidney renal clear cell carcinoma], 10; KIRP[Kidney renal papillary cell carcinoma], 11; LAML[Acute Myeloid Leukemia], 12; LUAD[Lung adenocarcinoma], 13; LUSC[Lung squamous cell carcinoma], 14; OV[Ovarian serous cystadenocarcinoma ], 15; PAAD[Pancreatic adenocarcinoma], 16; PRAD[Prostate adenocarcinoma], 17; SKCM[Skin Cutaneous Melanoma], 18:STAD[Stomach adenocarcinoma], 19:THCA[Thyroid carcinoma], 20:UCEC[Uterine Corpus Endometrial Carcinoma]) |
| Top |
| * We represented just top 10 SNVs. When you move the cursor on each content, you can see more deailed mutation information on the Tooltip. Those are primary_site, primary_histology, mutation(aa), pubmedID. |
| Genomic Position | Mutation(aa) | Unique sampleID count |
| chr14:24702528 | p.T41T,GMPR2 | 2 |
| chr14:24702445 | p.G260R,GMPR2 | 1 |
| chr14:24706750 | p.L263L,GMPR2 | 1 |
| chr14:24702464 | p.F361V,GMPR2 | 1 |
| chr14:24706767 | p.P14S,GMPR2 | 1 |
| chr14:24707478 | p.A366V,GMPR2 | 1 |
| chr14:24702538 | p.P20L,GMPR2 | 1 |
| chr14:24707487 | p.G369E,GMPR2 | 1 |
| chr14:24702774 | p.V374L,GMPR2 | 1 |
| chr14:24707781 | p.R45R,GMPR2 | 1 |
| * Copy number data were extracted from TCGA using R package TCGA-Assembler. The URLs of all public data files on TCGA DCC data server were gathered on Jan-05-2015. Function ProcessCNAData in TCGA-Assembler package was used to obtain gene-level copy number value which is calculated as the average copy number of the genomic region of a gene. |
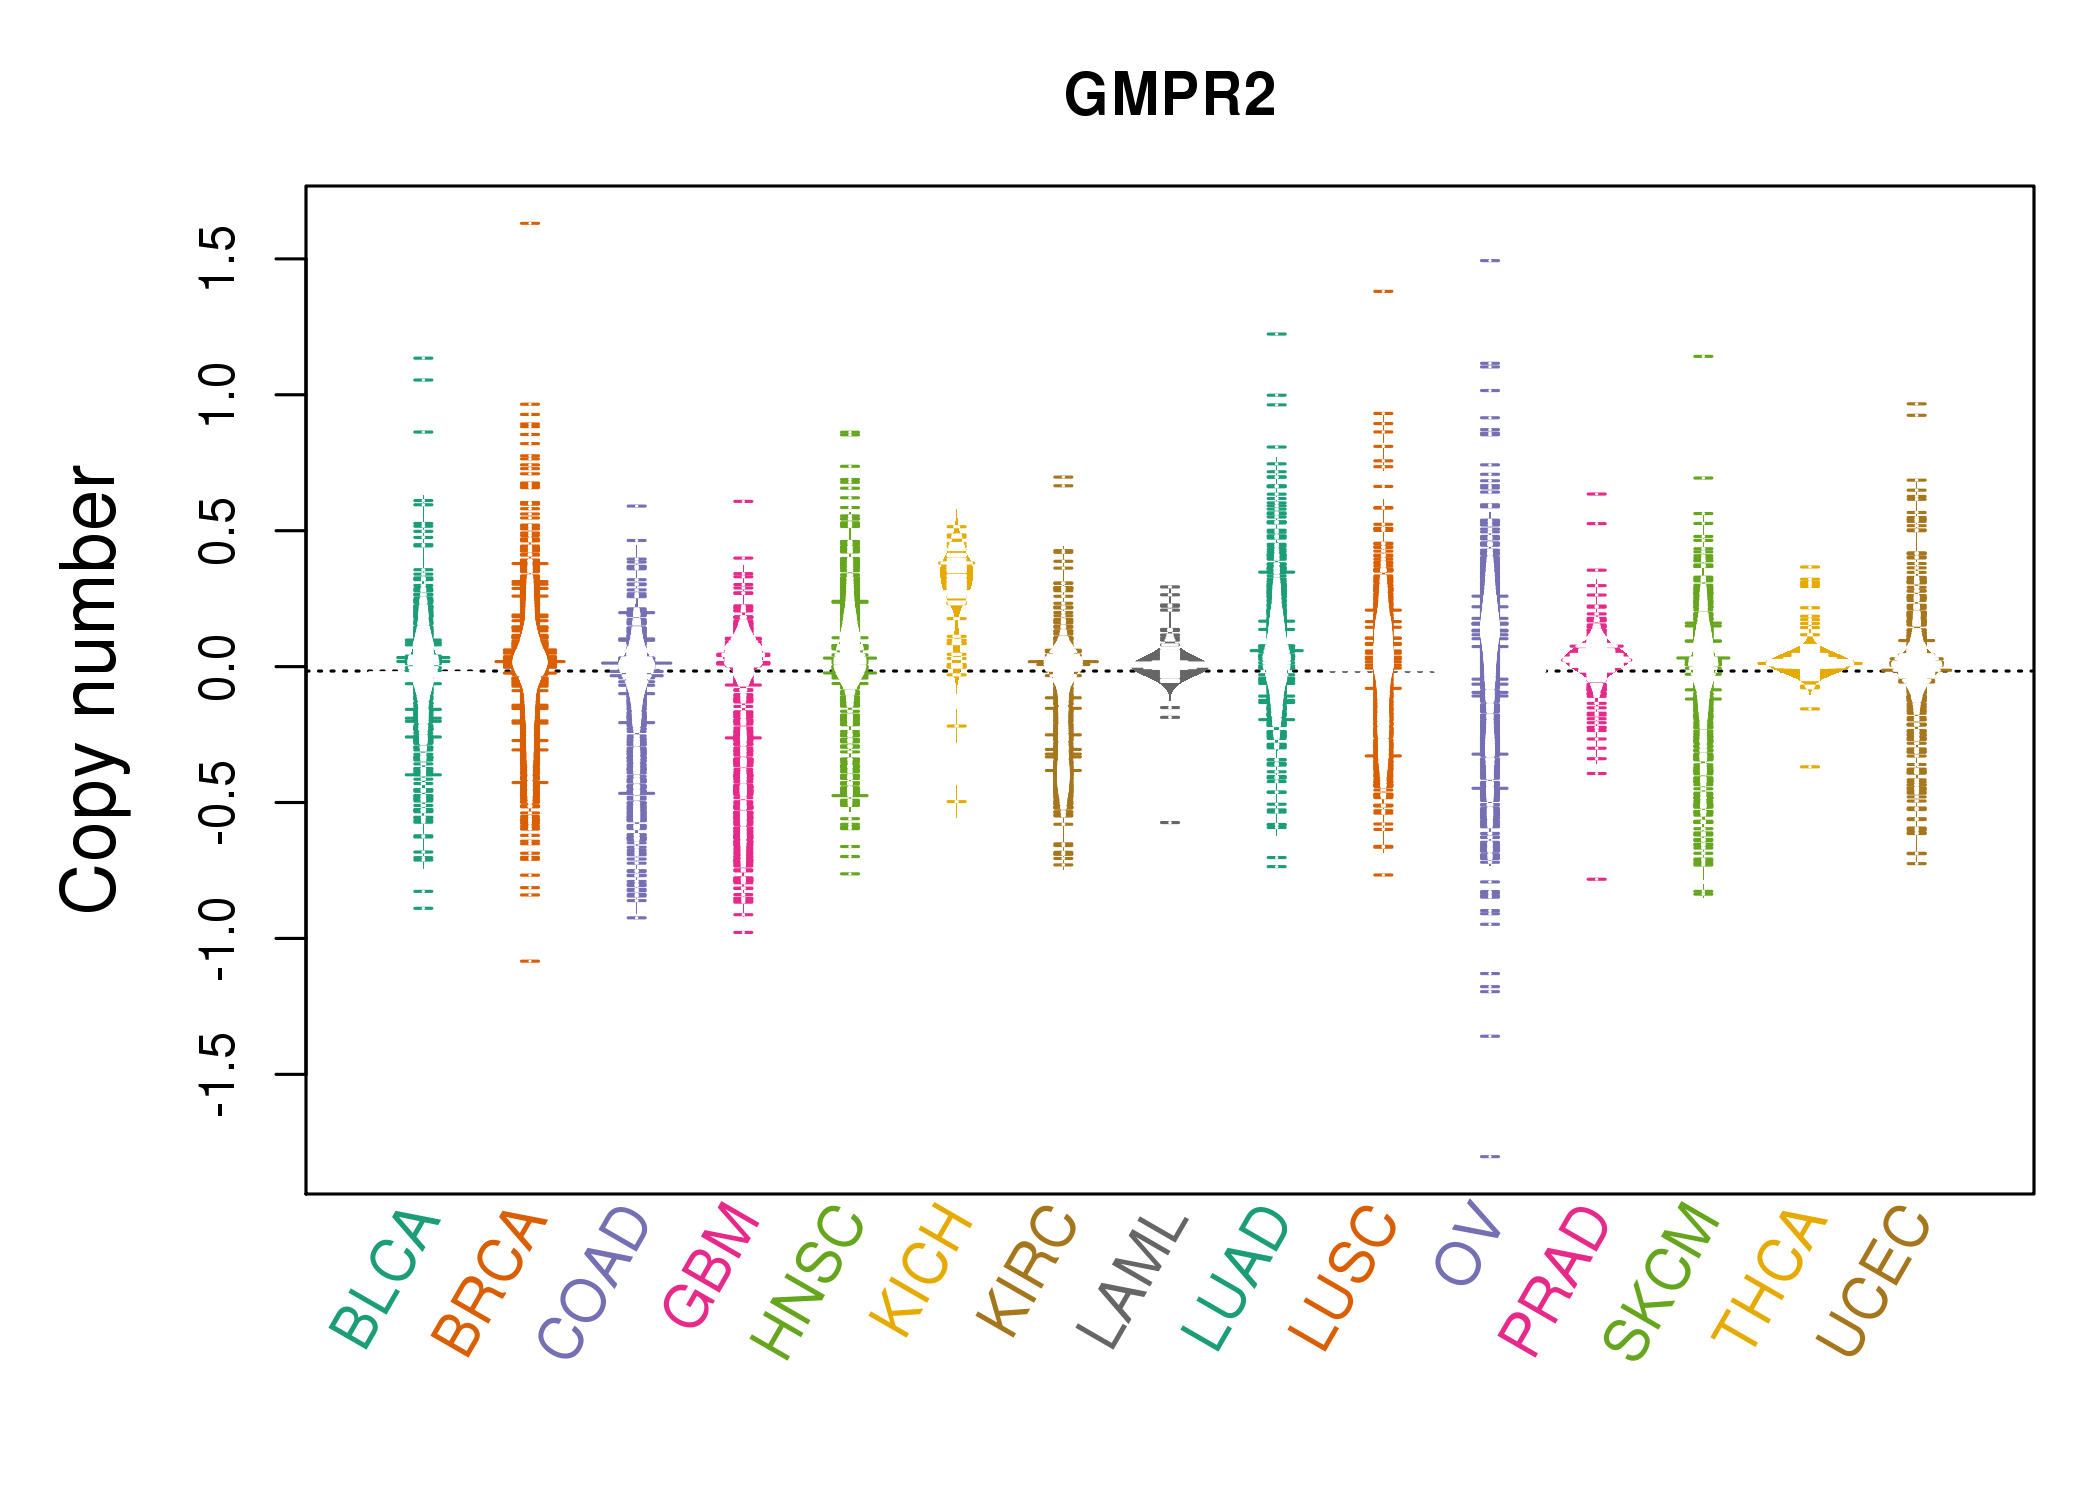 |
| cf) Tissue ID[Tissue type]: BLCA[Bladder Urothelial Carcinoma], BRCA[Breast invasive carcinoma], CESC[Cervical squamous cell carcinoma and endocervical adenocarcinoma], COAD[Colon adenocarcinoma], GBM[Glioblastoma multiforme], Glioma Low Grade, HNSC[Head and Neck squamous cell carcinoma], KICH[Kidney Chromophobe], KIRC[Kidney renal clear cell carcinoma], KIRP[Kidney renal papillary cell carcinoma], LAML[Acute Myeloid Leukemia], LUAD[Lung adenocarcinoma], LUSC[Lung squamous cell carcinoma], OV[Ovarian serous cystadenocarcinoma ], PAAD[Pancreatic adenocarcinoma], PRAD[Prostate adenocarcinoma], SKCM[Skin Cutaneous Melanoma], STAD[Stomach adenocarcinoma], THCA[Thyroid carcinoma], UCEC[Uterine Corpus Endometrial Carcinoma] |
| Top |
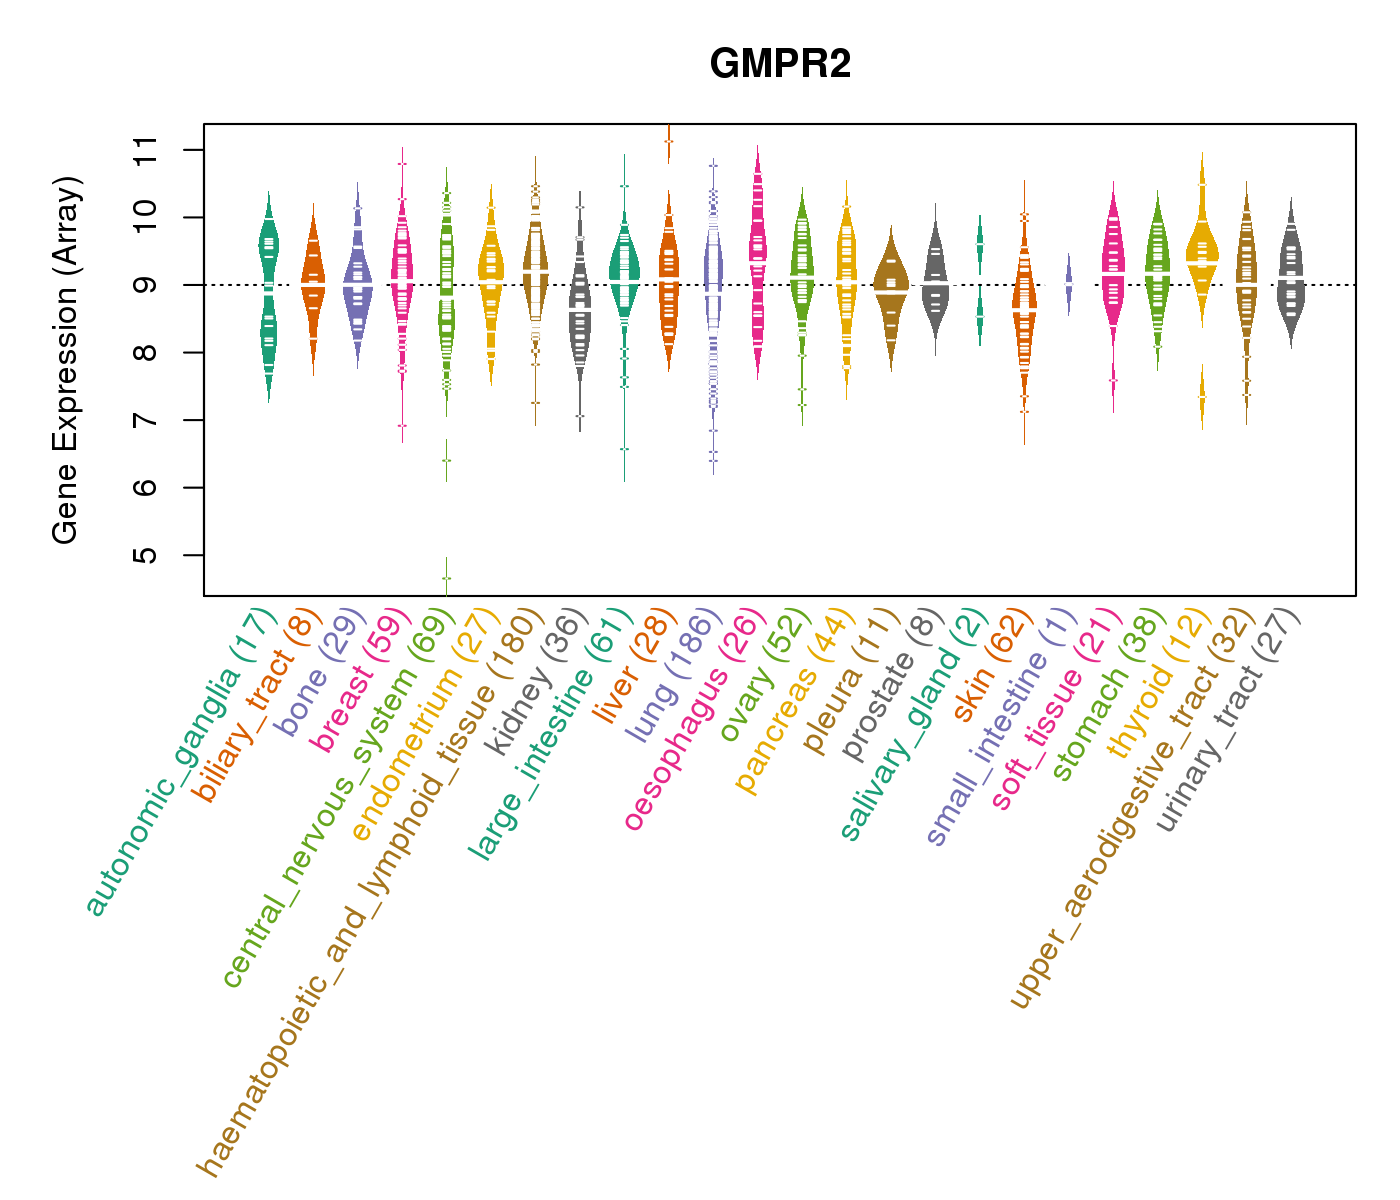
| Gene Expression for GMPR2 |
| * CCLE gene expression data were extracted from CCLE_Expression_Entrez_2012-10-18.res: Gene-centric RMA-normalized mRNA expression data. |
 |
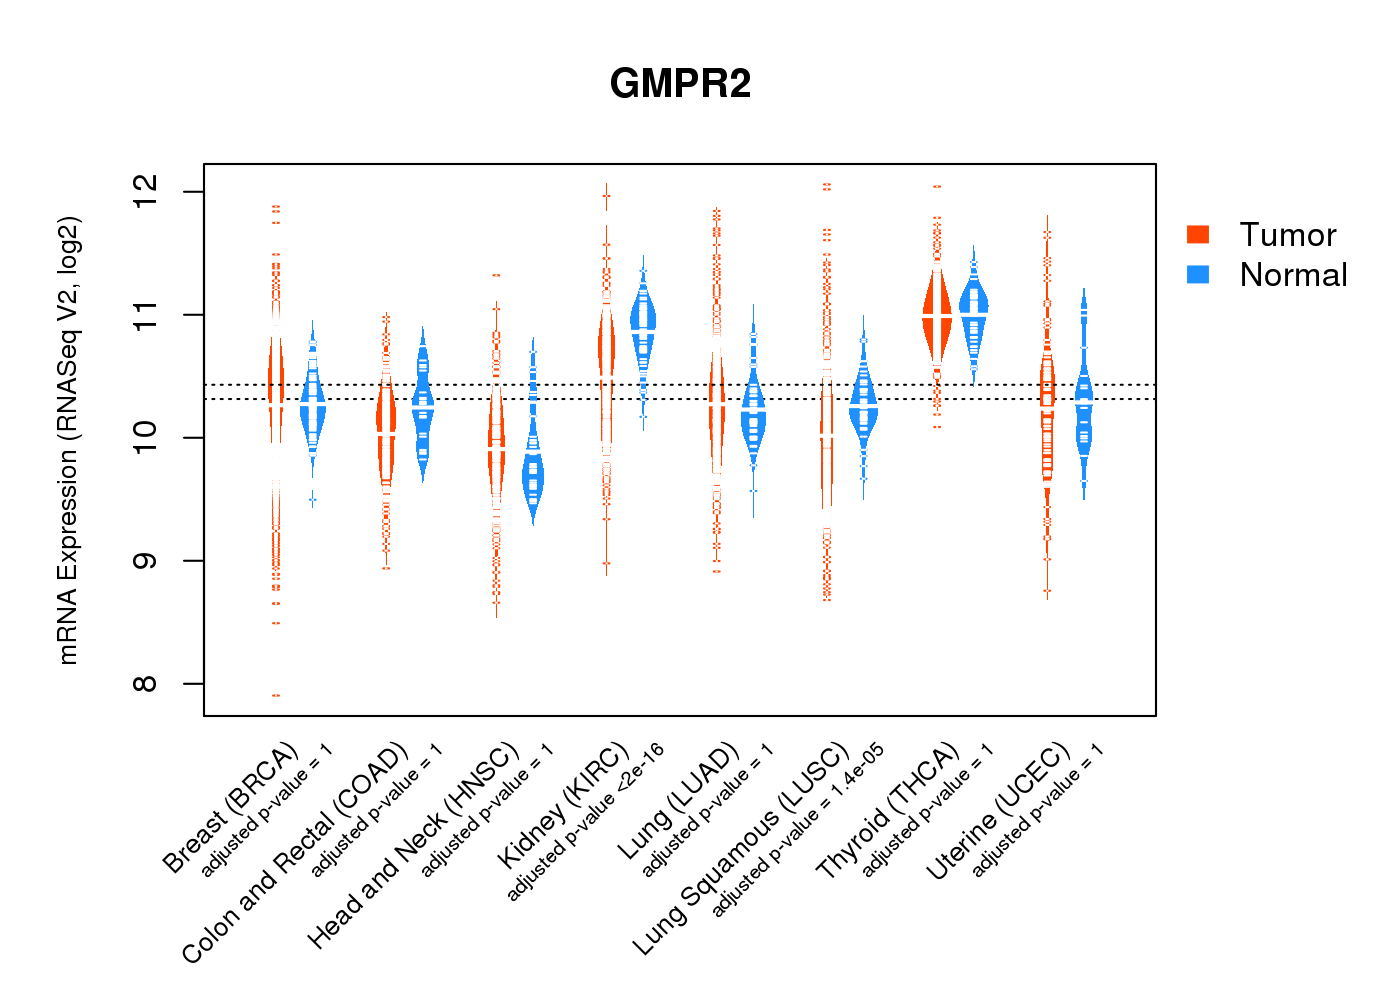
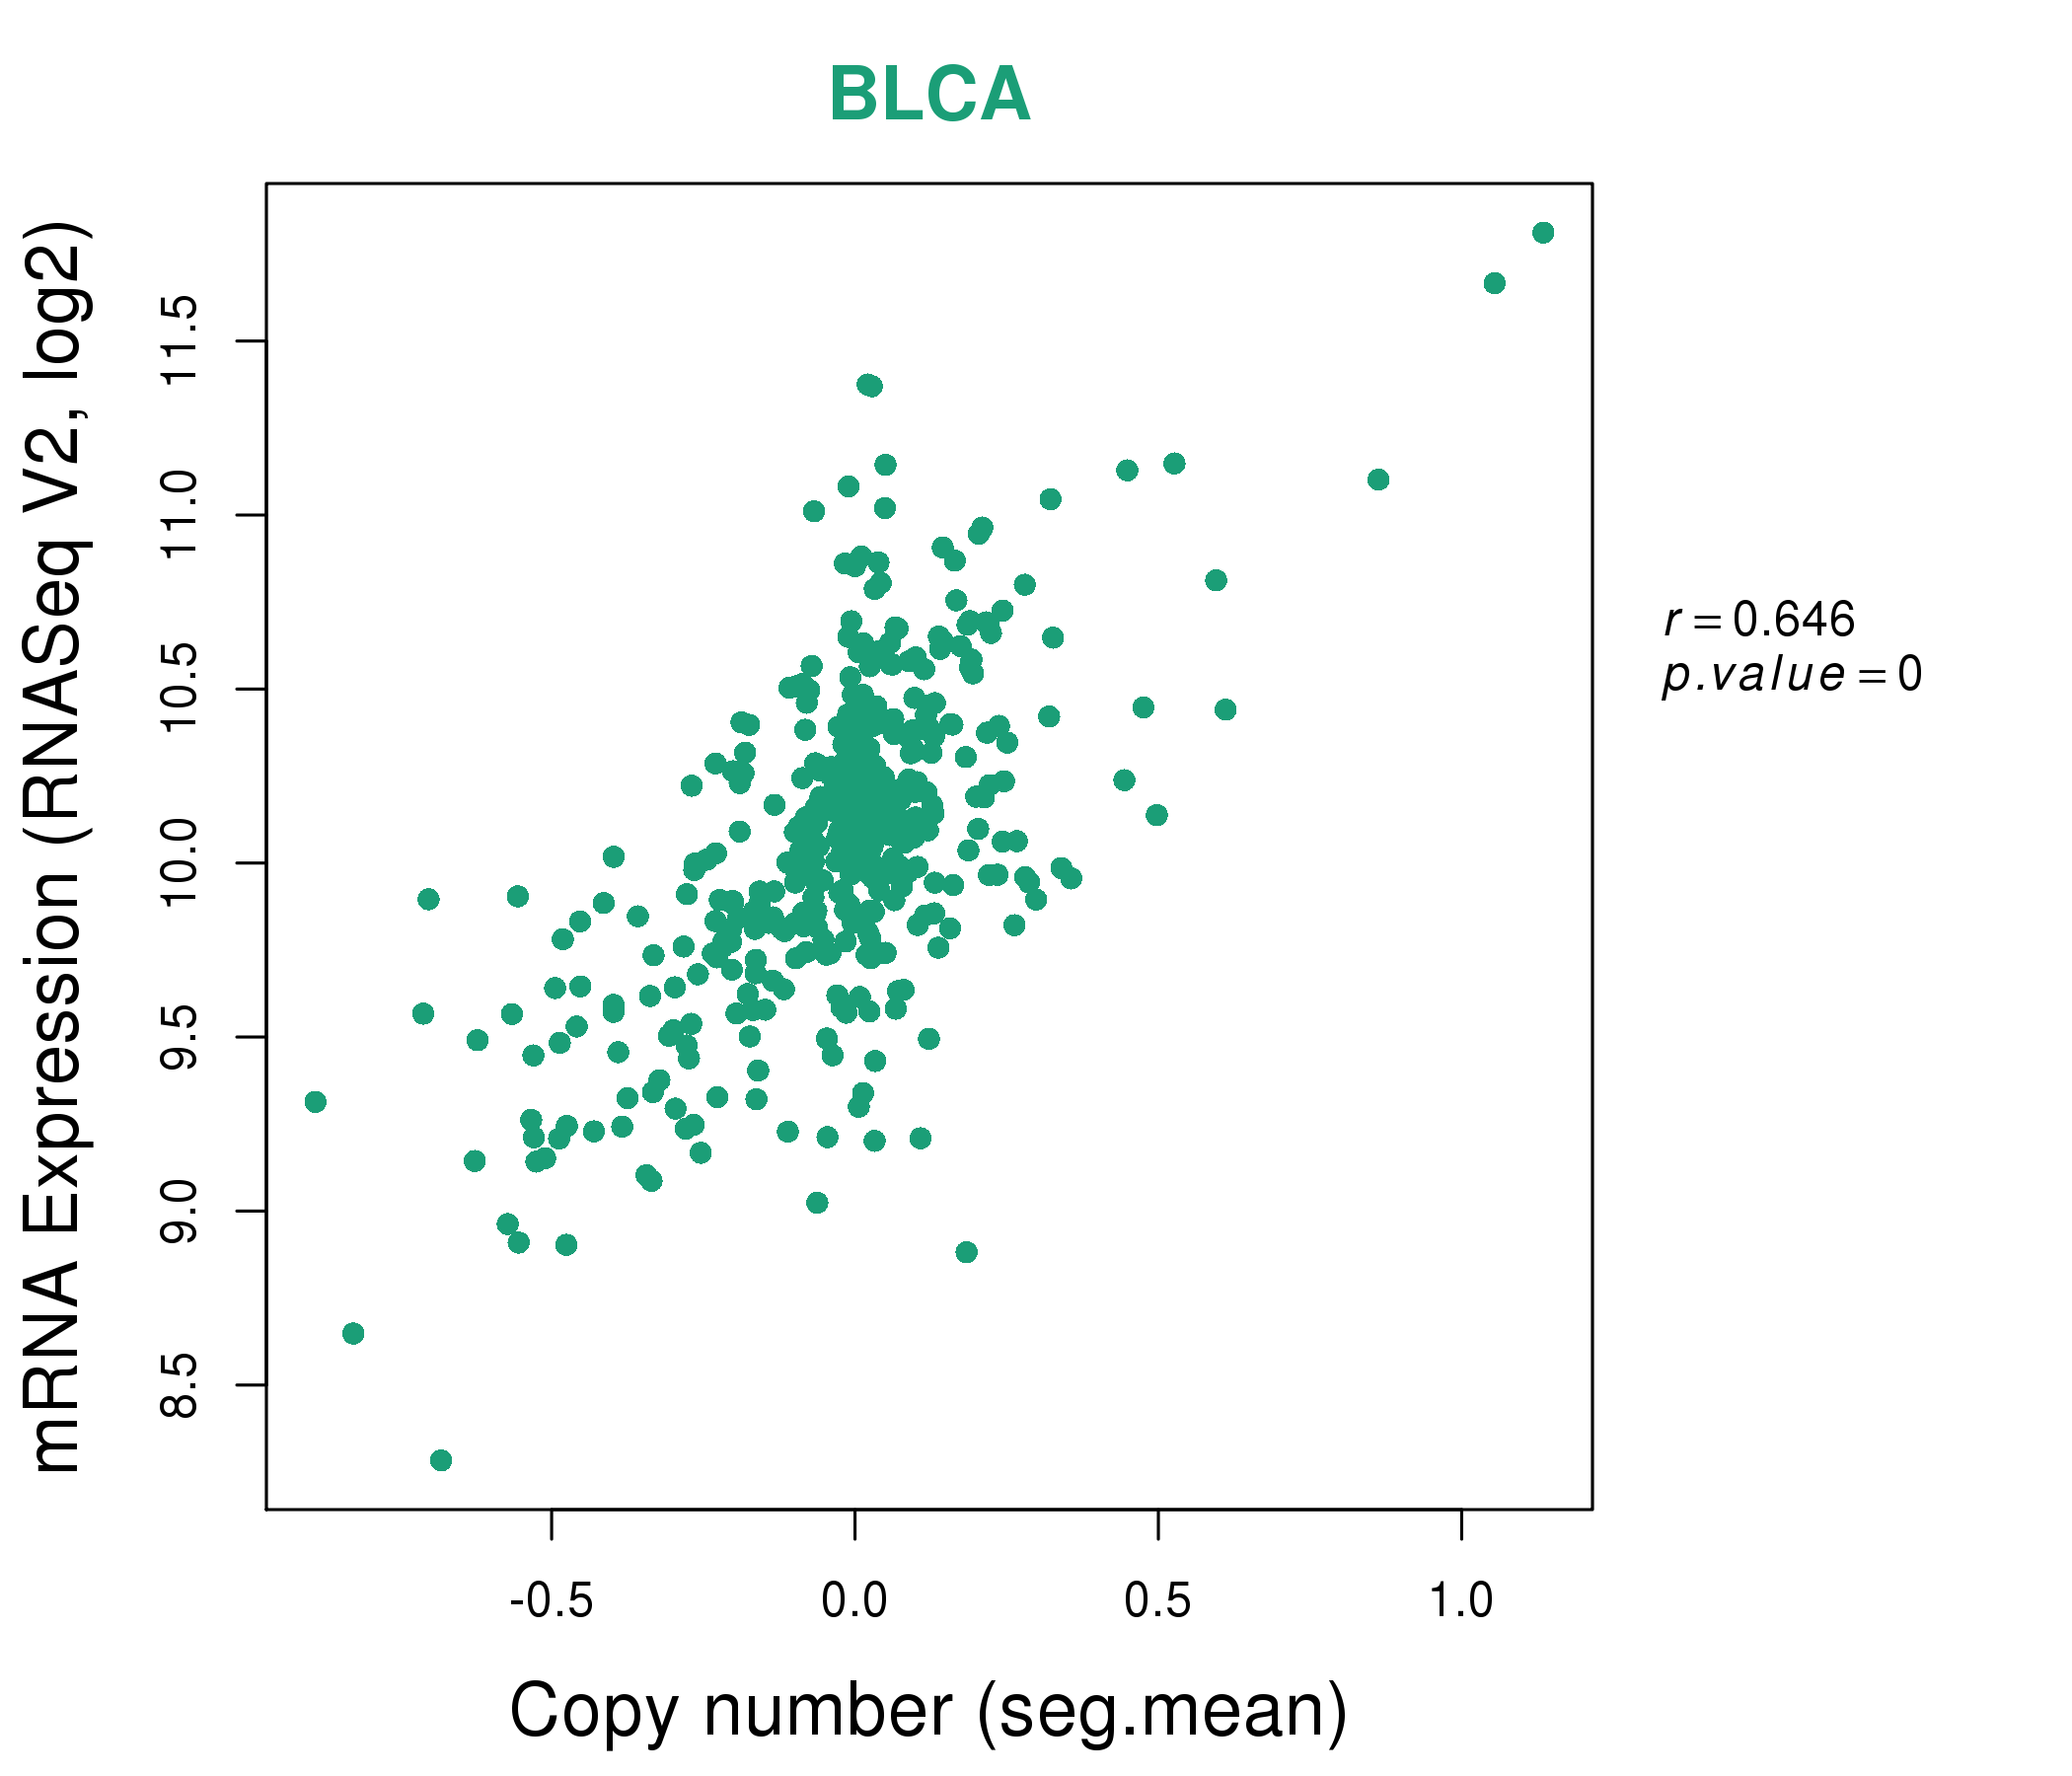
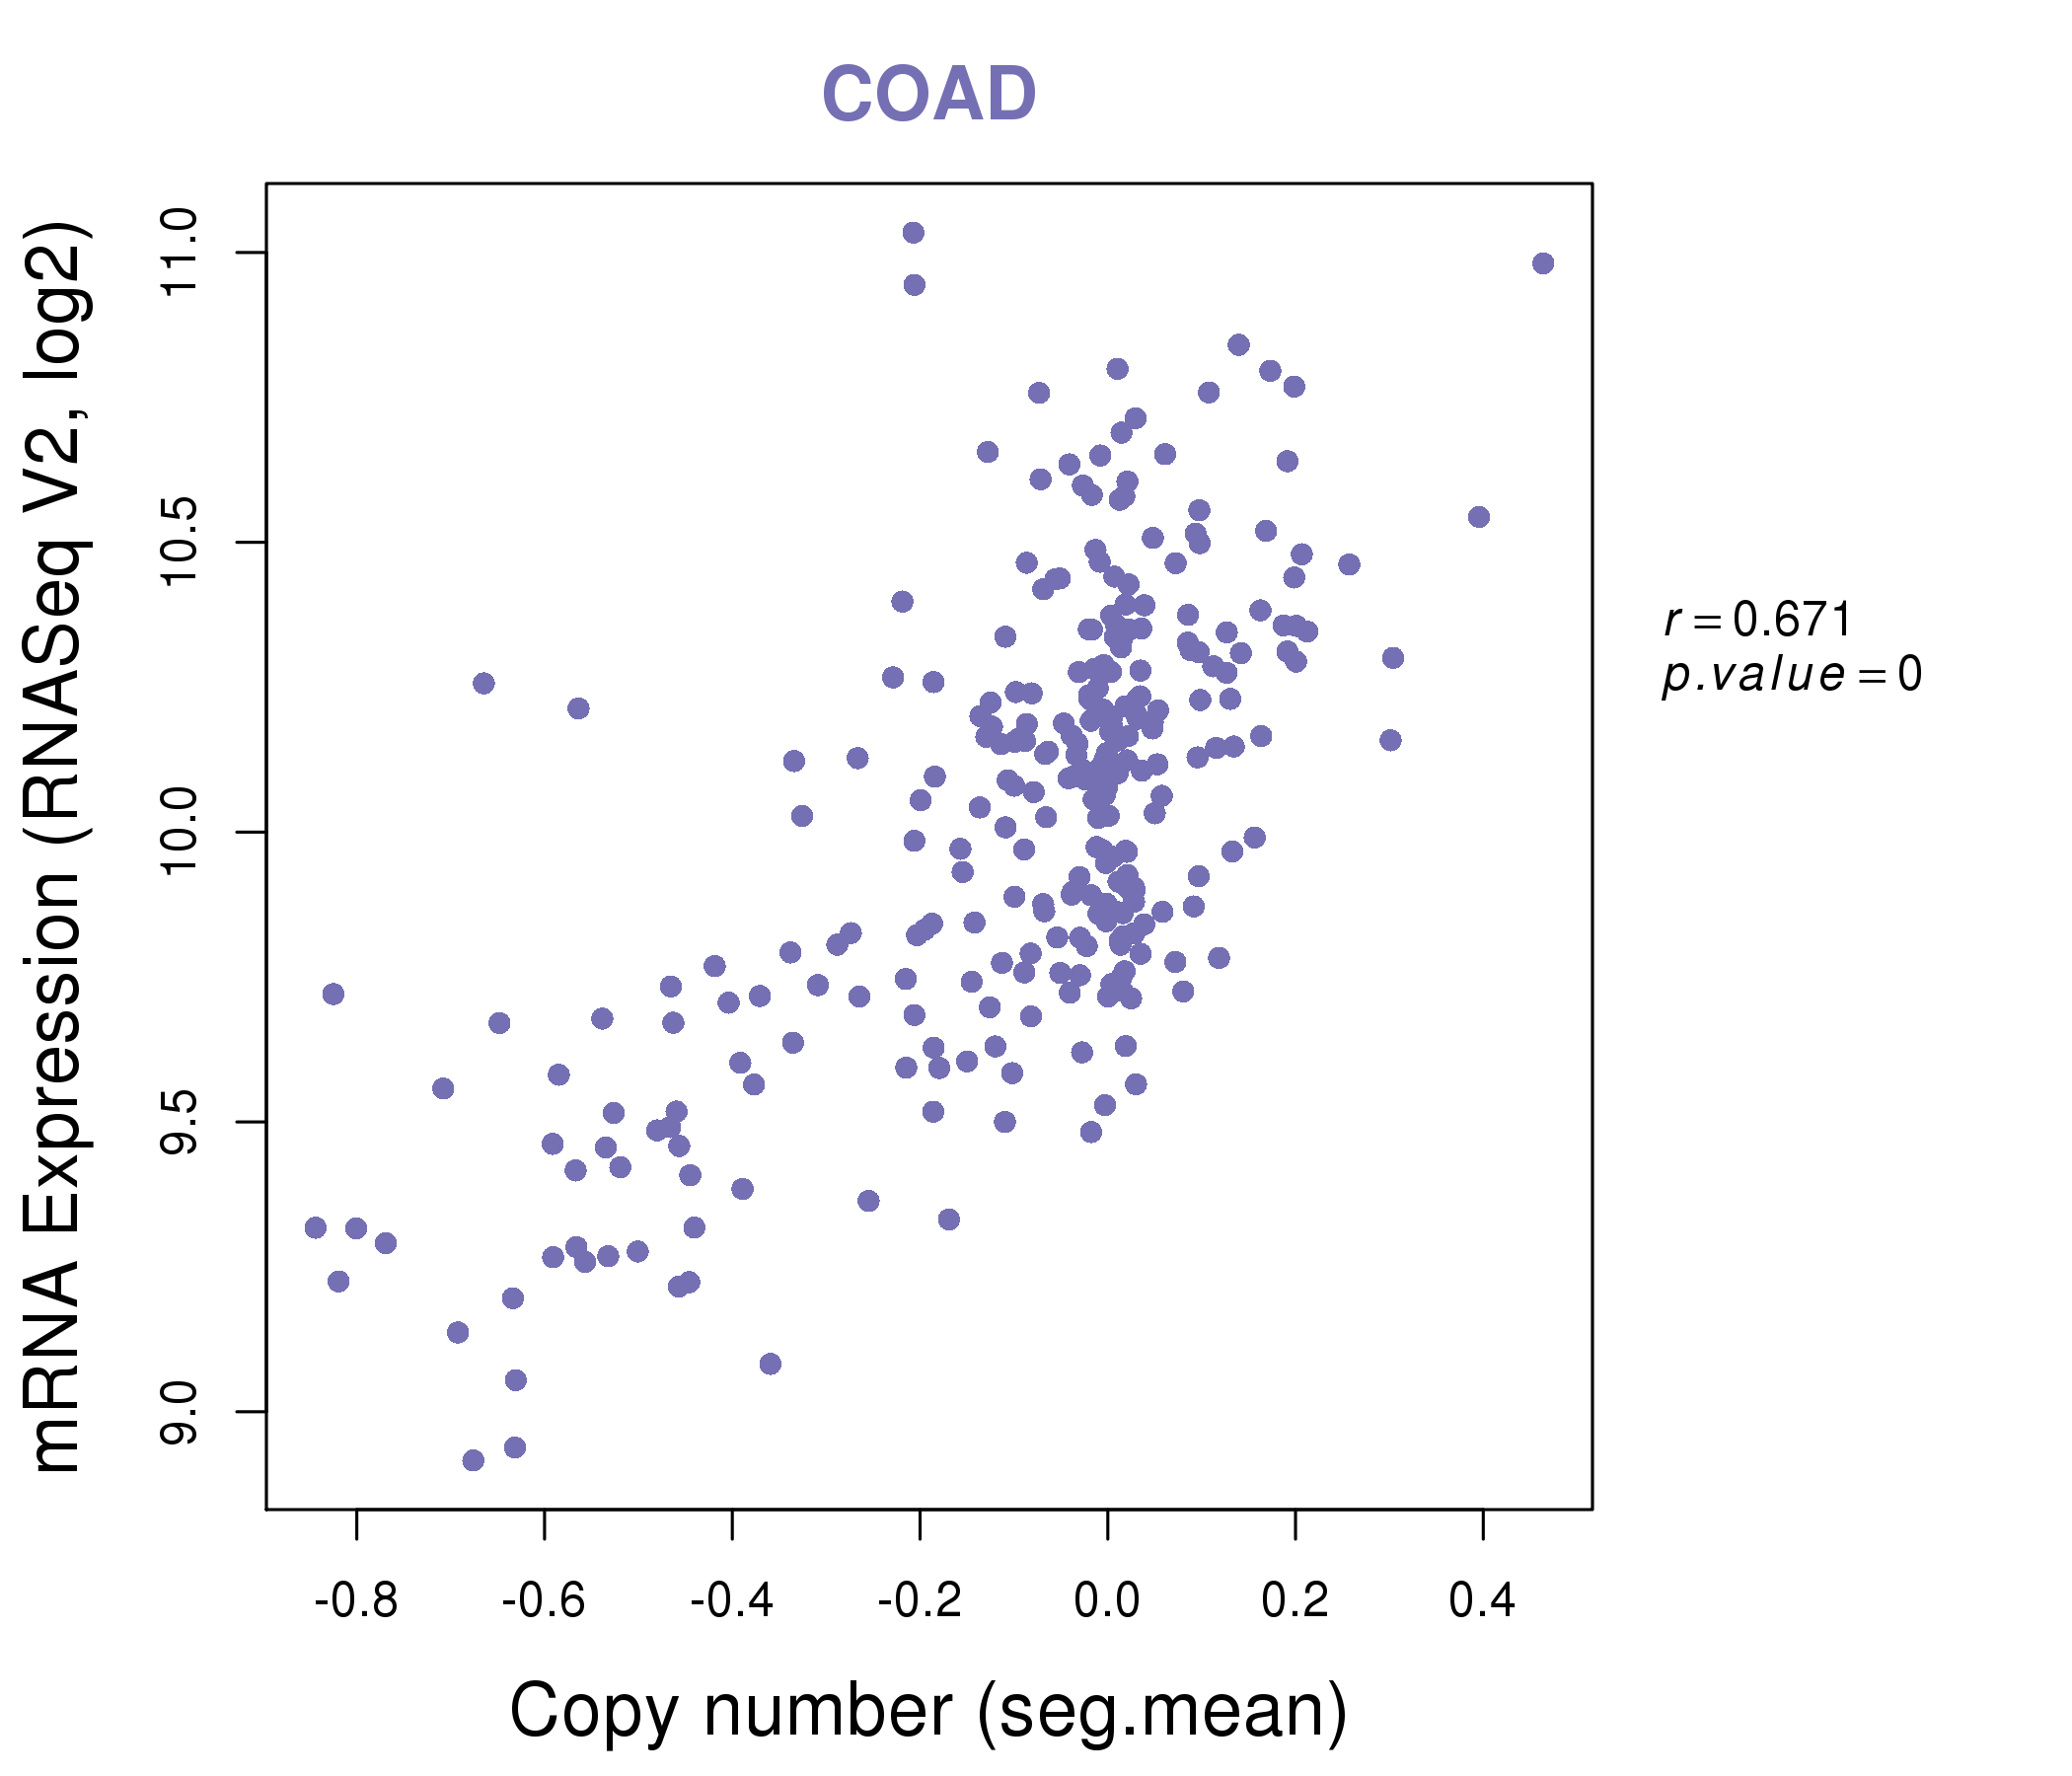
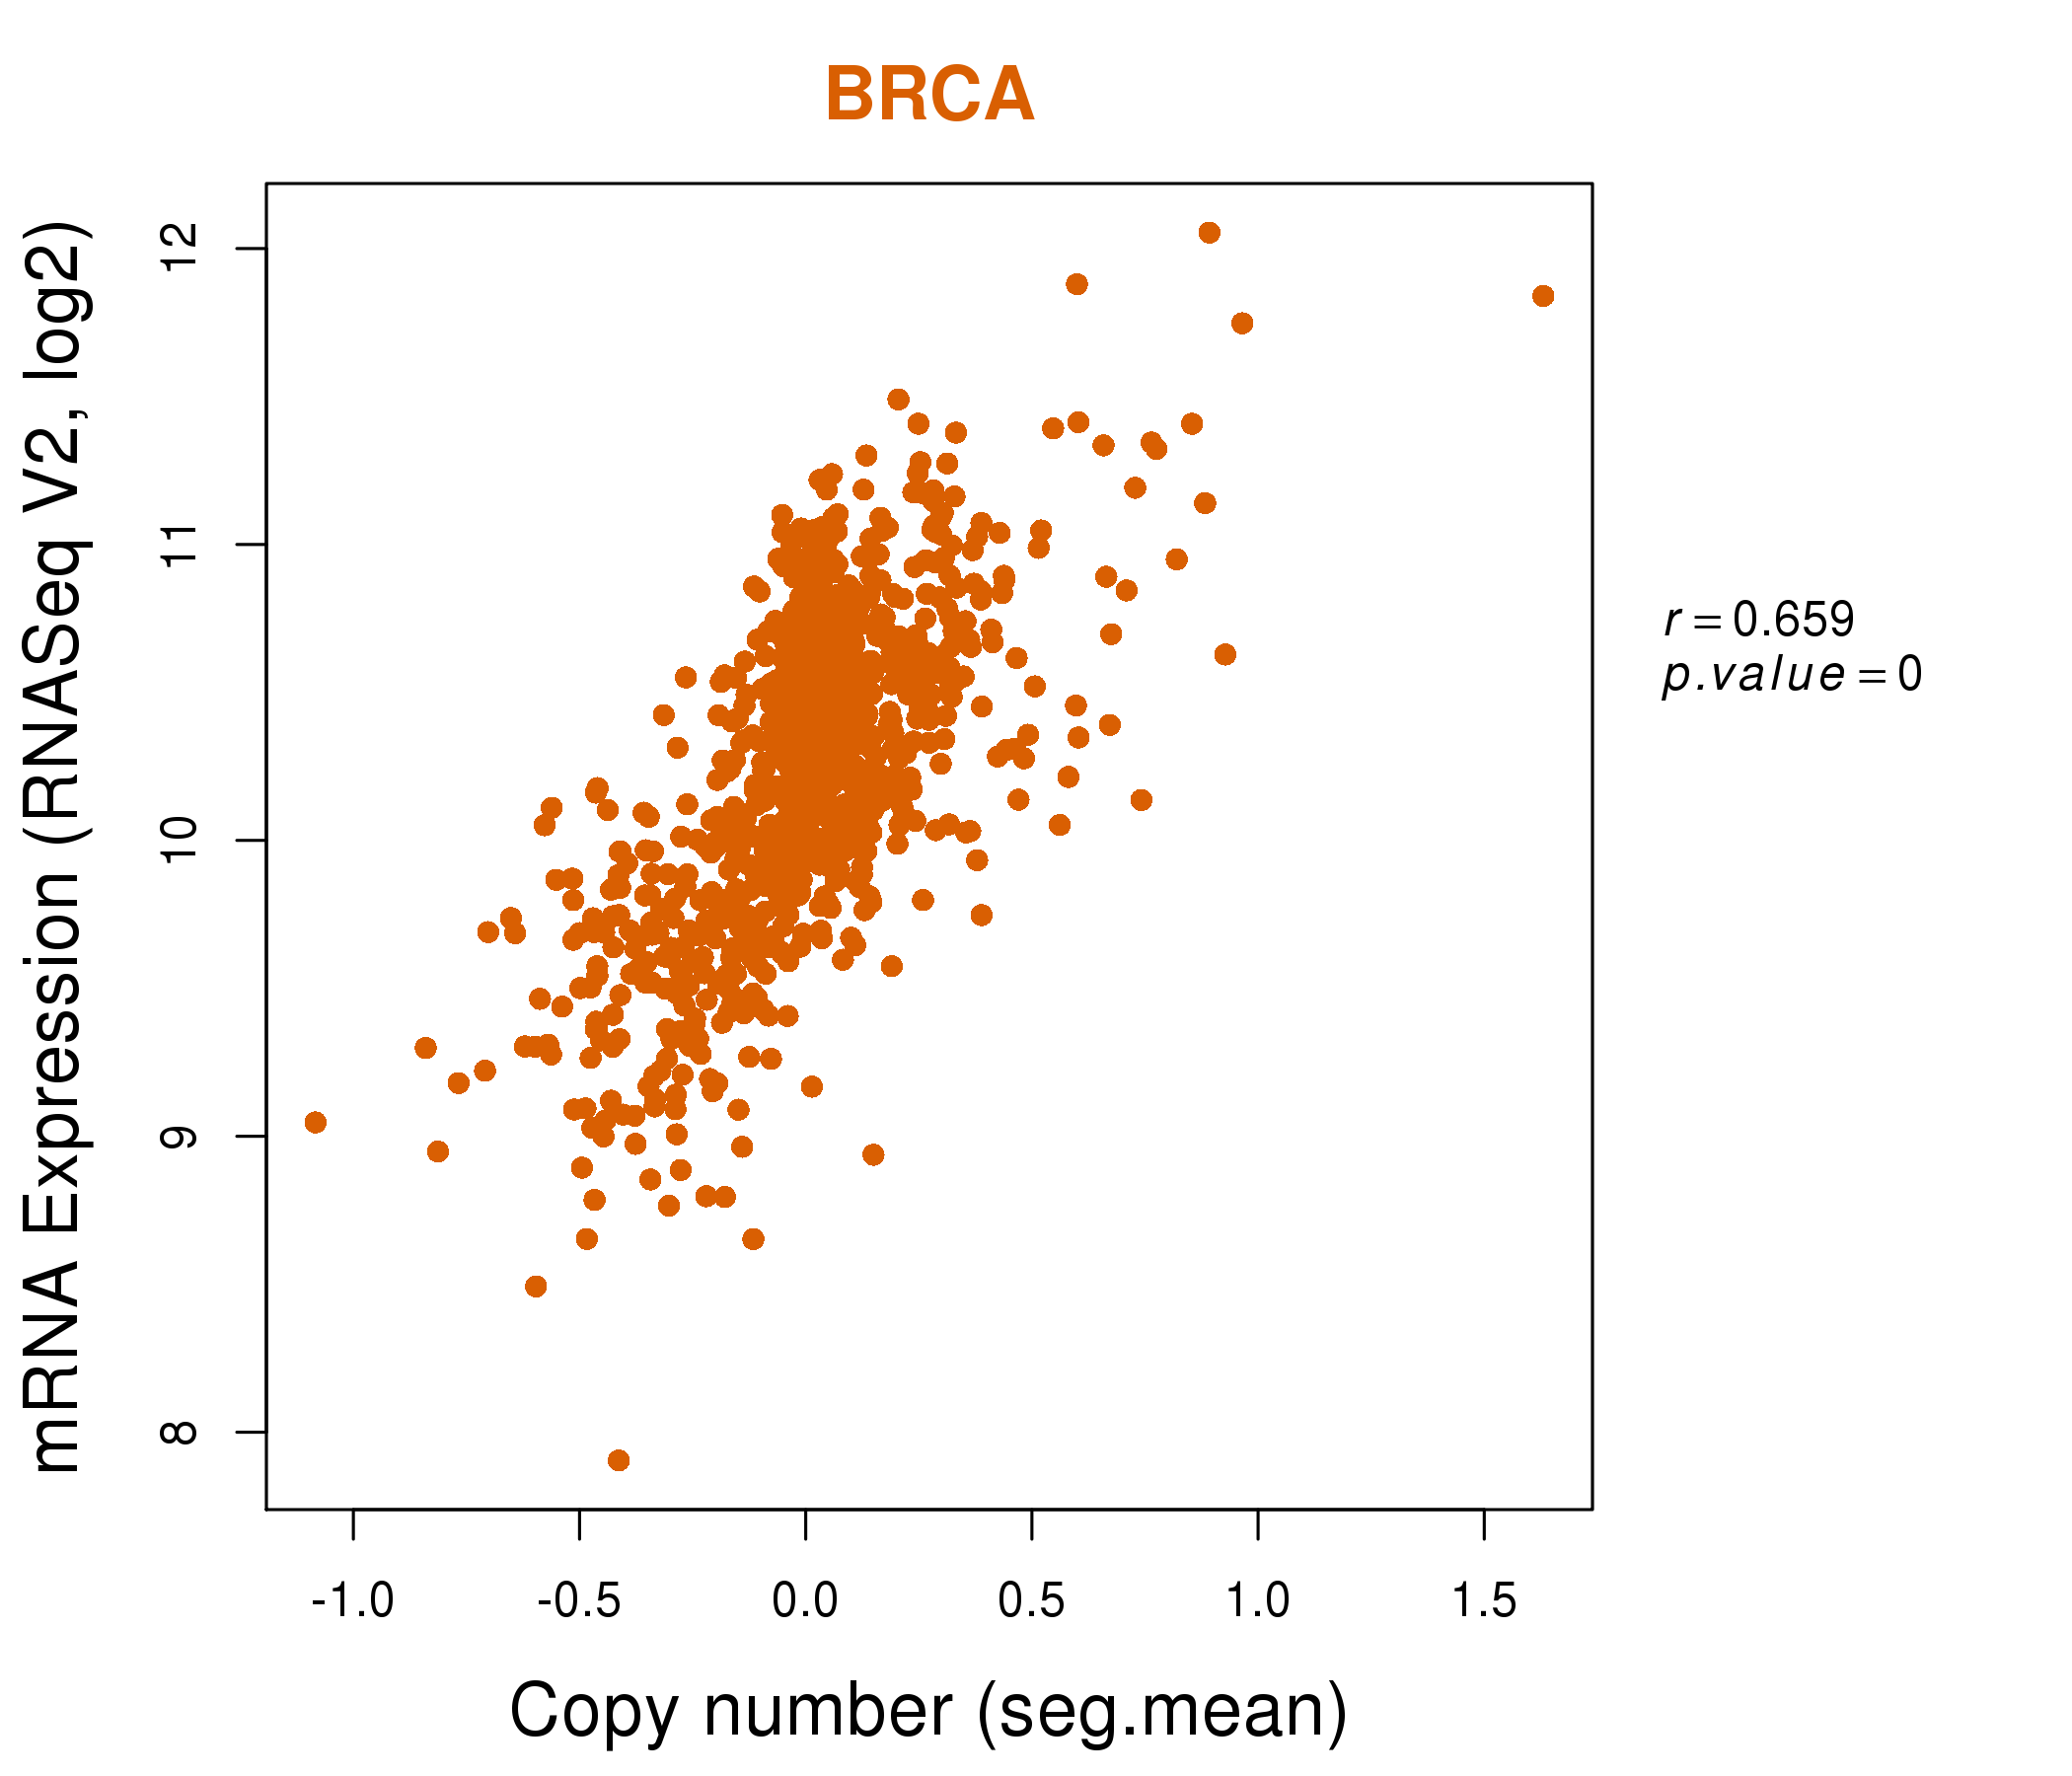
| * Normalized gene expression data of RNASeqV2 was extracted from TCGA using R package TCGA-Assembler. The URLs of all public data files on TCGA DCC data server were gathered at Jan-05-2015. Only eight cancer types have enough normal control samples for differential expression analysis. (t test, adjusted p<0.05 (using Benjamini-Hochberg FDR)) |
 |
| Top |
| * This plots show the correlation between CNV and gene expression. |
: Open all plots for all cancer types
 |
|
 |
|

| Top |
| Gene-Gene Network Information |
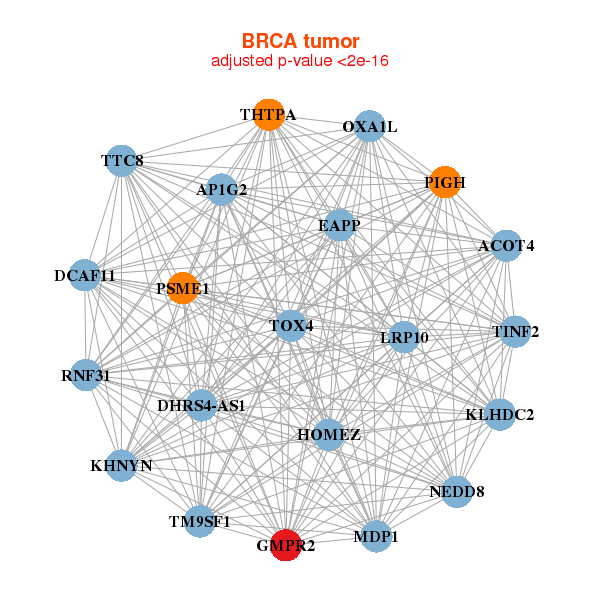
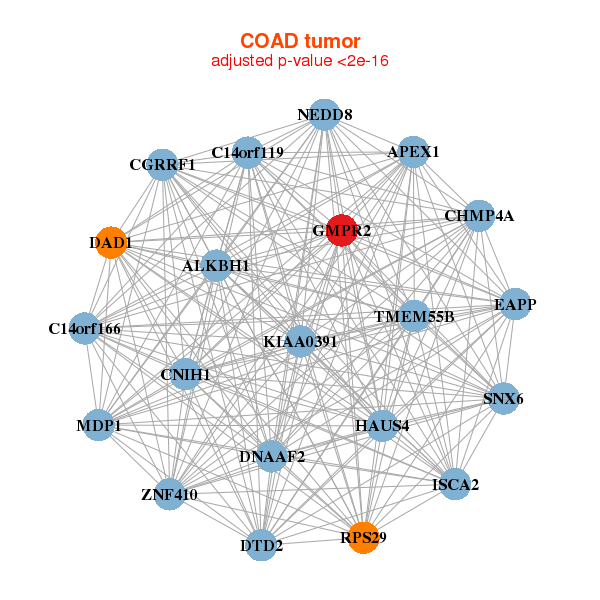
| * Co-Expression network figures were drawn using R package igraph. Only the top 20 genes with the highest correlations were shown. Red circle: input gene, orange circle: cell metabolism gene, sky circle: other gene |
: Open all plots for all cancer types
 |
|
| ACOT4,AP1G2,DHRS4-AS1,DCAF11,EAPP,GMPR2,HOMEZ, KHNYN,KLHDC2,LRP10,MDP1,NEDD8,OXA1L,PIGH, PSME1,RNF31,THTPA,TINF2,TM9SF1,TOX4,TTC8 | ARMCX6,C10orf35,C11orf52,C14orf93,DALRD3,DGCR2,DNAL4, ELMO3,FBL,GMPR2,ING4,MED29,MRFAP1L1,MRPL49, NR2C2AP,PRKCZ,RAB25,RPL3,SPINT2,STK16,TTLL1 |
 |
|
| ALKBH1,APEX1,DNAAF2,C14orf119,DTD2,C14orf166,CGRRF1, CHMP4A,CNIH1,DAD1,EAPP,GMPR2,HAUS4,ISCA2, KIAA0391,MDP1,NEDD8,RPS29,SNX6,TMEM55B,ZNF410 | BLOC1S1,TEN1,LINC00324,RPP25L,CCNDBP1,CHMP5,DERA, EAPP,GABARAP,GMPR2,HINFP,HOXB7,MAT2B,OAZ1, LAMTOR2,SAT1,TMEM219,TMEM59,UBAC2,VPS28,ZNF706 |
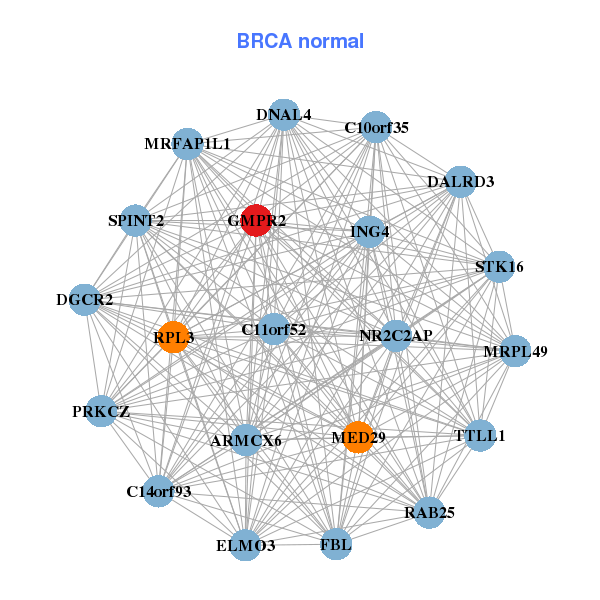
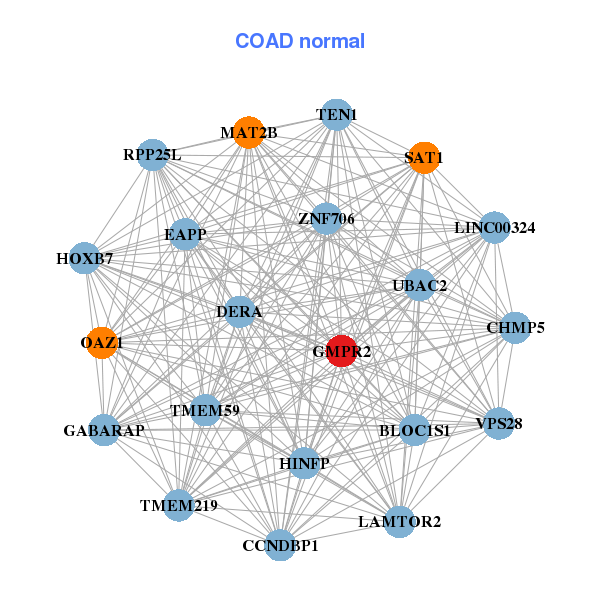
| * Co-Expression network figures were drawn using R package igraph. Only the top 20 genes with the highest correlations were shown. Red circle: input gene, orange circle: cell metabolism gene, sky circle: other gene |
: Open all plots for all cancer types
| Top |
: Open all interacting genes' information including KEGG pathway for all interacting genes from DAVID
| Top |
| Pharmacological Information for GMPR2 |
| There's no related Drug. |
| Top |
| Cross referenced IDs for GMPR2 |
| * We obtained these cross-references from Uniprot database. It covers 150 different DBs, 18 categories. http://www.uniprot.org/help/cross_references_section |
: Open all cross reference information
|
Copyright © 2016-Present - The Univsersity of Texas Health Science Center at Houston @ |