|
|||||||||||||||||||||||||||||||||||||||||||||||||||||||||||||||||||||||||||||||||||||||||||||||||||||||||||||||||||||||||||||||||||||||||||||||||||||||||||||||||||||||||||||||||||||||||||||||||||||||||||||||||||||||||||||||||||||||||||||||||||||||||||||||||||||||||||||||||||||||||||||||||||||||||||||||||||||||||||||||||||||||||||||||||||||||||||||||
| |
| Phenotypic Information (metabolism pathway, cancer, disease, phenome) |
| |
| |
| Gene-Gene Network Information: Co-Expression Network, Interacting Genes & KEGG |
| |
|


| Gene Summary for PDE1A |
| Top |
| Phenotypic Information for PDE1A(metabolism pathway, cancer, disease, phenome) |
| Cancer | CGAP: PDE1A |
| Familial Cancer Database: PDE1A | |
| * This gene is included in those cancer gene databases. |
|
|
|
|
|
| . | |||||||||||||||||||||||||||||||||||||||||||||||||||||||||||||||||||||||||||||||||||||||||||||||||||||||||||||||||||||||||||||||||||||||||||||||||||||||||||||||||||||||||||||||||||||||||||||||||||||||||||||||||||||||||||||||||||||||||||||||||||||||||||||||||||||||||||||||||||||||||||||||||||||||||||||||||||||||||||||||||||||||||||||||||||||||||
Oncogene 1 | Significant driver gene in | ||||||||||||||||||||||||||||||||||||||||||||||||||||||||||||||||||||||||||||||||||||||||||||||||||||||||||||||||||||||||||||||||||||||||||||||||||||||||||||||||||||||||||||||||||||||||||||||||||||||||||||||||||||||||||||||||||||||||||||||||||||||||||||||||||||||||||||||||||||||||||||||||||||||||||||||||||||||||||||||||||||||||||||||||||||||||||||||
| cf) number; DB name 1 Oncogene; http://nar.oxfordjournals.org/content/35/suppl_1/D721.long, 2 Tumor Suppressor gene; https://bioinfo.uth.edu/TSGene/, 3 Cancer Gene Census; http://www.nature.com/nrc/journal/v4/n3/abs/nrc1299.html, 4 CancerGenes; http://nar.oxfordjournals.org/content/35/suppl_1/D721.long, 5 Network of Cancer Gene; http://ncg.kcl.ac.uk/index.php, 1Therapeutic Vulnerabilities in Cancer; http://cbio.mskcc.org/cancergenomics/statius/ |
| KEGG_PURINE_METABOLISM | |
| OMIM | |
| Orphanet | |
| Disease | KEGG Disease: PDE1A |
| MedGen: PDE1A (Human Medical Genetics with Condition) | |
| ClinVar: PDE1A | |
| Phenotype | MGI: PDE1A (International Mouse Phenotyping Consortium) |
| PhenomicDB: PDE1A | |
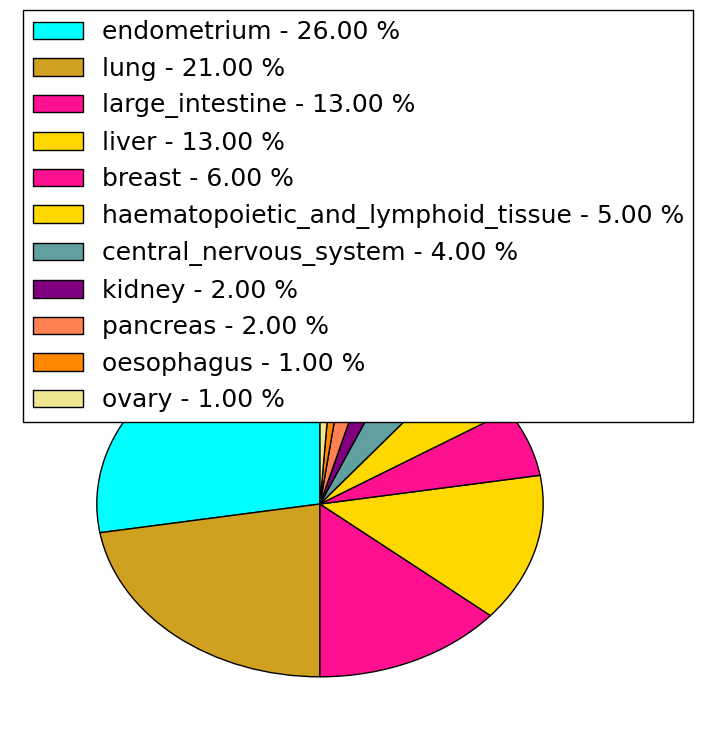
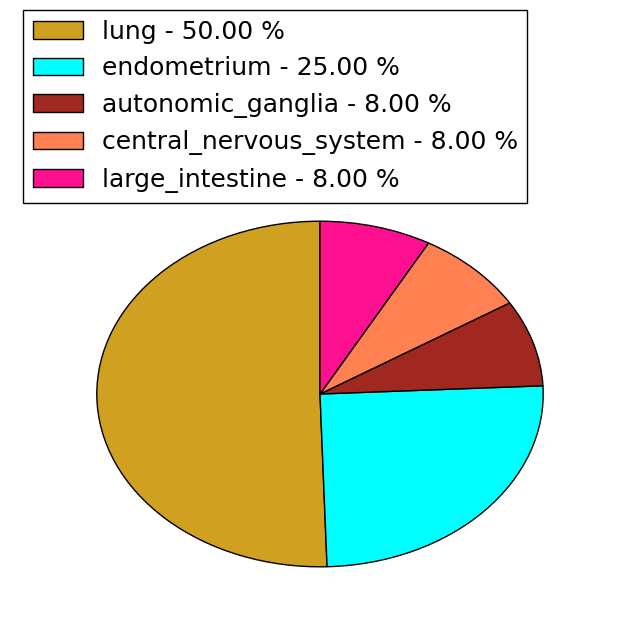
| Mutations for PDE1A |
| * Under tables are showing count per each tissue to give us broad intuition about tissue specific mutation patterns.You can go to the detailed page for each mutation database's web site. |
| - Statistics for Tissue and Mutation type | Top |
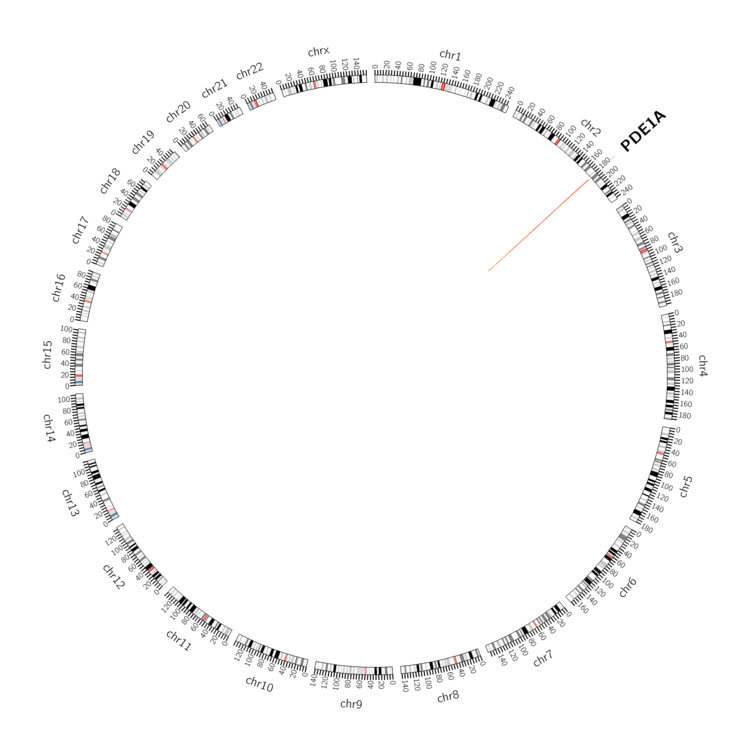 |
| - For Inter-chromosomal Variations |
| There's no inter-chromosomal structural variation. |
| - For Intra-chromosomal Variations |
| * Intra-chromosomal variantions includes 'intrachromosomal amplicon to amplicon', 'intrachromosomal amplicon to non-amplified dna', 'intrachromosomal deletion', 'intrachromosomal fold-back inversion', 'intrachromosomal inversion', 'intrachromosomal tandem duplication', 'Intrachromosomal unknown type', 'intrachromosomal with inverted orientation', 'intrachromosomal with non-inverted orientation'. |
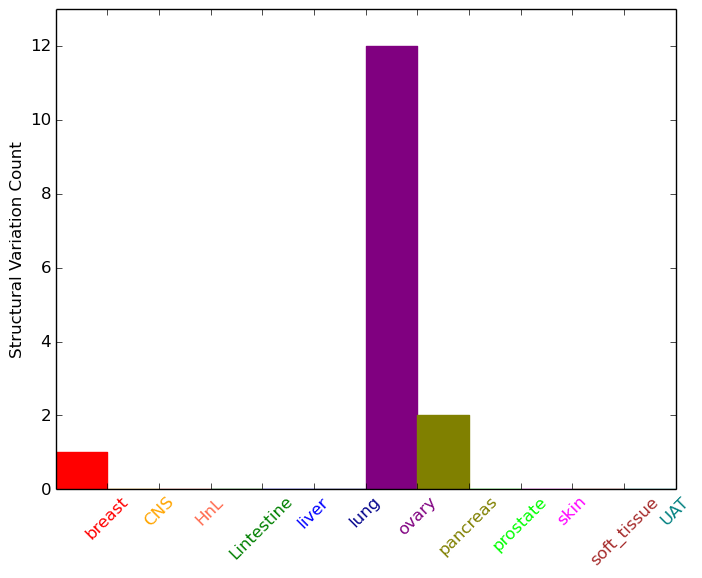 |
| Sample | Symbol_a | Chr_a | Start_a | End_a | Symbol_b | Chr_b | Start_b | End_b |
| breast | PDE1A | chr2 | 183109919 | 183109919 | PDE1A | chr2 | 183160405 | 183160405 |
| ovary | PDE1A | chr2 | 183096810 | 183096830 | chr2 | 182255924 | 182255944 | |
| ovary | PDE1A | chr2 | 183100158 | 183100178 | PDE1A | chr2 | 183100213 | 183100233 |
| ovary | PDE1A | chr2 | 183142203 | 183142223 | PDE1A | chr2 | 183132979 | 183132999 |
| ovary | PDE1A | chr2 | 183154196 | 183154396 | PDE1A | chr2 | 183153714 | 183153914 |
| ovary | PDE1A | chr2 | 183199308 | 183199328 | PDE1A | chr2 | 183203436 | 183203456 |
| ovary | PDE1A | chr2 | 183216139 | 183216159 | PDE1A | chr2 | 183225576 | 183225596 |
| ovary | PDE1A | chr2 | 183216144 | 183216164 | PDE1A | chr2 | 183225576 | 183225596 |
| ovary | PDE1A | chr2 | 183333201 | 183333221 | PDE1A | chr2 | 183333598 | 183333618 |
| pancreas | PDE1A | chr2 | 183044703 | 183044723 | PDE1A | chr2 | 183191703 | 183191723 |
| pancreas | PDE1A | chr2 | 183187964 | 183187984 | PDE1A | chr2 | 183192328 | 183192348 |
| cf) Tissue number; Tissue name (1;Breast, 2;Central_nervous_system, 3;Haematopoietic_and_lymphoid_tissue, 4;Large_intestine, 5;Liver, 6;Lung, 7;Ovary, 8;Pancreas, 9;Prostate, 10;Skin, 11;Soft_tissue, 12;Upper_aerodigestive_tract) |
| * From mRNA Sanger sequences, Chitars2.0 arranged chimeric transcripts. This table shows PDE1A related fusion information. |
| ID | Head Gene | Tail Gene | Accession | Gene_a | qStart_a | qEnd_a | Chromosome_a | tStart_a | tEnd_a | Gene_a | qStart_a | qEnd_a | Chromosome_a | tStart_a | tEnd_a |
| Top |
| Mutation type/ Tissue ID | brca | cns | cerv | endome | haematopo | kidn | Lintest | liver | lung | ns | ovary | pancre | prost | skin | stoma | thyro | urina | |||
| Total # sample | 2 | 4 | 5 | |||||||||||||||||
| GAIN (# sample) | 2 | 3 | 5 | |||||||||||||||||
| LOSS (# sample) | 1 |
| cf) Tissue ID; Tissue type (1; Breast, 2; Central_nervous_system, 3; Cervix, 4; Endometrium, 5; Haematopoietic_and_lymphoid_tissue, 6; Kidney, 7; Large_intestine, 8; Liver, 9; Lung, 10; NS, 11; Ovary, 12; Pancreas, 13; Prostate, 14; Skin, 15; Stomach, 16; Thyroid, 17; Urinary_tract) |
| Top |
|
 |
| Top |
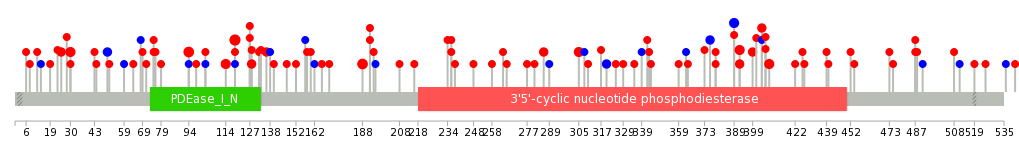
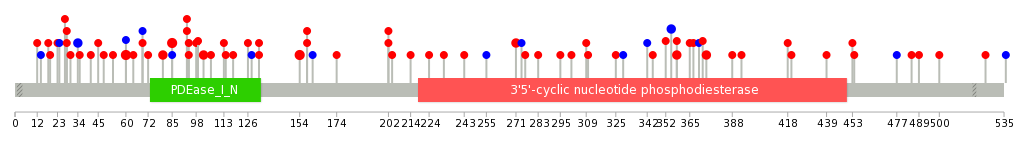
| Stat. for Non-Synonymous SNVs (# total SNVs=73) | (# total SNVs=12) |
 |  |
(# total SNVs=0) | (# total SNVs=0) |
| Top |
| * When you move the cursor on each content, you can see more deailed mutation information on the Tooltip. Those are primary_site,primary_histology,mutation(aa),pubmedID. |
| GRCh37 position | Mutation(aa) | Unique sampleID count |
| chr2:183053786-183053786 | p.G392E | 5 |
| chr2:183104955-183104955 | p.R94W | 5 |
| chr2:183104880-183104880 | p.R119W | 5 |
| chr2:183095762-183095762 | p.D188N | 4 |
| chr2:183066172-183066172 | p.F389F | 4 |
| chr2:183104895-183104895 | p.E114K | 3 |
| chr2:183070702-183070702 | p.M305I | 3 |
| chr2:183053739-183053739 | p.R408W | 3 |
| chr2:183387016-183387016 | p.R30C | 3 |
| chr2:183088673-183088673 | p.E248* | 2 |
| Top |
|
 |
| Point Mutation/ Tissue ID | 1 | 2 | 3 | 4 | 5 | 6 | 7 | 8 | 9 | 10 | 11 | 12 | 13 | 14 | 15 | 16 | 17 | 18 | 19 | 20 |
| # sample | 2 | 2 | 8 | 2 | 3 | 1 | 9 | 6 | 1 | 33 | 7 | 1 | 15 | |||||||
| # mutation | 2 | 2 | 8 | 2 | 3 | 1 | 9 | 6 | 1 | 31 | 7 | 1 | 17 | |||||||
| nonsynonymous SNV | 2 | 2 | 7 | 1 | 3 | 1 | 7 | 3 | 1 | 25 | 6 | 1 | 14 | |||||||
| synonymous SNV | 1 | 1 | 2 | 3 | 6 | 1 | 3 |
| cf) Tissue ID; Tissue type (1; BLCA[Bladder Urothelial Carcinoma], 2; BRCA[Breast invasive carcinoma], 3; CESC[Cervical squamous cell carcinoma and endocervical adenocarcinoma], 4; COAD[Colon adenocarcinoma], 5; GBM[Glioblastoma multiforme], 6; Glioma Low Grade, 7; HNSC[Head and Neck squamous cell carcinoma], 8; KICH[Kidney Chromophobe], 9; KIRC[Kidney renal clear cell carcinoma], 10; KIRP[Kidney renal papillary cell carcinoma], 11; LAML[Acute Myeloid Leukemia], 12; LUAD[Lung adenocarcinoma], 13; LUSC[Lung squamous cell carcinoma], 14; OV[Ovarian serous cystadenocarcinoma ], 15; PAAD[Pancreatic adenocarcinoma], 16; PRAD[Prostate adenocarcinoma], 17; SKCM[Skin Cutaneous Melanoma], 18:STAD[Stomach adenocarcinoma], 19:THCA[Thyroid carcinoma], 20:UCEC[Uterine Corpus Endometrial Carcinoma]) |
| Top |
| * We represented just top 10 SNVs. When you move the cursor on each content, you can see more deailed mutation information on the Tooltip. Those are primary_site, primary_histology, mutation(aa), pubmedID. |
| Genomic Position | Mutation(aa) | Unique sampleID count |
| chr2:183104955 | p.R60R,PDE1A | 4 |
| chr2:183053786 | p.D154N,PDE1A | 3 |
| chr2:183104880 | p.R85W,PDE1A | 3 |
| chr2:183095762 | p.G358V,PDE1A | 3 |
| chr2:183104855 | p.V34V,PDE1A | 2 |
| chr2:183066172 | p.A93G,PDE1A | 2 |
| chr2:183104895 | p.R374W,PDE1A | 2 |
| chr2:183129093 | p.E80K,PDE1A | 2 |
| chr2:183070702 | p.M271I,PDE1A | 2 |
| chr2:183099217 | p.F355F,PDE1A | 2 |
| * Copy number data were extracted from TCGA using R package TCGA-Assembler. The URLs of all public data files on TCGA DCC data server were gathered on Jan-05-2015. Function ProcessCNAData in TCGA-Assembler package was used to obtain gene-level copy number value which is calculated as the average copy number of the genomic region of a gene. |
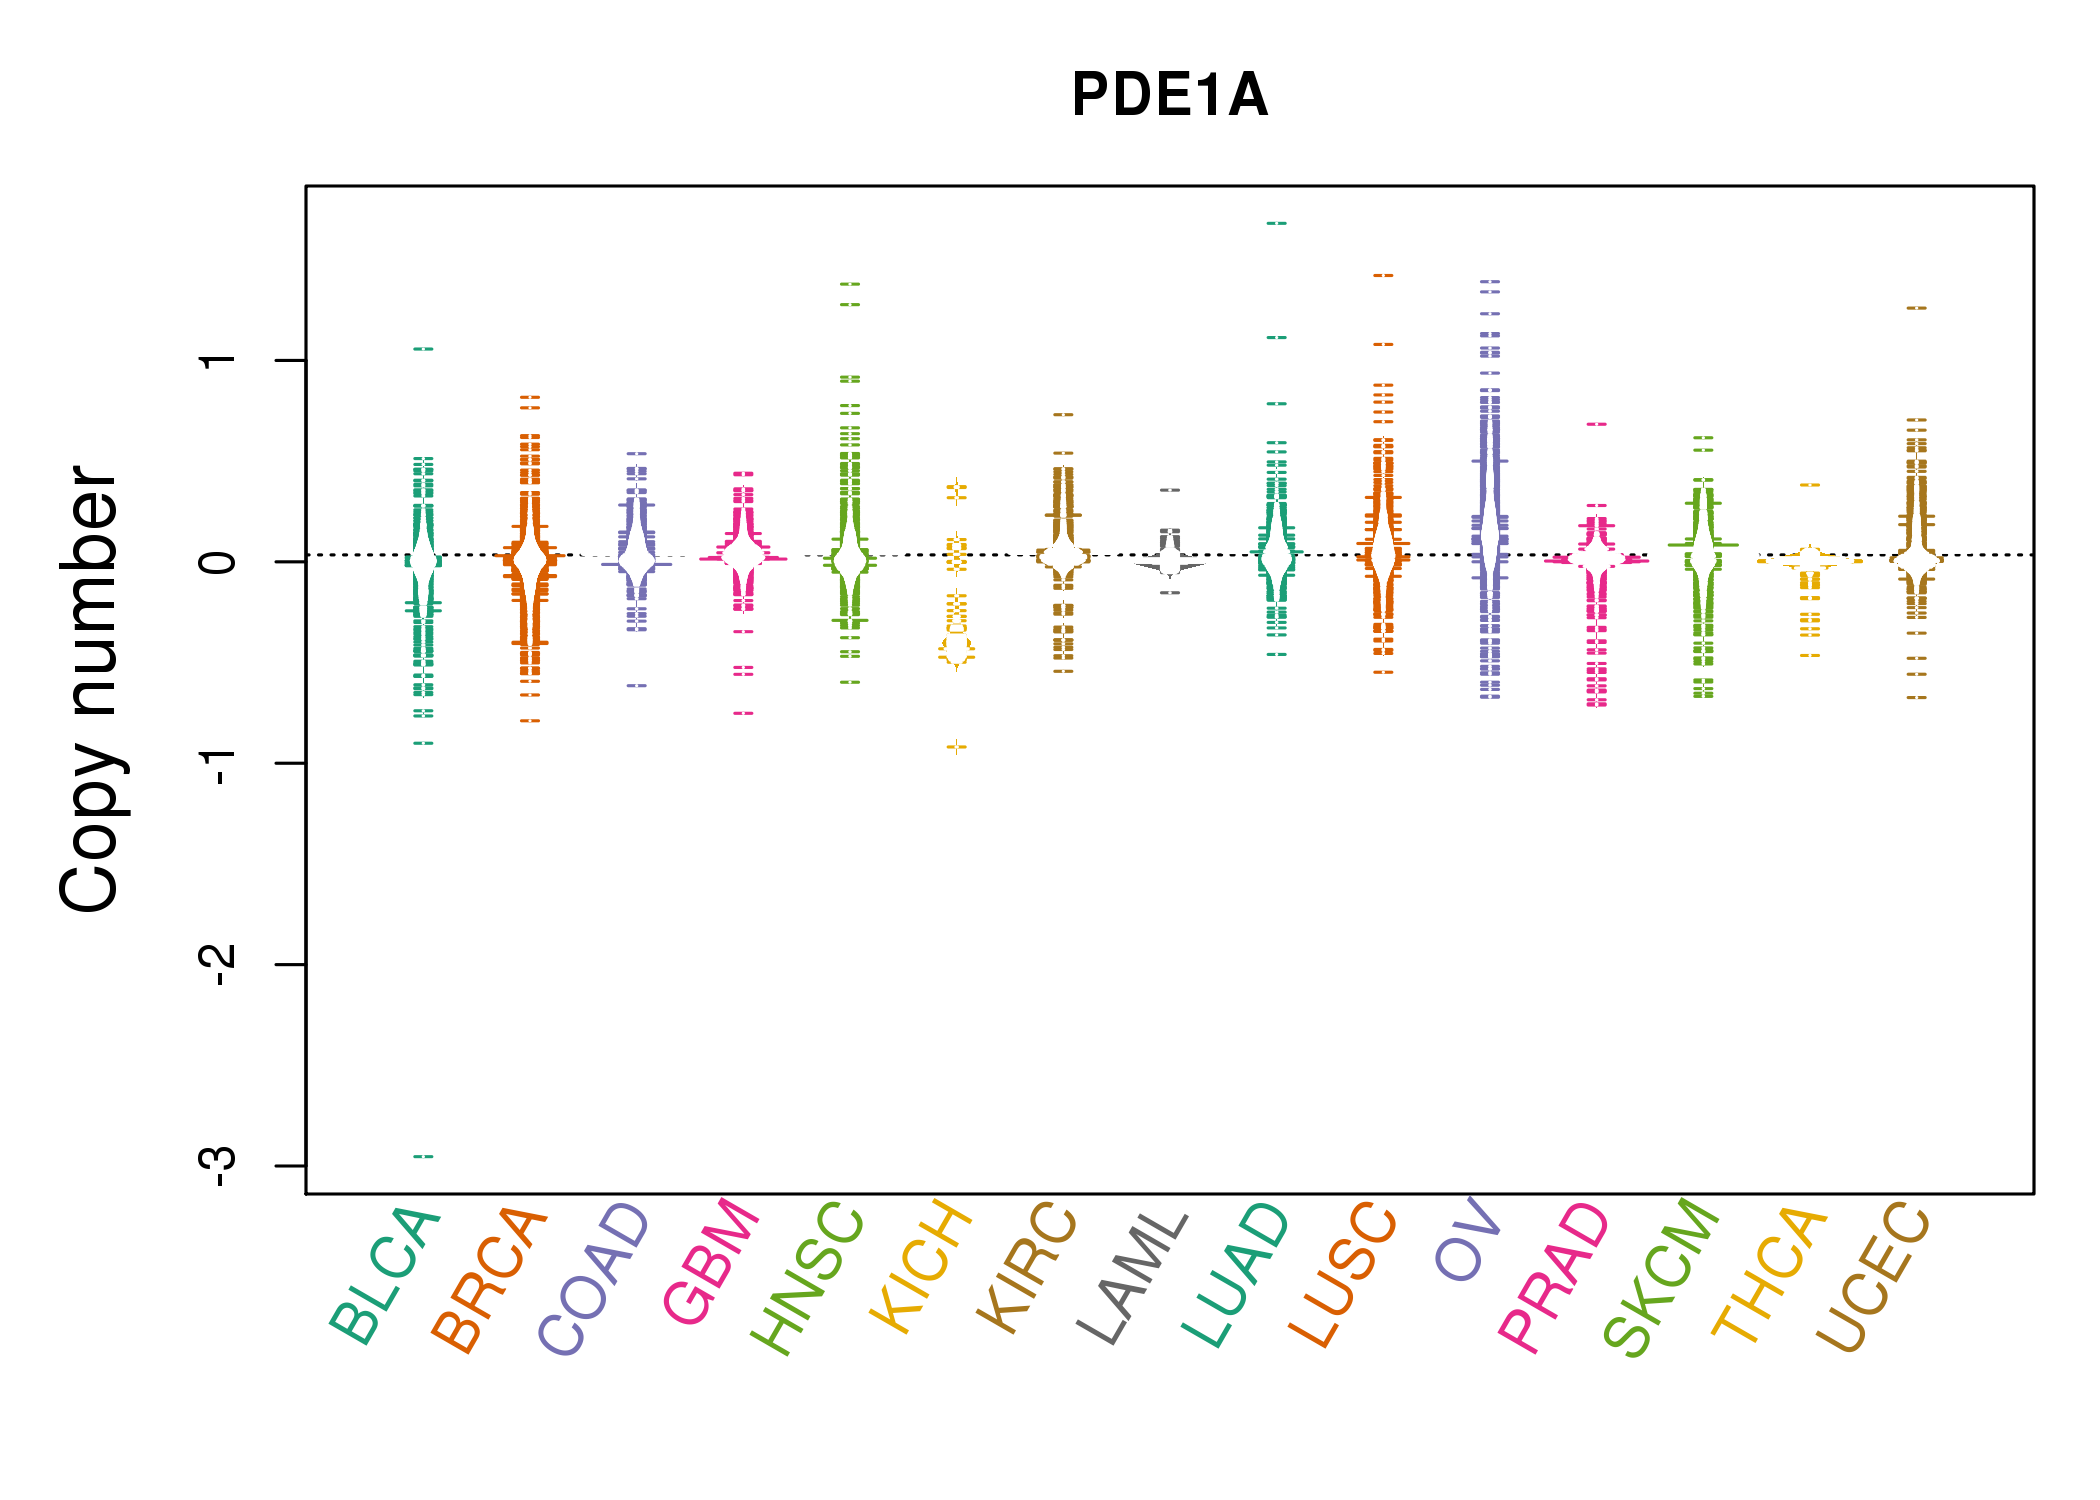 |
| cf) Tissue ID[Tissue type]: BLCA[Bladder Urothelial Carcinoma], BRCA[Breast invasive carcinoma], CESC[Cervical squamous cell carcinoma and endocervical adenocarcinoma], COAD[Colon adenocarcinoma], GBM[Glioblastoma multiforme], Glioma Low Grade, HNSC[Head and Neck squamous cell carcinoma], KICH[Kidney Chromophobe], KIRC[Kidney renal clear cell carcinoma], KIRP[Kidney renal papillary cell carcinoma], LAML[Acute Myeloid Leukemia], LUAD[Lung adenocarcinoma], LUSC[Lung squamous cell carcinoma], OV[Ovarian serous cystadenocarcinoma ], PAAD[Pancreatic adenocarcinoma], PRAD[Prostate adenocarcinoma], SKCM[Skin Cutaneous Melanoma], STAD[Stomach adenocarcinoma], THCA[Thyroid carcinoma], UCEC[Uterine Corpus Endometrial Carcinoma] |
| Top |
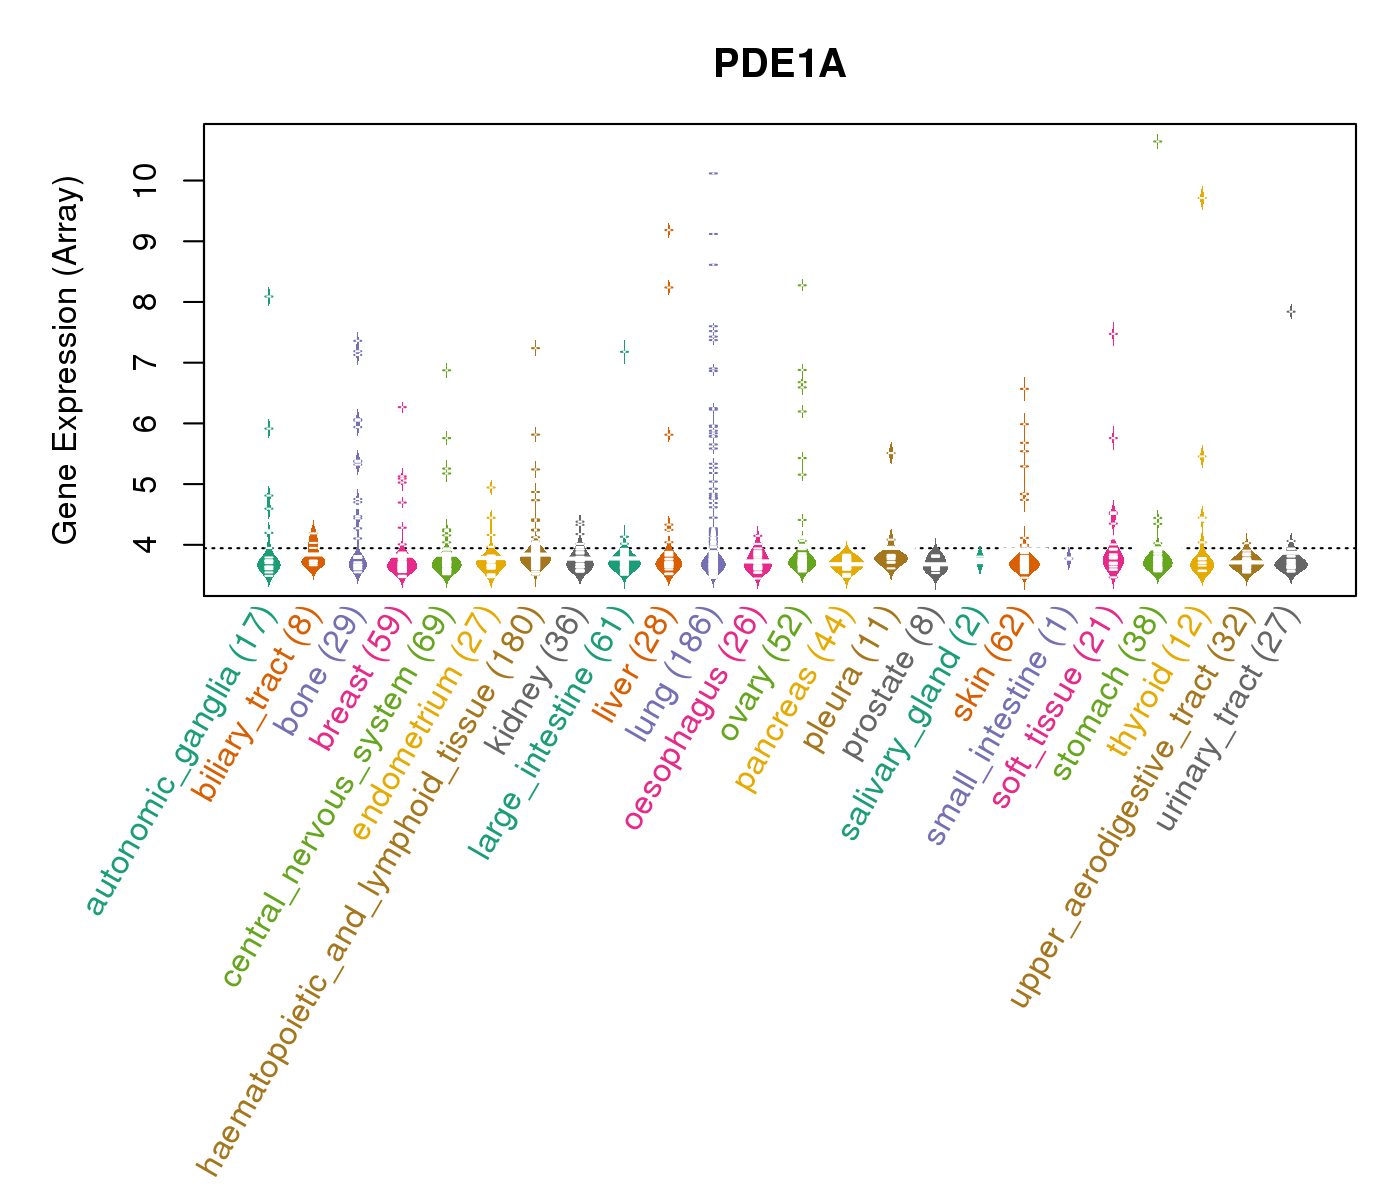
| Gene Expression for PDE1A |
| * CCLE gene expression data were extracted from CCLE_Expression_Entrez_2012-10-18.res: Gene-centric RMA-normalized mRNA expression data. |
 |
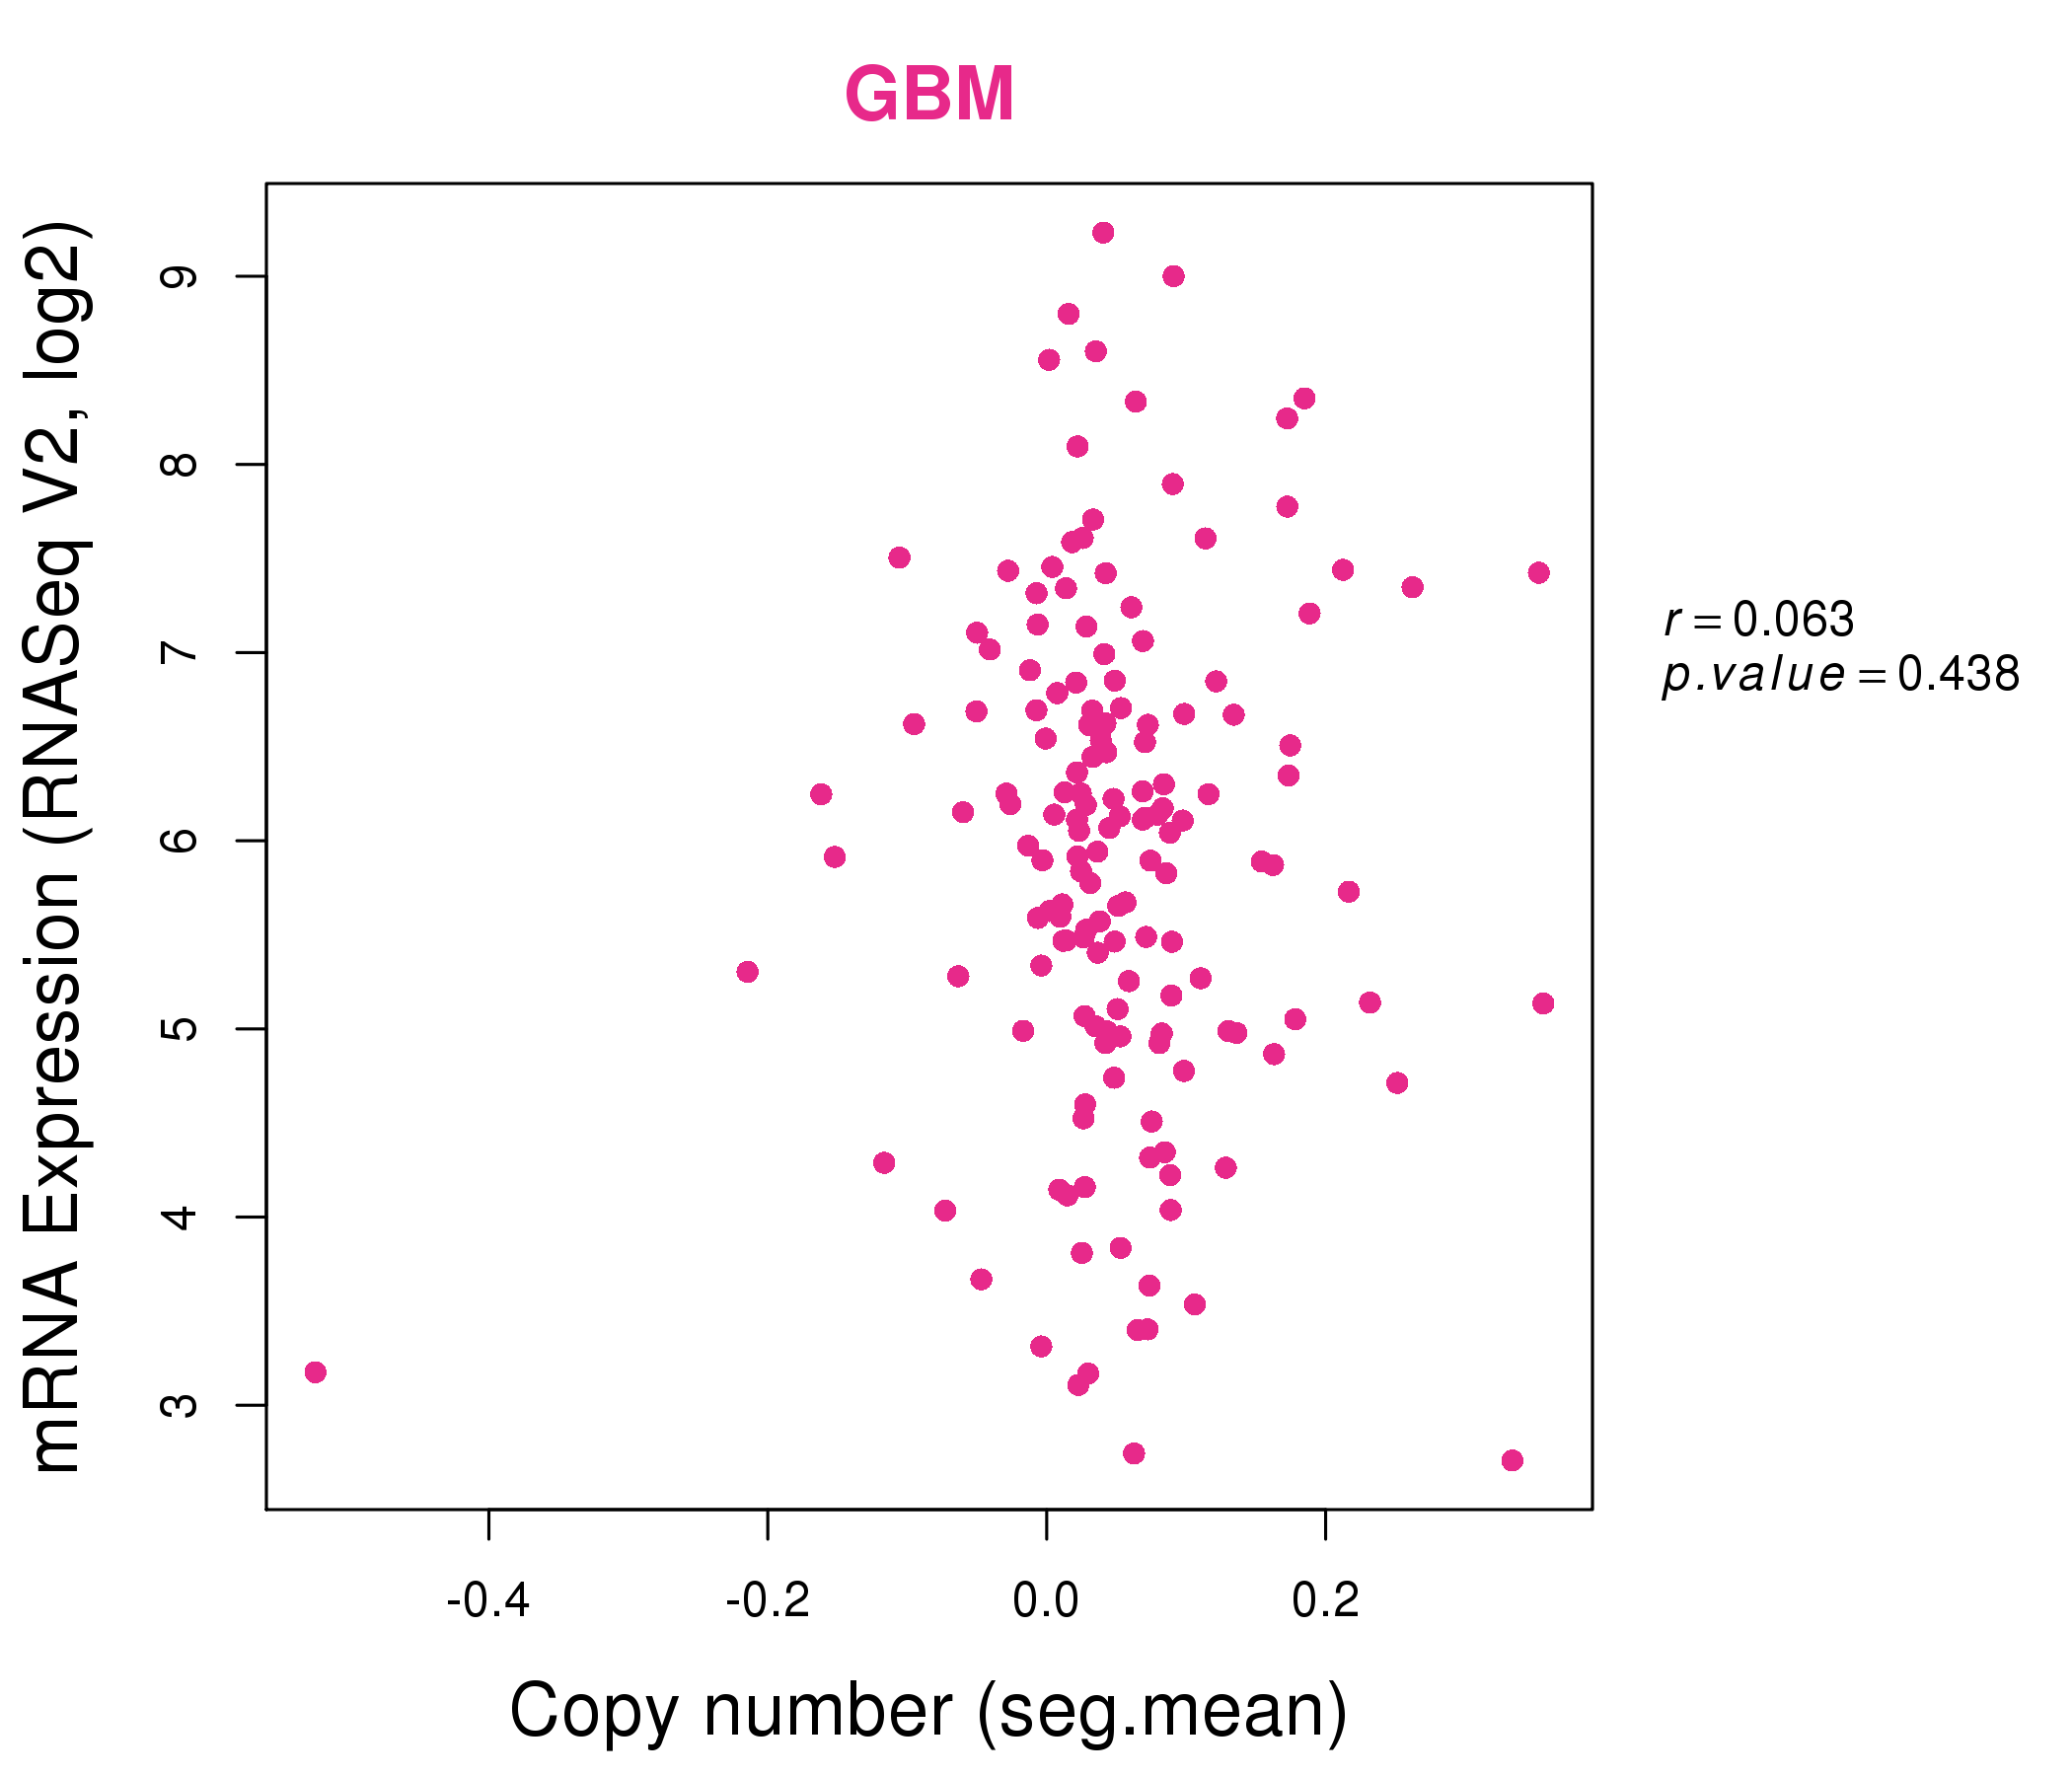
| * Normalized gene expression data of RNASeqV2 was extracted from TCGA using R package TCGA-Assembler. The URLs of all public data files on TCGA DCC data server were gathered at Jan-05-2015. Only eight cancer types have enough normal control samples for differential expression analysis. (t test, adjusted p<0.05 (using Benjamini-Hochberg FDR)) |
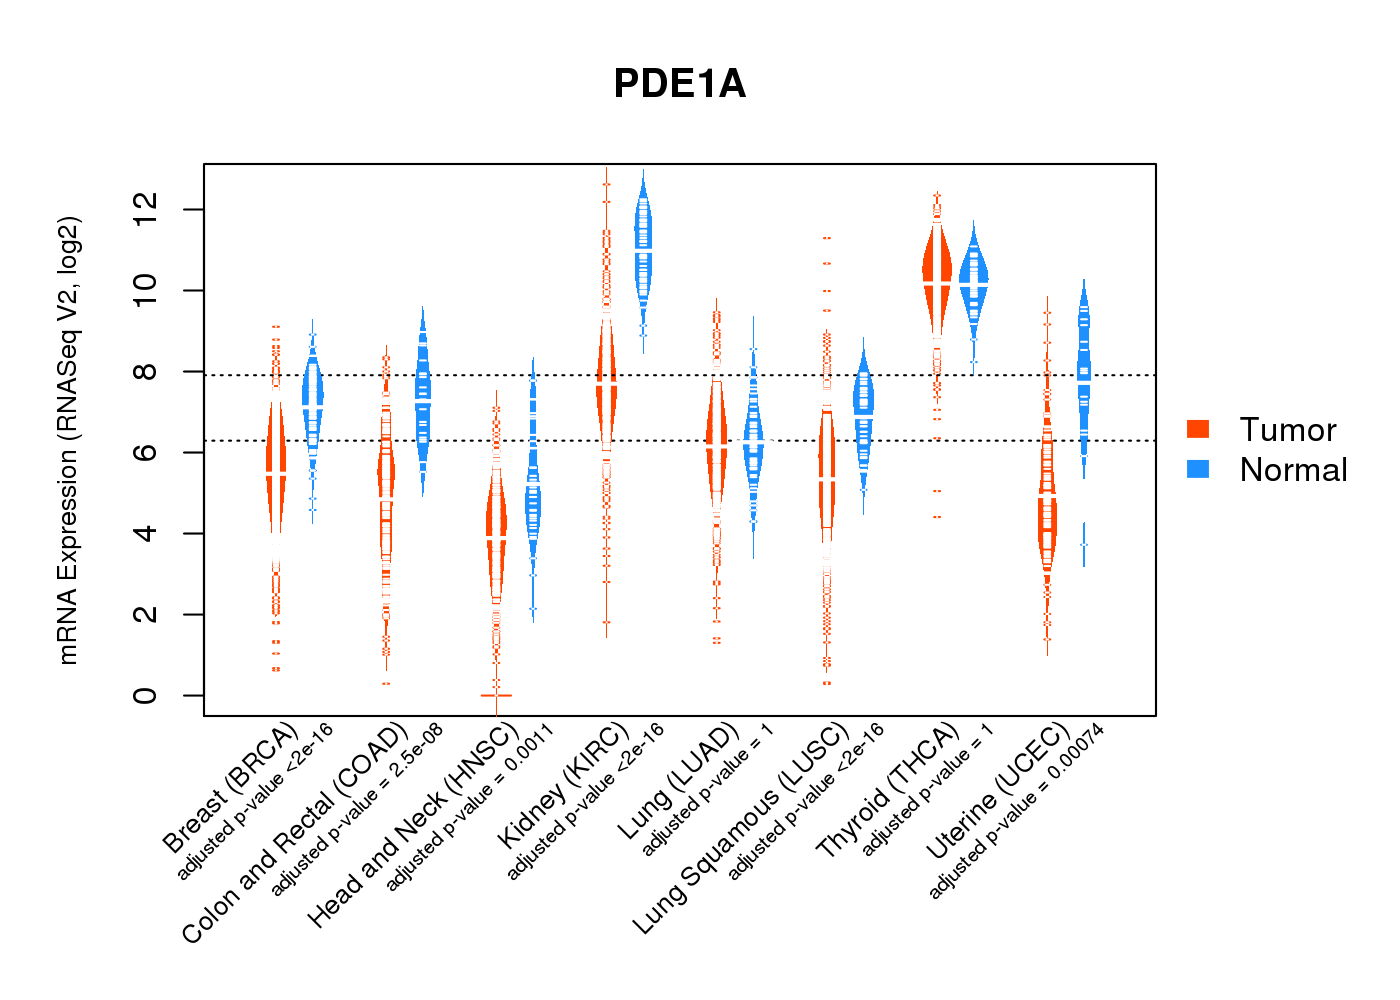 |
| Top |
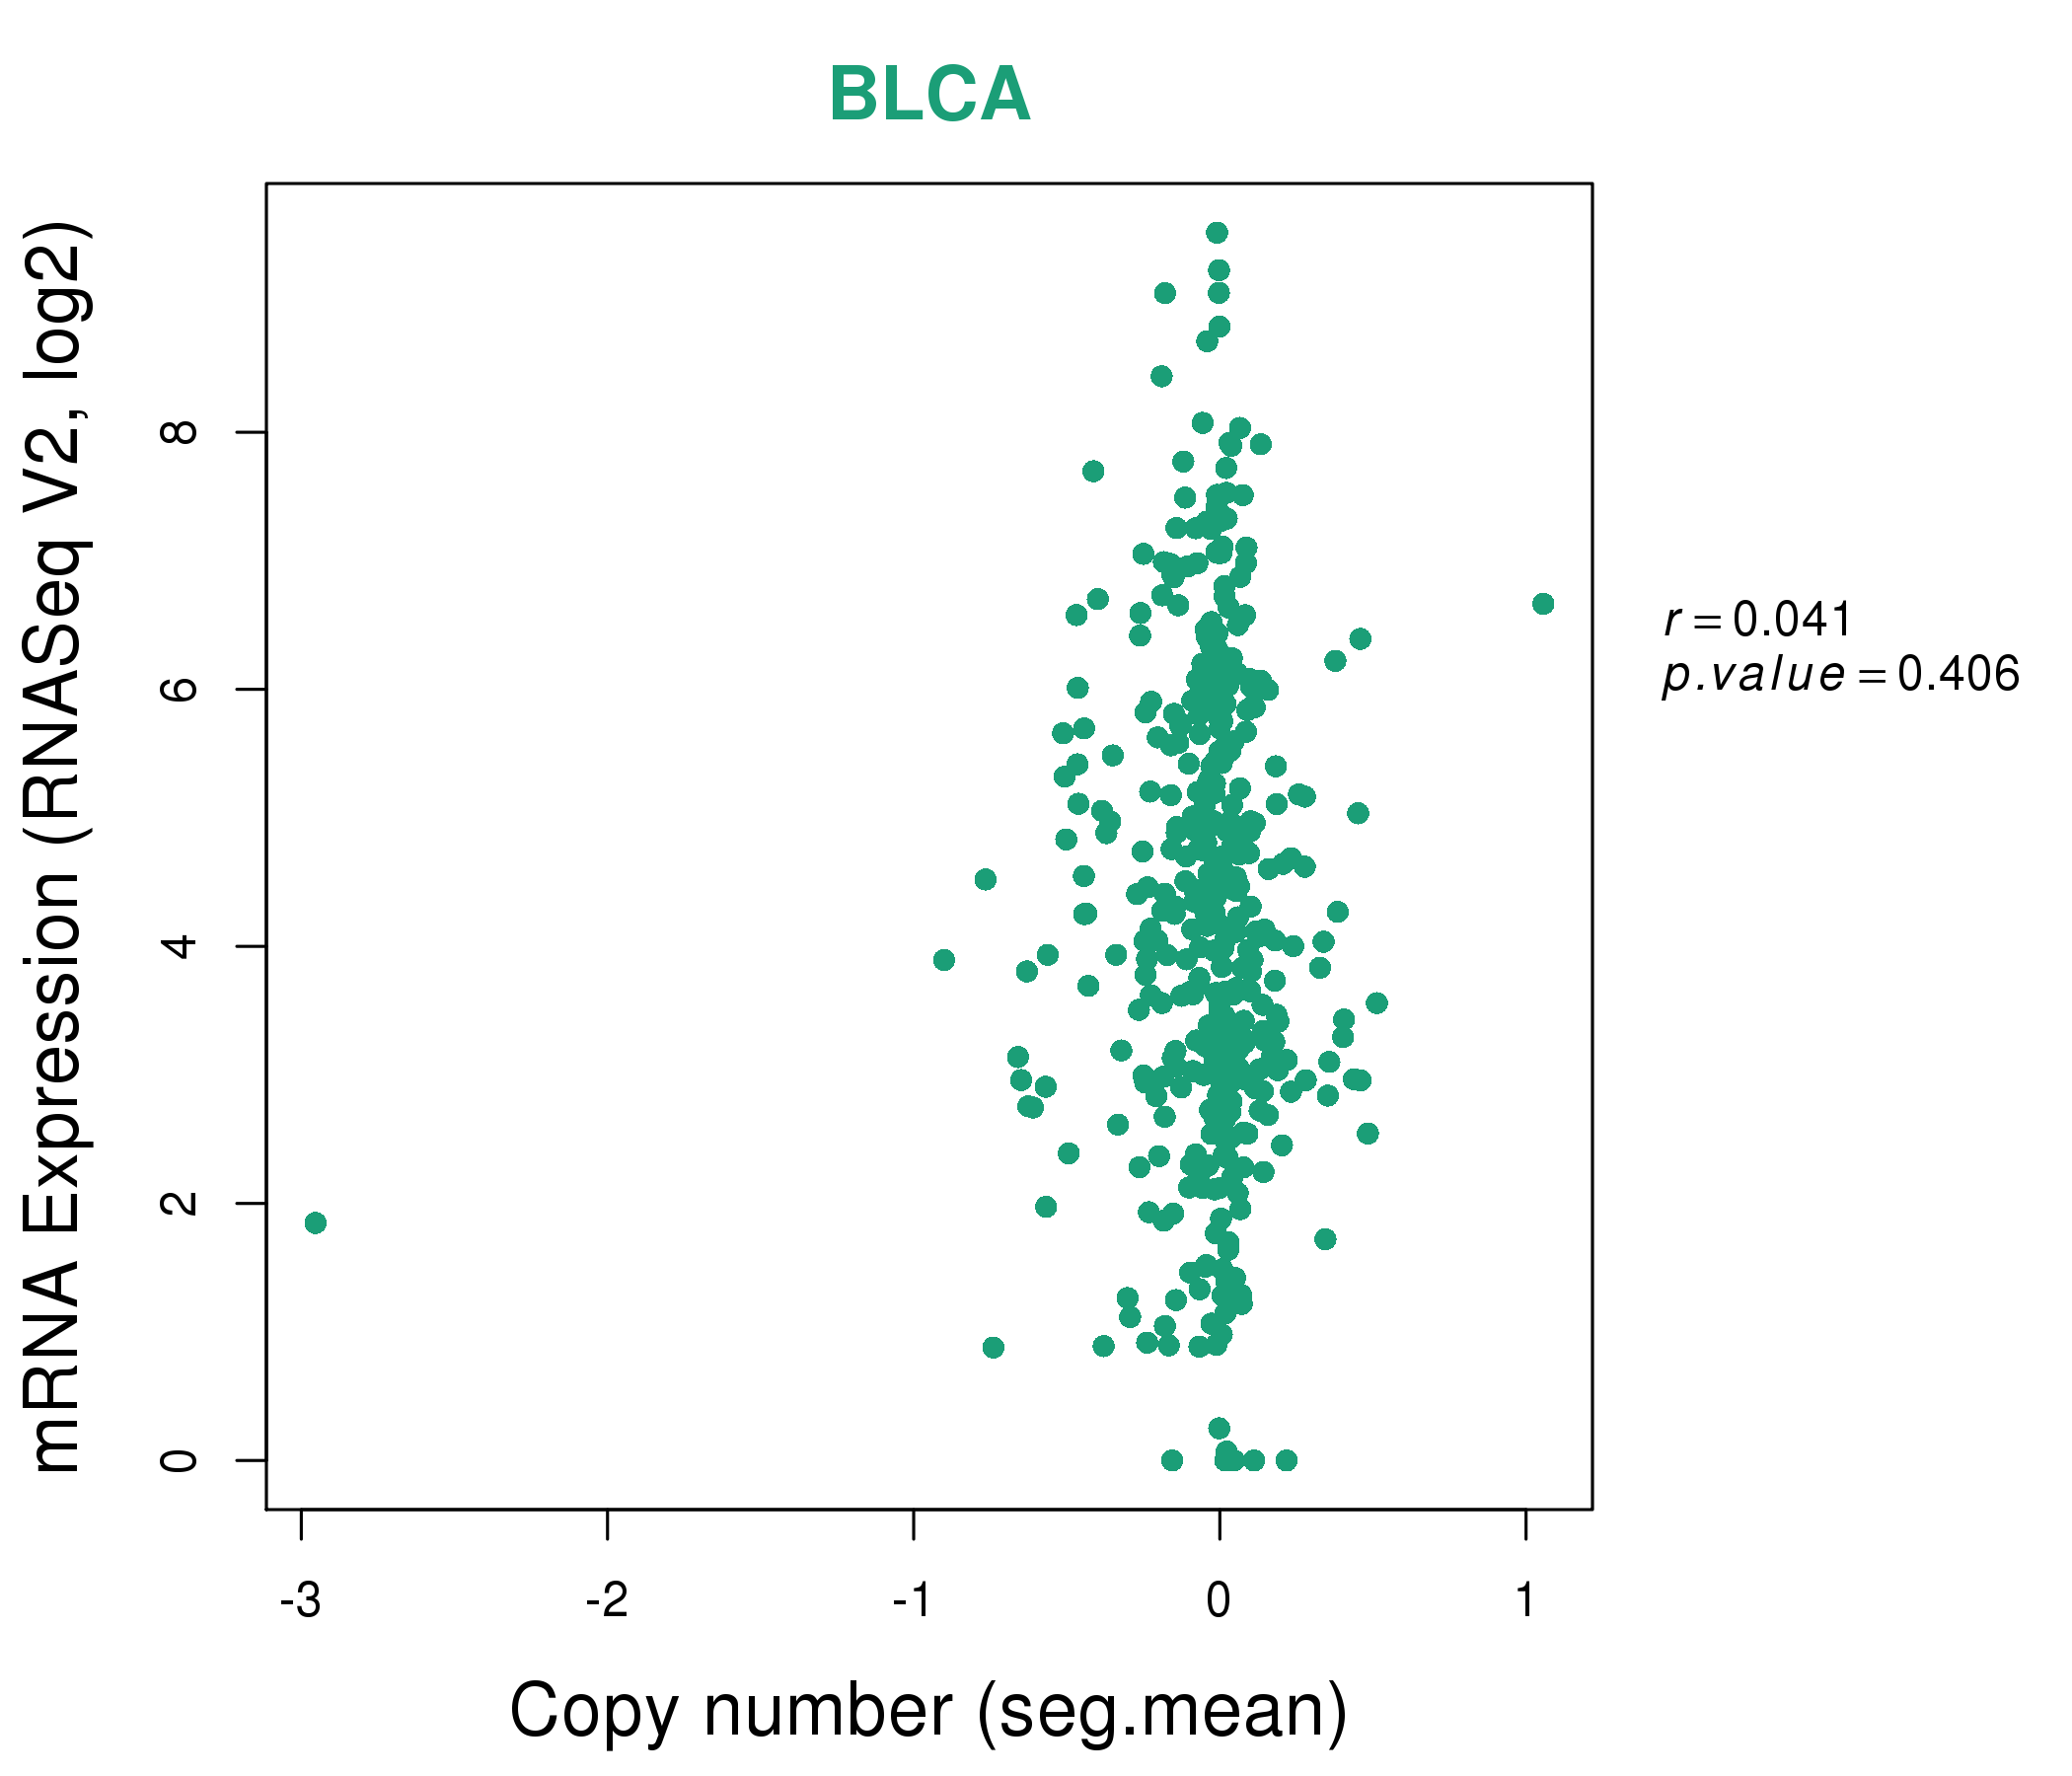
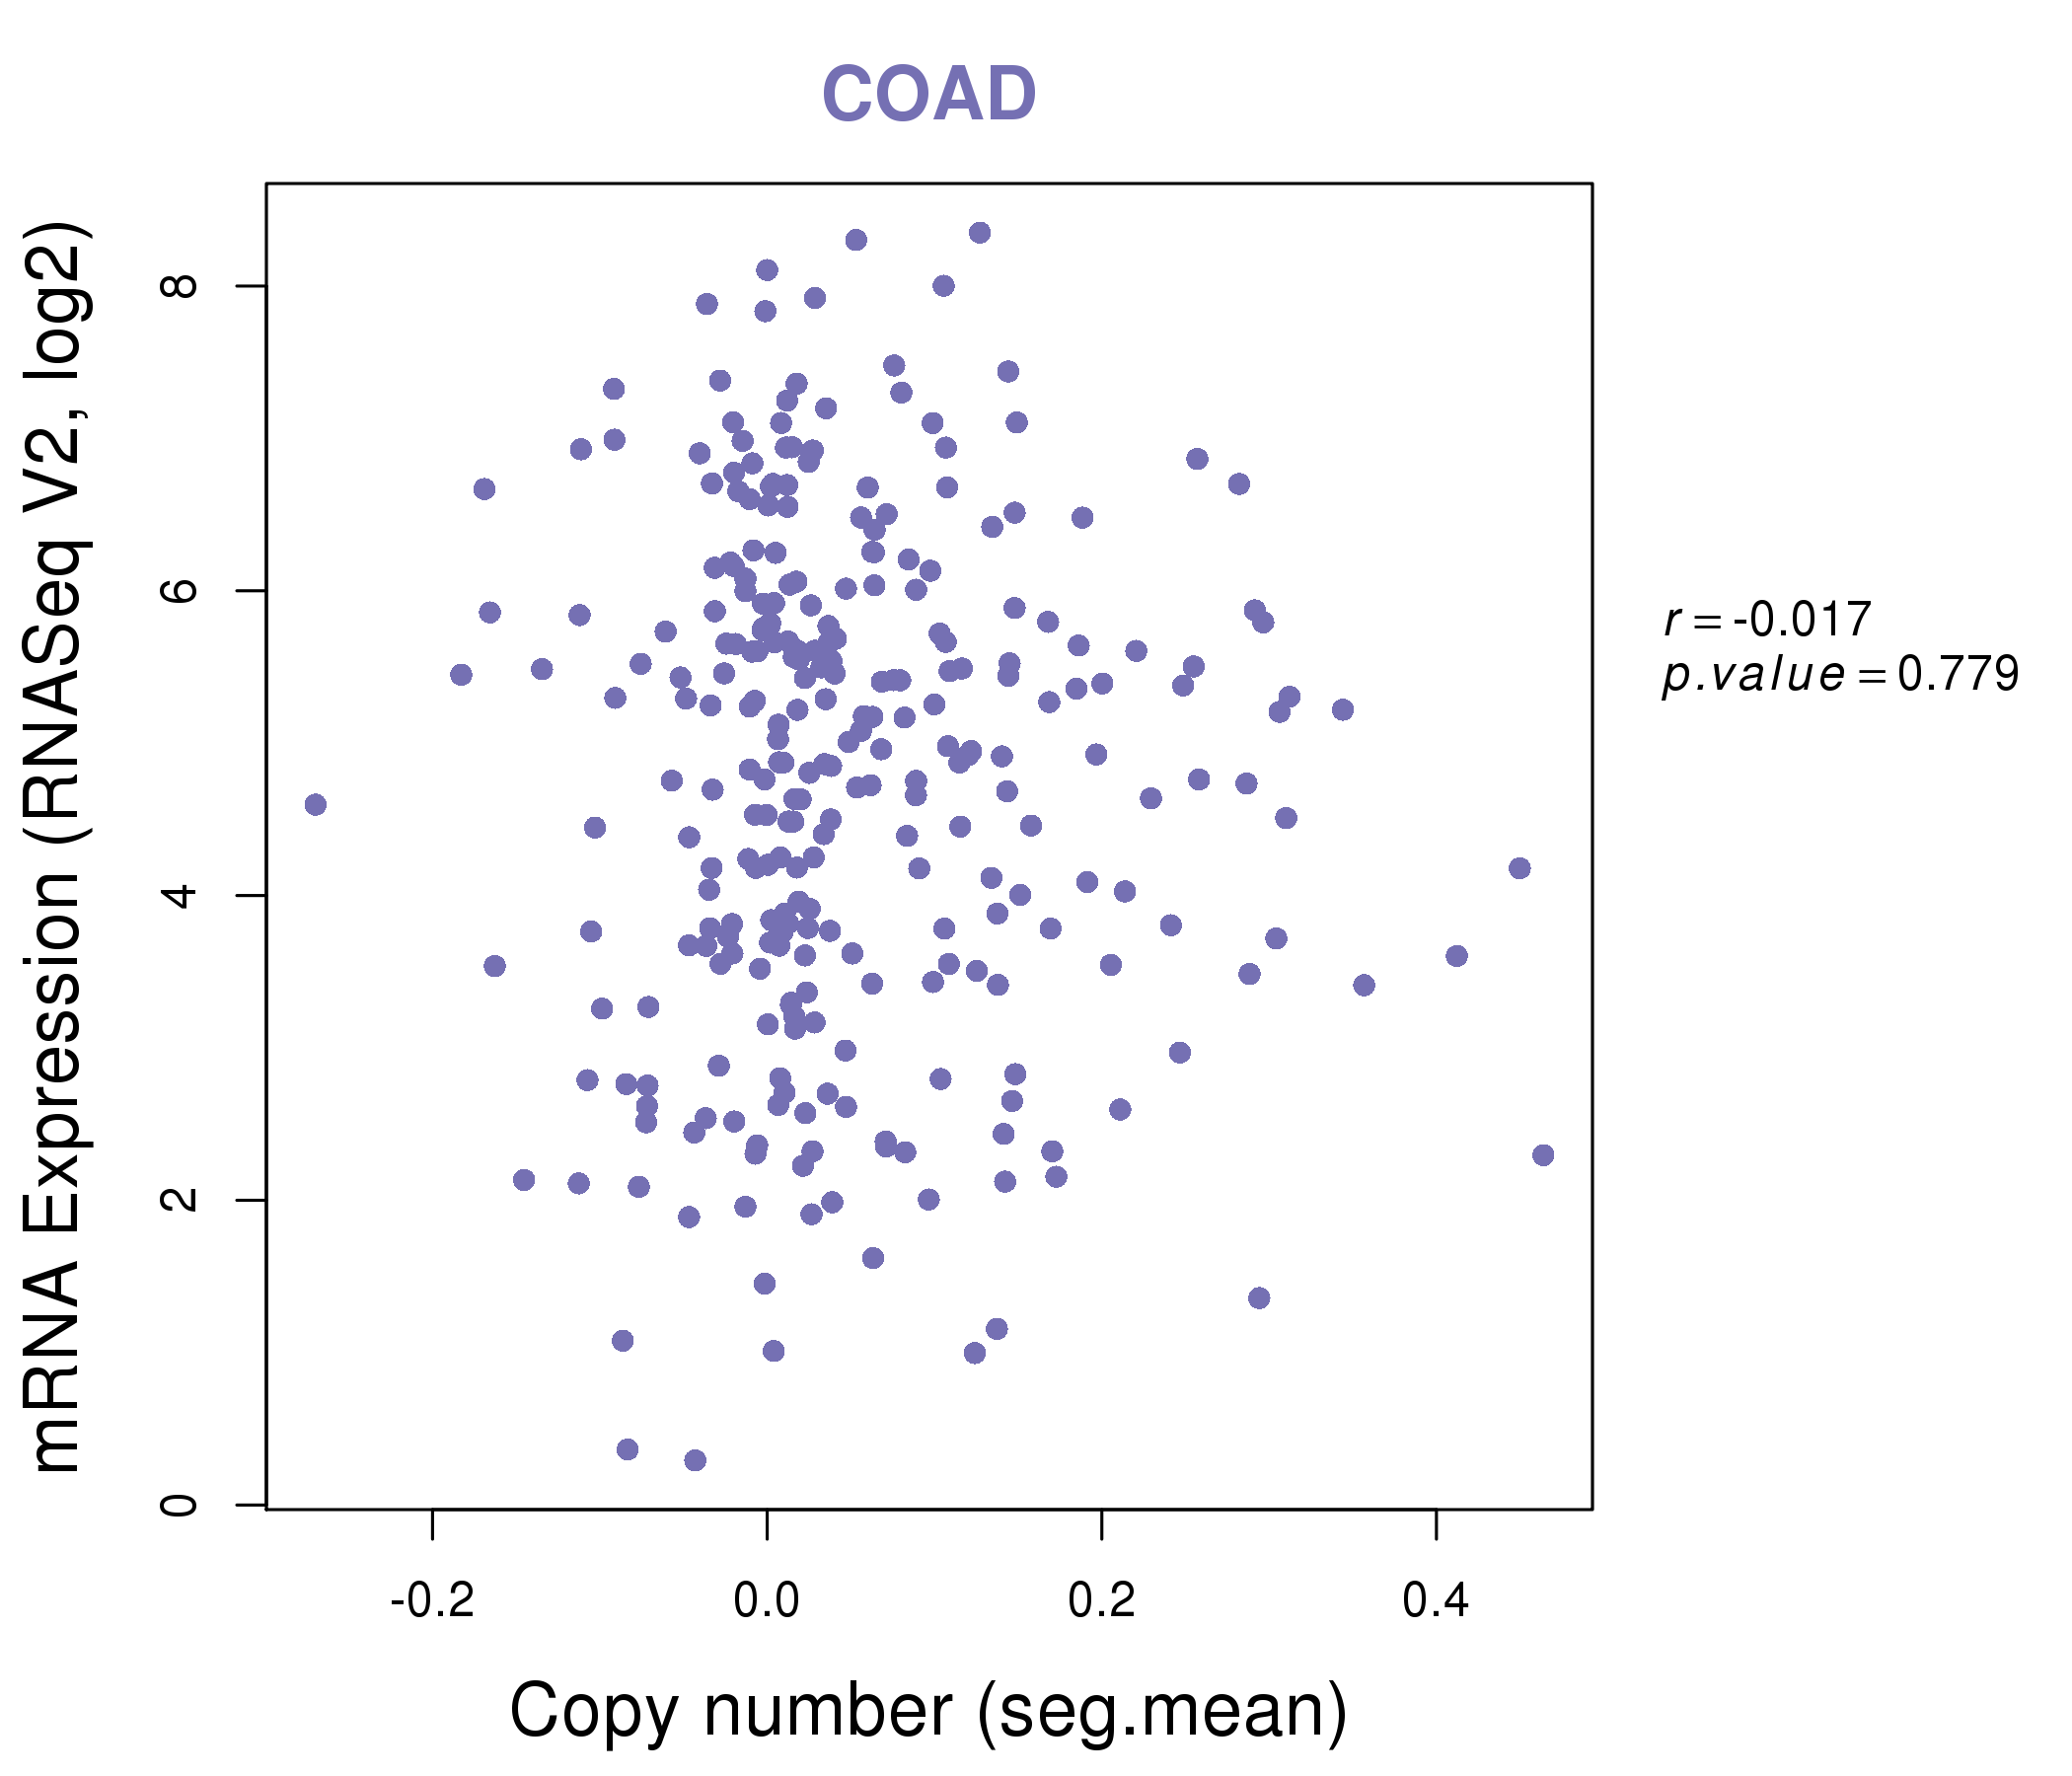
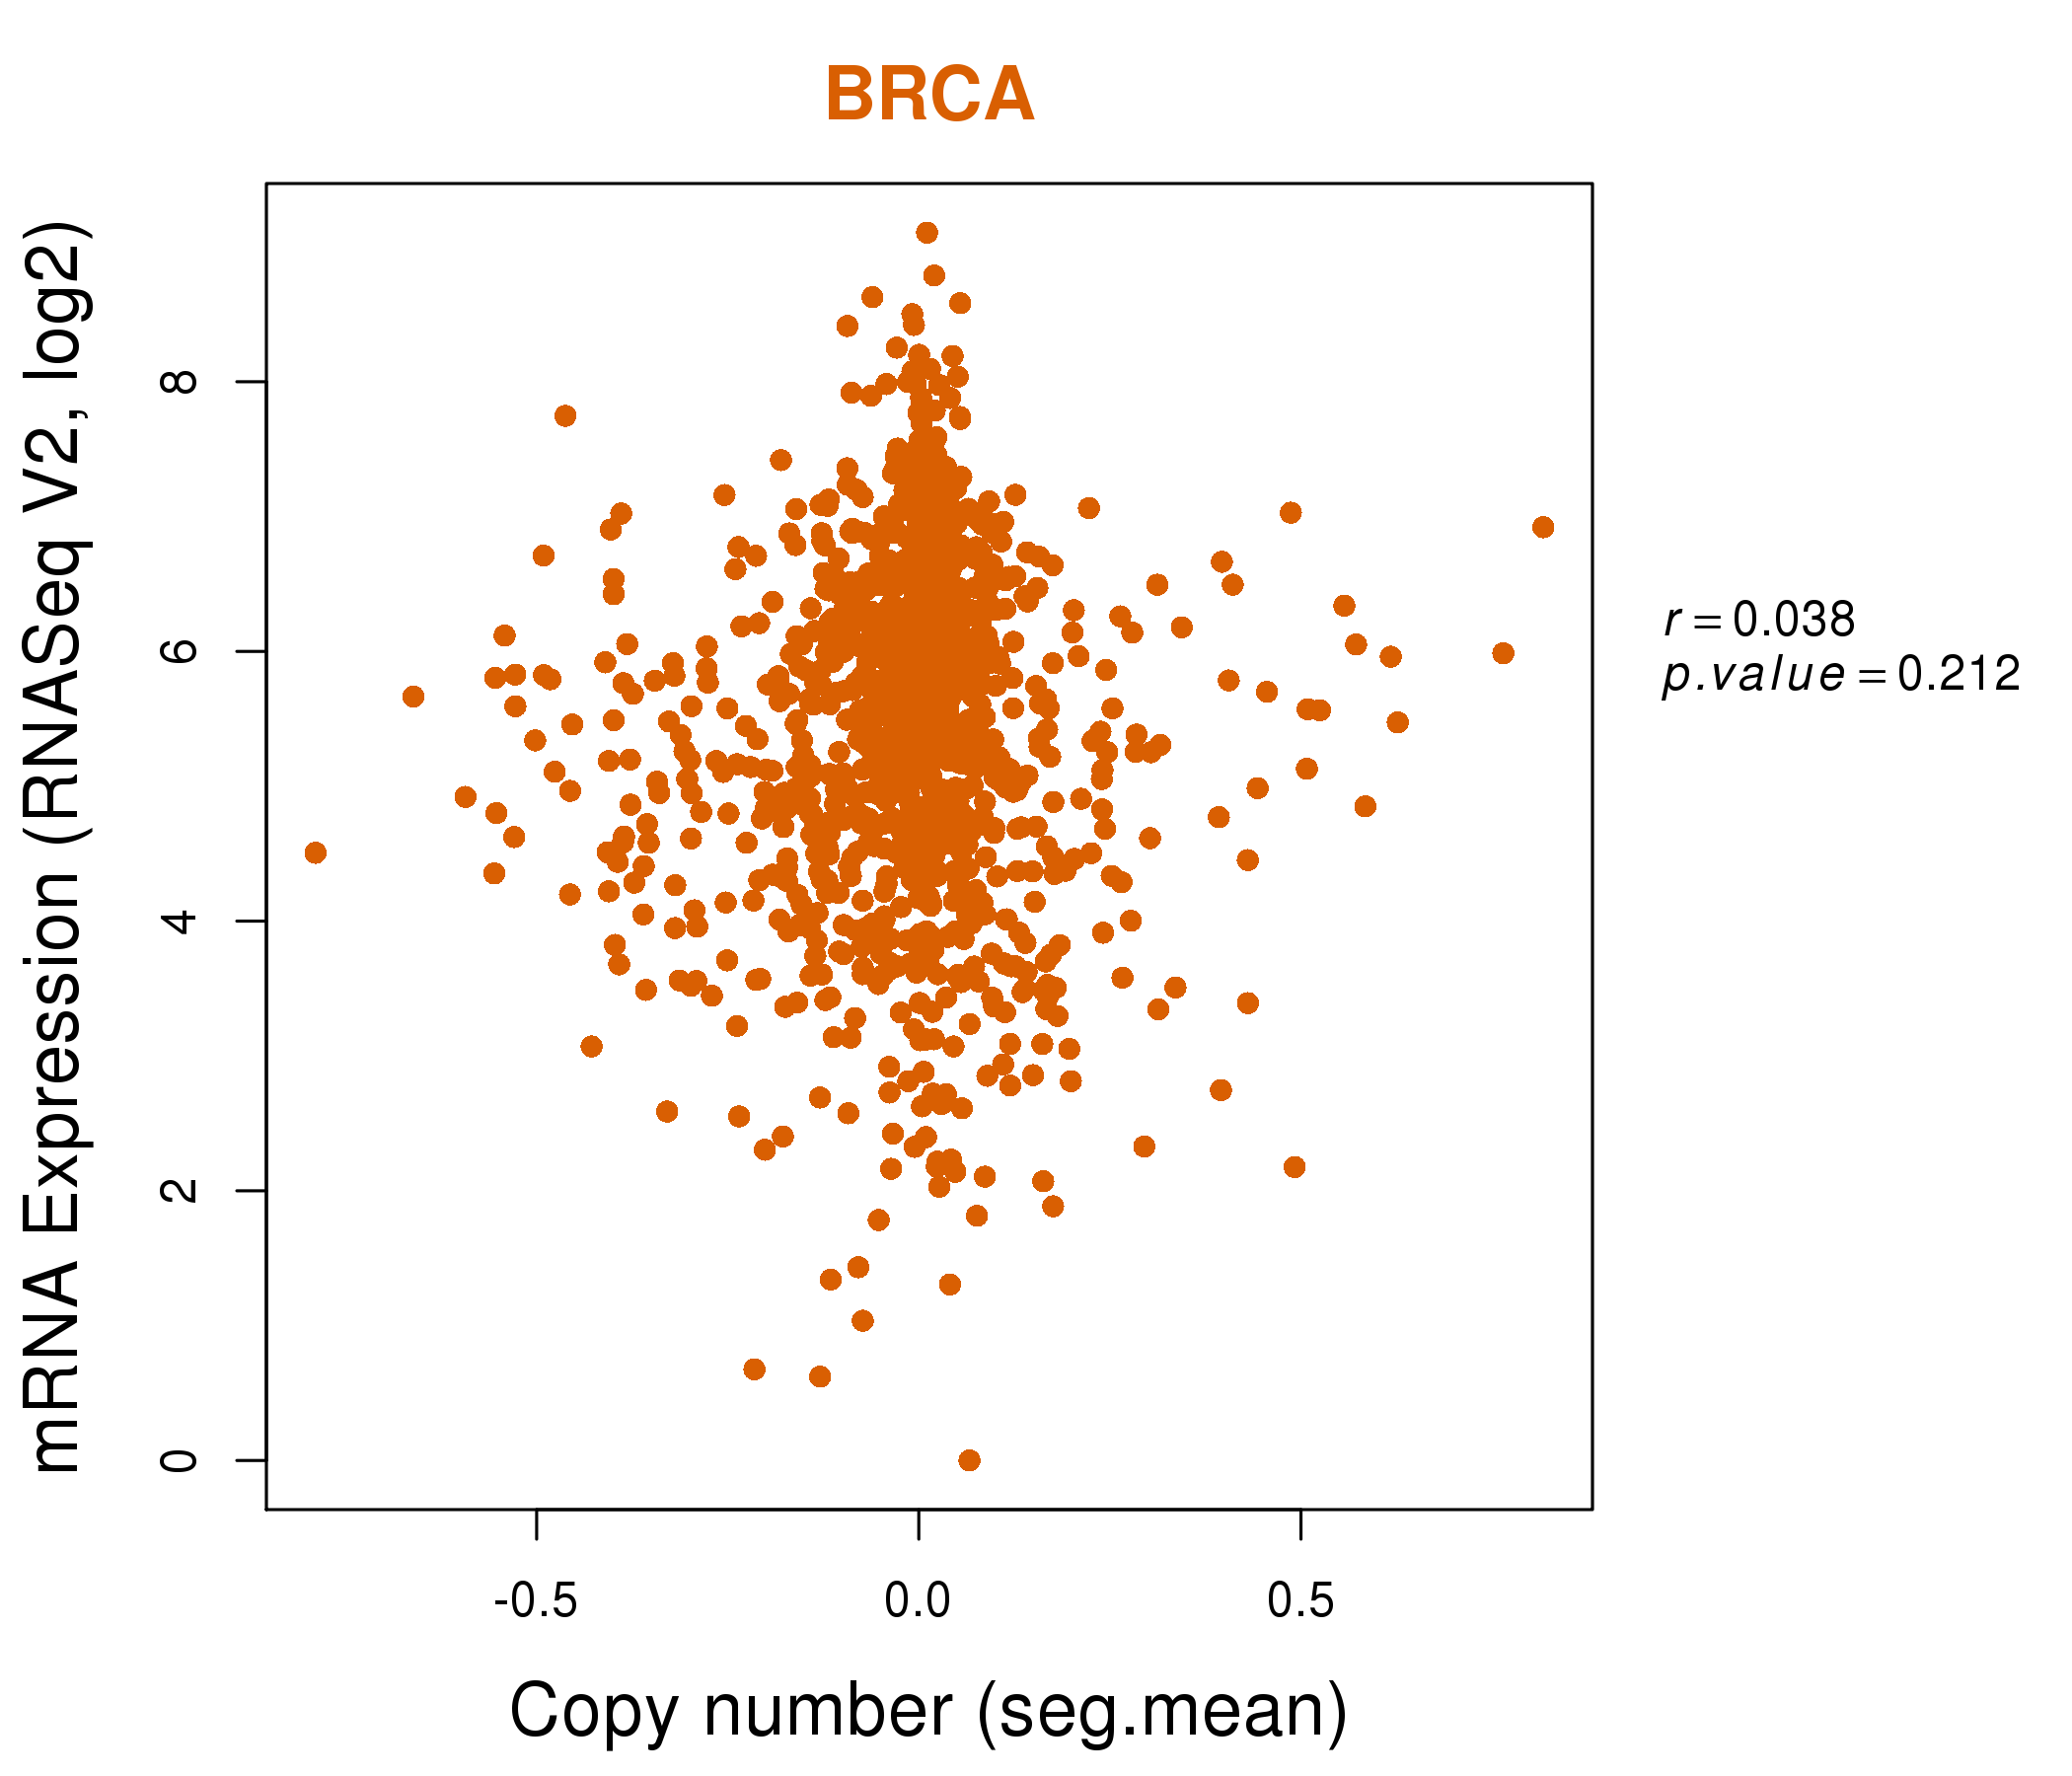
| * This plots show the correlation between CNV and gene expression. |
: Open all plots for all cancer types
 |
|
 |
|
| Top |
| Gene-Gene Network Information |
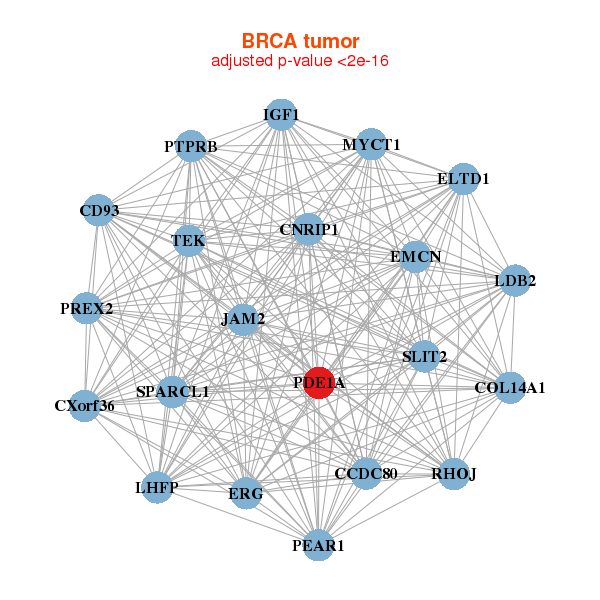
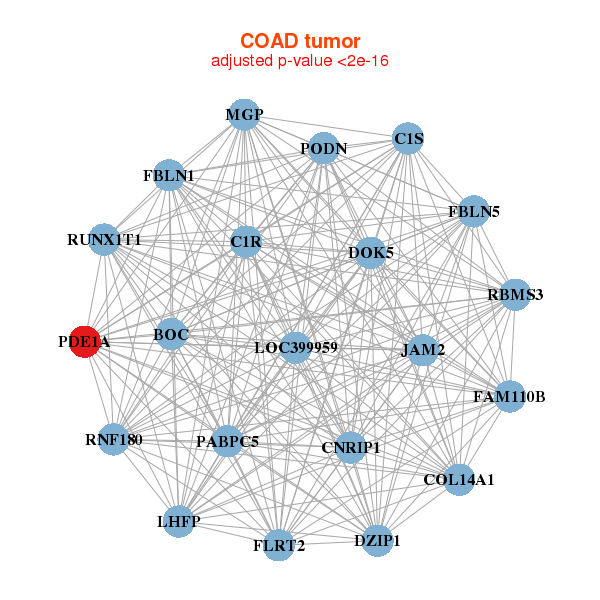
| * Co-Expression network figures were drawn using R package igraph. Only the top 20 genes with the highest correlations were shown. Red circle: input gene, orange circle: cell metabolism gene, sky circle: other gene |
: Open all plots for all cancer types
 |
| ||||
| CCDC80,CD93,CNRIP1,COL14A1,CXorf36,ELTD1,EMCN, ERG,IGF1,JAM2,LDB2,LHFP,MYCT1,PDE1A, PEAR1,PREX2,PTPRB,RHOJ,SLIT2,SPARCL1,TEK | CD34,CLIC2,EMCN,HOXD8,HSD17B11,JAZF1,LHFP, LOC644538,MEOX2,MYCT1,NEGR1,OLFML1,PDE1A,PGM5, PLS3,PMP22,PRRX1,SEPT7,SYT11,TCF4,TEK | ||||
 |
| ||||
| BOC,C1R,C1S,CNRIP1,COL14A1,DOK5,DZIP1, FAM110B,FBLN1,FBLN5,FLRT2,JAM2,LHFP,LOC399959, MGP,PABPC5,PDE1A,PODN,RBMS3,RNF180,RUNX1T1 | AP1S2,ARL3,ARL6,FAM229B,CFAP36,DNAJC18,EID1, FAM195B,FAM92A1,FEZ1,FKBP7,GNG11,IGFBP7,KIAA0895, KPNA5,MAGED2,PDE1A,SELM,TAF9B,TCEAL1,ZNF25 |
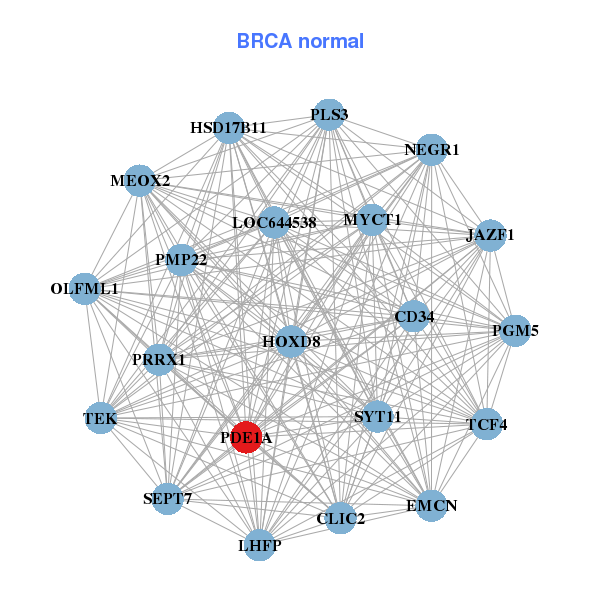
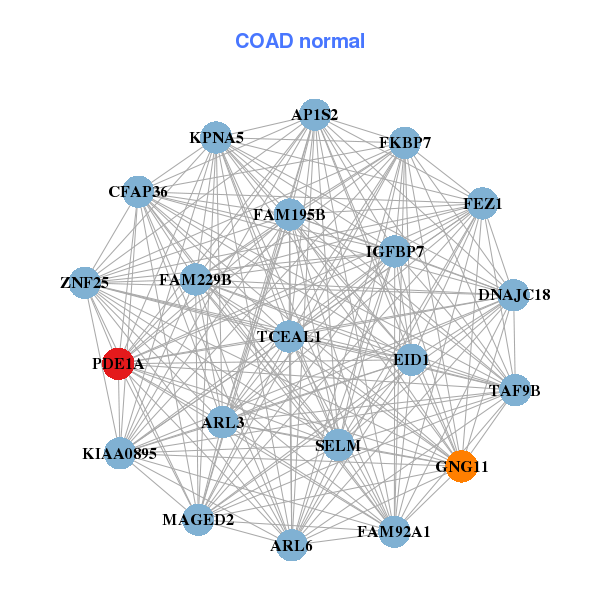
| * Co-Expression network figures were drawn using R package igraph. Only the top 20 genes with the highest correlations were shown. Red circle: input gene, orange circle: cell metabolism gene, sky circle: other gene |
: Open all plots for all cancer types
| Top |
: Open all interacting genes' information including KEGG pathway for all interacting genes from DAVID
| Top |
| Pharmacological Information for PDE1A |
| DB Category | DB Name | DB's ID and Url link |
| * Gene Centered Interaction Network. |
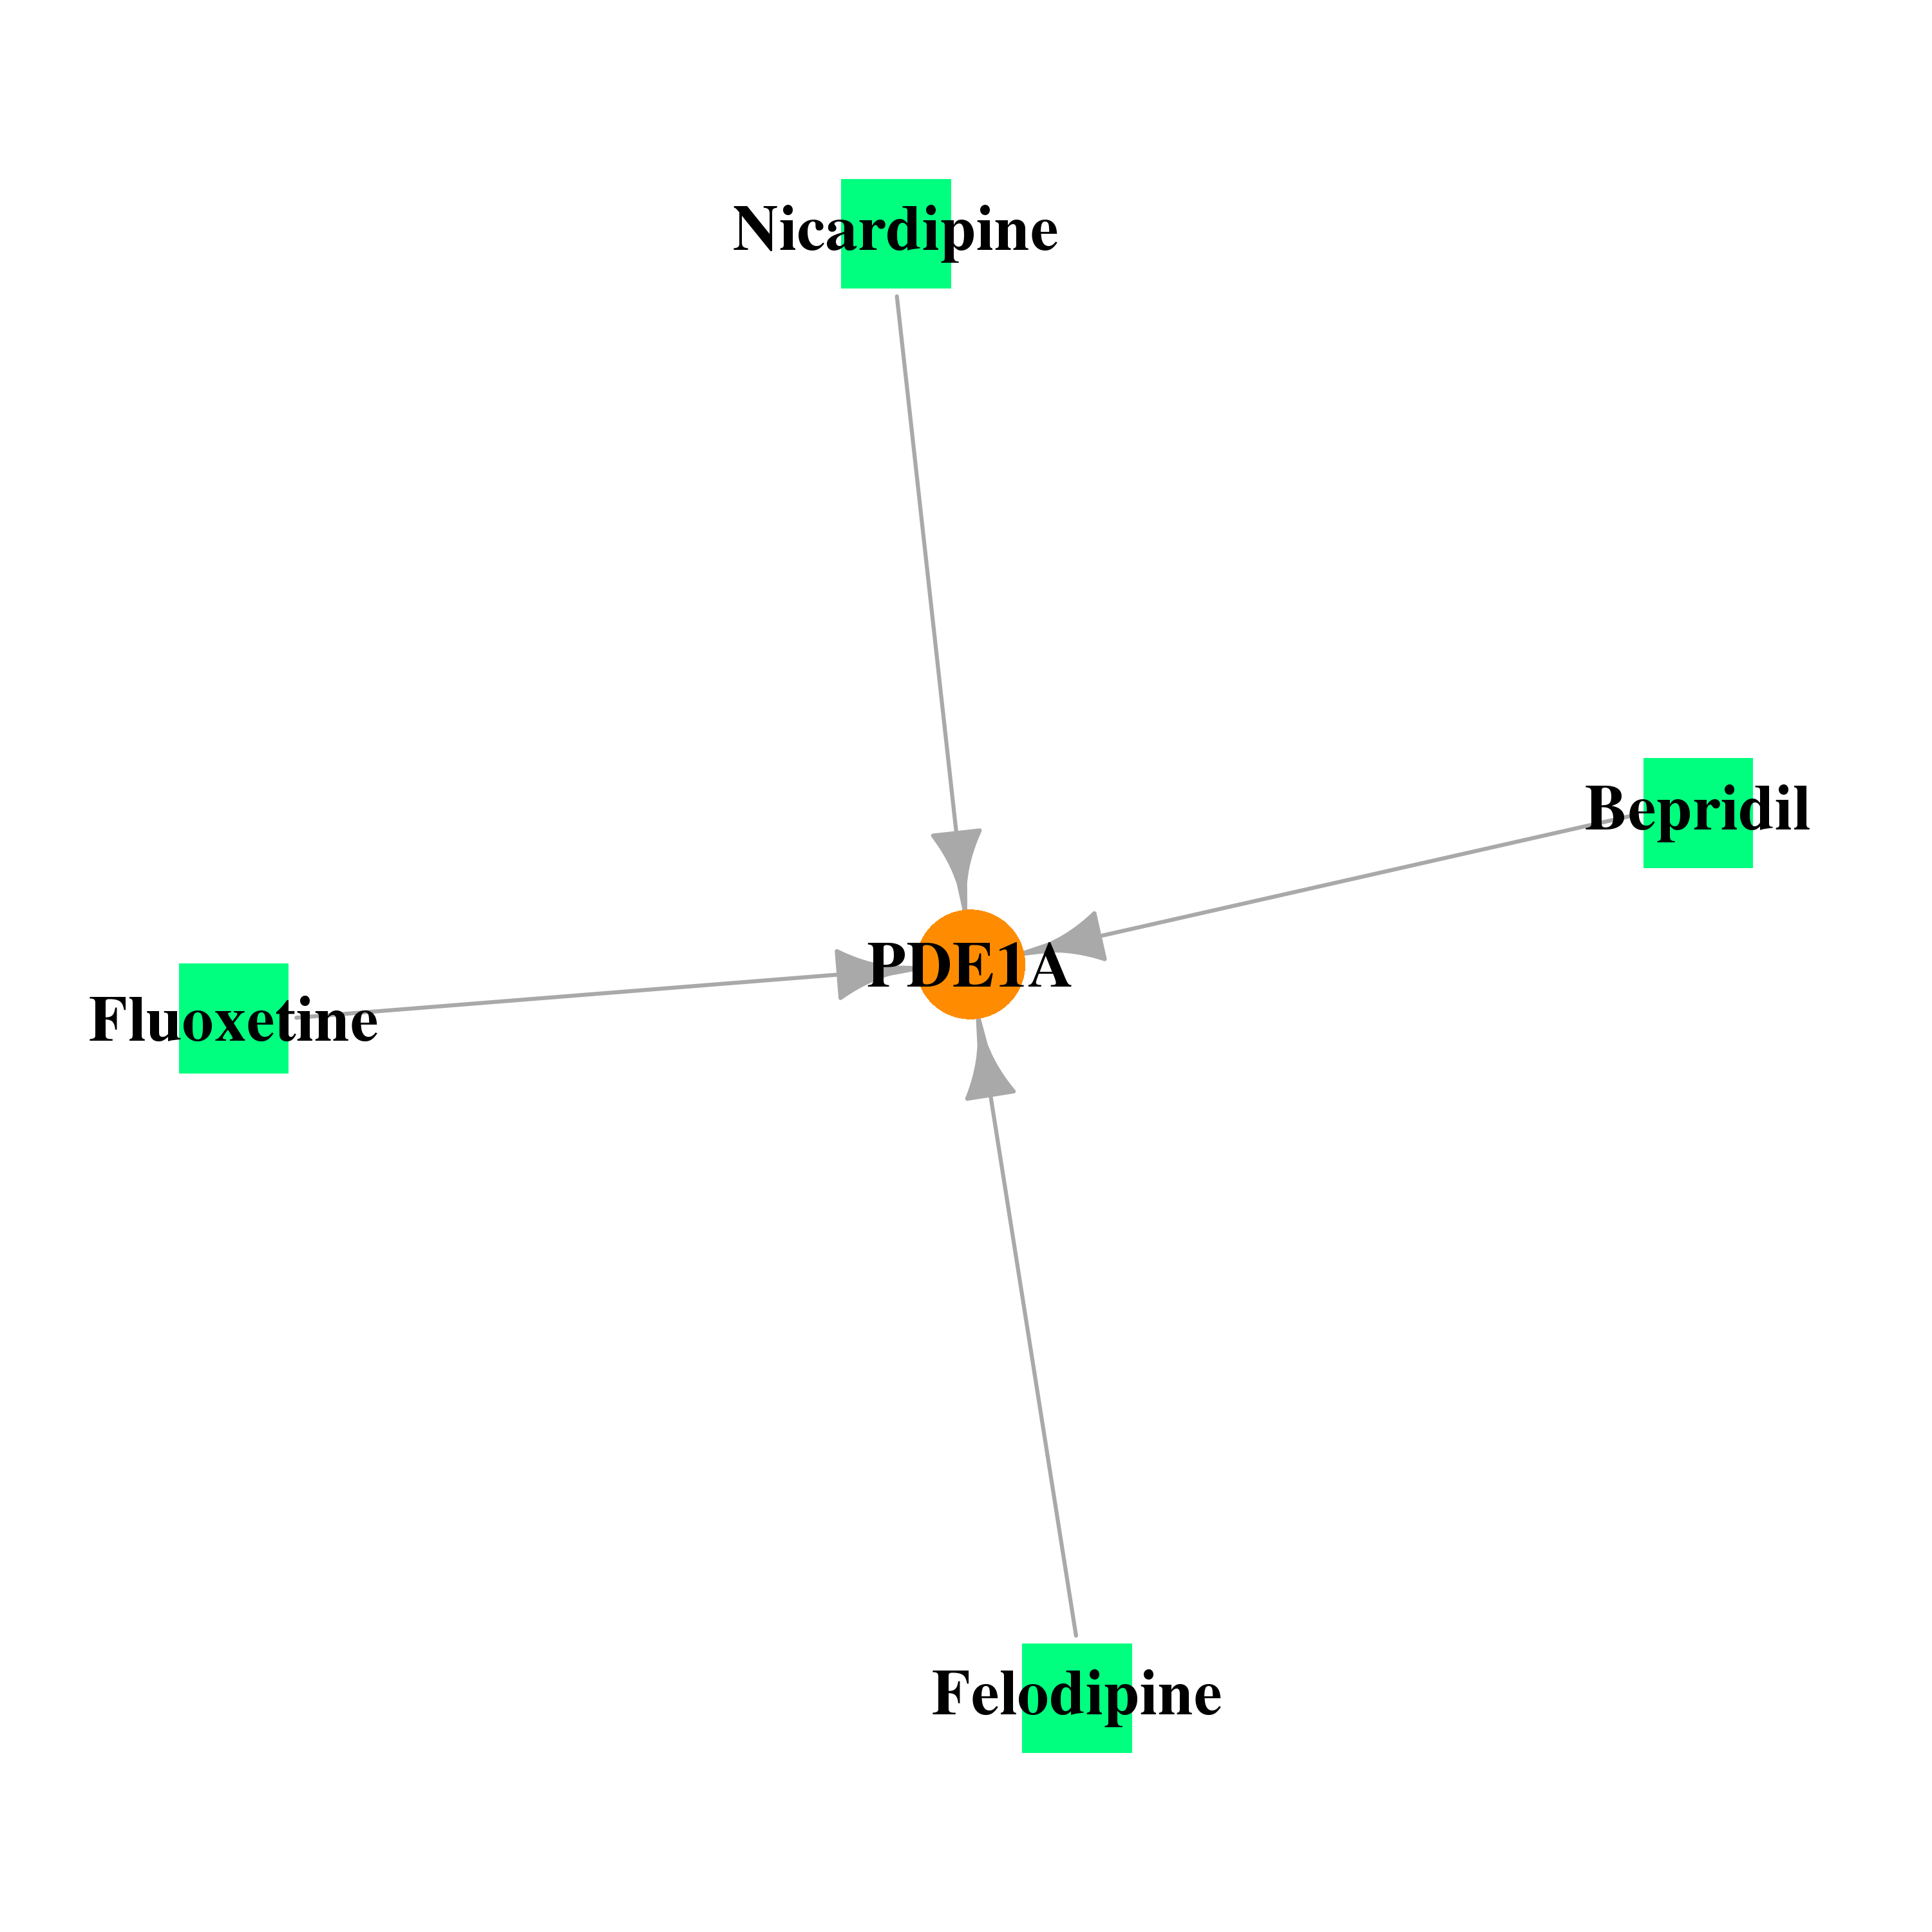 |
| * Drug Centered Interaction Network. |
| DrugBank ID | Target Name | Drug Groups | Generic Name | Drug Centered Network | Drug Structure |
| DB00622 | phosphodiesterase 1A, calmodulin-dependent | approved | Nicardipine | 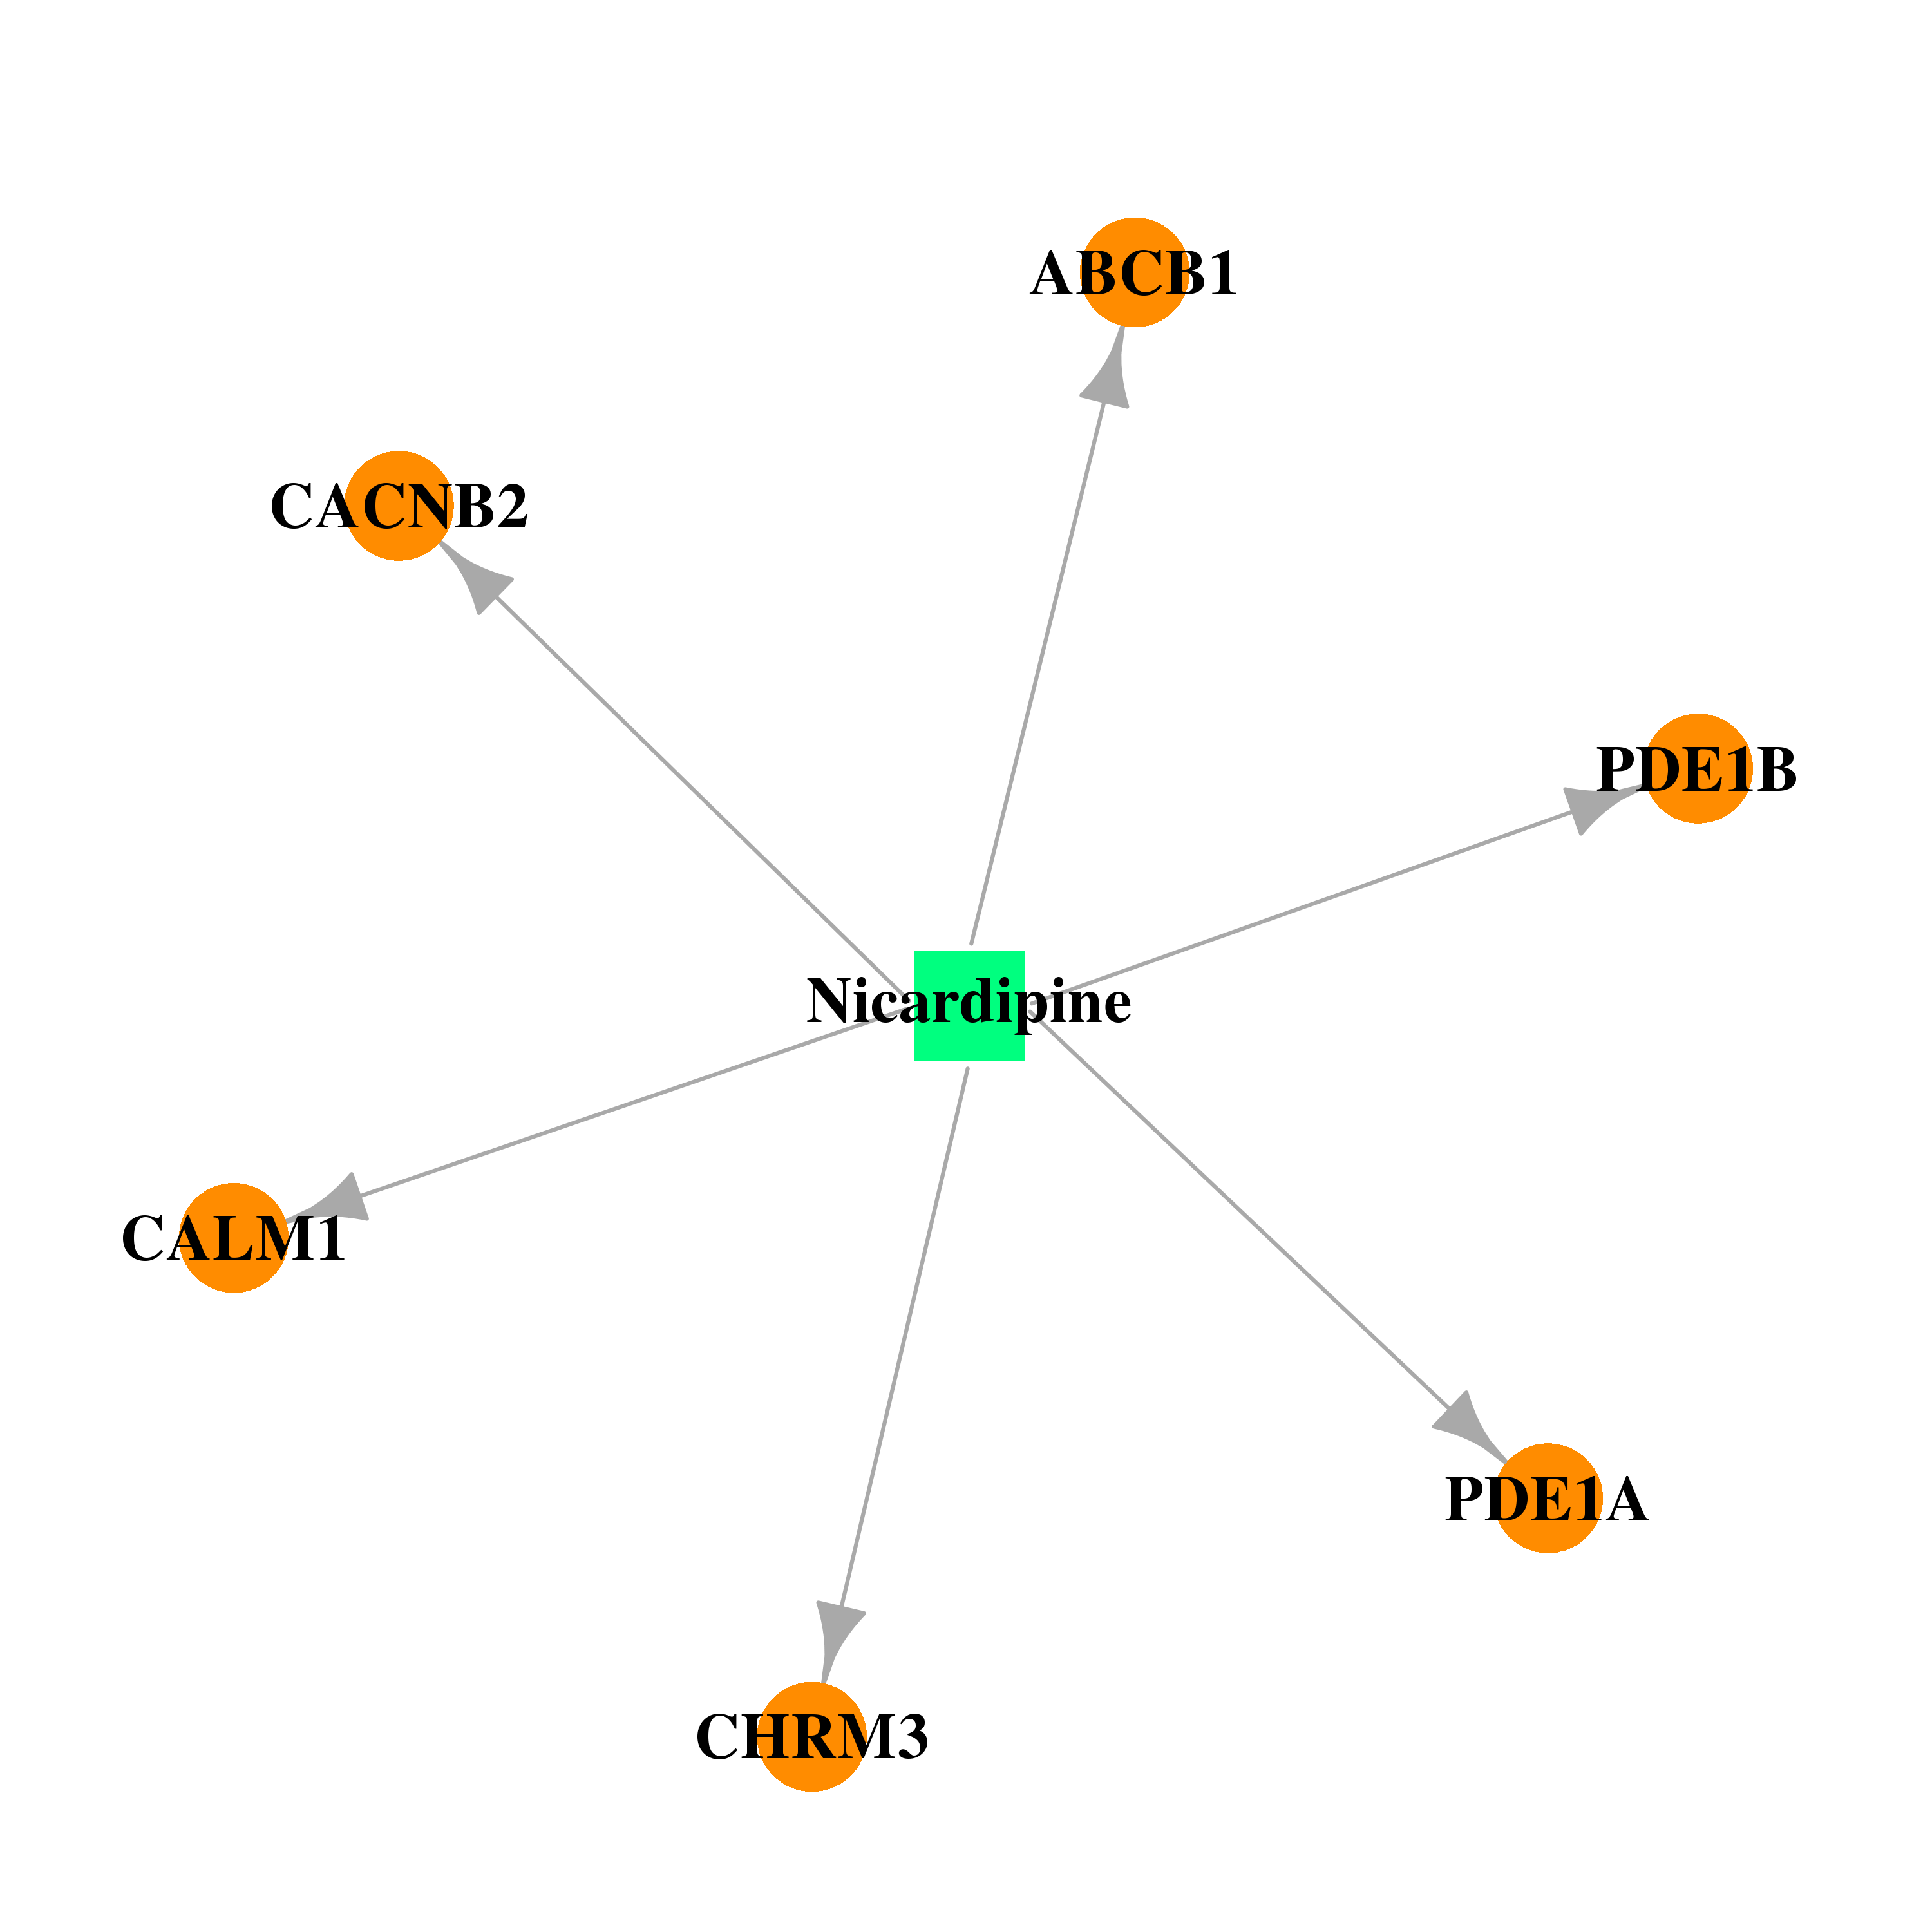 | 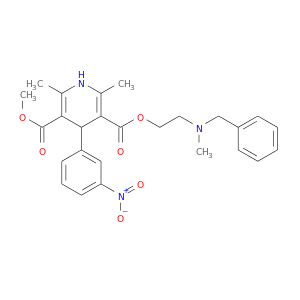 |
| DB01023 | phosphodiesterase 1A, calmodulin-dependent | approved; investigational | Felodipine | 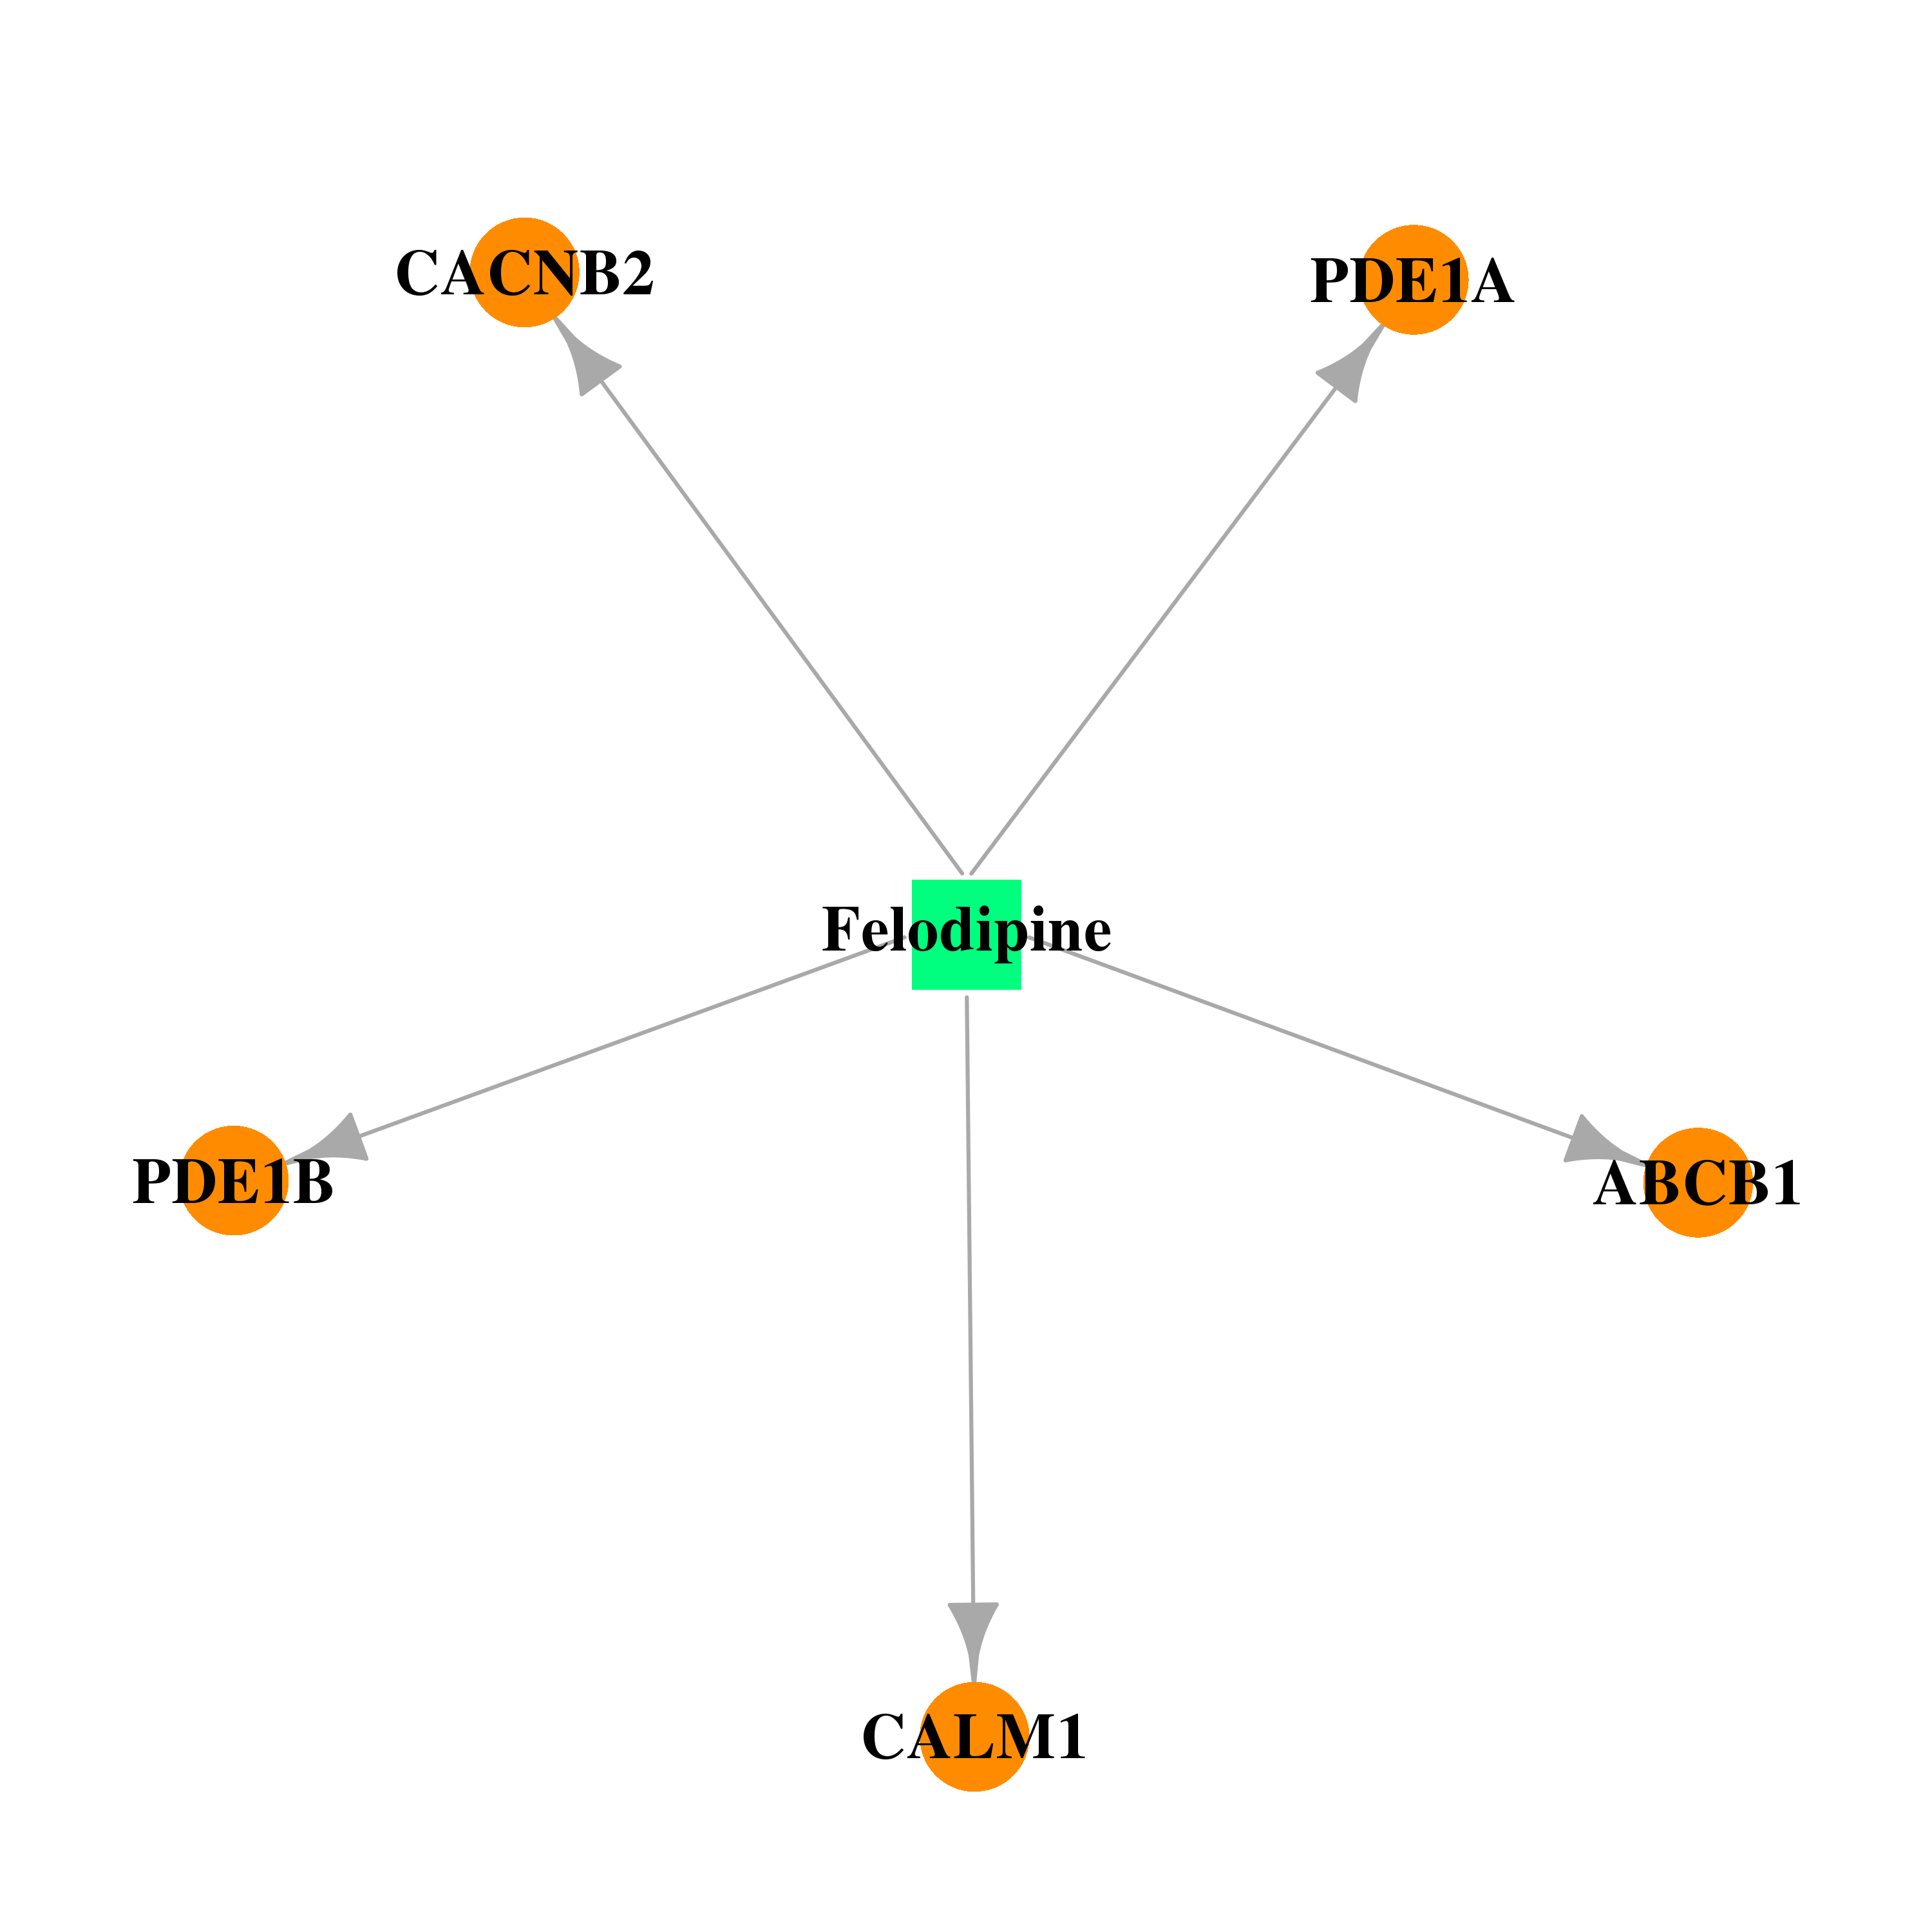 |  |
| DB01244 | phosphodiesterase 1A, calmodulin-dependent | approved | Bepridil | 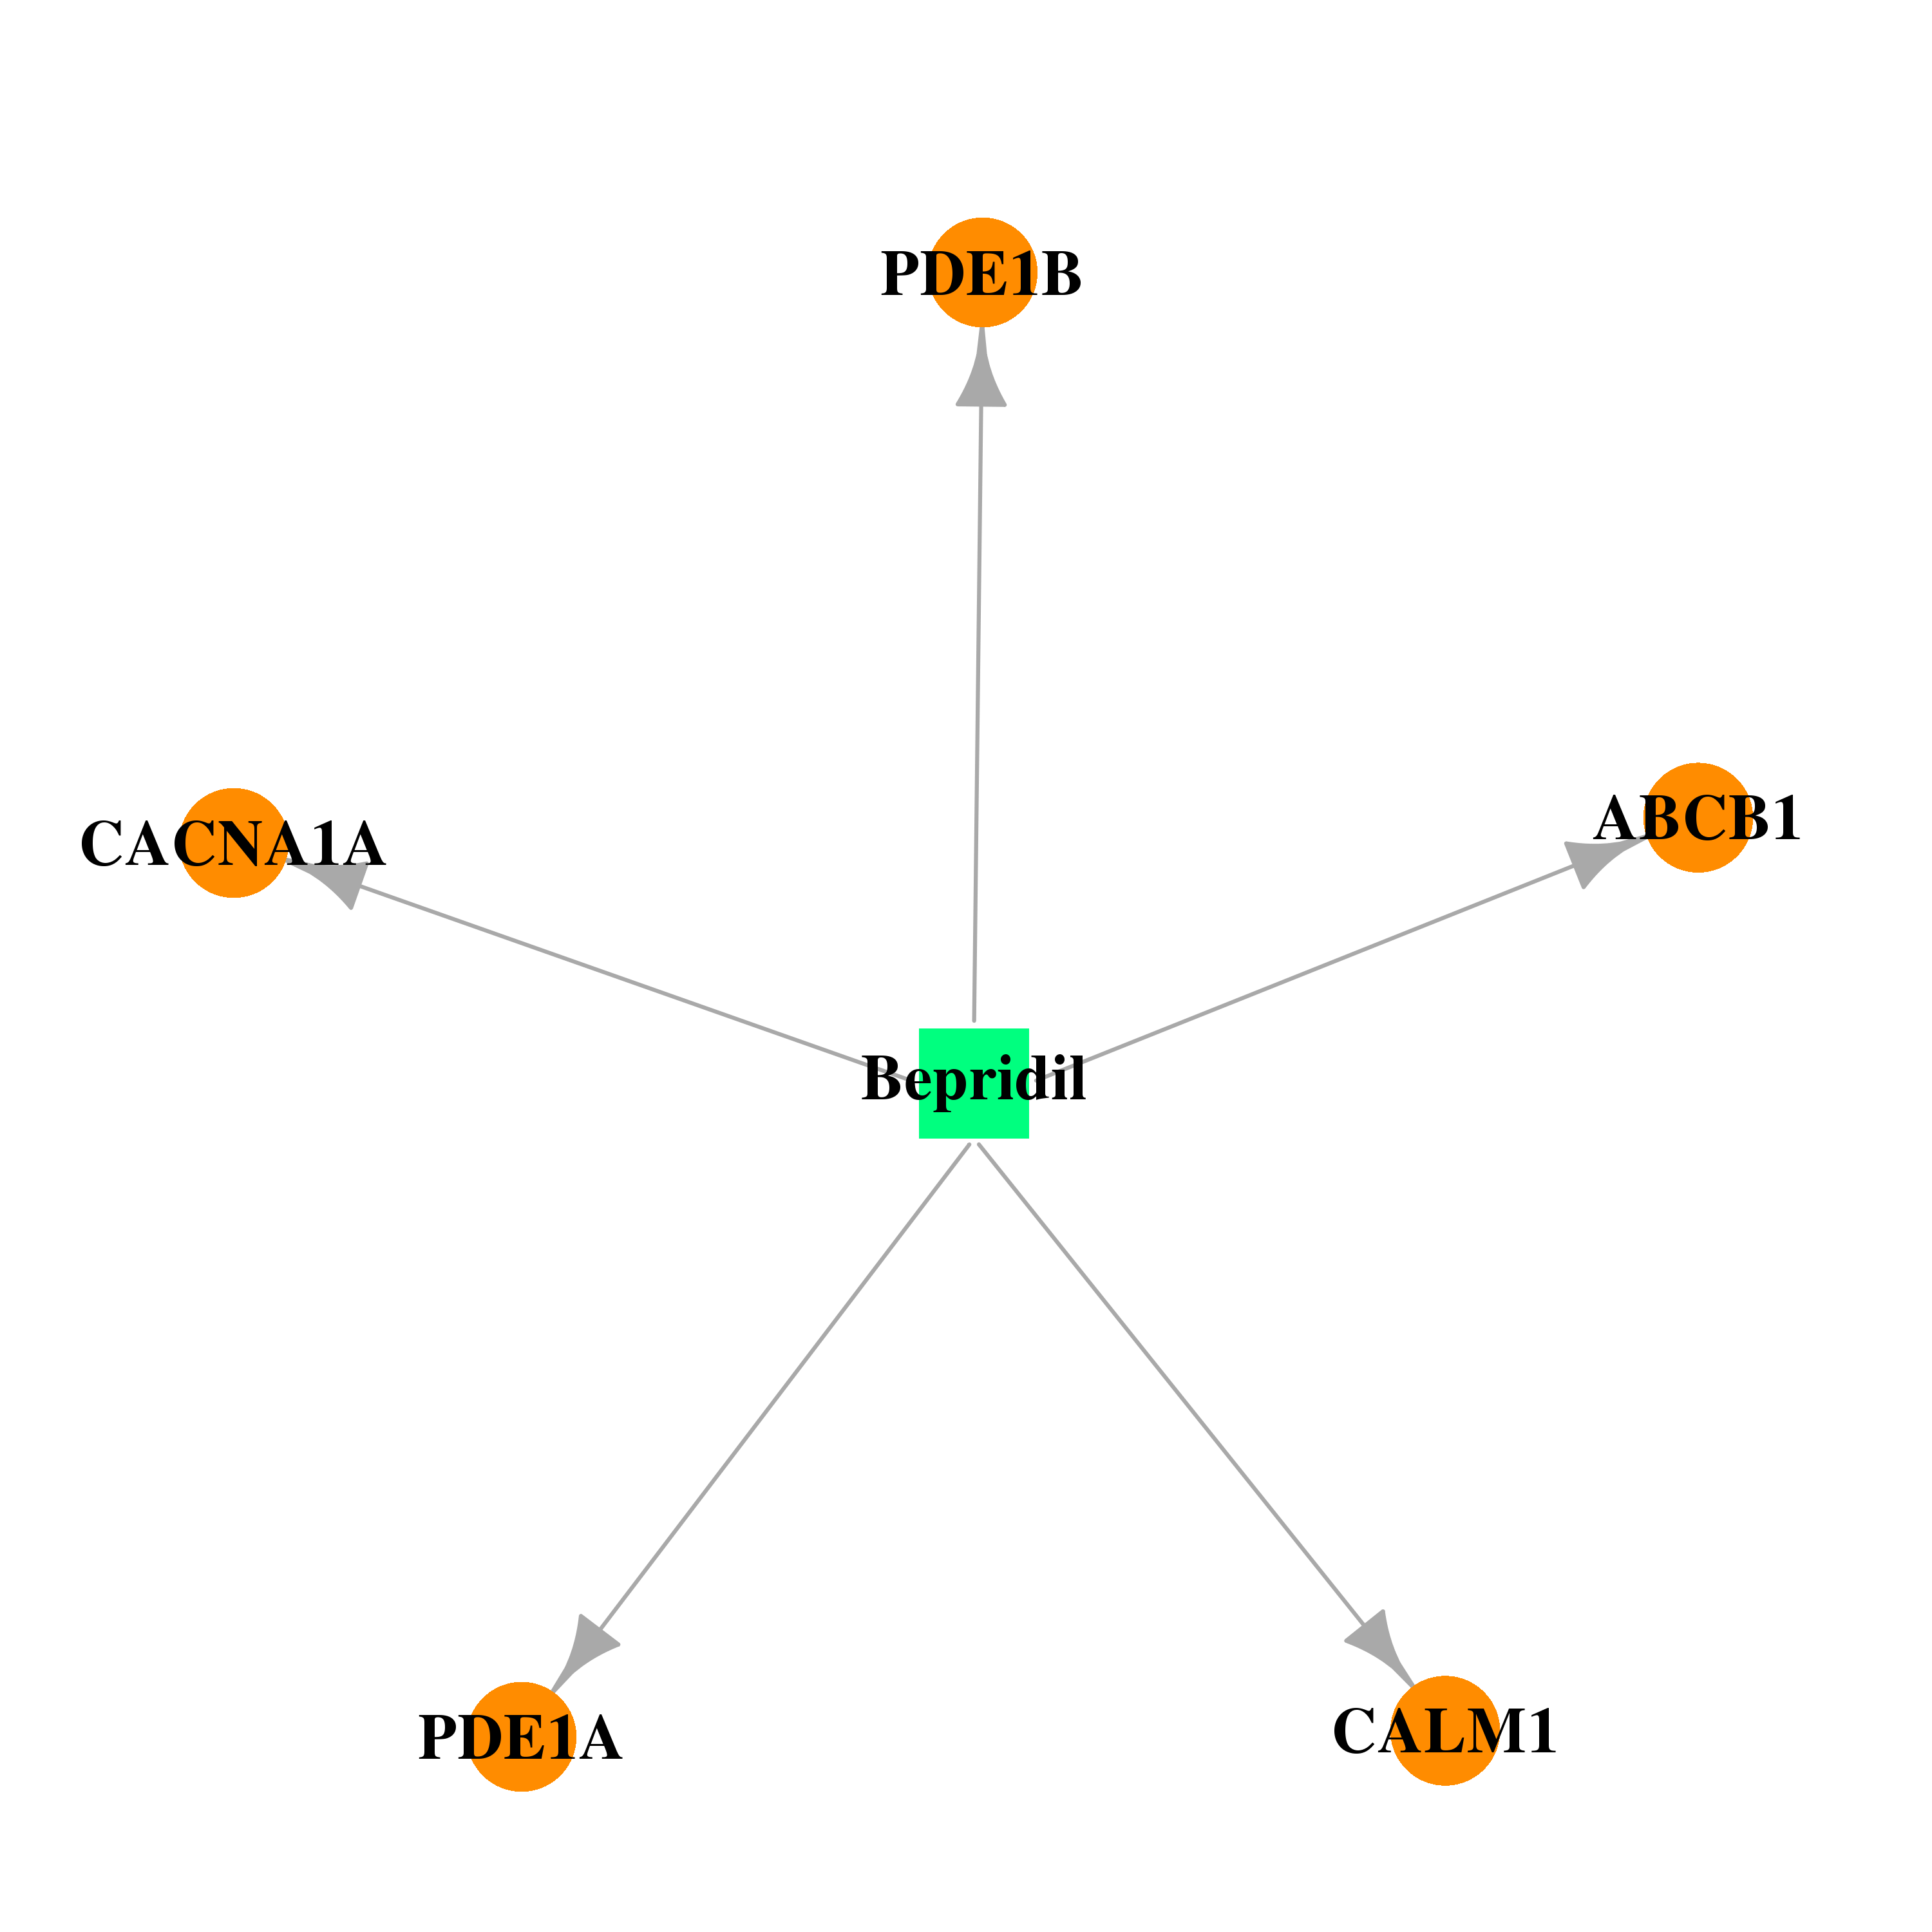 | 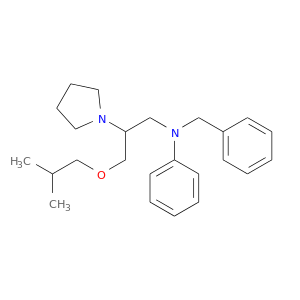 |
| DB00472 | phosphodiesterase 1A, calmodulin-dependent | approved | Fluoxetine | 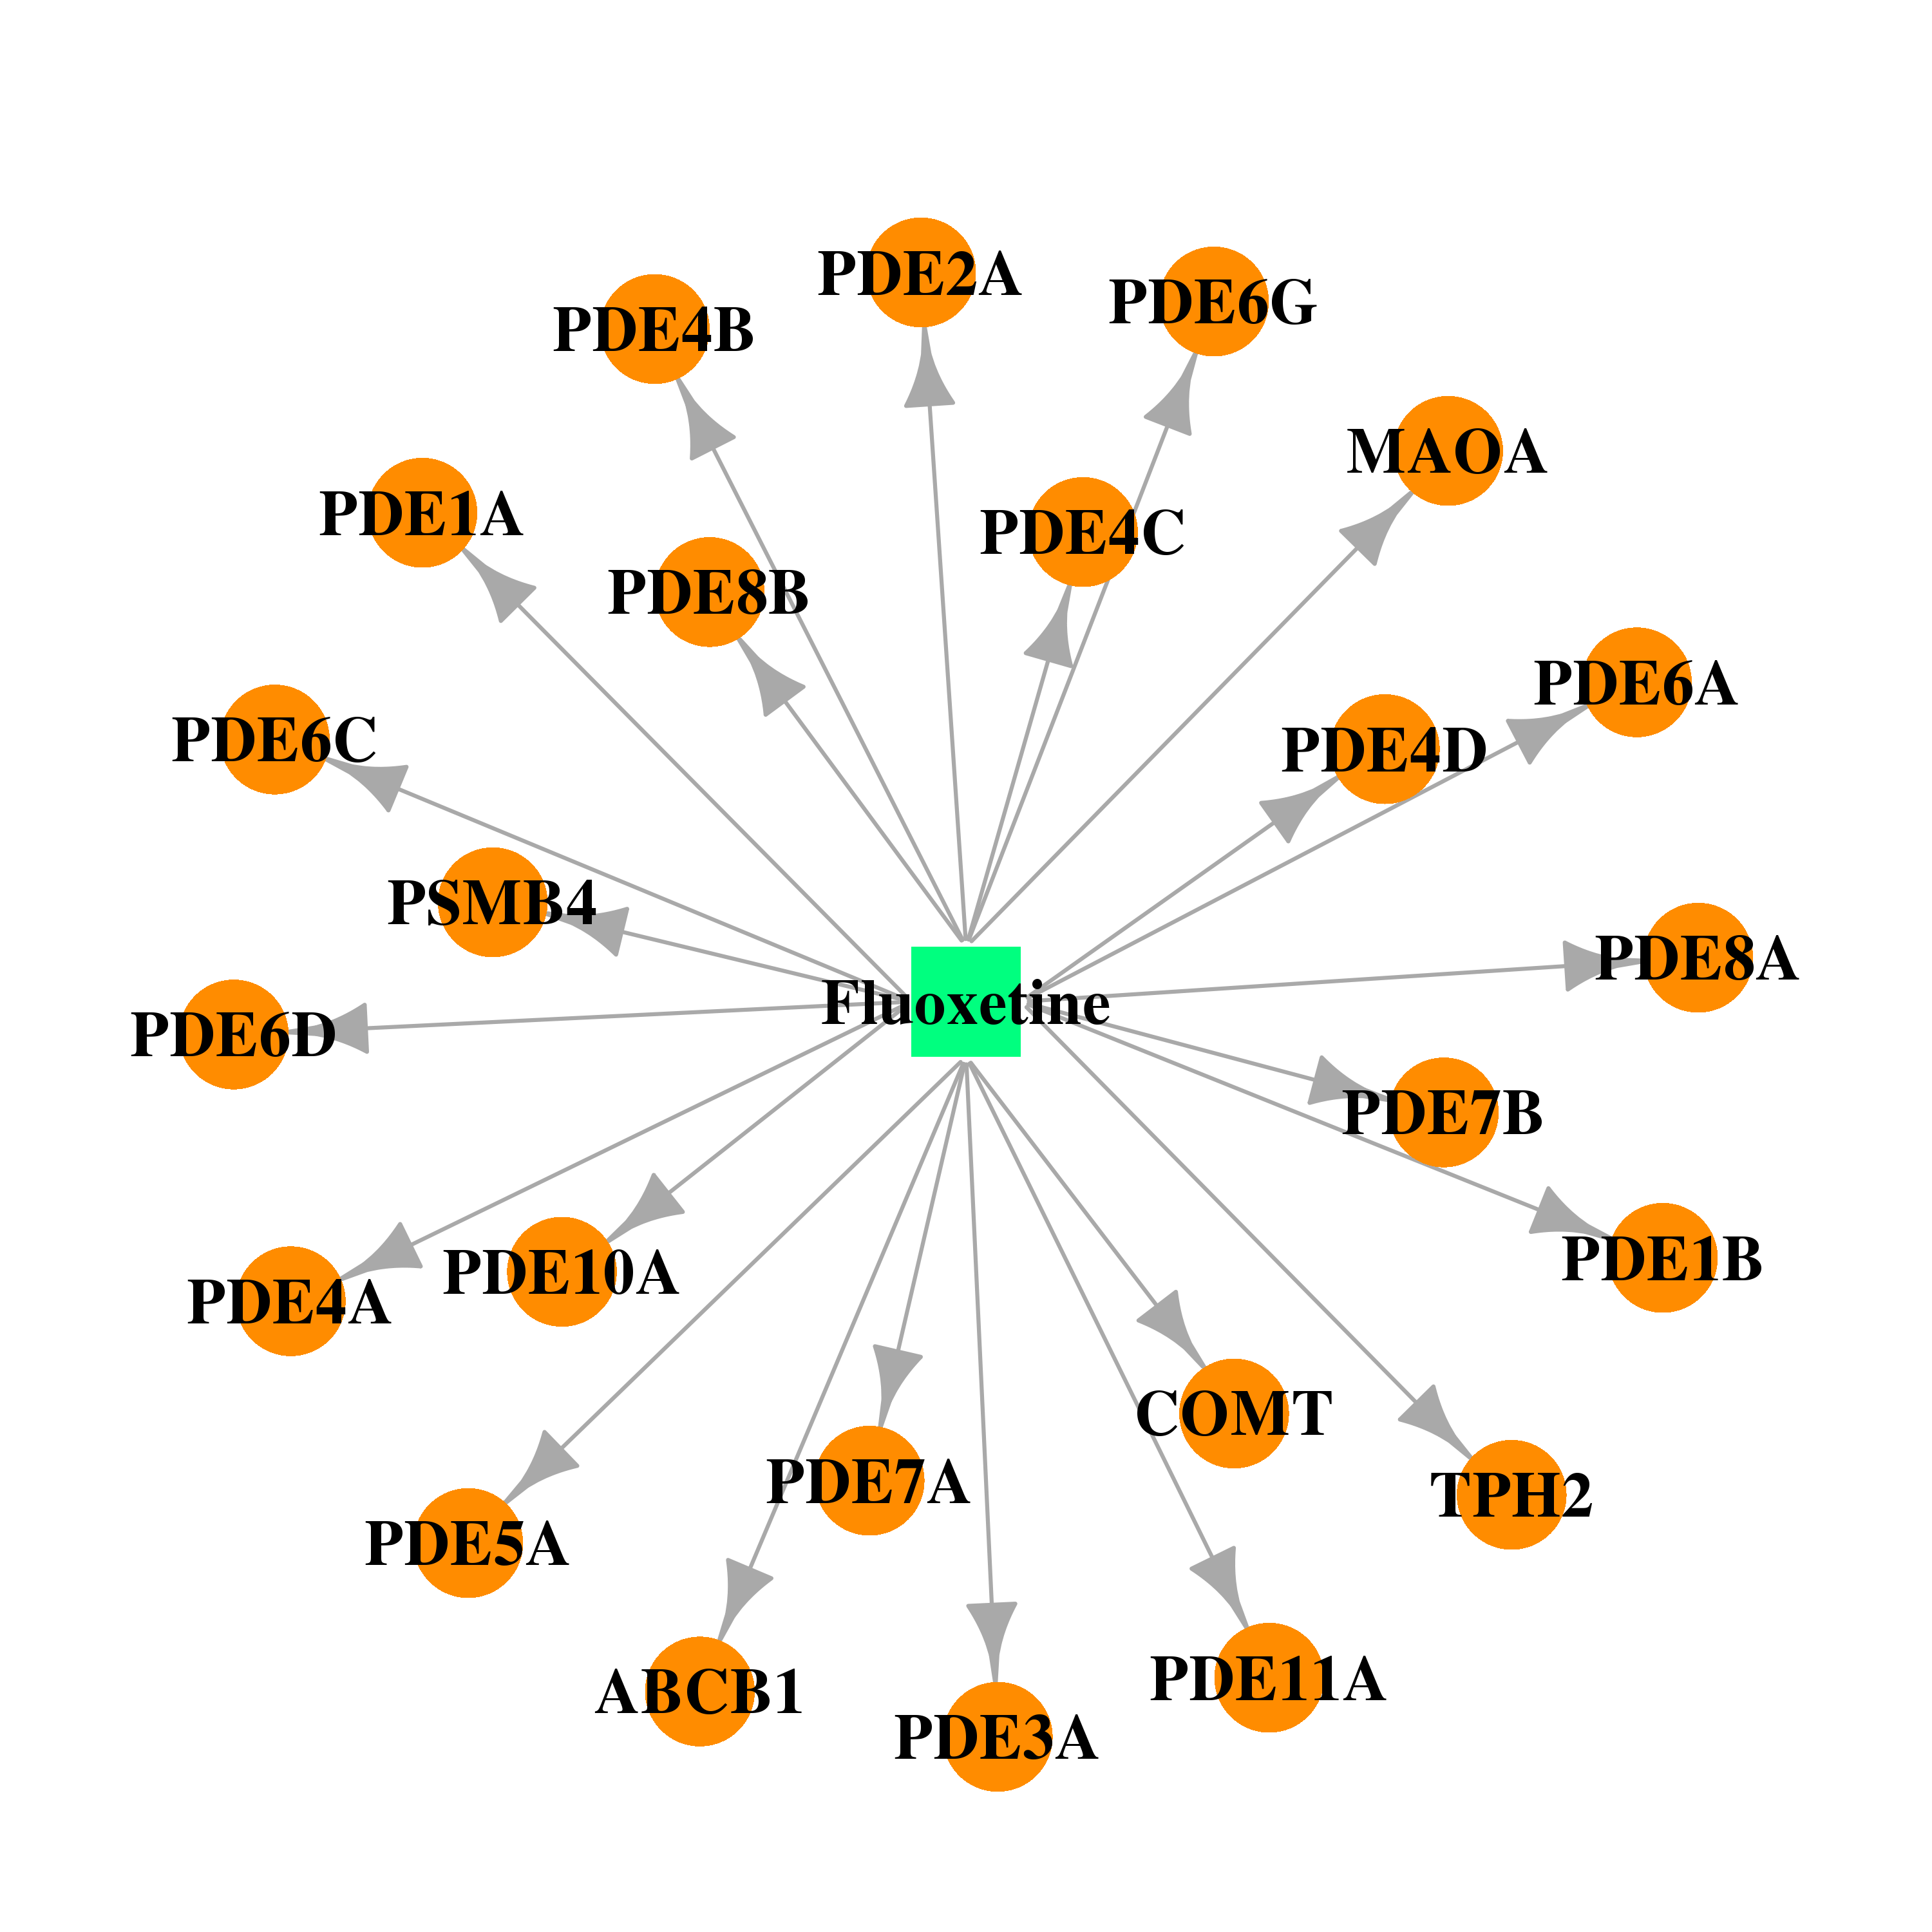 | 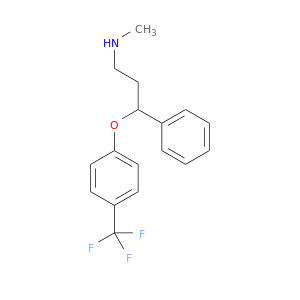 |
| Top |
| Cross referenced IDs for PDE1A |
| * We obtained these cross-references from Uniprot database. It covers 150 different DBs, 18 categories. http://www.uniprot.org/help/cross_references_section |
: Open all cross reference information
|
Copyright © 2016-Present - The Univsersity of Texas Health Science Center at Houston @ |