|
|||||||||||||||||||||||||||||||||||||||||||||||||||||||||||||||||||||||||||||||||||||||||||||||||||||||||||||||||||||||||||||||||||||||||||||||||||||||||||||||||||||||||||||||||||||||||||||||||||||||||||||||||||||||||||||||||||||||||||||||||||||||||||||||||||||||||||||||||||||||||||||||||||||||||||||||||||||||||||||||||||||||||||||||||||||||||||||||||||||||||||||||||||||||||||||
| |
| Phenotypic Information (metabolism pathway, cancer, disease, phenome) |
| |
| |
| Gene-Gene Network Information: Co-Expression Network, Interacting Genes & KEGG |
| |
|


| Gene Summary for PDE2A |
| Top |
| Phenotypic Information for PDE2A(metabolism pathway, cancer, disease, phenome) |
| Cancer | CGAP: PDE2A |
| Familial Cancer Database: PDE2A | |
| * This gene is included in those cancer gene databases. |
|
|
|
|
|
| . | |||||||||||||||||||||||||||||||||||||||||||||||||||||||||||||||||||||||||||||||||||||||||||||||||||||||||||||||||||||||||||||||||||||||||||||||||||||||||||||||||||||||||||||||||||||||||||||||||||||||||||||||||||||||||||||||||||||||||||||||||||||||||||||||||||||||||||||||||||||||||||||||||||||||||||||||||||||||||||||||||||||||||||||||||||||||||||||||||||||||||||||||||||||||
Oncogene 1 | Significant driver gene in | ||||||||||||||||||||||||||||||||||||||||||||||||||||||||||||||||||||||||||||||||||||||||||||||||||||||||||||||||||||||||||||||||||||||||||||||||||||||||||||||||||||||||||||||||||||||||||||||||||||||||||||||||||||||||||||||||||||||||||||||||||||||||||||||||||||||||||||||||||||||||||||||||||||||||||||||||||||||||||||||||||||||||||||||||||||||||||||||||||||||||||||||||||||||||||||
| cf) number; DB name 1 Oncogene; http://nar.oxfordjournals.org/content/35/suppl_1/D721.long, 2 Tumor Suppressor gene; https://bioinfo.uth.edu/TSGene/, 3 Cancer Gene Census; http://www.nature.com/nrc/journal/v4/n3/abs/nrc1299.html, 4 CancerGenes; http://nar.oxfordjournals.org/content/35/suppl_1/D721.long, 5 Network of Cancer Gene; http://ncg.kcl.ac.uk/index.php, 1Therapeutic Vulnerabilities in Cancer; http://cbio.mskcc.org/cancergenomics/statius/ |
| KEGG_PURINE_METABOLISM | |
| OMIM | |
| Orphanet | |
| Disease | KEGG Disease: PDE2A |
| MedGen: PDE2A (Human Medical Genetics with Condition) | |
| ClinVar: PDE2A | |
| Phenotype | MGI: PDE2A (International Mouse Phenotyping Consortium) |
| PhenomicDB: PDE2A | |
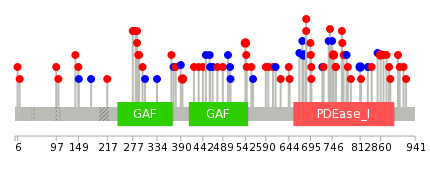
| Mutations for PDE2A |
| * Under tables are showing count per each tissue to give us broad intuition about tissue specific mutation patterns.You can go to the detailed page for each mutation database's web site. |
| - Statistics for Tissue and Mutation type | Top |
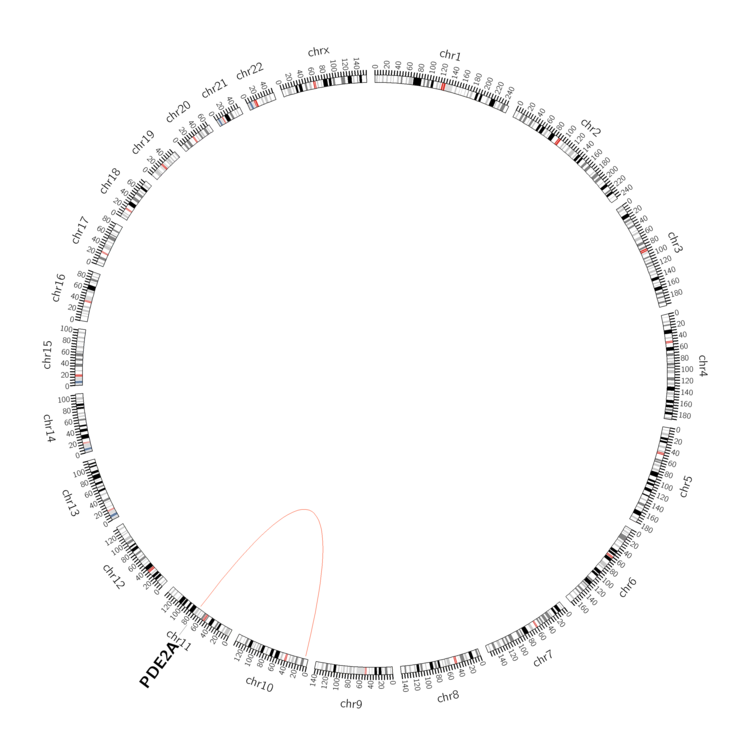 |
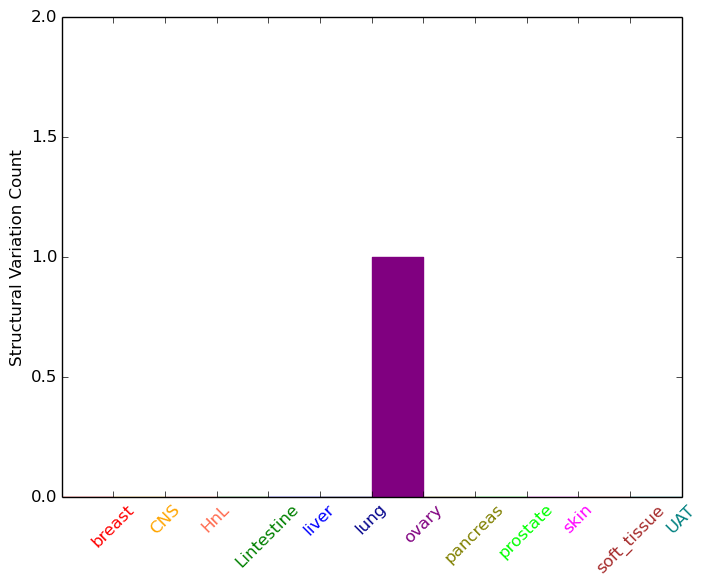
| - For Inter-chromosomal Variations |
| * Inter-chromosomal variantions includes 'interchromosomal amplicon to amplicon', 'interchromosomal amplicon to non-amplified dna', 'interchromosomal insertion', 'Interchromosomal unknown type'. |
 |
| - For Intra-chromosomal Variations |
| There's no intra-chromosomal structural variation. |
| Sample | Symbol_a | Chr_a | Start_a | End_a | Symbol_b | Chr_b | Start_b | End_b |
| cf) Tissue number; Tissue name (1;Breast, 2;Central_nervous_system, 3;Haematopoietic_and_lymphoid_tissue, 4;Large_intestine, 5;Liver, 6;Lung, 7;Ovary, 8;Pancreas, 9;Prostate, 10;Skin, 11;Soft_tissue, 12;Upper_aerodigestive_tract) |
| * From mRNA Sanger sequences, Chitars2.0 arranged chimeric transcripts. This table shows PDE2A related fusion information. |
| ID | Head Gene | Tail Gene | Accession | Gene_a | qStart_a | qEnd_a | Chromosome_a | tStart_a | tEnd_a | Gene_a | qStart_a | qEnd_a | Chromosome_a | tStart_a | tEnd_a |
| BE938766 | PDE2A | 40 | 397 | 11 | 72289973 | 72291982 | KIAA1841 | 393 | 522 | 2 | 61315953 | 61316082 | |
| BQ677895 | CAMTA2 | 265 | 698 | 17 | 4873303 | 4875682 | PDE2A | 699 | 720 | 11 | 72305786 | 72305807 | |
| BE924919 | CAPZB | 1 | 199 | 1 | 19665741 | 19665940 | PDE2A | 186 | 266 | 11 | 72323711 | 72323798 | |
| AB209076 | KCNIP3 | 1 | 3658 | 2 | 95963086 | 95979644 | PDE2A | 3653 | 4512 | 11 | 72361084 | 72361943 | |
| Top |
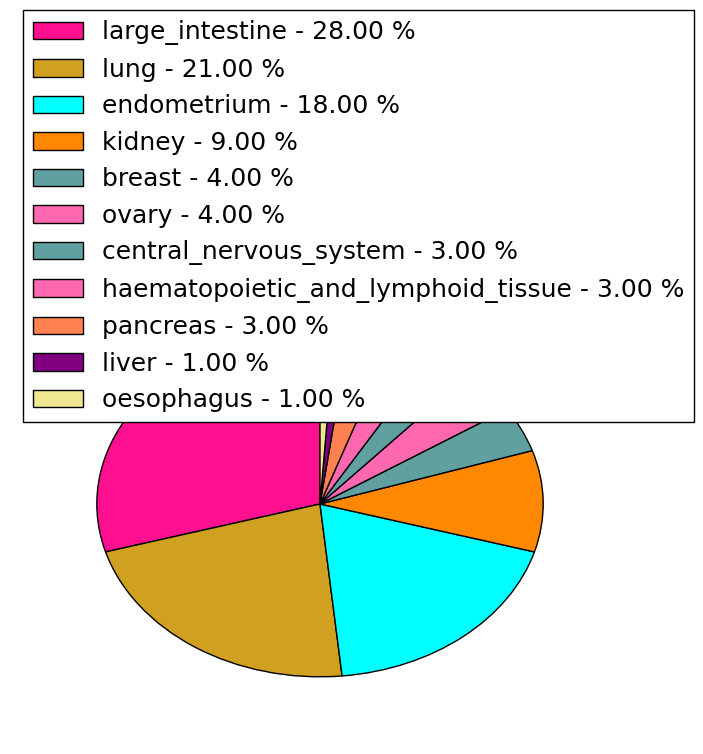
| Mutation type/ Tissue ID | brca | cns | cerv | endome | haematopo | kidn | Lintest | liver | lung | ns | ovary | pancre | prost | skin | stoma | thyro | urina | |||
| Total # sample | 4 | 1 | 1 | |||||||||||||||||
| GAIN (# sample) | 4 | 1 | 1 | |||||||||||||||||
| LOSS (# sample) |
| cf) Tissue ID; Tissue type (1; Breast, 2; Central_nervous_system, 3; Cervix, 4; Endometrium, 5; Haematopoietic_and_lymphoid_tissue, 6; Kidney, 7; Large_intestine, 8; Liver, 9; Lung, 10; NS, 11; Ovary, 12; Pancreas, 13; Prostate, 14; Skin, 15; Stomach, 16; Thyroid, 17; Urinary_tract) |
| Top |
|
 |
| Top |
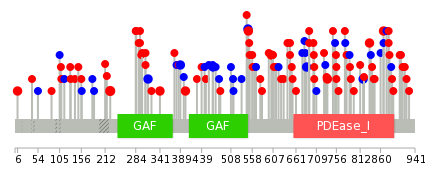
| Stat. for Non-Synonymous SNVs (# total SNVs=64) | (# total SNVs=25) |
 |  |
(# total SNVs=2) | (# total SNVs=1) |
 |  |
| Top |
| * When you move the cursor on each content, you can see more deailed mutation information on the Tooltip. Those are primary_site,primary_histology,mutation(aa),pubmedID. |
| GRCh37 position | Mutation(aa) | Unique sampleID count |
| chr11:72301503-72301503 | p.T224I | 3 |
| chr11:72299876-72299876 | p.D341V | 2 |
| chr11:72289953-72289953 | p.T819T | 2 |
| chr11:72295250-72295250 | p.A549T | 2 |
| chr11:72293532-72293532 | p.F603L | 2 |
| chr11:72289292-72289292 | p.A867V | 2 |
| chr11:72295251-72295251 | p.I548I | 2 |
| chr11:72319797-72319797 | p.? | 2 |
| chr11:72295734-72295734 | p.A466A | 2 |
| chr11:72296617-72296617 | p.K401N | 2 |
| Top |
|
 |
| Point Mutation/ Tissue ID | 1 | 2 | 3 | 4 | 5 | 6 | 7 | 8 | 9 | 10 | 11 | 12 | 13 | 14 | 15 | 16 | 17 | 18 | 19 | 20 |
| # sample | 1 | 3 | 10 | 1 | 2 | 3 | 11 | 6 | 2 | 2 | 16 | 12 | 12 | |||||||
| # mutation | 1 | 3 | 11 | 1 | 2 | 3 | 12 | 6 | 2 | 2 | 18 | 12 | 14 | |||||||
| nonsynonymous SNV | 1 | 2 | 7 | 1 | 3 | 7 | 4 | 2 | 2 | 14 | 8 | 11 | ||||||||
| synonymous SNV | 1 | 4 | 2 | 5 | 2 | 4 | 4 | 3 |
| cf) Tissue ID; Tissue type (1; BLCA[Bladder Urothelial Carcinoma], 2; BRCA[Breast invasive carcinoma], 3; CESC[Cervical squamous cell carcinoma and endocervical adenocarcinoma], 4; COAD[Colon adenocarcinoma], 5; GBM[Glioblastoma multiforme], 6; Glioma Low Grade, 7; HNSC[Head and Neck squamous cell carcinoma], 8; KICH[Kidney Chromophobe], 9; KIRC[Kidney renal clear cell carcinoma], 10; KIRP[Kidney renal papillary cell carcinoma], 11; LAML[Acute Myeloid Leukemia], 12; LUAD[Lung adenocarcinoma], 13; LUSC[Lung squamous cell carcinoma], 14; OV[Ovarian serous cystadenocarcinoma ], 15; PAAD[Pancreatic adenocarcinoma], 16; PRAD[Prostate adenocarcinoma], 17; SKCM[Skin Cutaneous Melanoma], 18:STAD[Stomach adenocarcinoma], 19:THCA[Thyroid carcinoma], 20:UCEC[Uterine Corpus Endometrial Carcinoma]) |
| Top |
| * We represented just top 10 SNVs. When you move the cursor on each content, you can see more deailed mutation information on the Tooltip. Those are primary_site, primary_histology, mutation(aa), pubmedID. |
| Genomic Position | Mutation(aa) | Unique sampleID count |
| chr11:72292005 | p.R749H,PDE2A | 2 |
| chr11:72289953 | p.A860V,PDE2A | 2 |
| chr11:72295250 | p.T812T,PDE2A | 2 |
| chr11:72296617 | p.K394N,PDE2A | 2 |
| chr11:72289292 | p.A542T,PDE2A | 2 |
| chr11:72290417 | p.I679I,PDE2A | 2 |
| chr11:72288519 | p.S883P,PDE2A | 1 |
| chr11:72299876 | p.R755L,PDE2A | 1 |
| chr11:72294523 | p.E669E,PDE2A | 1 |
| chr11:72307655 | p.G489C,PDE2A | 1 |
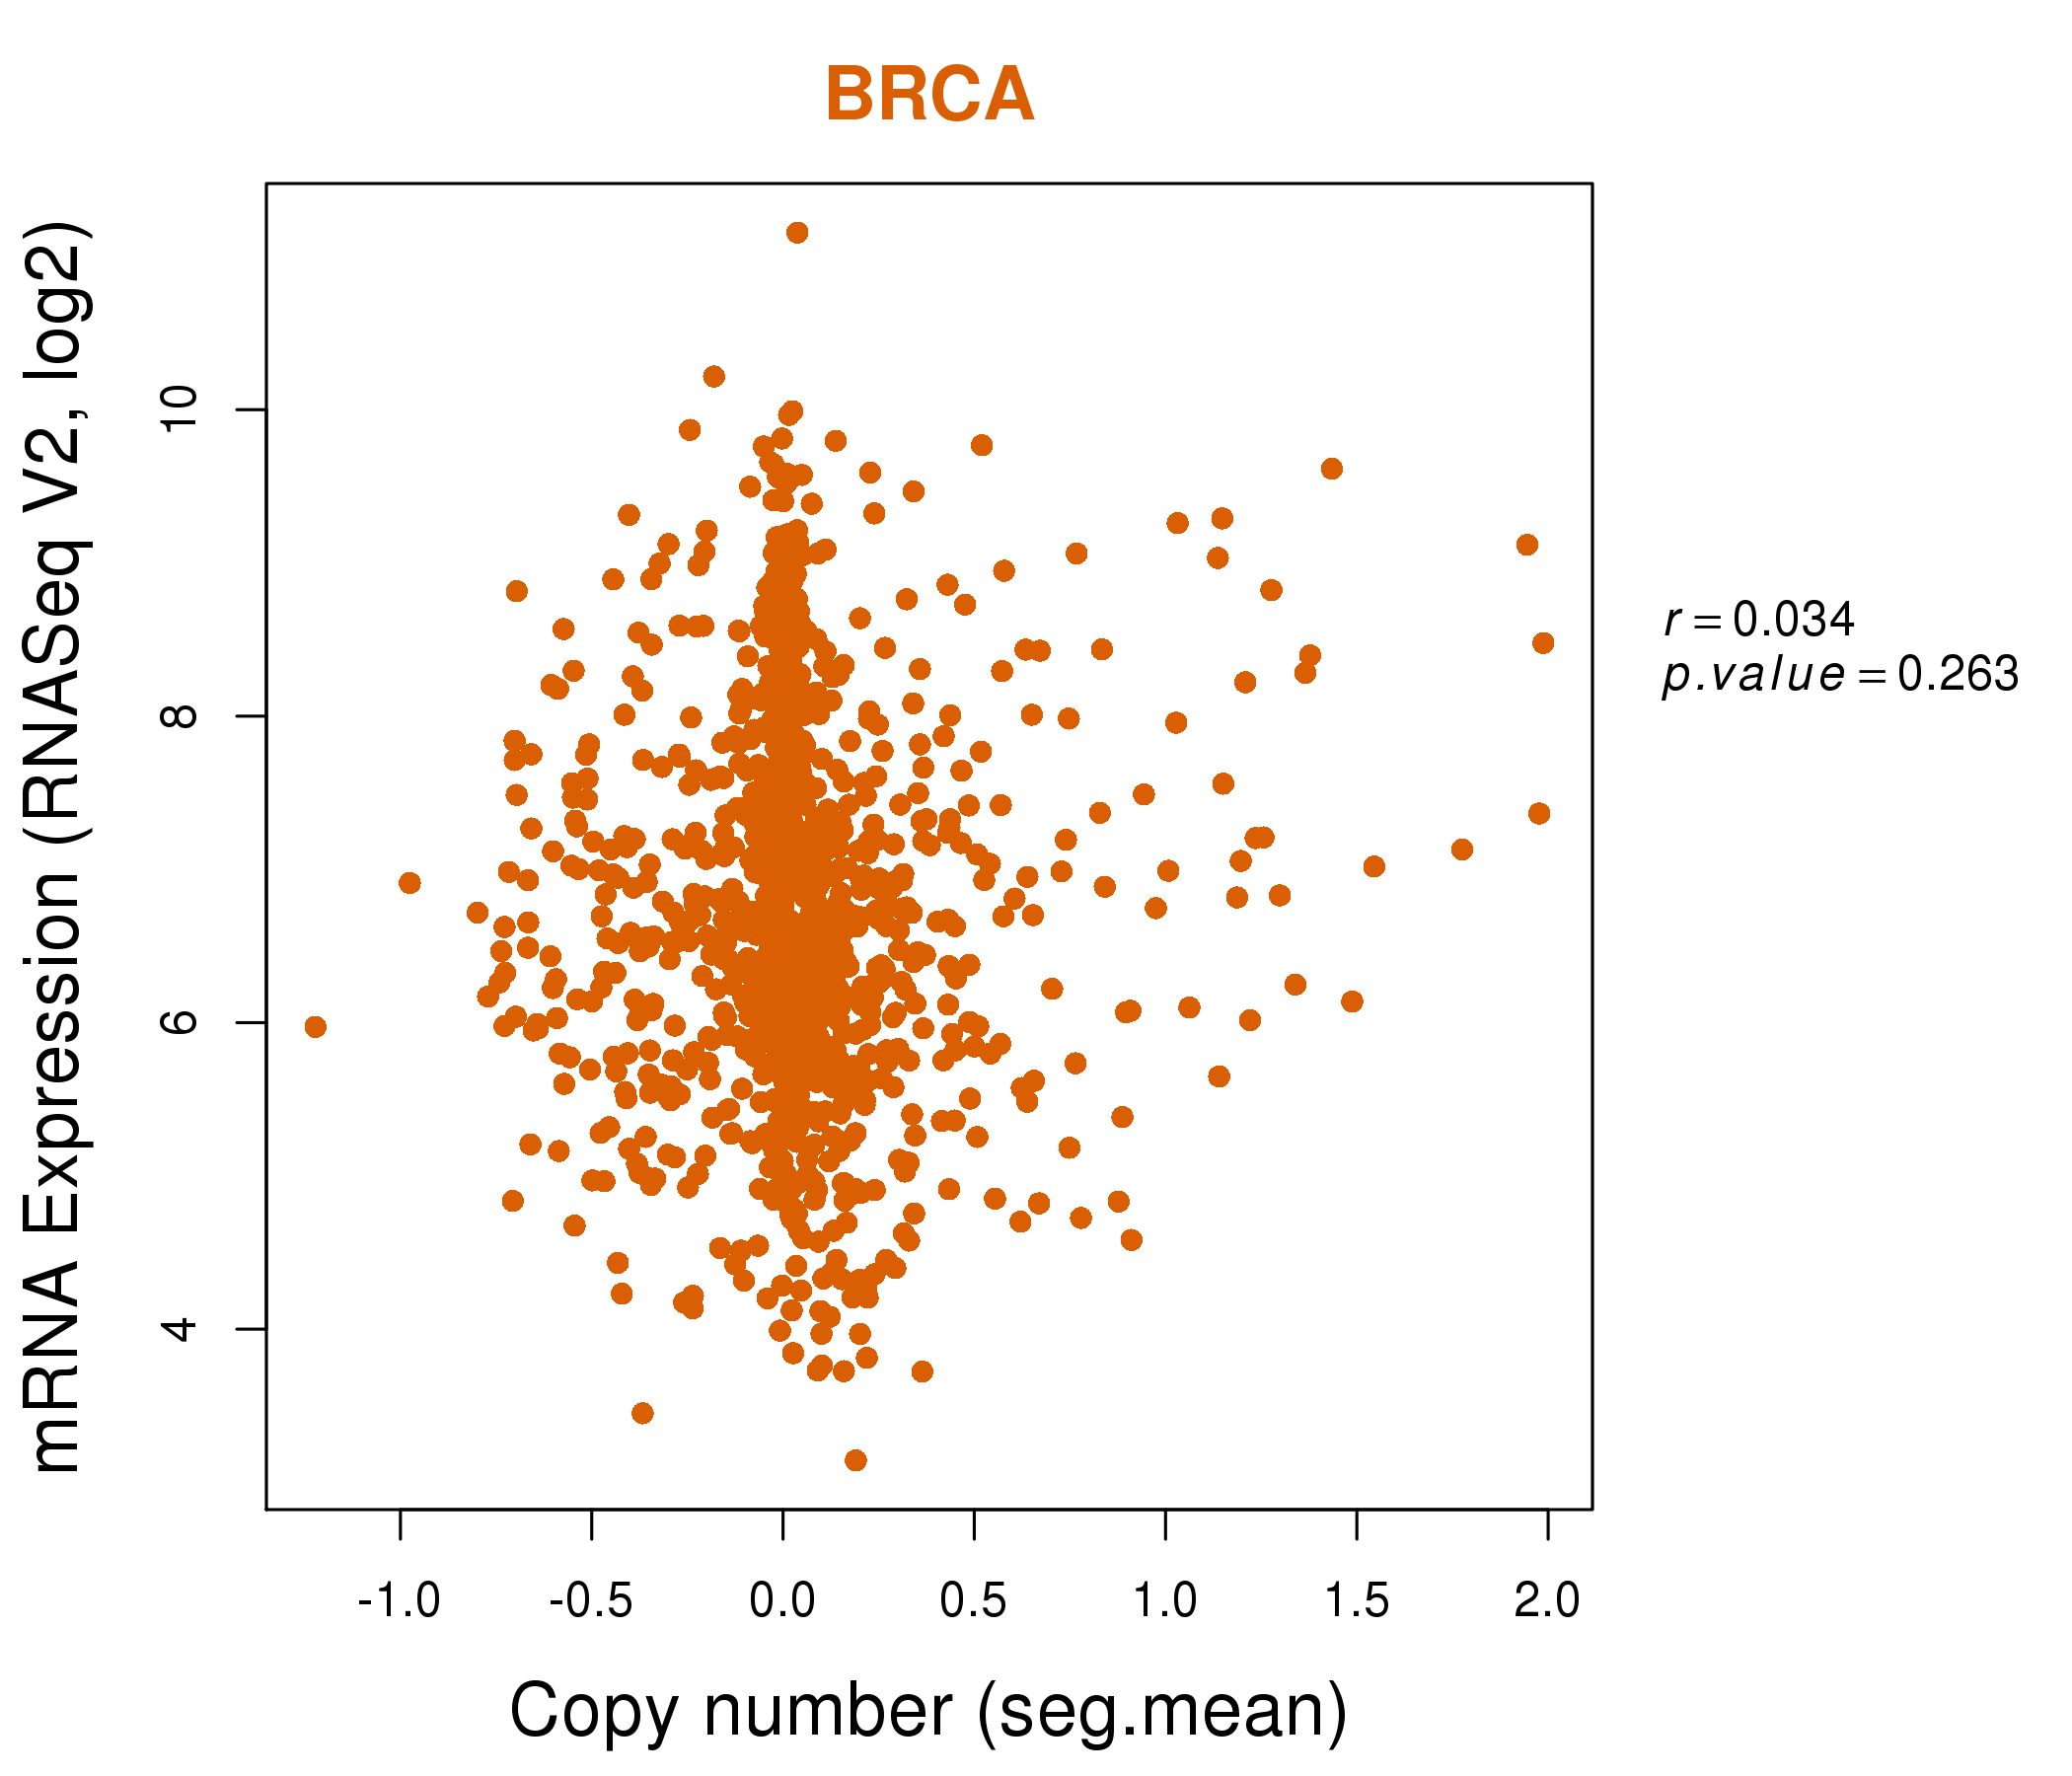
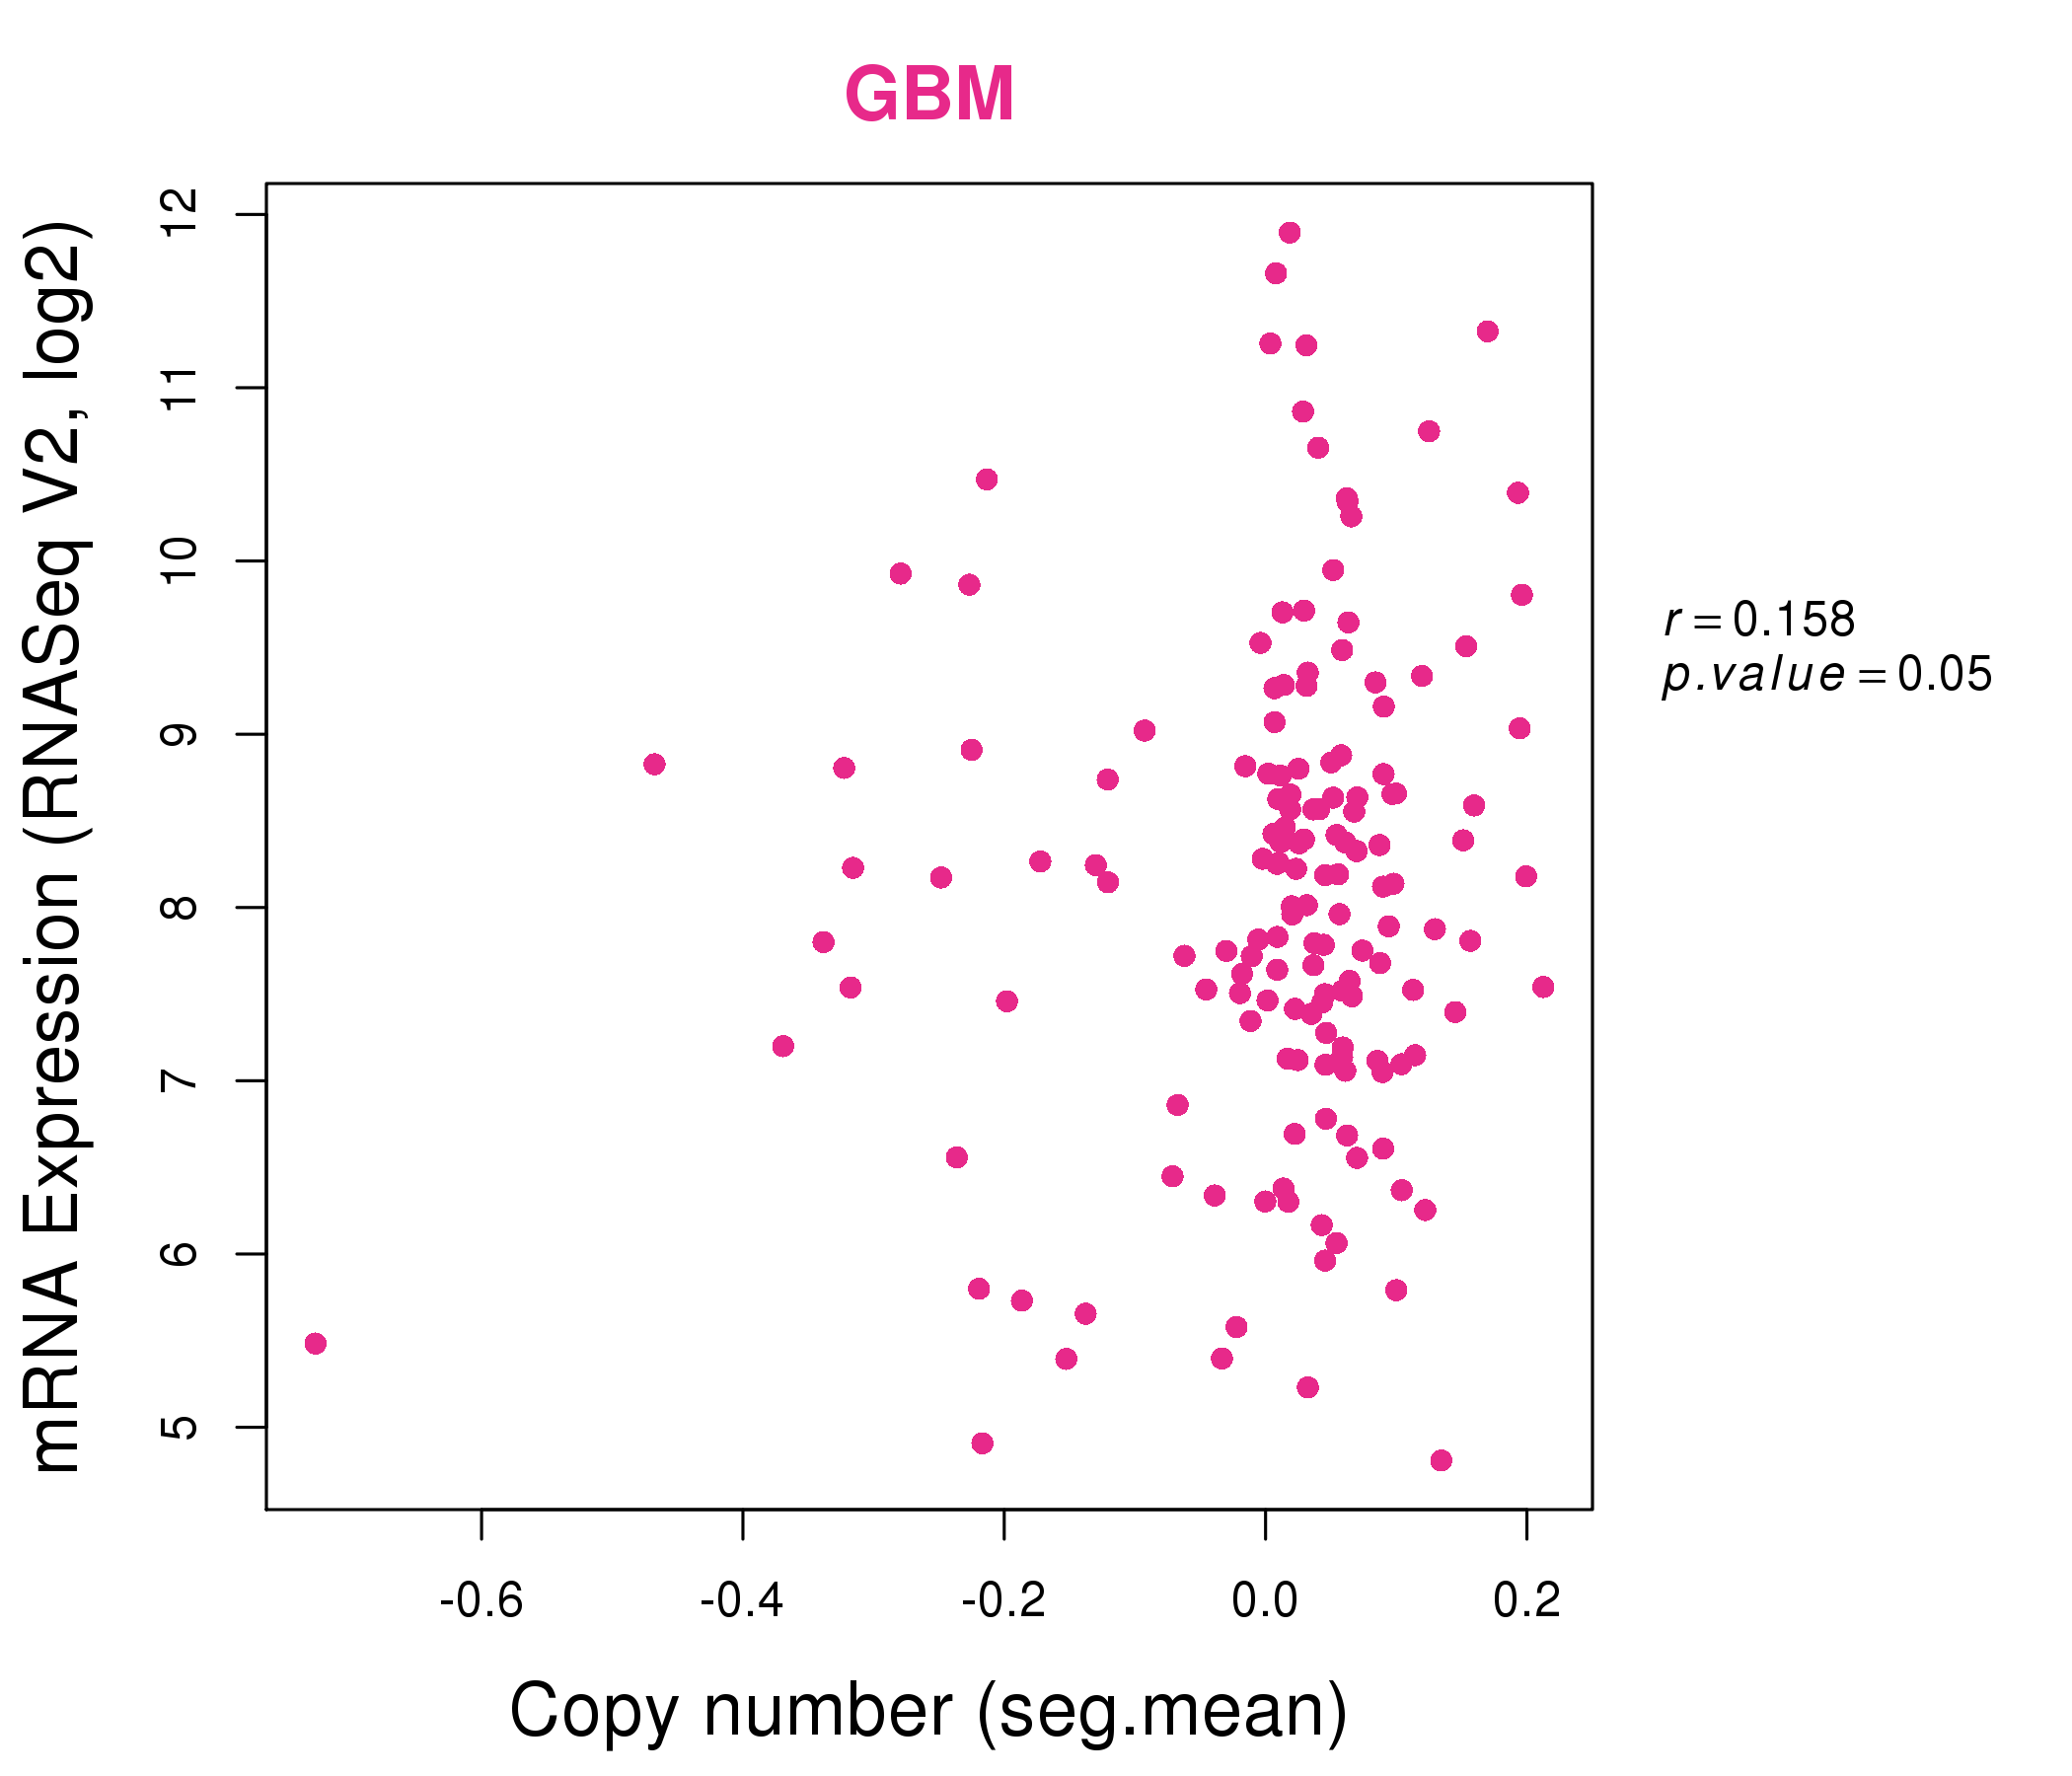
| * Copy number data were extracted from TCGA using R package TCGA-Assembler. The URLs of all public data files on TCGA DCC data server were gathered on Jan-05-2015. Function ProcessCNAData in TCGA-Assembler package was used to obtain gene-level copy number value which is calculated as the average copy number of the genomic region of a gene. |
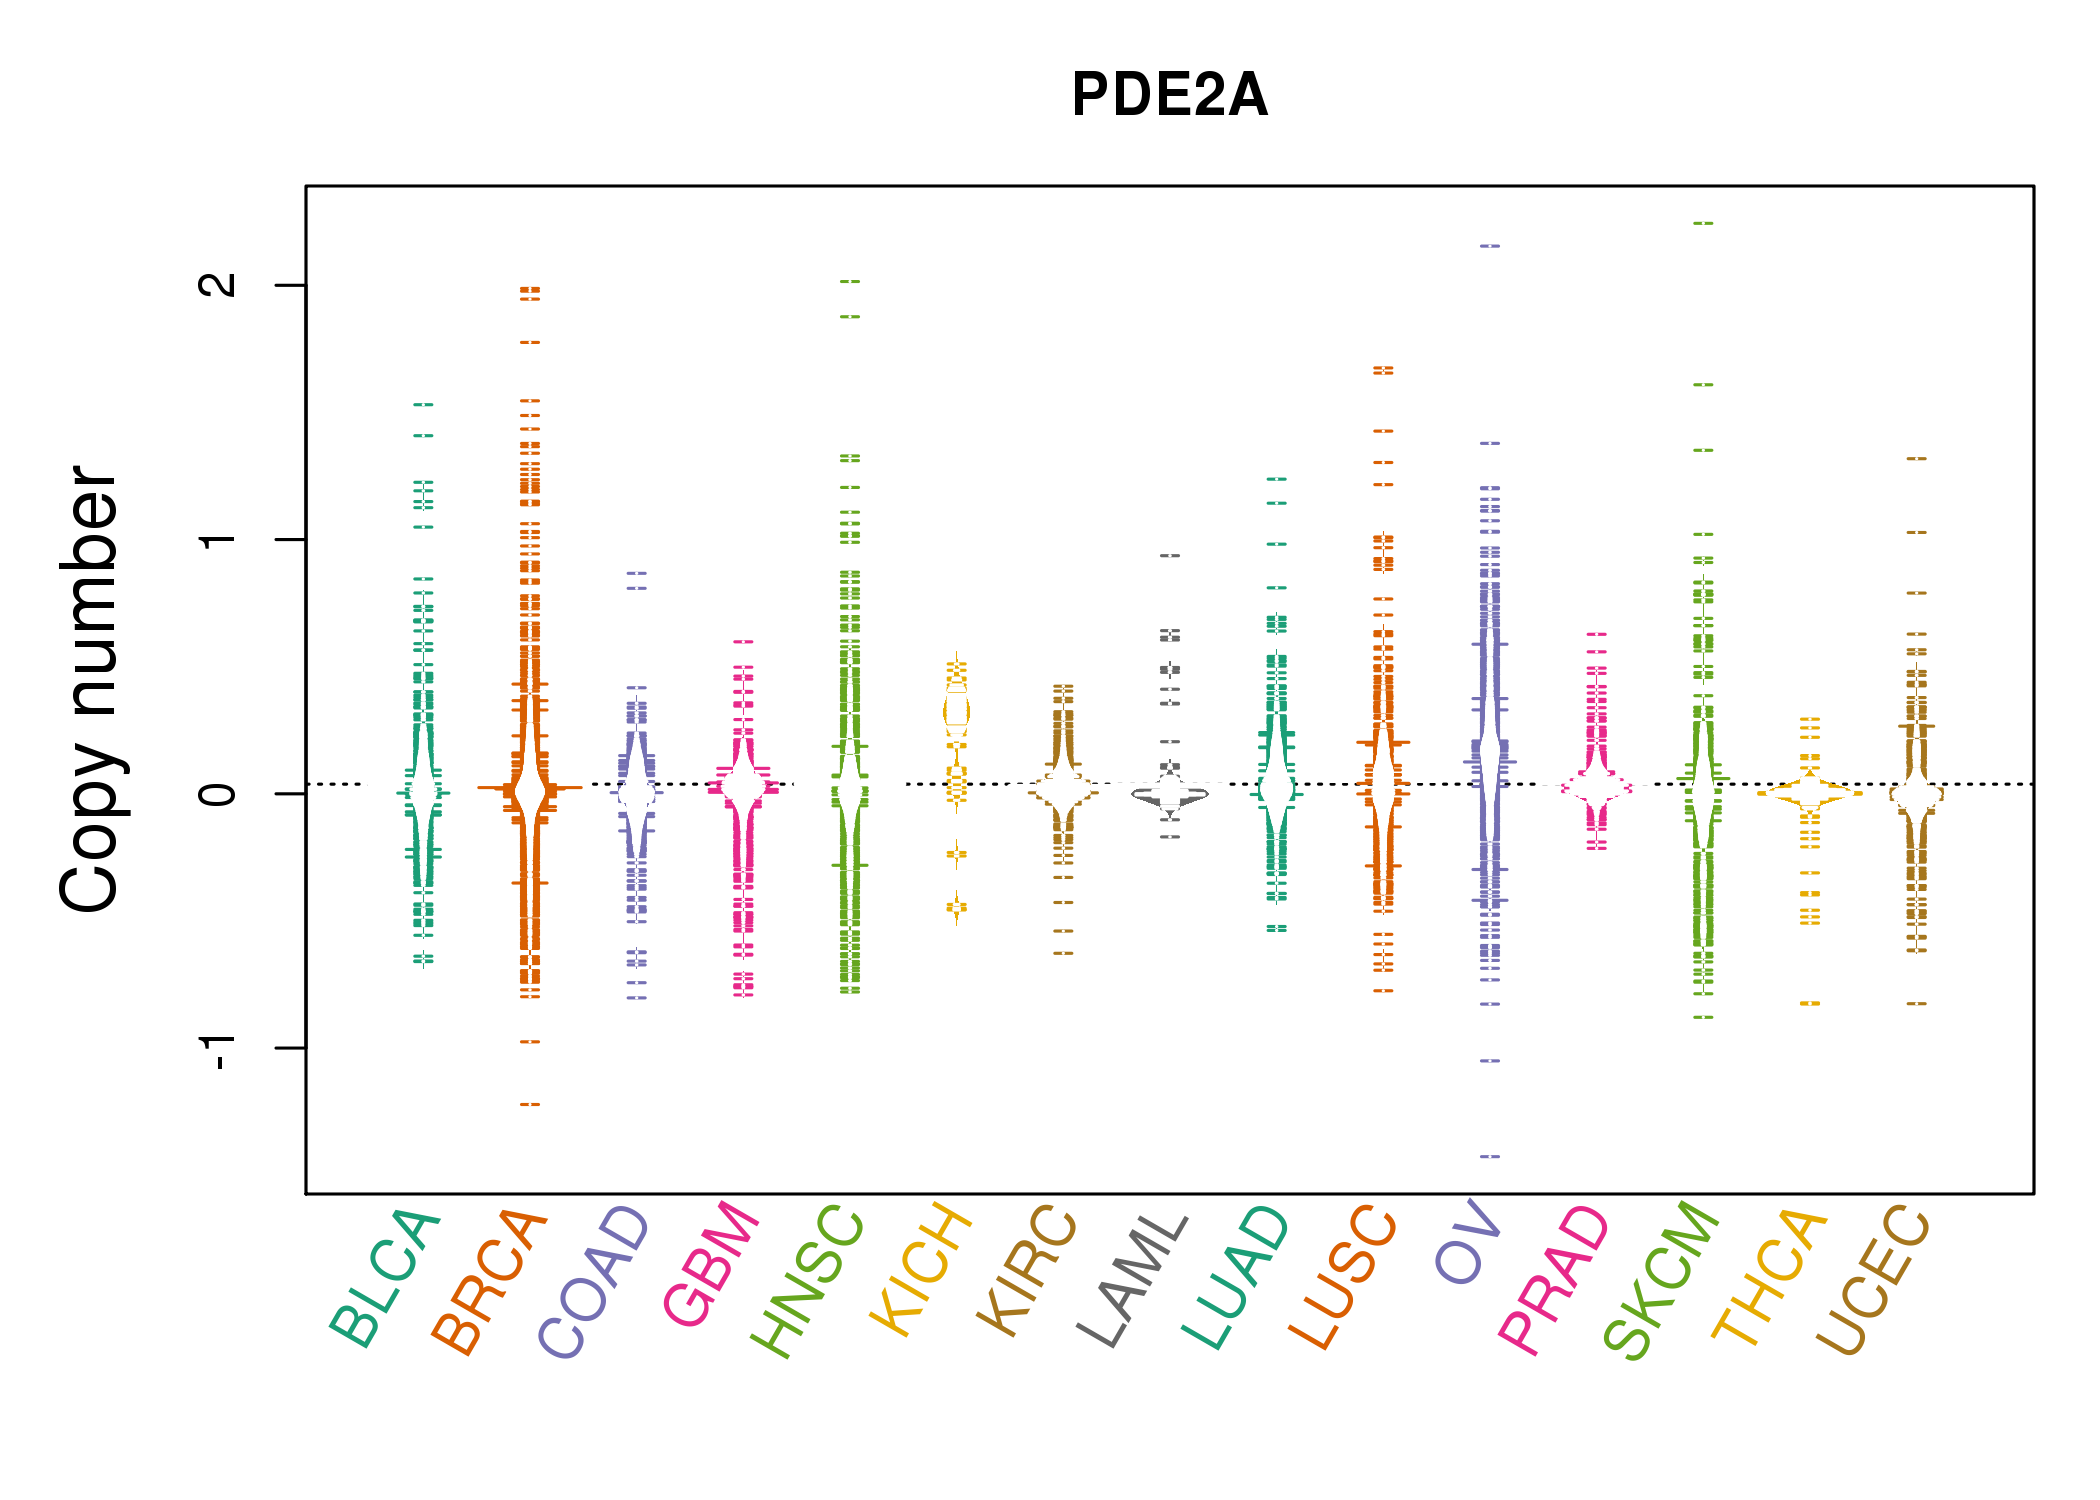 |
| cf) Tissue ID[Tissue type]: BLCA[Bladder Urothelial Carcinoma], BRCA[Breast invasive carcinoma], CESC[Cervical squamous cell carcinoma and endocervical adenocarcinoma], COAD[Colon adenocarcinoma], GBM[Glioblastoma multiforme], Glioma Low Grade, HNSC[Head and Neck squamous cell carcinoma], KICH[Kidney Chromophobe], KIRC[Kidney renal clear cell carcinoma], KIRP[Kidney renal papillary cell carcinoma], LAML[Acute Myeloid Leukemia], LUAD[Lung adenocarcinoma], LUSC[Lung squamous cell carcinoma], OV[Ovarian serous cystadenocarcinoma ], PAAD[Pancreatic adenocarcinoma], PRAD[Prostate adenocarcinoma], SKCM[Skin Cutaneous Melanoma], STAD[Stomach adenocarcinoma], THCA[Thyroid carcinoma], UCEC[Uterine Corpus Endometrial Carcinoma] |
| Top |
| Gene Expression for PDE2A |
| * CCLE gene expression data were extracted from CCLE_Expression_Entrez_2012-10-18.res: Gene-centric RMA-normalized mRNA expression data. |
 |
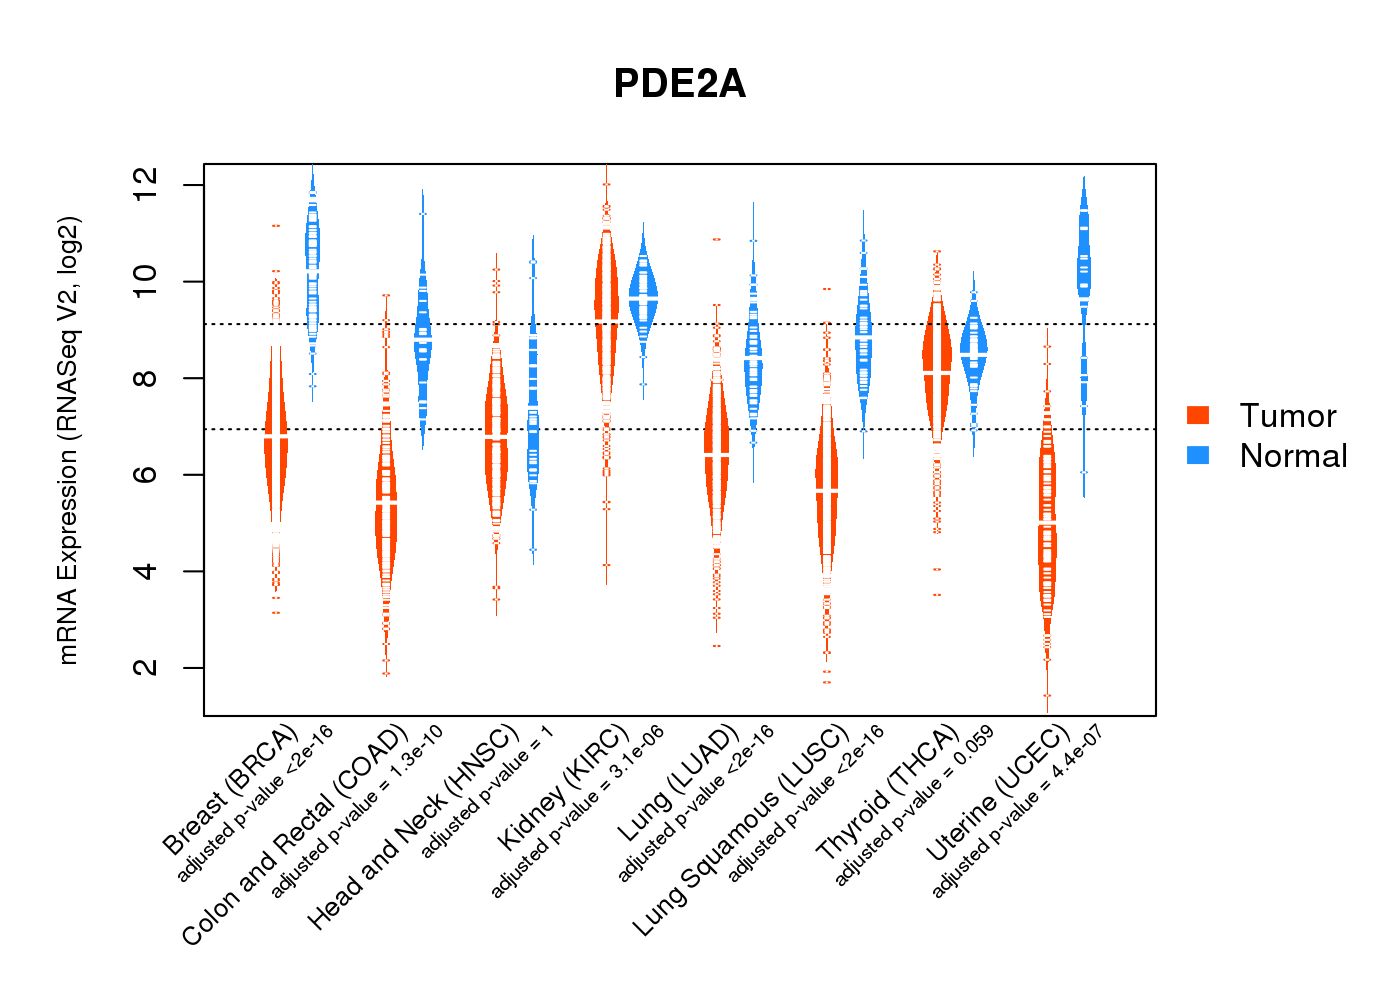
| * Normalized gene expression data of RNASeqV2 was extracted from TCGA using R package TCGA-Assembler. The URLs of all public data files on TCGA DCC data server were gathered at Jan-05-2015. Only eight cancer types have enough normal control samples for differential expression analysis. (t test, adjusted p<0.05 (using Benjamini-Hochberg FDR)) |
 |
| Top |
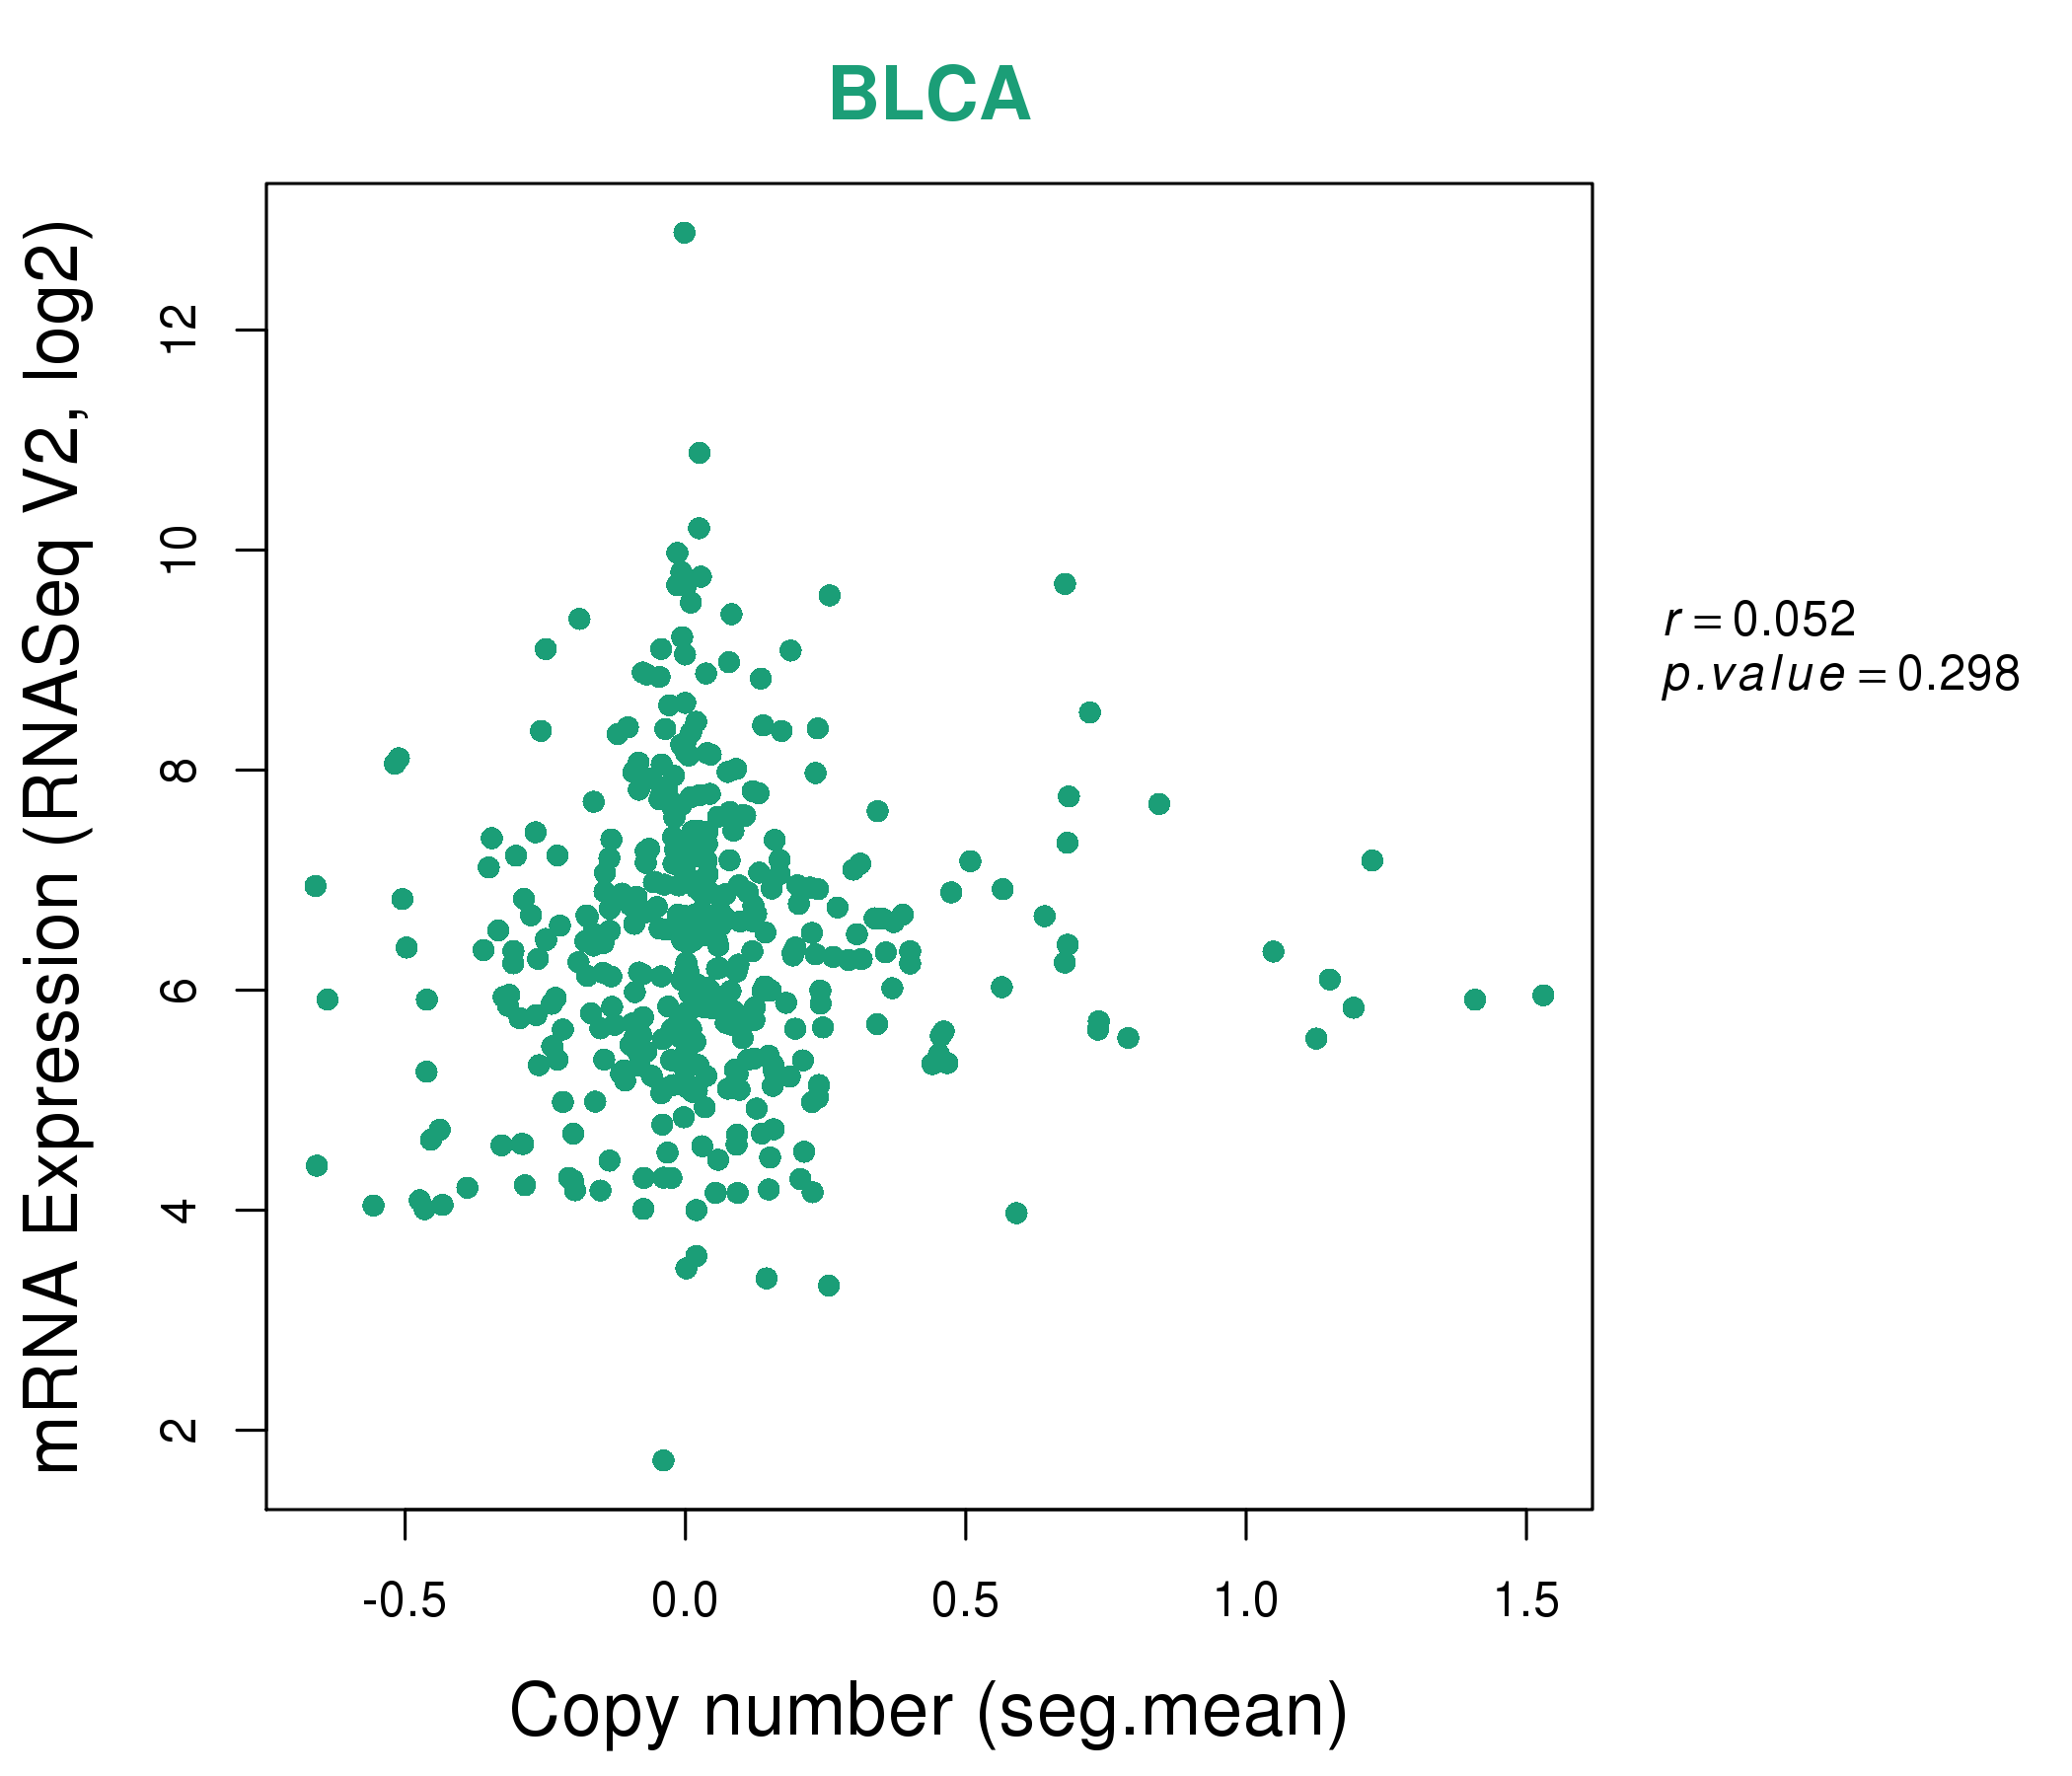
| * This plots show the correlation between CNV and gene expression. |
: Open all plots for all cancer types
 |
|
 |
|
| Top |
| Gene-Gene Network Information |
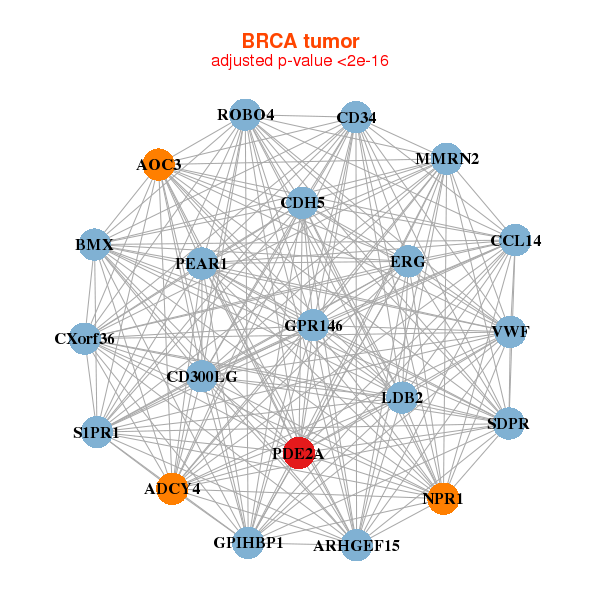
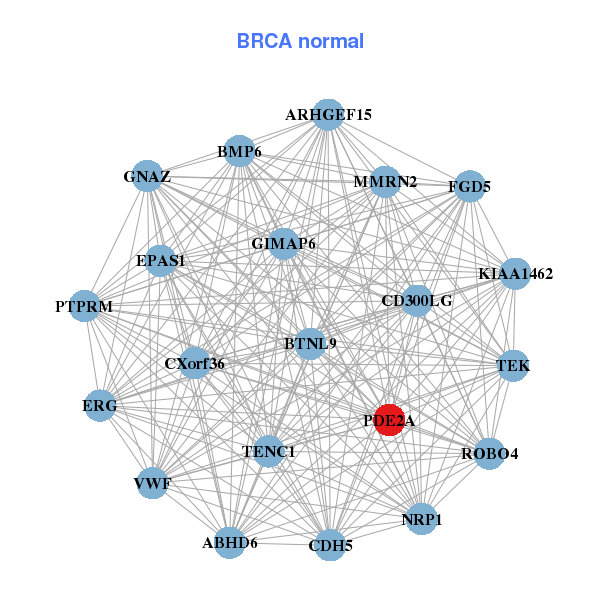
| * Co-Expression network figures were drawn using R package igraph. Only the top 20 genes with the highest correlations were shown. Red circle: input gene, orange circle: cell metabolism gene, sky circle: other gene |
: Open all plots for all cancer types
 |
| ||||
| ADCY4,AOC3,ARHGEF15,BMX,CCL14,CD300LG,CD34, CDH5,CXorf36,ERG,GPIHBP1,GPR146,LDB2,MMRN2, NPR1,PDE2A,PEAR1,ROBO4,S1PR1,SDPR,VWF | ABHD6,ARHGEF15,BMP6,BTNL9,CD300LG,CDH5,CXorf36, EPAS1,ERG,FGD5,GIMAP6,GNAZ,KIAA1462,MMRN2, NRP1,PDE2A,PTPRM,ROBO4,TEK,TENC1,VWF | ||||
 |
| ||||
| ABCC9,ANK2,AOC3,CACNA2D1,CCDC69,CCL14,CLIP3, ACKR1,FAM13C,FILIP1,JAM2,NPR1,PDE2A,RBMS3, S1PR1,SDPR,SLC9A9,SPARCL1,SV2B,TLL1,ZEB1 | AOC3,ATP1A2,CD109,CLIP3,CPXM2,FAM127C,FBXL7, GJC2,LOXL4,MPP2,NLGN1,NPTXR,PCDHGB7,PDE2A, RBFOX2,RGAG4,RGMA,SEMA4C,SLC29A1,TGFB1I1,TSPAN18 |
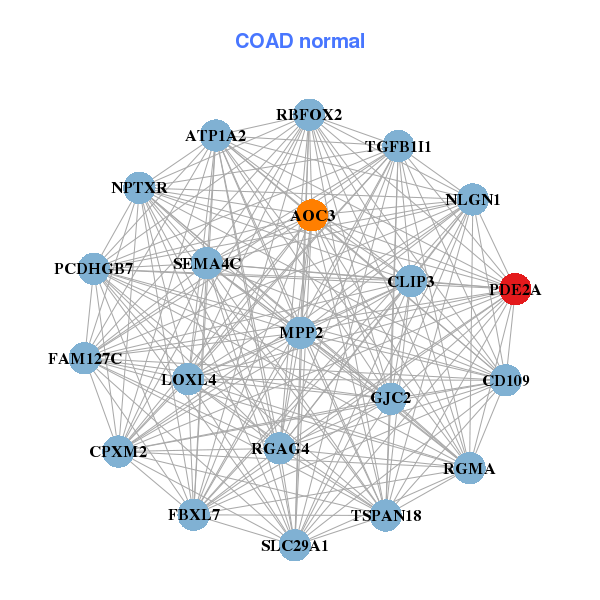
| * Co-Expression network figures were drawn using R package igraph. Only the top 20 genes with the highest correlations were shown. Red circle: input gene, orange circle: cell metabolism gene, sky circle: other gene |
: Open all plots for all cancer types
| Top |
: Open all interacting genes' information including KEGG pathway for all interacting genes from DAVID
| Top |
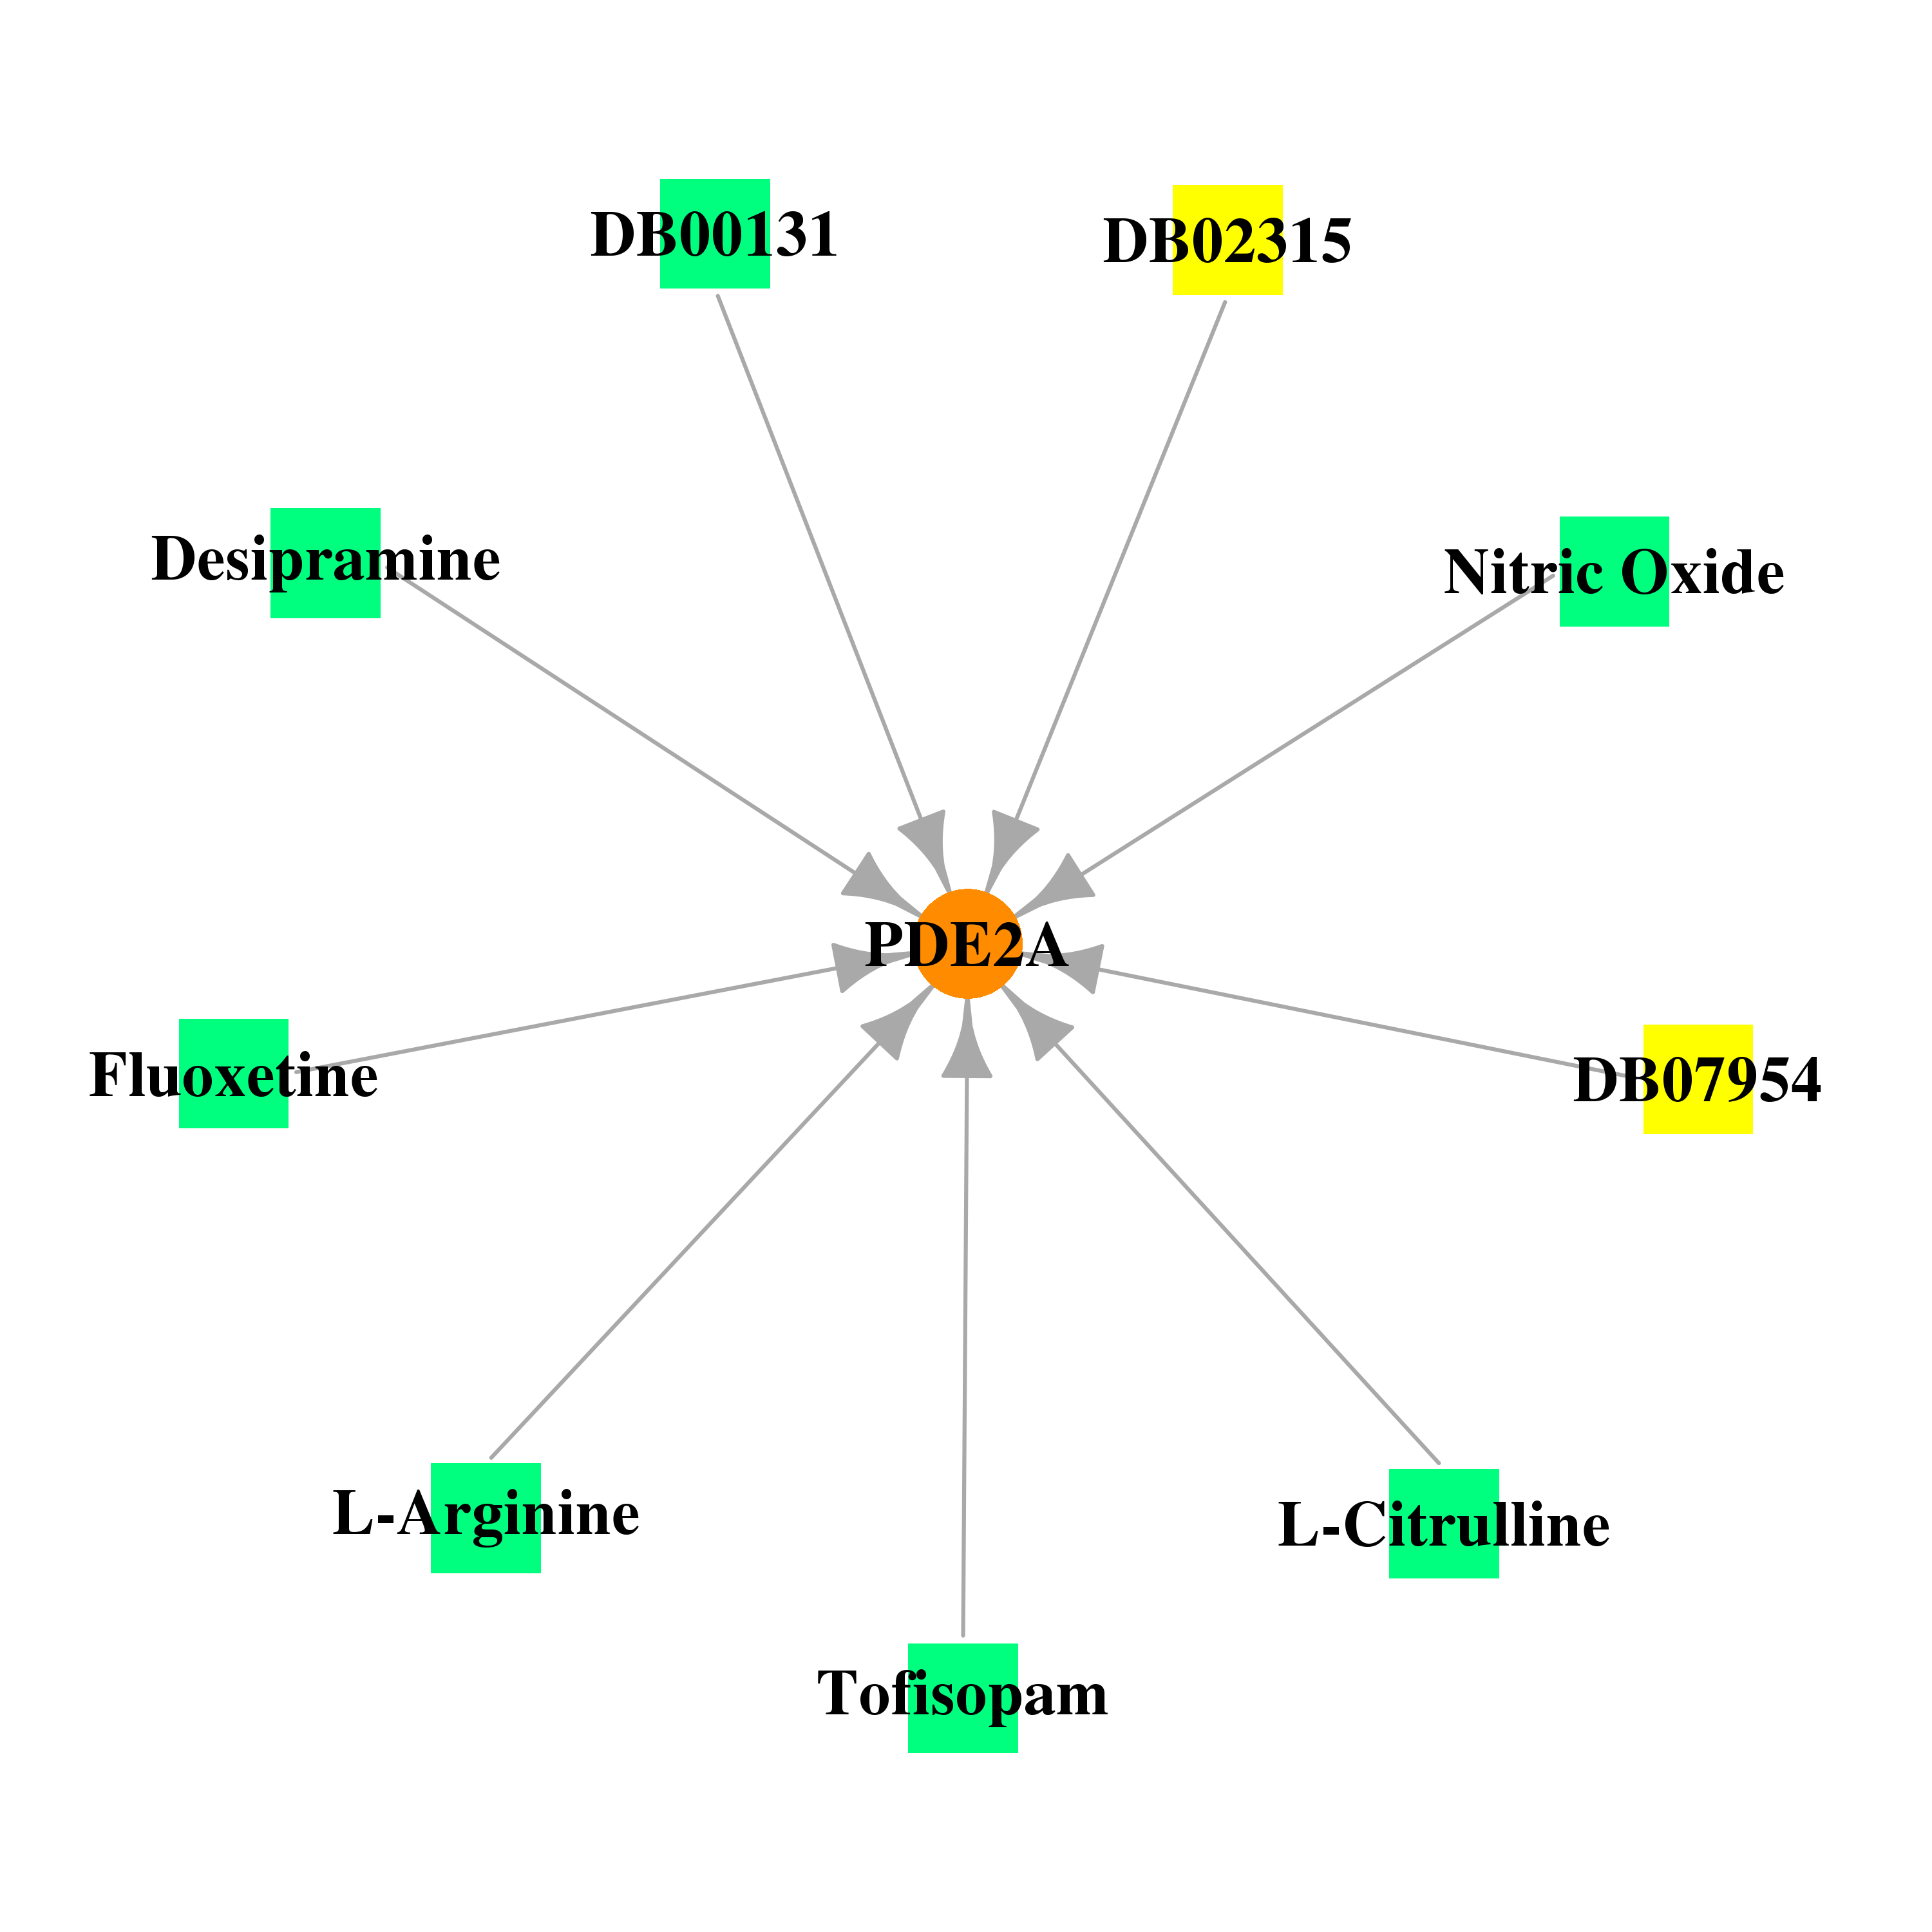
| Pharmacological Information for PDE2A |
| DB Category | DB Name | DB's ID and Url link |
| * Gene Centered Interaction Network. |
 |
| * Drug Centered Interaction Network. |
| DrugBank ID | Target Name | Drug Groups | Generic Name | Drug Centered Network | Drug Structure |
| DB02315 | phosphodiesterase 2A, cGMP-stimulated | experimental | Cyclic Guanosine Monophosphate |  |  |
| DB07954 | phosphodiesterase 2A, cGMP-stimulated | experimental | 3-ISOBUTYL-1-METHYLXANTHINE | 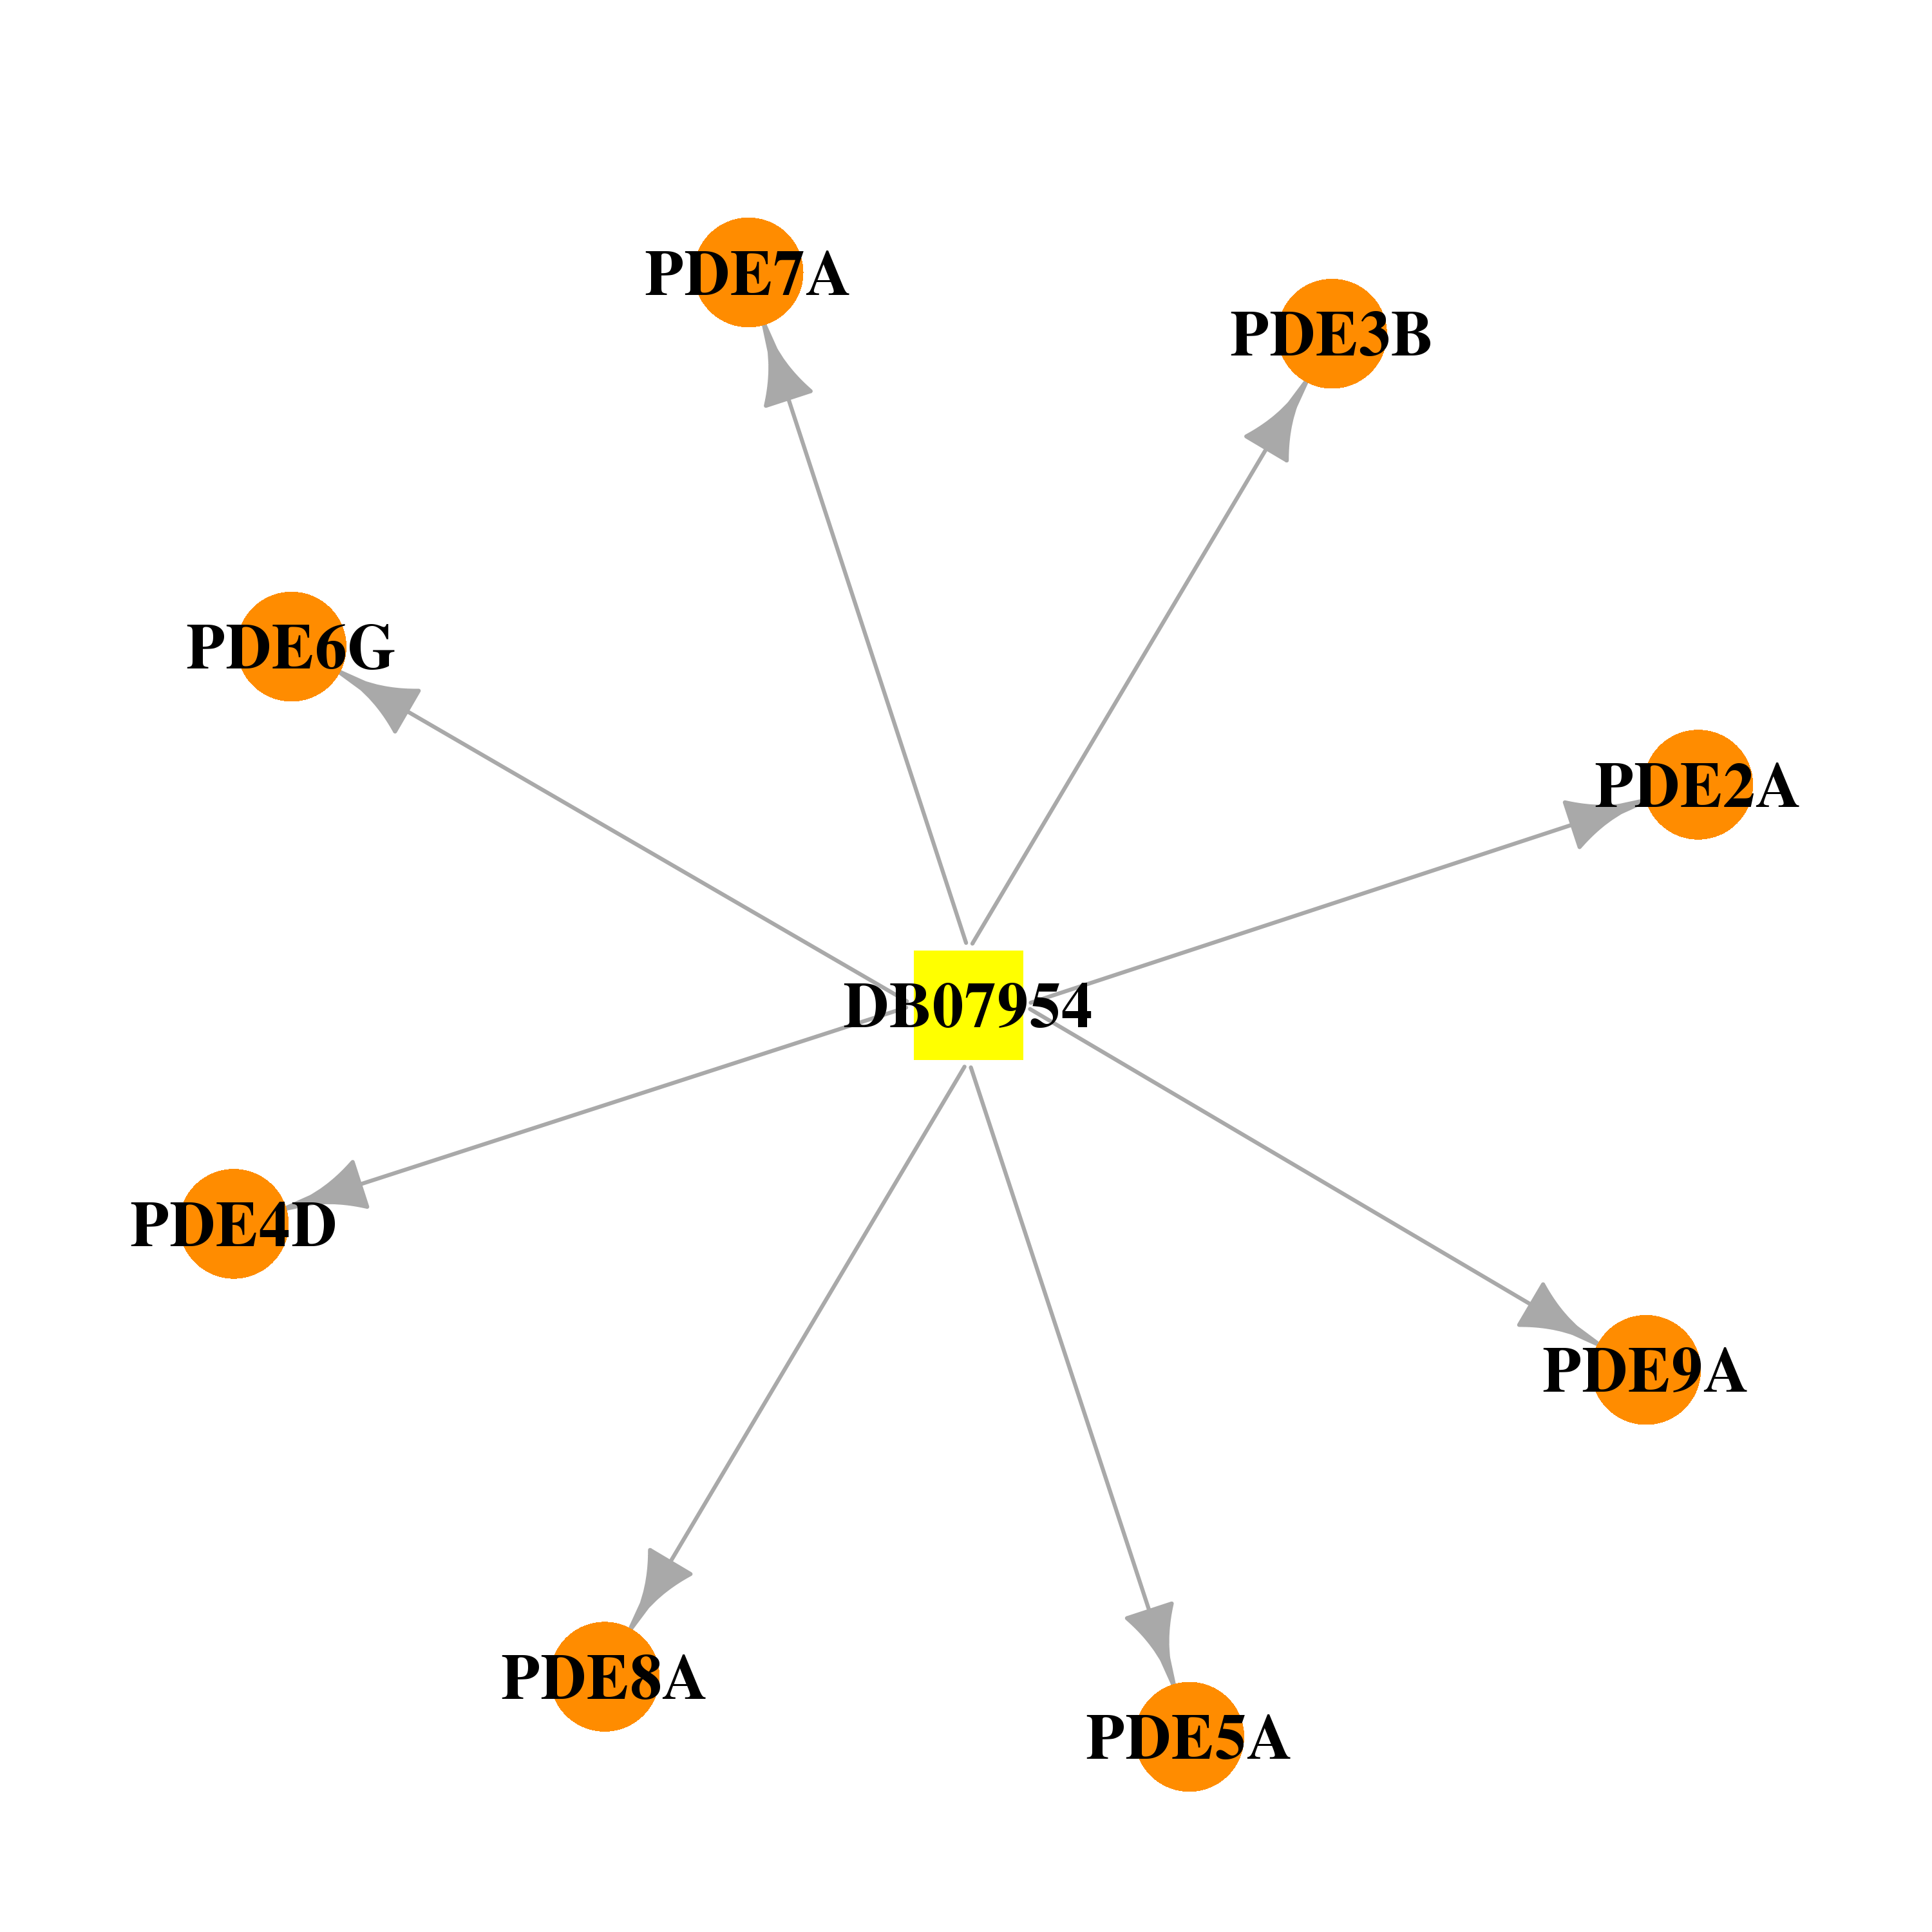 | 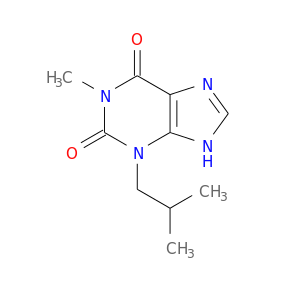 |
| DB08811 | phosphodiesterase 2A, cGMP-stimulated | approved | Tofisopam | 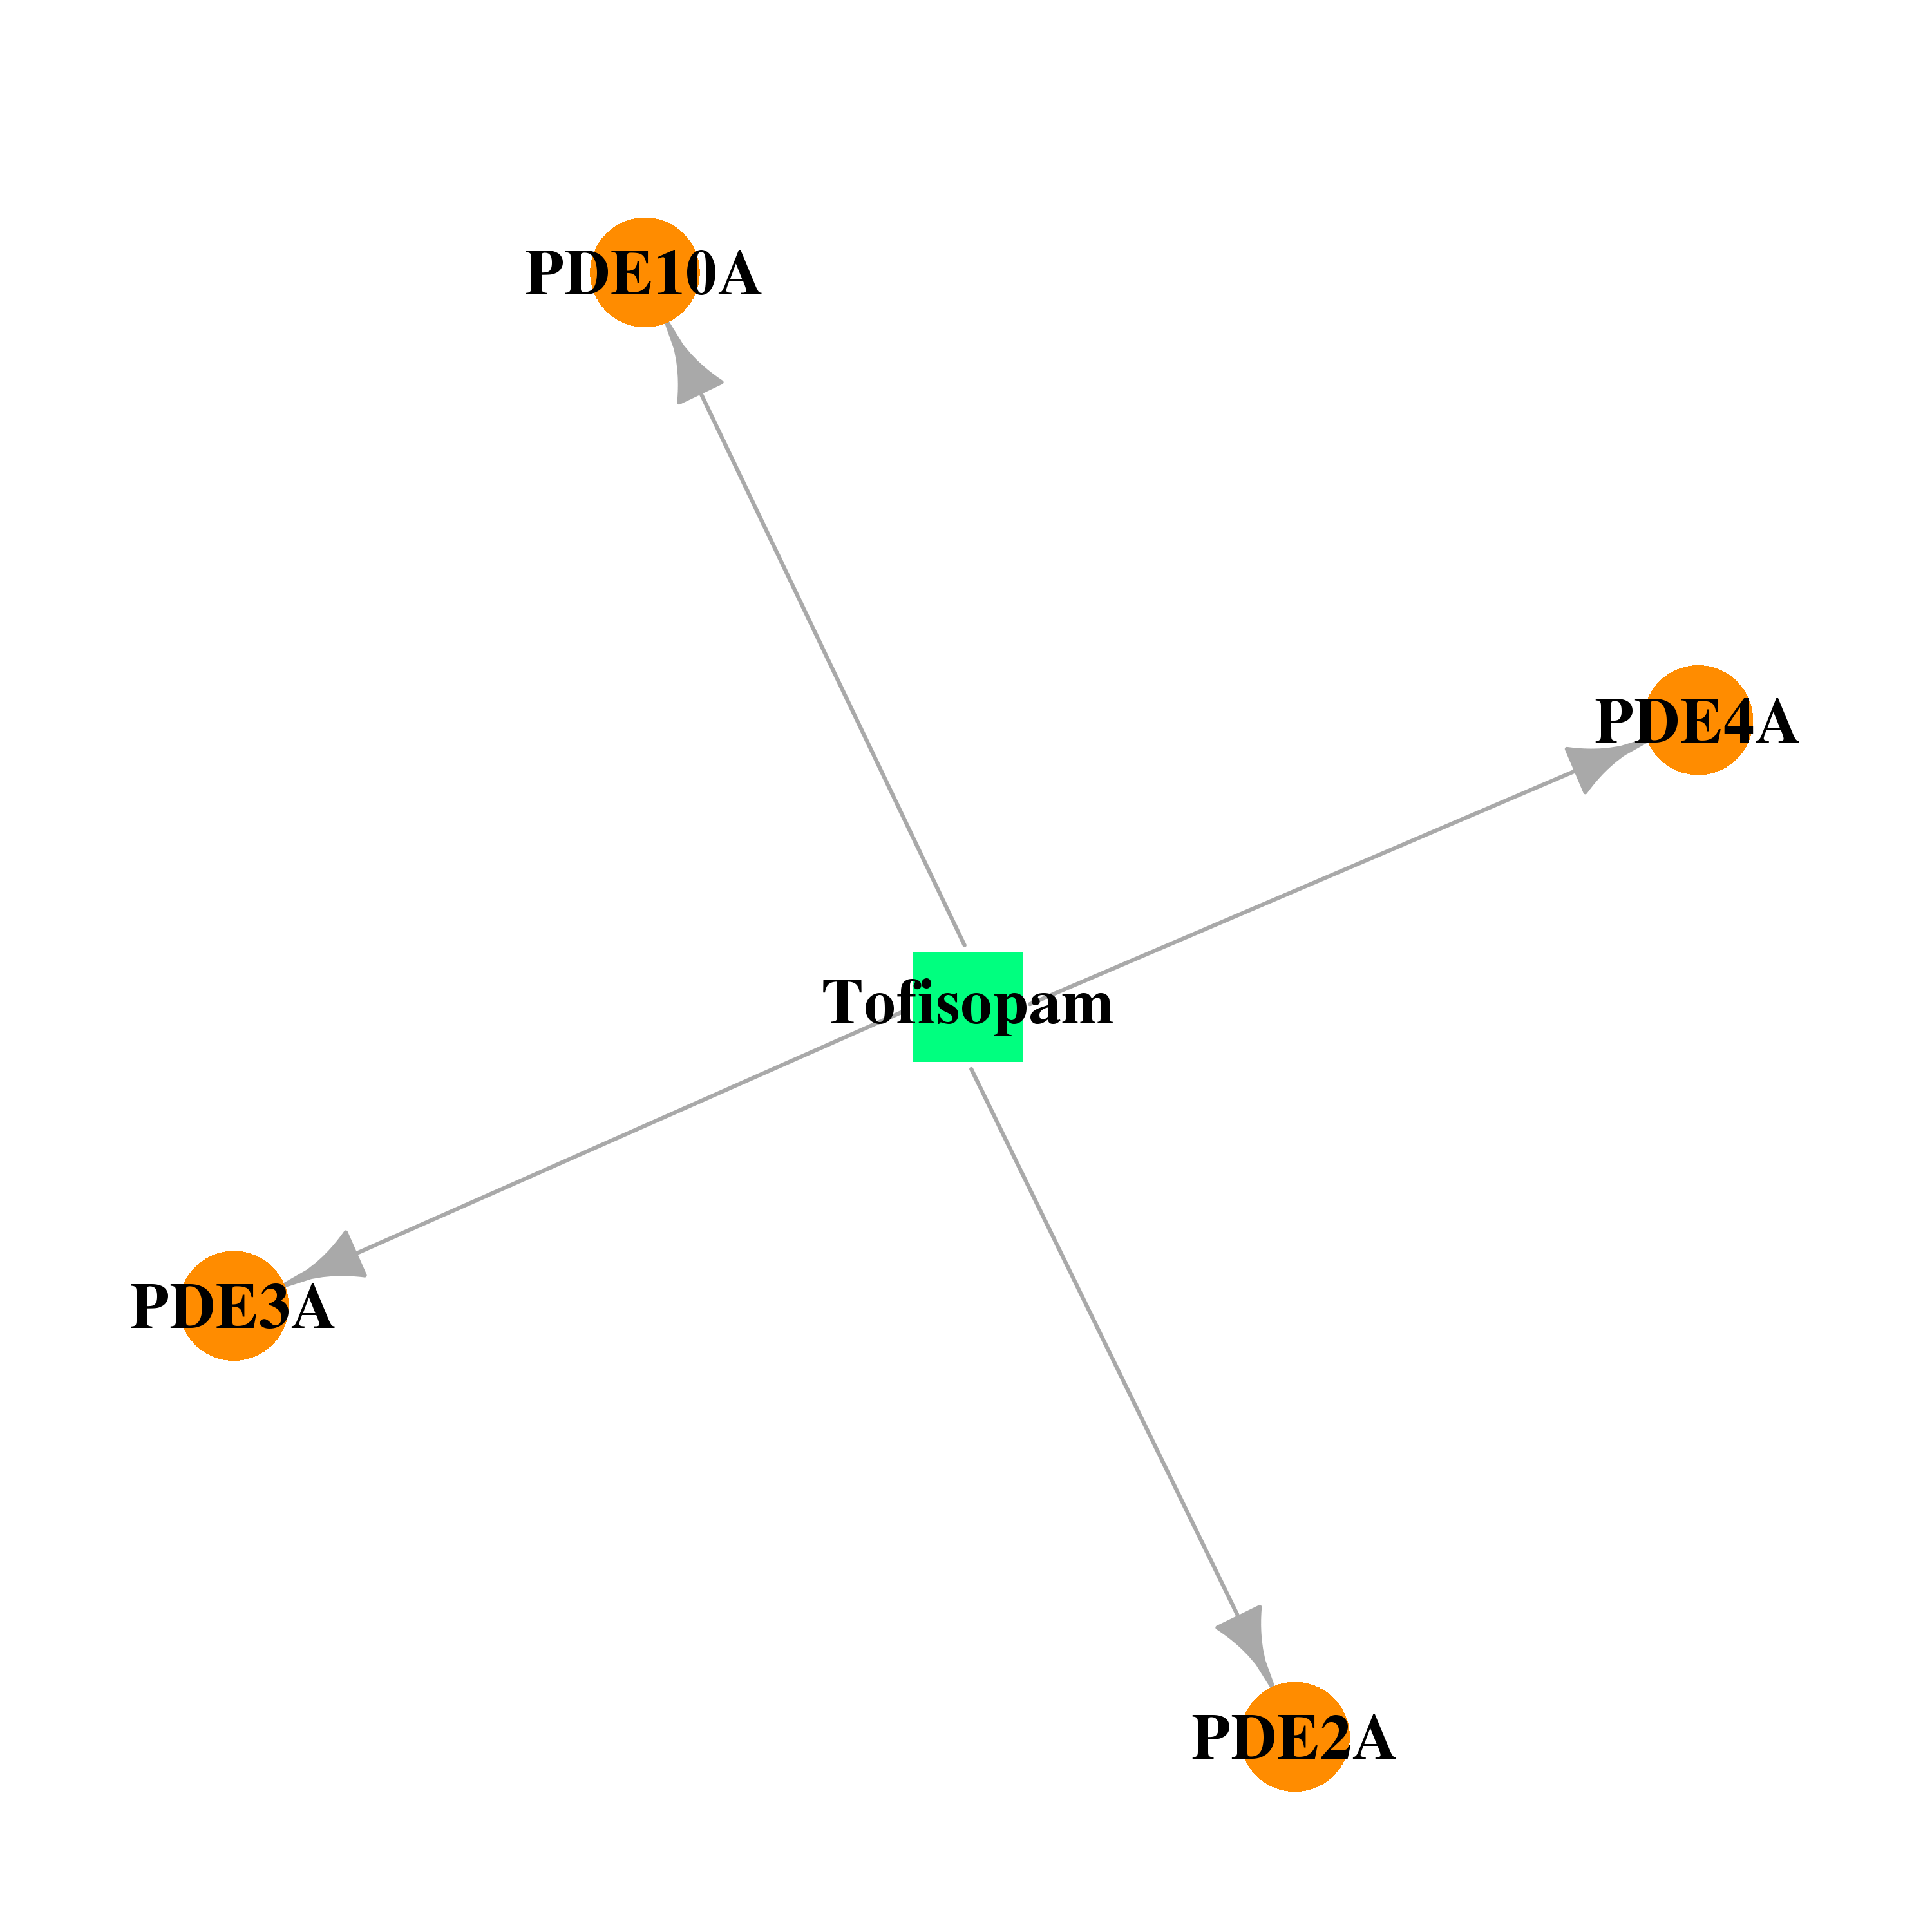 | 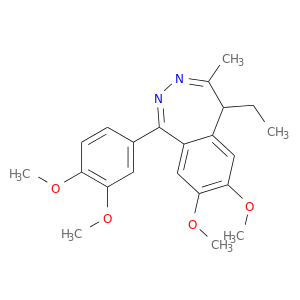 |
| DB00131 | phosphodiesterase 2A, cGMP-stimulated | approved; nutraceutical | Adenosine monophosphate | 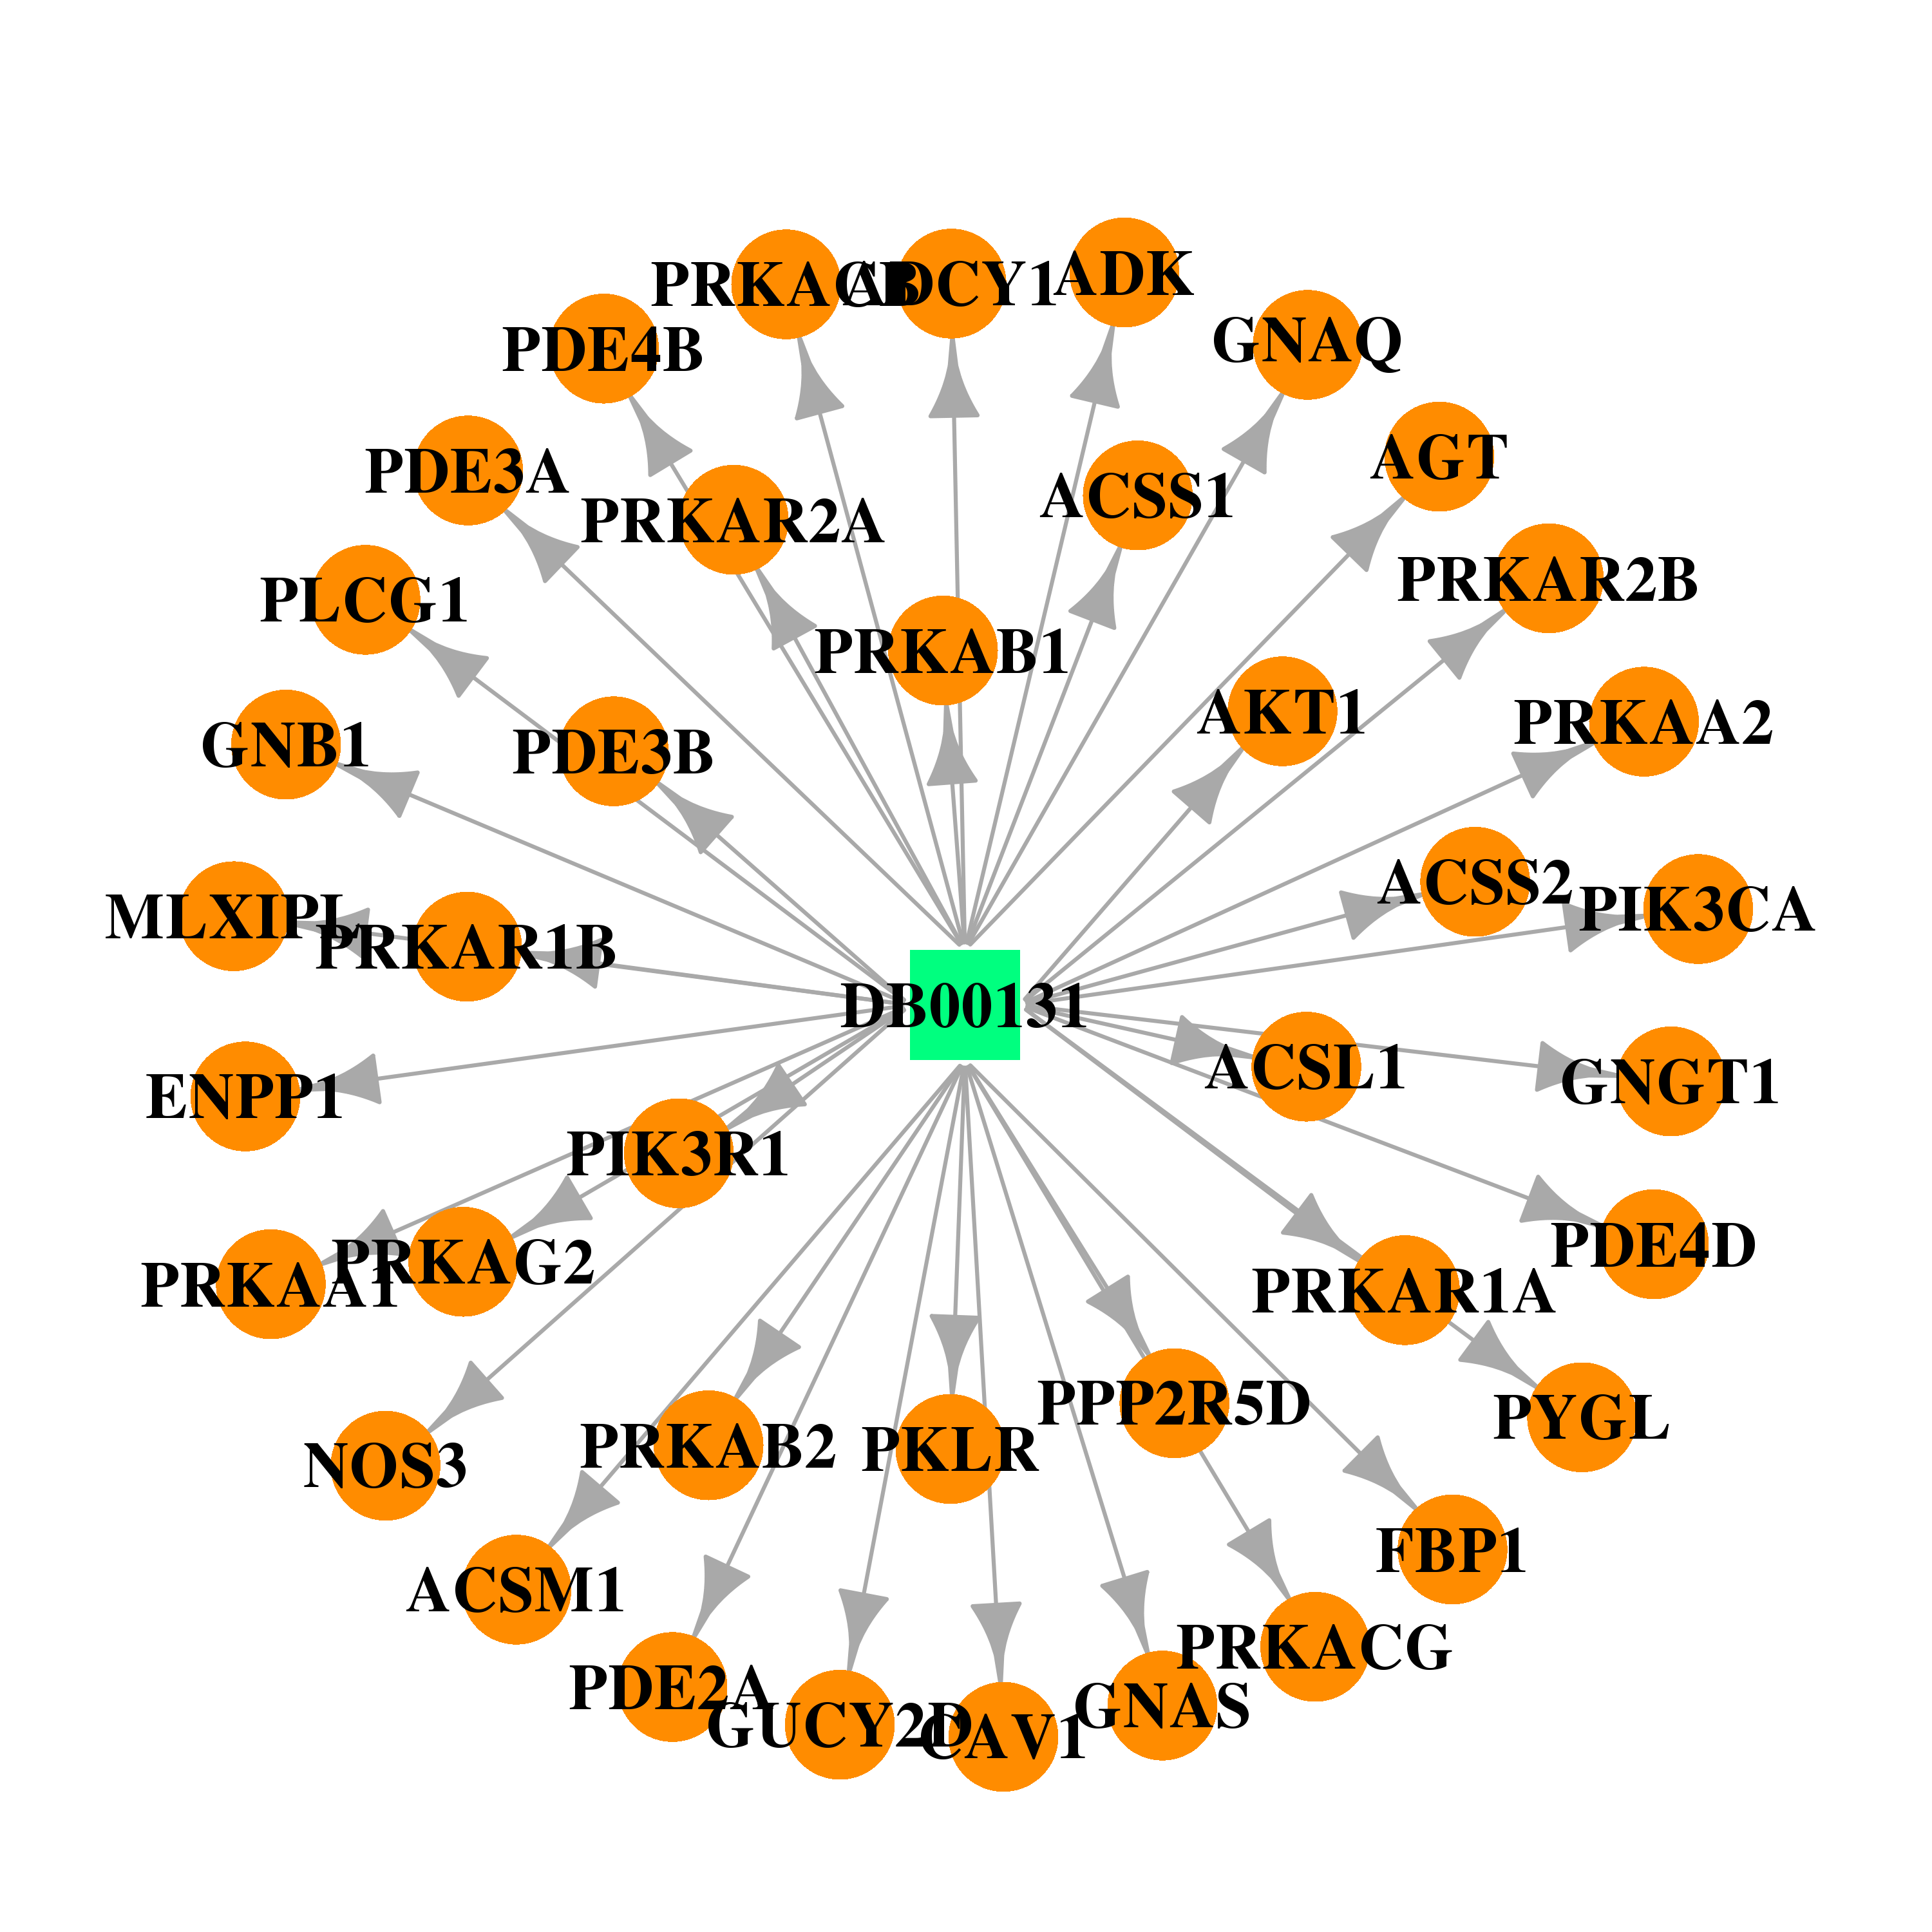 |  |
| DB00125 | phosphodiesterase 2A, cGMP-stimulated | approved; nutraceutical | L-Arginine |  |  |
| DB00155 | phosphodiesterase 2A, cGMP-stimulated | approved; nutraceutical | L-Citrulline | 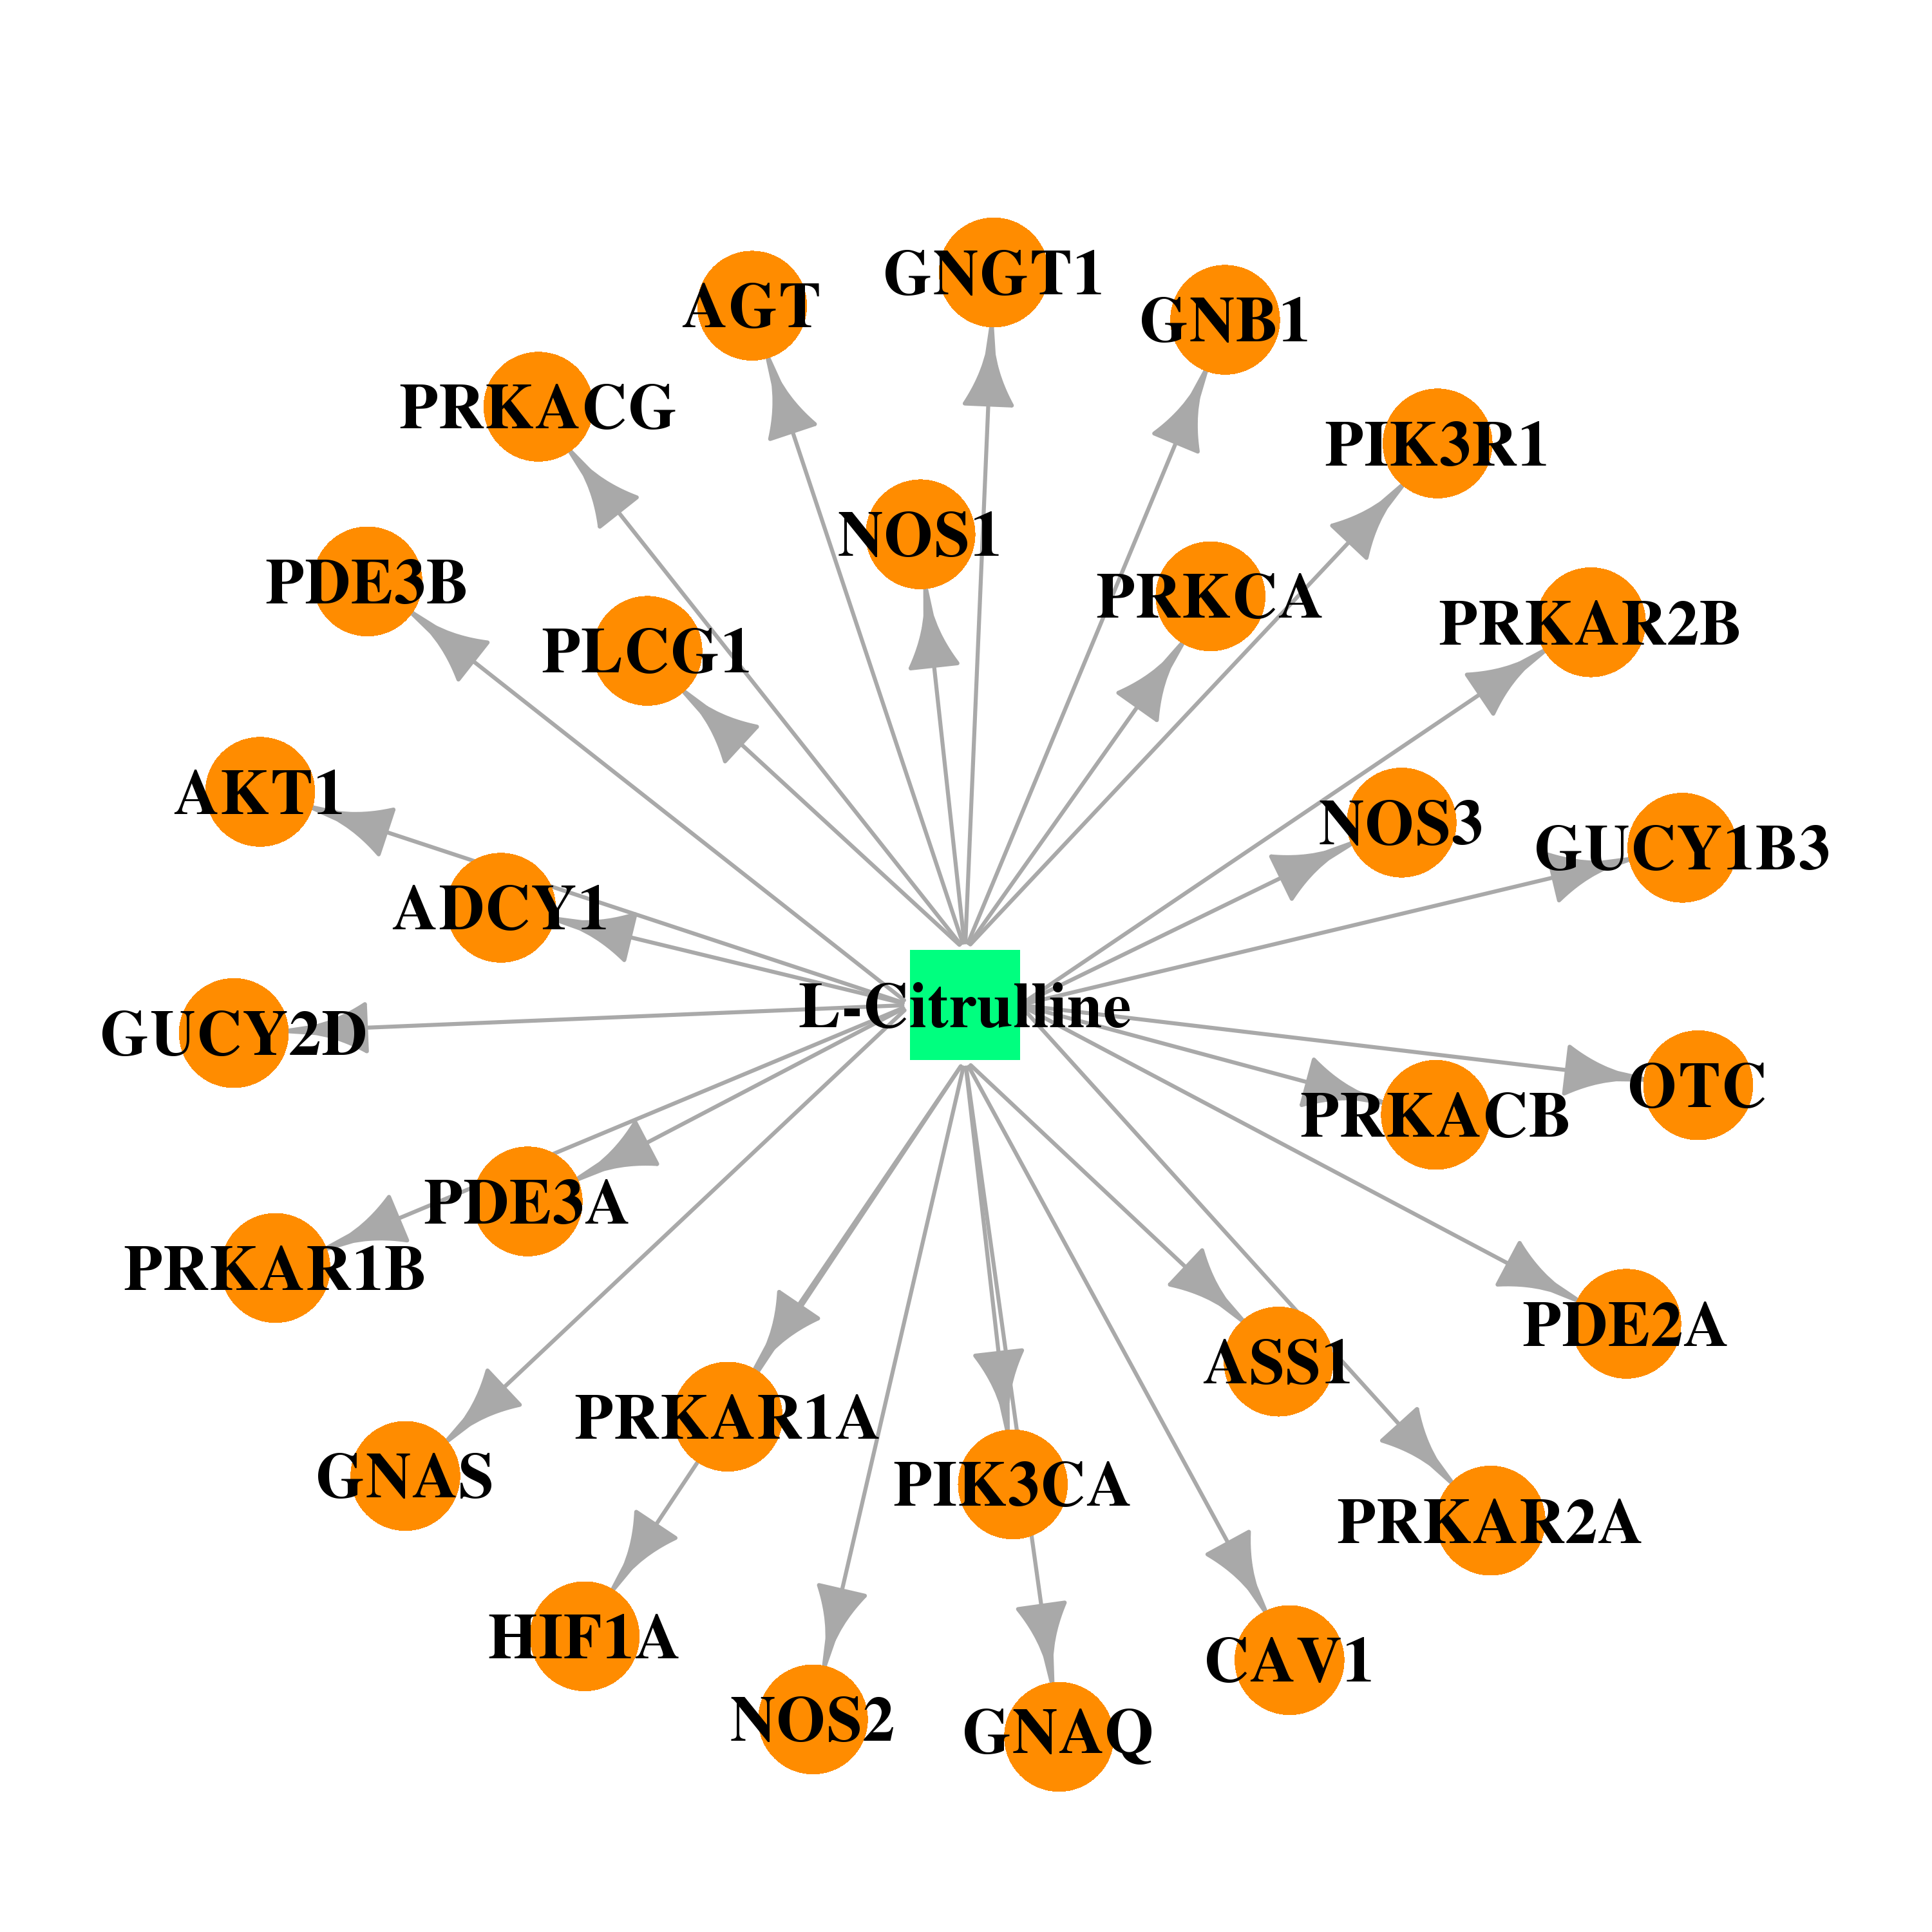 |  |
| DB00435 | phosphodiesterase 2A, cGMP-stimulated | approved | Nitric Oxide | 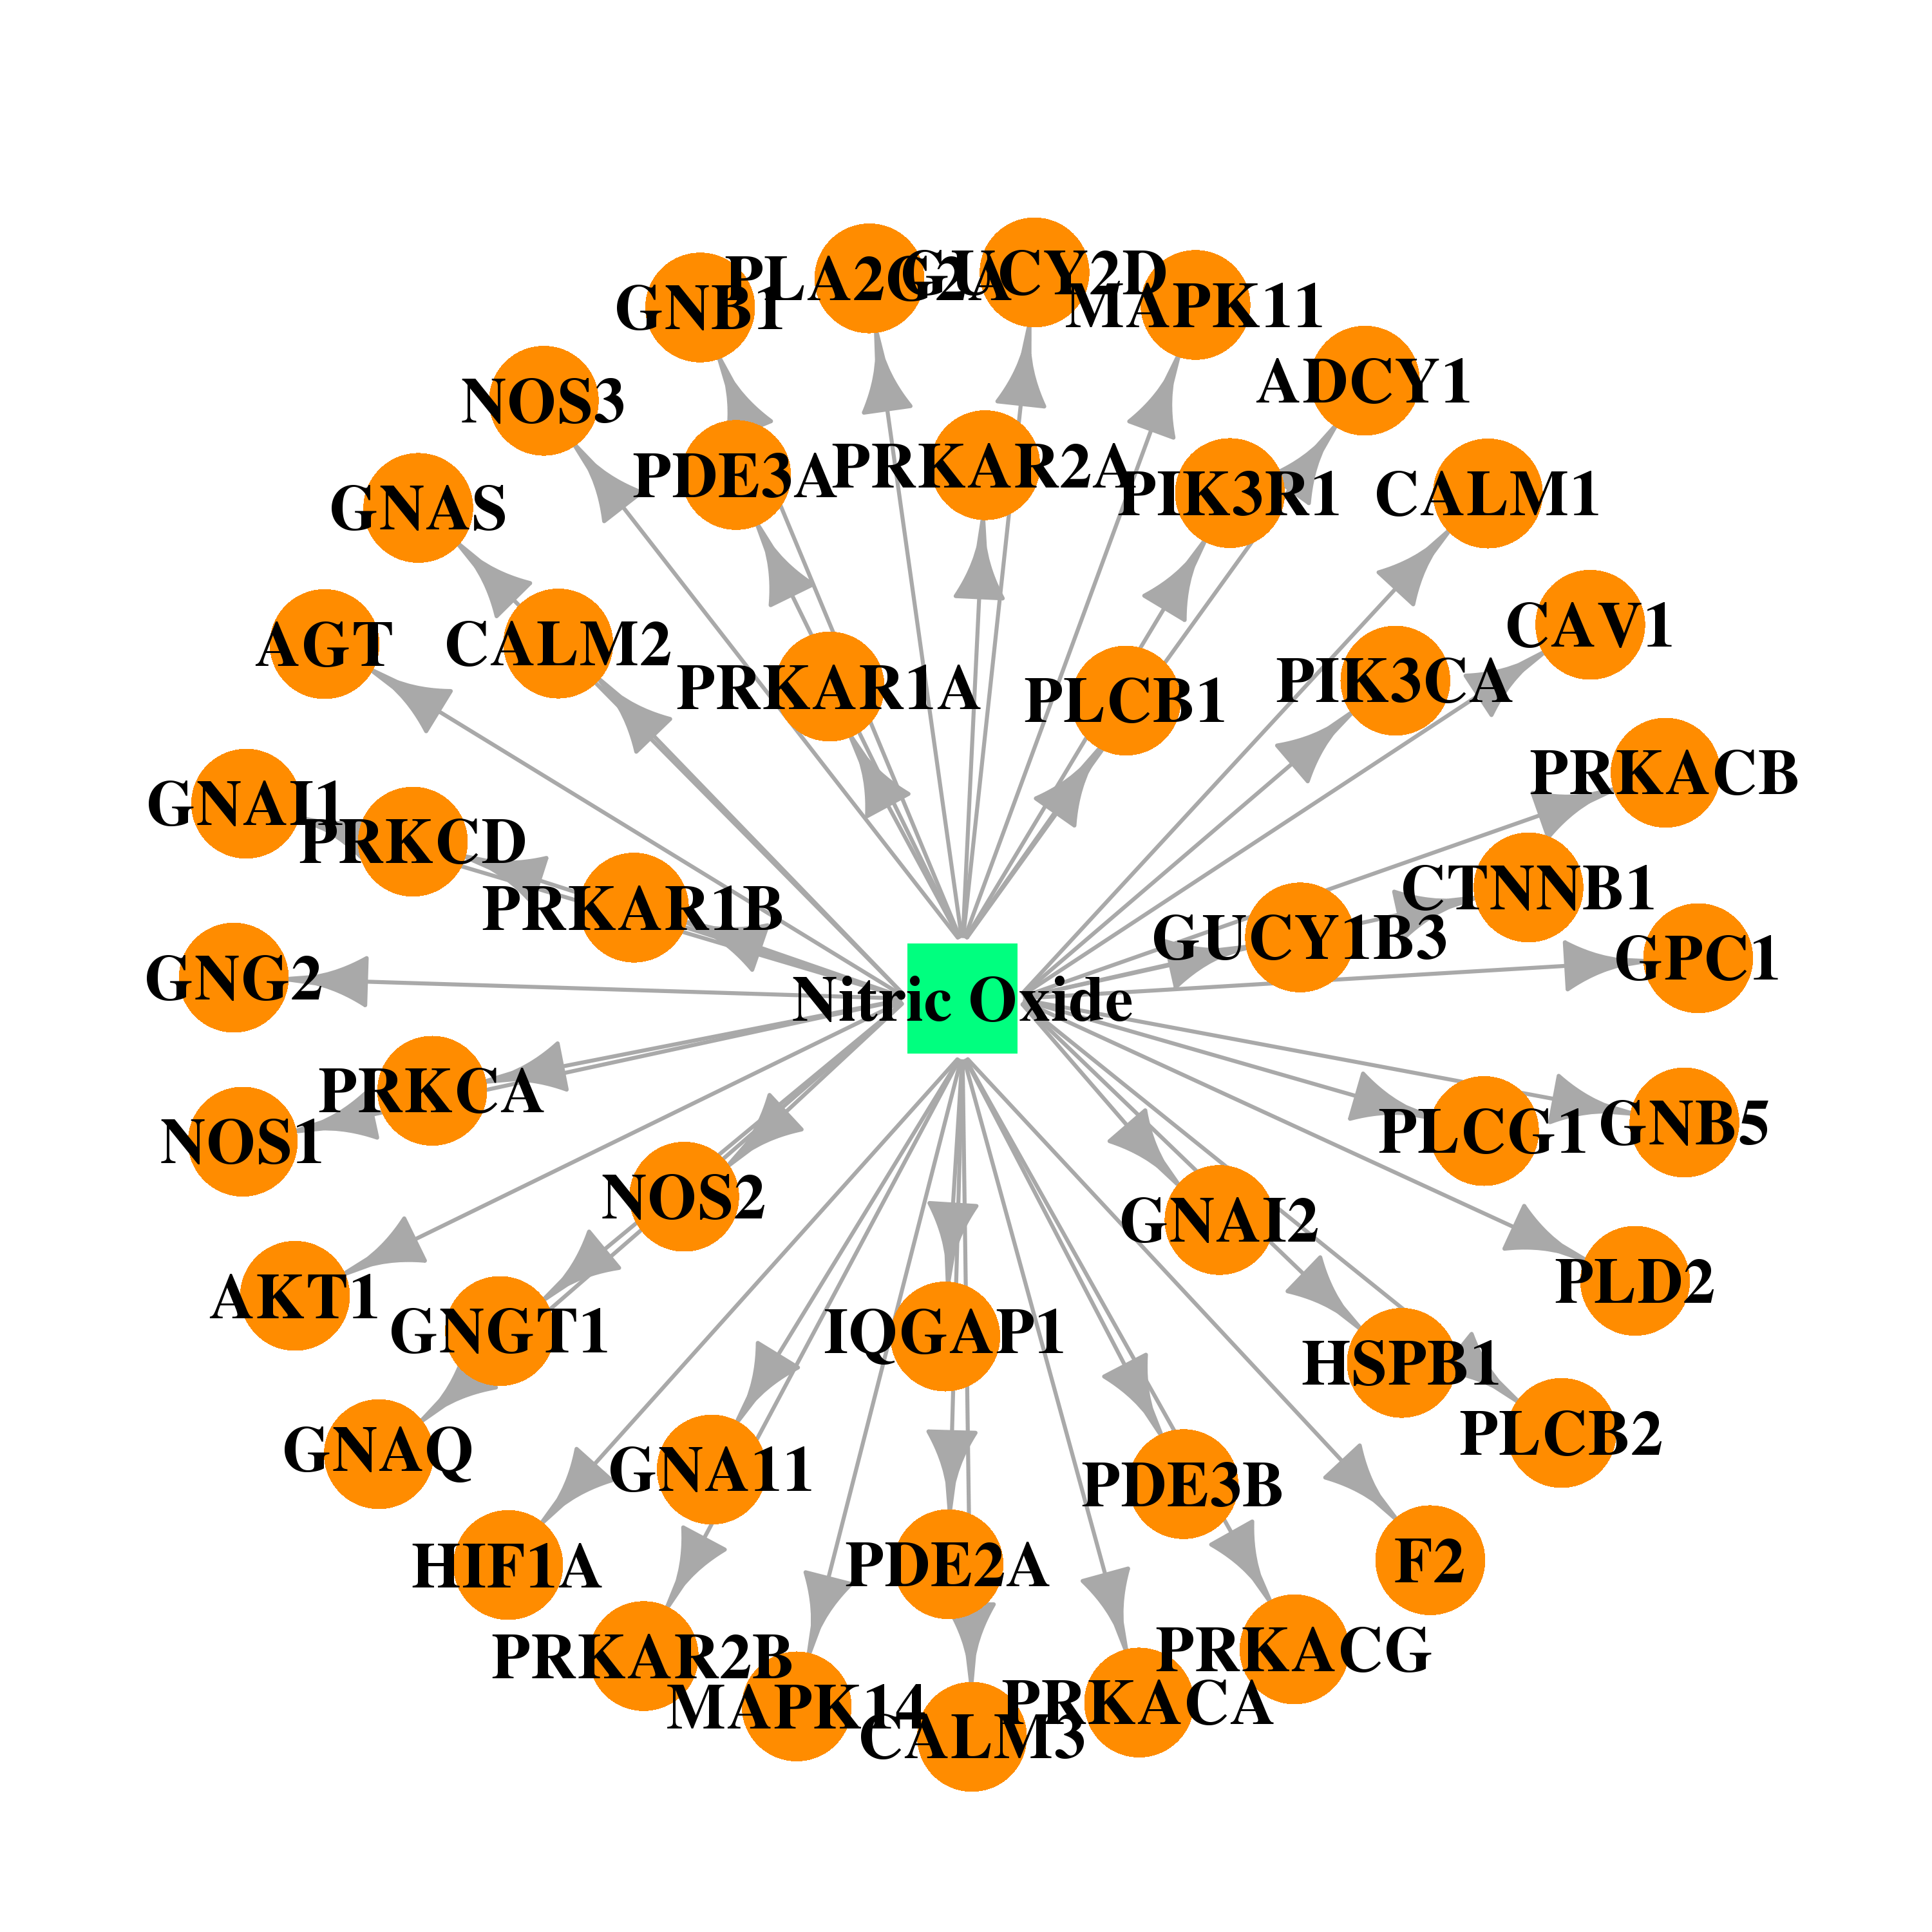 |  |
| DB01151 | phosphodiesterase 2A, cGMP-stimulated | approved | Desipramine | 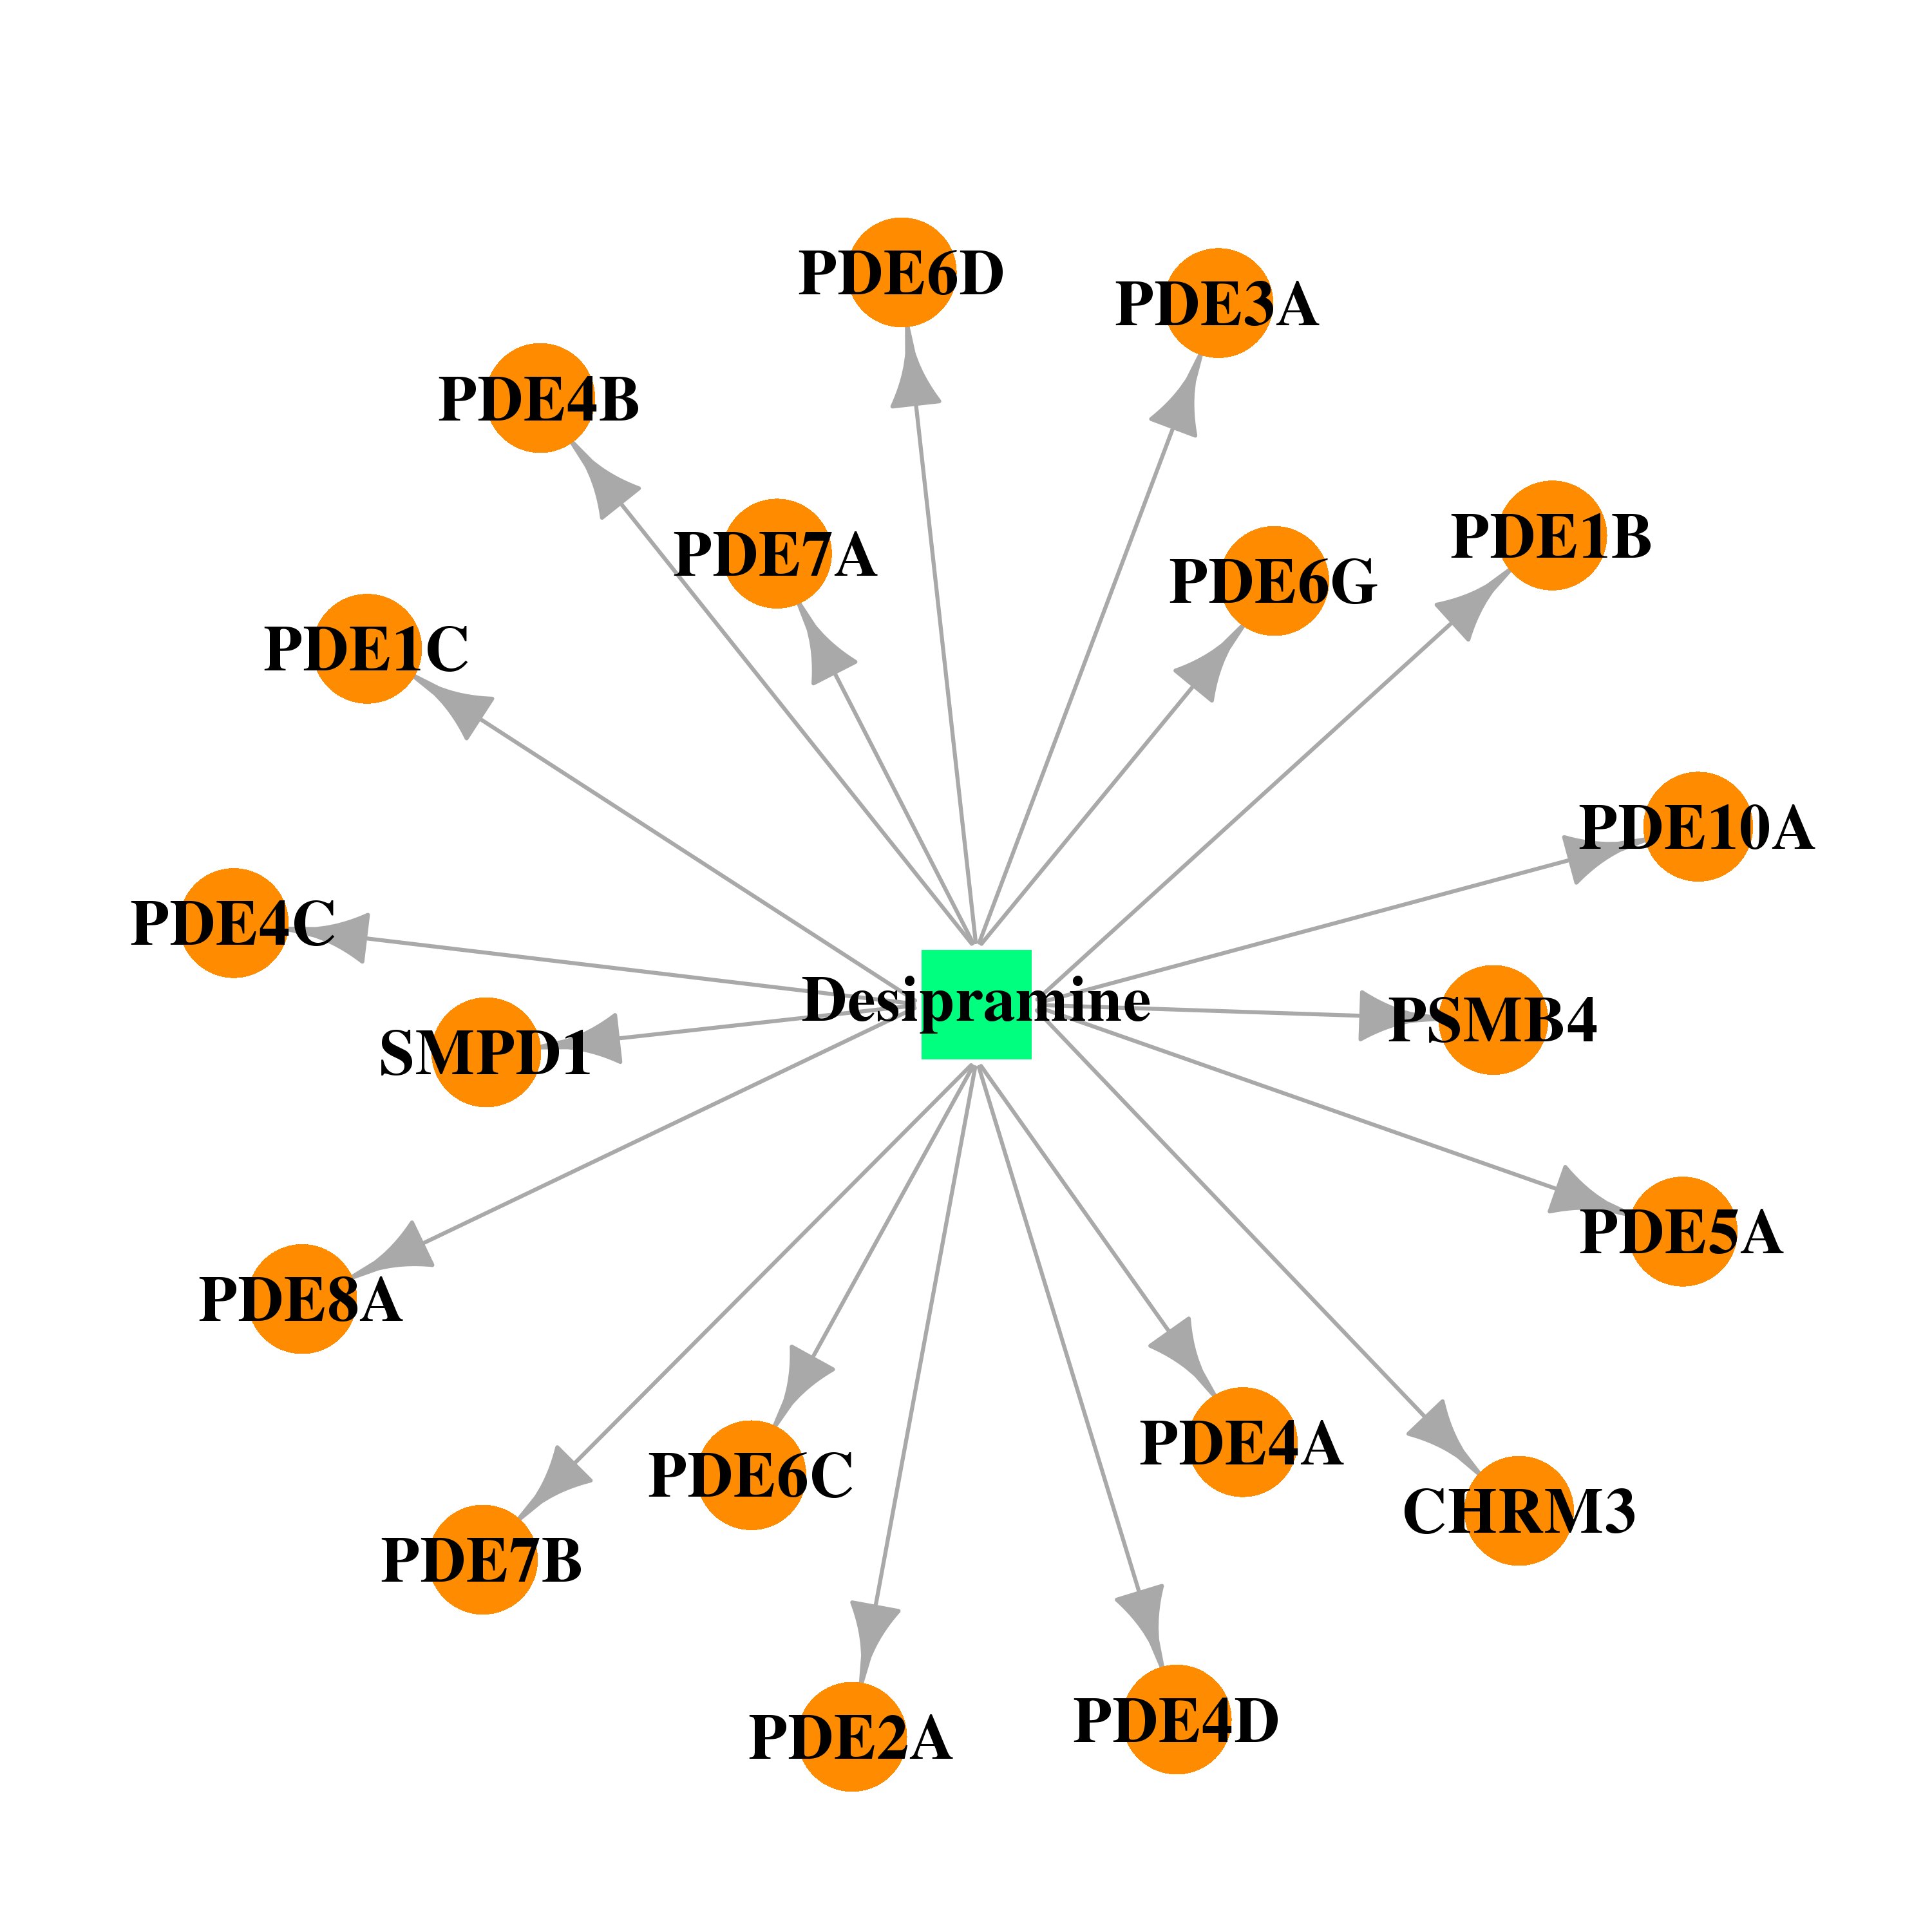 | 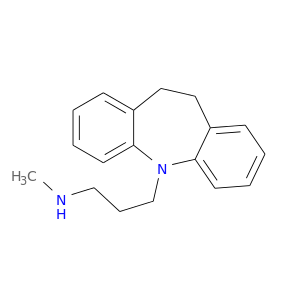 |
| DB00472 | phosphodiesterase 2A, cGMP-stimulated | approved | Fluoxetine | 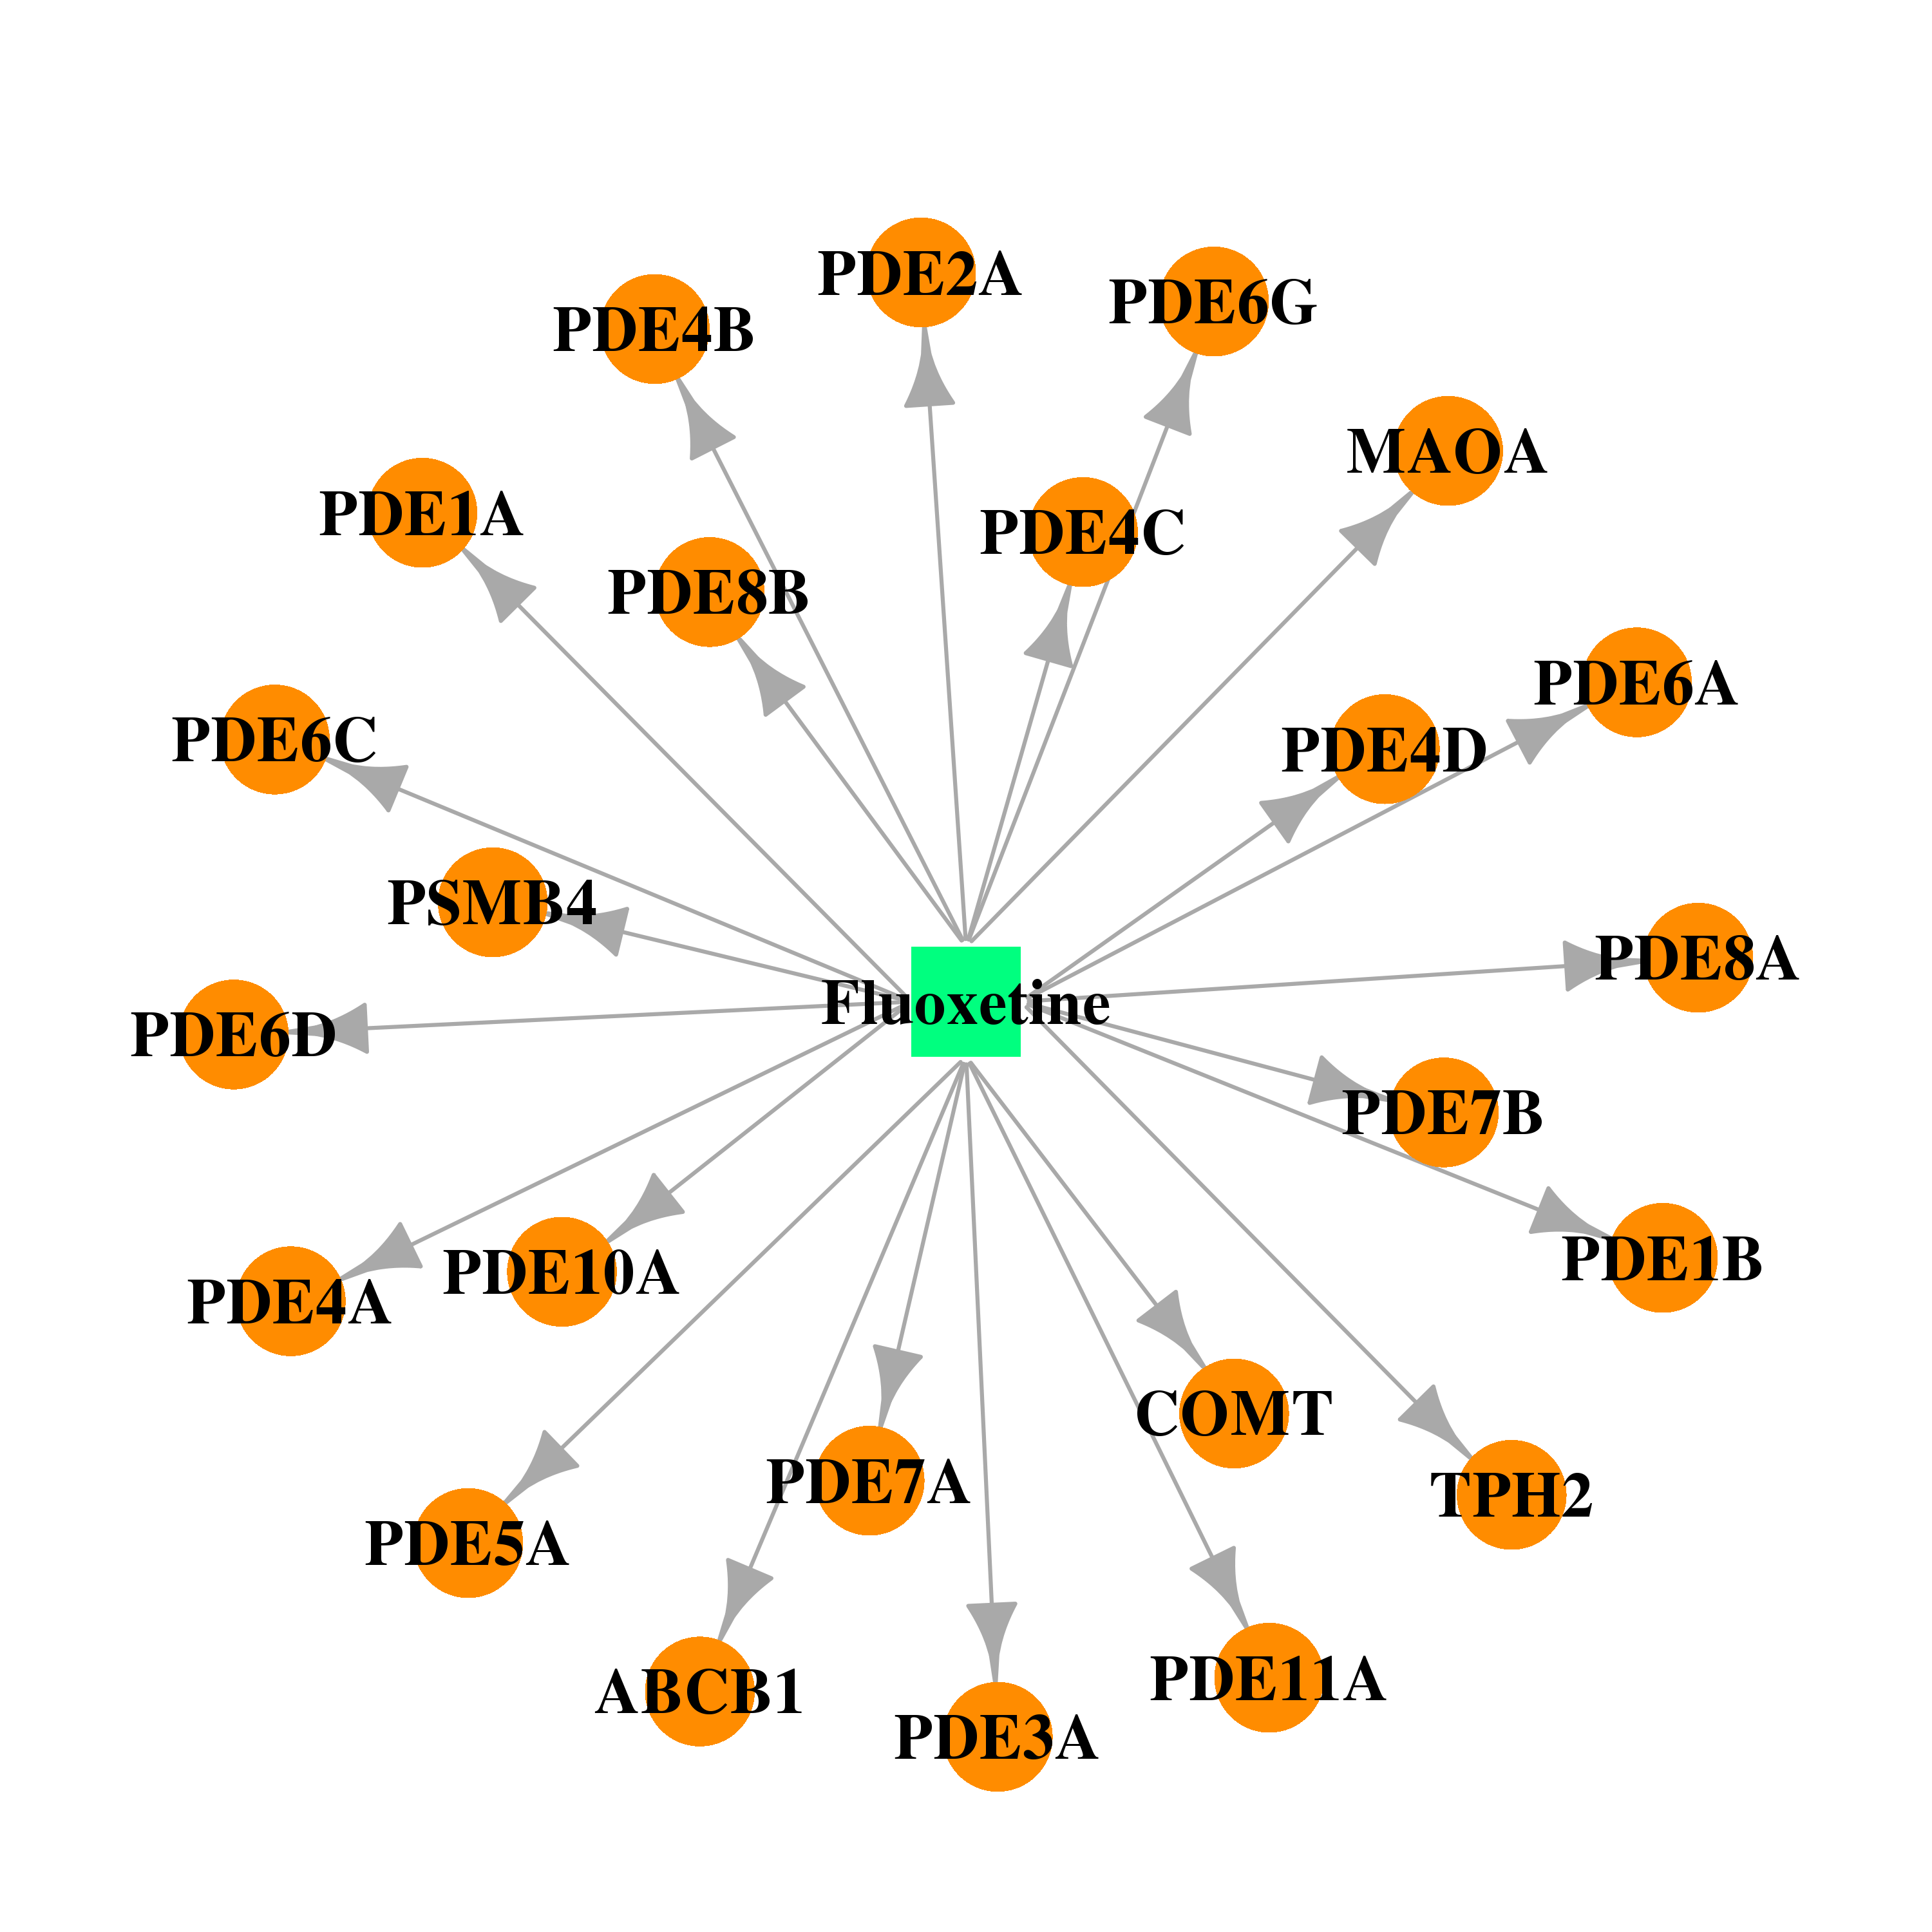 | 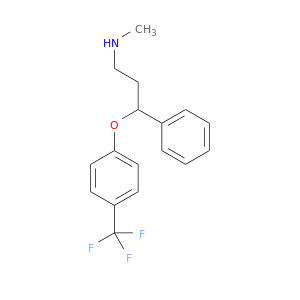 |
| Top |
| Cross referenced IDs for PDE2A |
| * We obtained these cross-references from Uniprot database. It covers 150 different DBs, 18 categories. http://www.uniprot.org/help/cross_references_section |
: Open all cross reference information
|
Copyright © 2016-Present - The Univsersity of Texas Health Science Center at Houston @ |