|
||||||||||||||||||||
| |
| Phenotypic Information (metabolism pathway, cancer, disease, phenome) |
| |
| |
| Gene-Gene Network Information: Co-Expression Network, Interacting Genes & KEGG |
| |
|


| Gene Summary for CSAD |
| Top |
| Phenotypic Information for CSAD(metabolism pathway, cancer, disease, phenome) |
| Cancer | CGAP: CSAD |
| Familial Cancer Database: CSAD | |
| * This gene is included in those cancer gene databases. |
|
|
|
|
|
| . | ||||||||||||||
Oncogene 1 | Significant driver gene in | |||||||||||||||||||
| cf) number; DB name 1 Oncogene; http://nar.oxfordjournals.org/content/35/suppl_1/D721.long, 2 Tumor Suppressor gene; https://bioinfo.uth.edu/TSGene/, 3 Cancer Gene Census; http://www.nature.com/nrc/journal/v4/n3/abs/nrc1299.html, 4 CancerGenes; http://nar.oxfordjournals.org/content/35/suppl_1/D721.long, 5 Network of Cancer Gene; http://ncg.kcl.ac.uk/index.php, 1Therapeutic Vulnerabilities in Cancer; http://cbio.mskcc.org/cancergenomics/statius/ |
| KEGG_TAURINE_AND_HYPOTAURINE_METABOLISM REACTOME_SULFUR_AMINO_ACID_METABOLISM REACTOME_METABOLISM_OF_AMINO_ACIDS_AND_DERIVATIVES | |
| OMIM | |
| Orphanet | |
| Disease | KEGG Disease: CSAD |
| MedGen: CSAD (Human Medical Genetics with Condition) | |
| ClinVar: CSAD | |
| Phenotype | MGI: CSAD (International Mouse Phenotyping Consortium) |
| PhenomicDB: CSAD | |
| Mutations for CSAD |
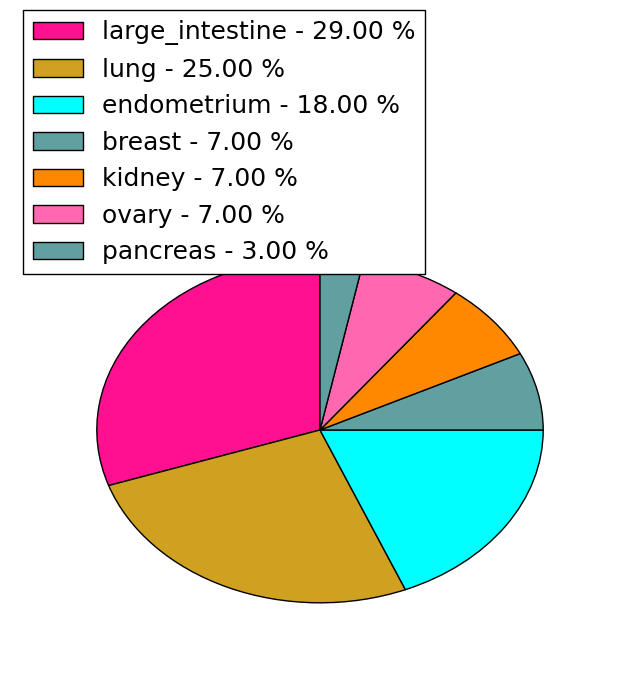
| * Under tables are showing count per each tissue to give us broad intuition about tissue specific mutation patterns.You can go to the detailed page for each mutation database's web site. |
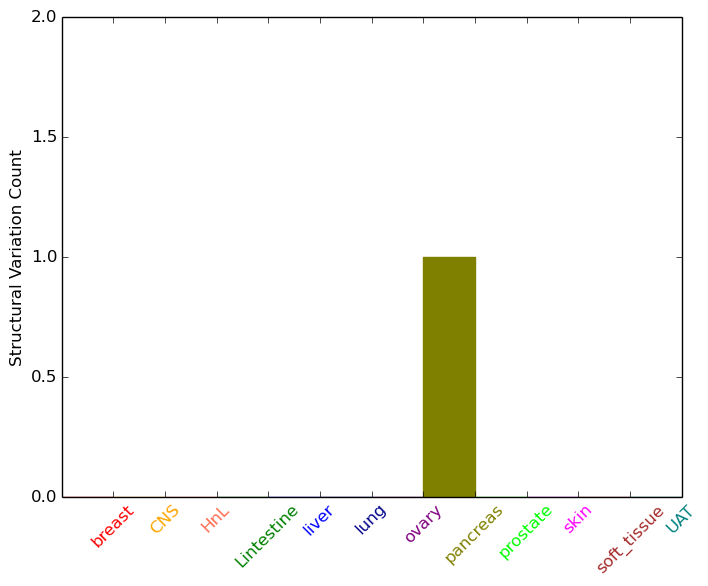
| - Statistics for Tissue and Mutation type | Top |
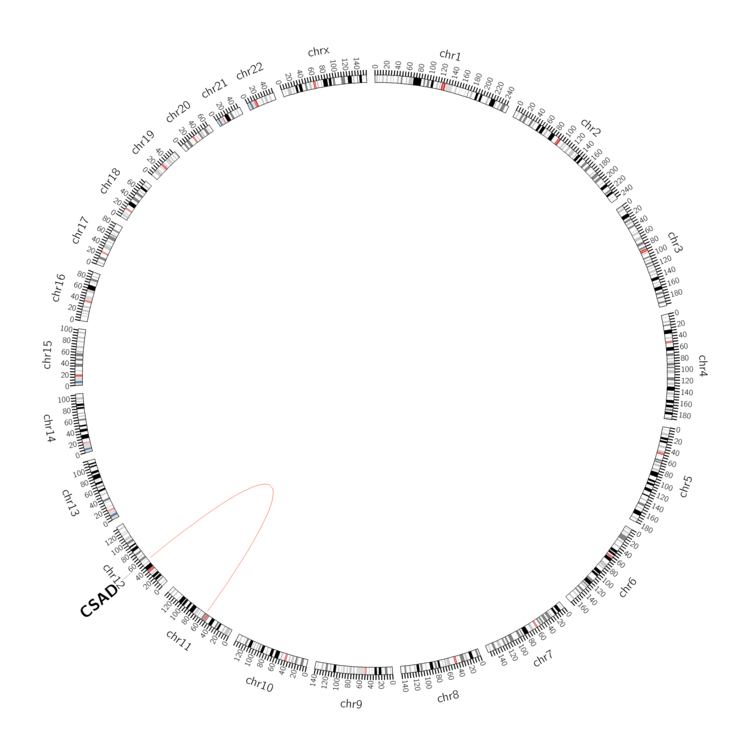 |
| - For Inter-chromosomal Variations |
| * Inter-chromosomal variantions includes 'interchromosomal amplicon to amplicon', 'interchromosomal amplicon to non-amplified dna', 'interchromosomal insertion', 'Interchromosomal unknown type'. |
 |
| - For Intra-chromosomal Variations |
| There's no intra-chromosomal structural variation. |
| Sample | Symbol_a | Chr_a | Start_a | End_a | Symbol_b | Chr_b | Start_b | End_b |
| cf) Tissue number; Tissue name (1;Breast, 2;Central_nervous_system, 3;Haematopoietic_and_lymphoid_tissue, 4;Large_intestine, 5;Liver, 6;Lung, 7;Ovary, 8;Pancreas, 9;Prostate, 10;Skin, 11;Soft_tissue, 12;Upper_aerodigestive_tract) |
| * From mRNA Sanger sequences, Chitars2.0 arranged chimeric transcripts. This table shows CSAD related fusion information. |
| ID | Head Gene | Tail Gene | Accession | Gene_a | qStart_a | qEnd_a | Chromosome_a | tStart_a | tEnd_a | Gene_a | qStart_a | qEnd_a | Chromosome_a | tStart_a | tEnd_a |
| BC053557 | CSAD | 1 | 2062 | 12 | 53574532 | 53582457 | UQCRQ | 2056 | 2110 | 5 | 132203325 | 132203379 | |
| AA805355 | CSAD | 1 | 159 | 12 | 53573481 | 53573639 | CSAD | 151 | 516 | 12 | 53569389 | 53569754 | |
| CK005588 | CSAD | 44 | 172 | 12 | 53551447 | 53551575 | MEG3 | 158 | 633 | 14 | 101315053 | 101315530 | |
| BX093038 | CXCL14 | 1 | 68 | 5 | 134907462 | 134907529 | CSAD | 57 | 437 | 12 | 53569583 | 53569963 | |
| AI032646 | NFE2L2 | 1 | 366 | 2 | 178111745 | 178112110 | CSAD | 361 | 429 | 12 | 53552222 | 53552290 | |
| AA805343 | CSAD | 1 | 159 | 12 | 53573481 | 53573639 | CSAD | 151 | 495 | 12 | 53569389 | 53569733 | |
| Top |
| There's no copy number variation information in COSMIC data for this gene. |
| Top |
|
 |
| Top |
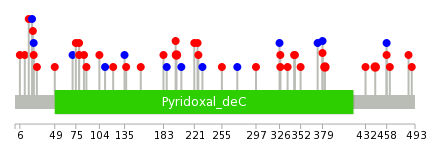
| Stat. for Non-Synonymous SNVs (# total SNVs=27) | (# total SNVs=8) |
 |  |
(# total SNVs=1) | (# total SNVs=0) |
 |
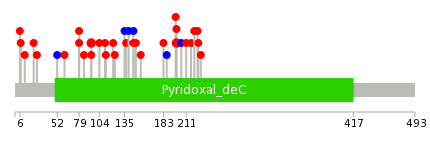
| Top |
| * When you move the cursor on each content, you can see more deailed mutation information on the Tooltip. Those are primary_site,primary_histology,mutation(aa),pubmedID. |
| GRCh37 position | Mutation(aa) | Unique sampleID count |
| chr12:53552447-53552447 | p.R444C | 2 |
| chr12:53564258-53564258 | p.A199V | 2 |
| chr12:53553926-53553926 | p.D382N | 2 |
| chr12:53553935-53553935 | p.R379R | 2 |
| chr12:53565707-53565707 | p.A137V | 1 |
| chr12:53552392-53552392 | p.G462D | 1 |
| chr12:53554040-53554040 | p.D344N | 1 |
| chr12:53566413-53566413 | p.P49L | 1 |
| chr12:53563896-53563896 | p.P221L | 1 |
| chr12:53565712-53565712 | p.L135L | 1 |
| Top |
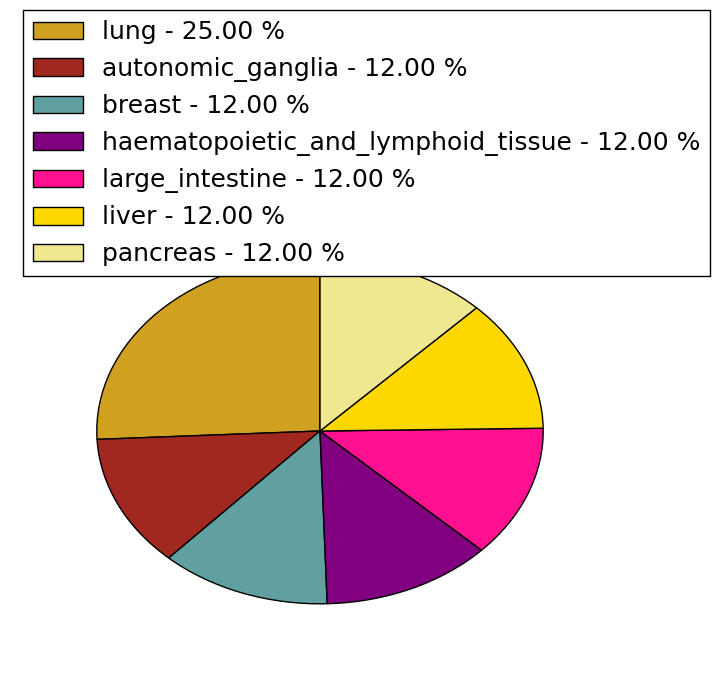
|
 |
| Point Mutation/ Tissue ID | 1 | 2 | 3 | 4 | 5 | 6 | 7 | 8 | 9 | 10 | 11 | 12 | 13 | 14 | 15 | 16 | 17 | 18 | 19 | 20 |
| # sample | 2 | 1 | 1 | 5 | 2 | 1 | 3 | 2 | 2 | 3 | 10 | 5 | ||||||||
| # mutation | 2 | 1 | 1 | 5 | 2 | 1 | 3 | 2 | 2 | 3 | 10 | 6 | ||||||||
| nonsynonymous SNV | 1 | 1 | 4 | 2 | 1 | 3 | 1 | 2 | 3 | 8 | 6 | |||||||||
| synonymous SNV | 1 | 1 | 1 | 1 | 2 |
| cf) Tissue ID; Tissue type (1; BLCA[Bladder Urothelial Carcinoma], 2; BRCA[Breast invasive carcinoma], 3; CESC[Cervical squamous cell carcinoma and endocervical adenocarcinoma], 4; COAD[Colon adenocarcinoma], 5; GBM[Glioblastoma multiforme], 6; Glioma Low Grade, 7; HNSC[Head and Neck squamous cell carcinoma], 8; KICH[Kidney Chromophobe], 9; KIRC[Kidney renal clear cell carcinoma], 10; KIRP[Kidney renal papillary cell carcinoma], 11; LAML[Acute Myeloid Leukemia], 12; LUAD[Lung adenocarcinoma], 13; LUSC[Lung squamous cell carcinoma], 14; OV[Ovarian serous cystadenocarcinoma ], 15; PAAD[Pancreatic adenocarcinoma], 16; PRAD[Prostate adenocarcinoma], 17; SKCM[Skin Cutaneous Melanoma], 18:STAD[Stomach adenocarcinoma], 19:THCA[Thyroid carcinoma], 20:UCEC[Uterine Corpus Endometrial Carcinoma]) |
| Top |
| * We represented just top 10 SNVs. When you move the cursor on each content, you can see more deailed mutation information on the Tooltip. Those are primary_site, primary_histology, mutation(aa), pubmedID. |
| Genomic Position | Mutation(aa) | Unique sampleID count |
| chr12:53564258 | p.R146R,CSAD | 2 |
| chr12:53553935 | p.R94C,CSAD | 2 |
| chr12:53554091 | p.A199V,CSAD | 2 |
| chr12:53573574 | p.S187S,CSAD | 1 |
| chr12:53552447 | p.A6S,CSAD | 1 |
| chr12:53563908 | p.H225N,CSAD | 1 |
| chr12:53566164 | p.A183S,CSAD | 1 |
| chr12:53553421 | p.S7P | 1 |
| chr12:53564239 | p.R211C,CSAD | 1 |
| chr12:53566220 | p.S155C,CSAD | 1 |
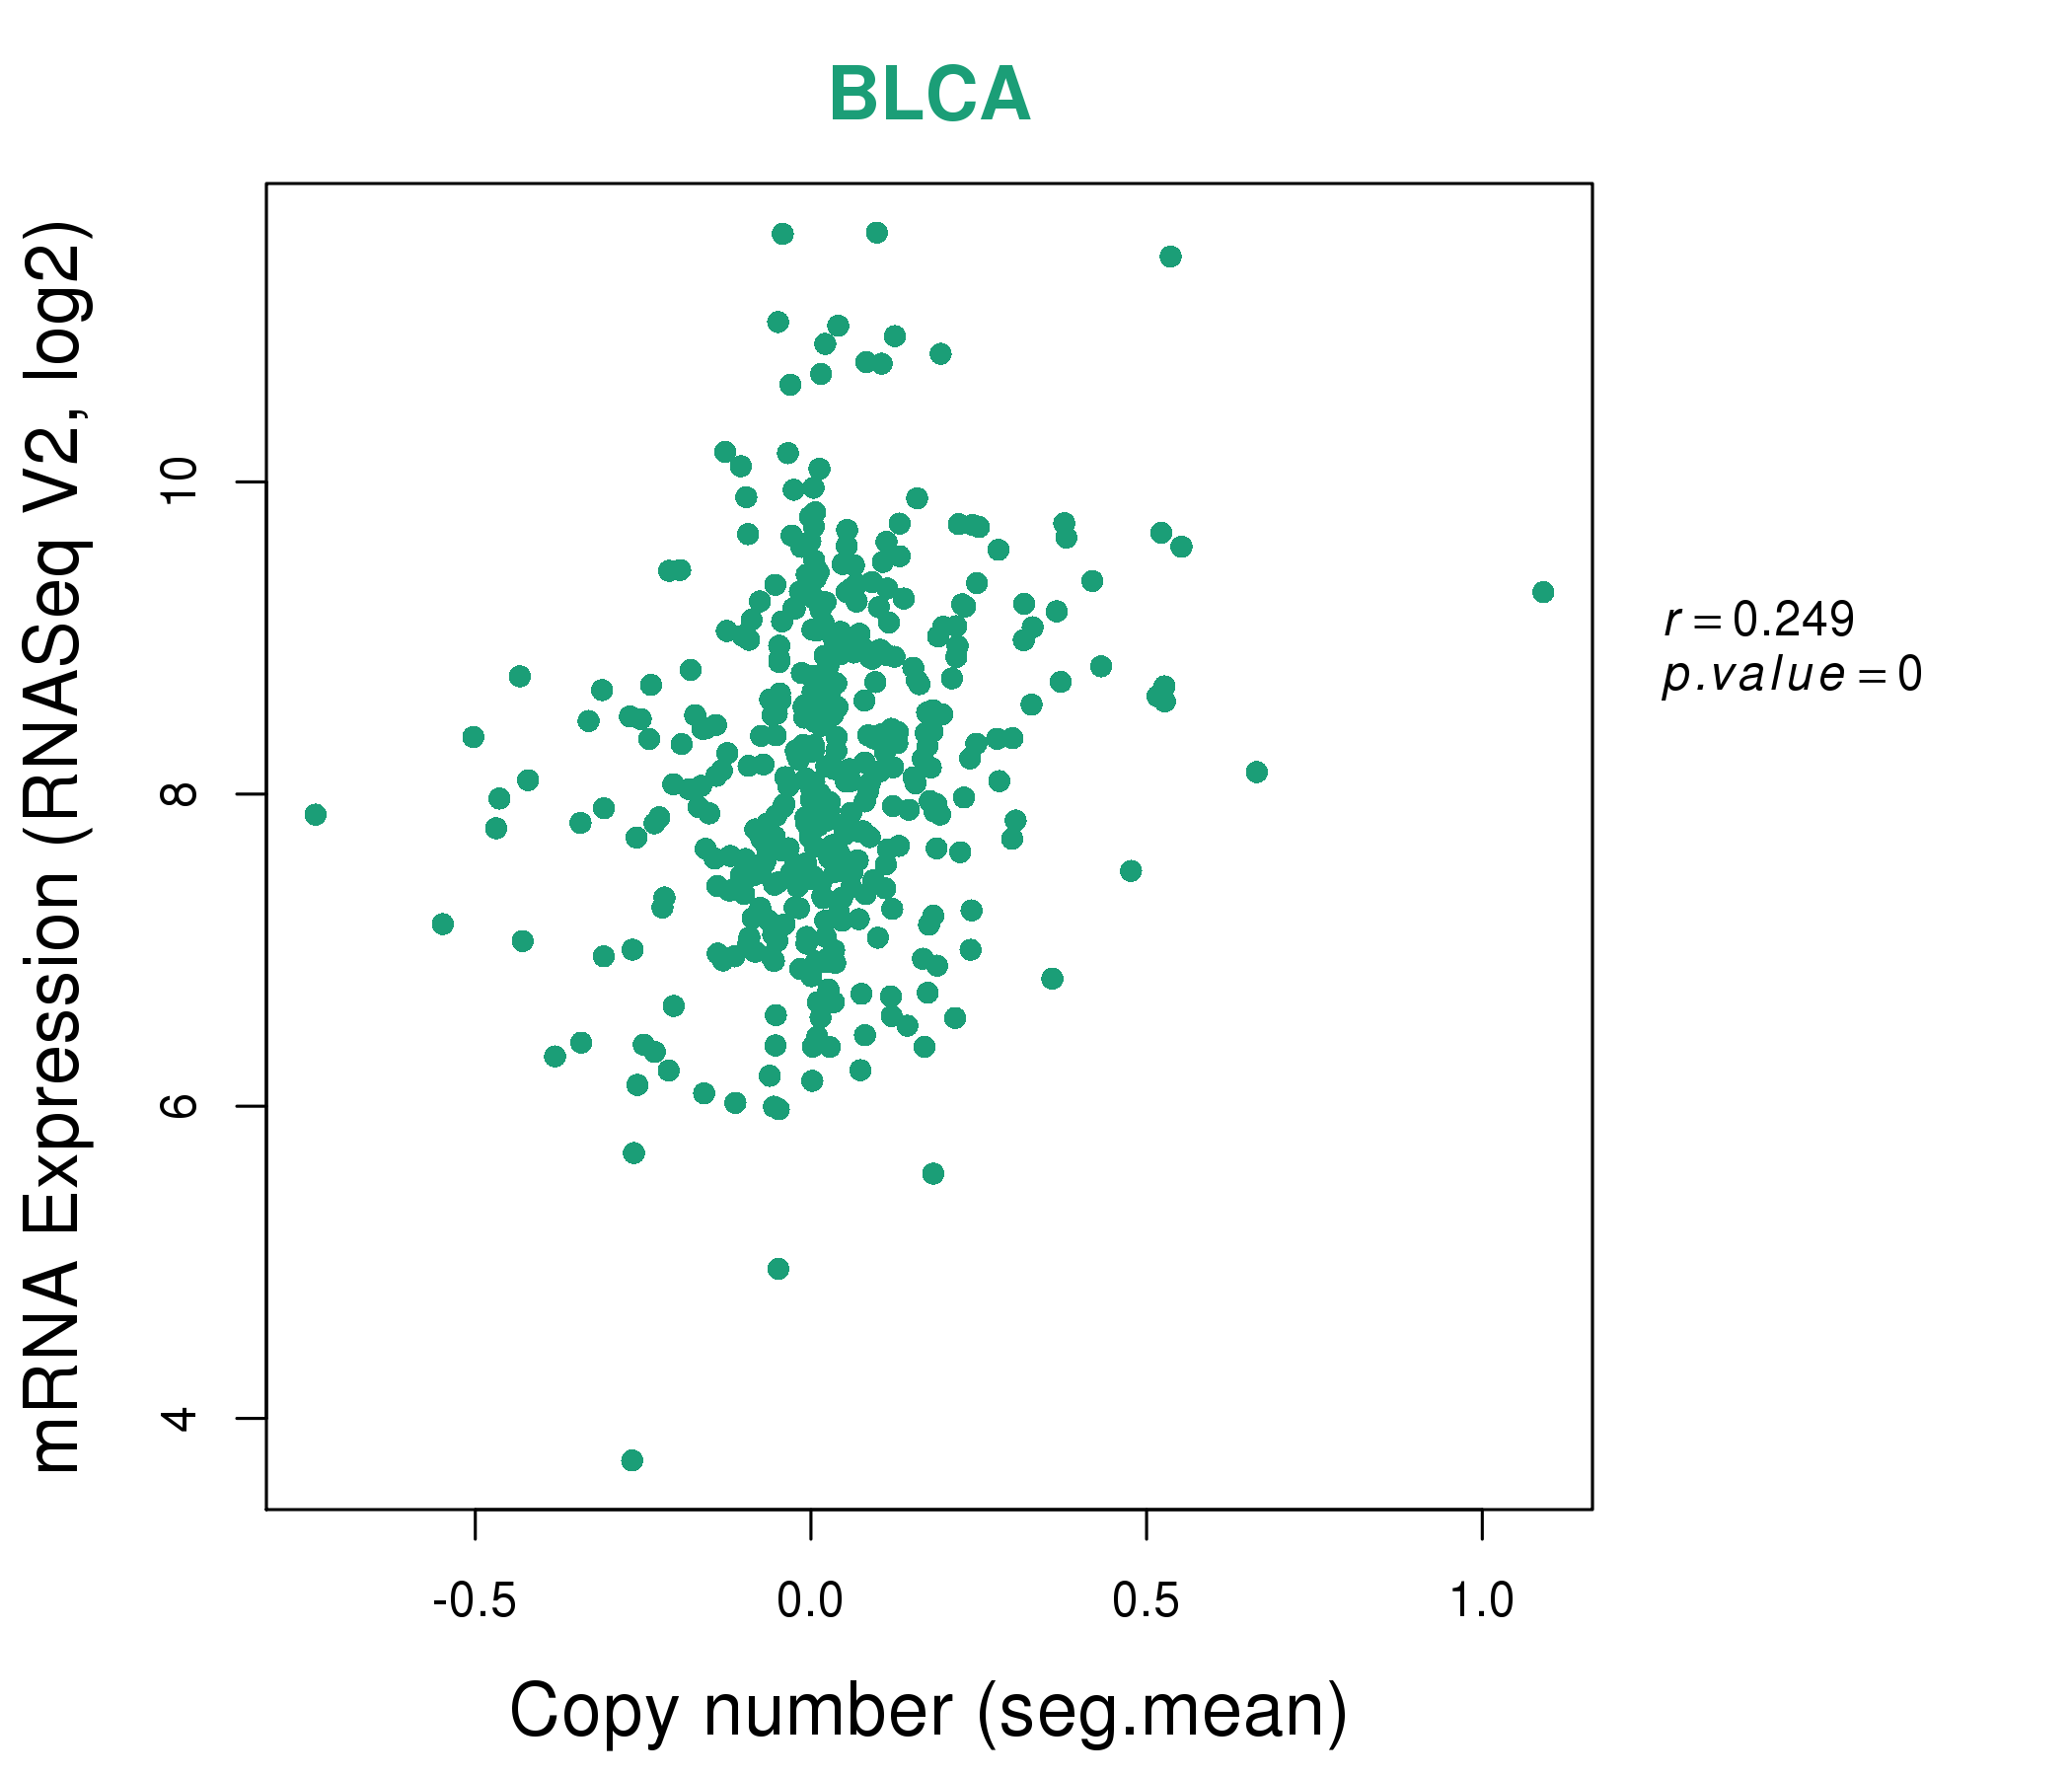
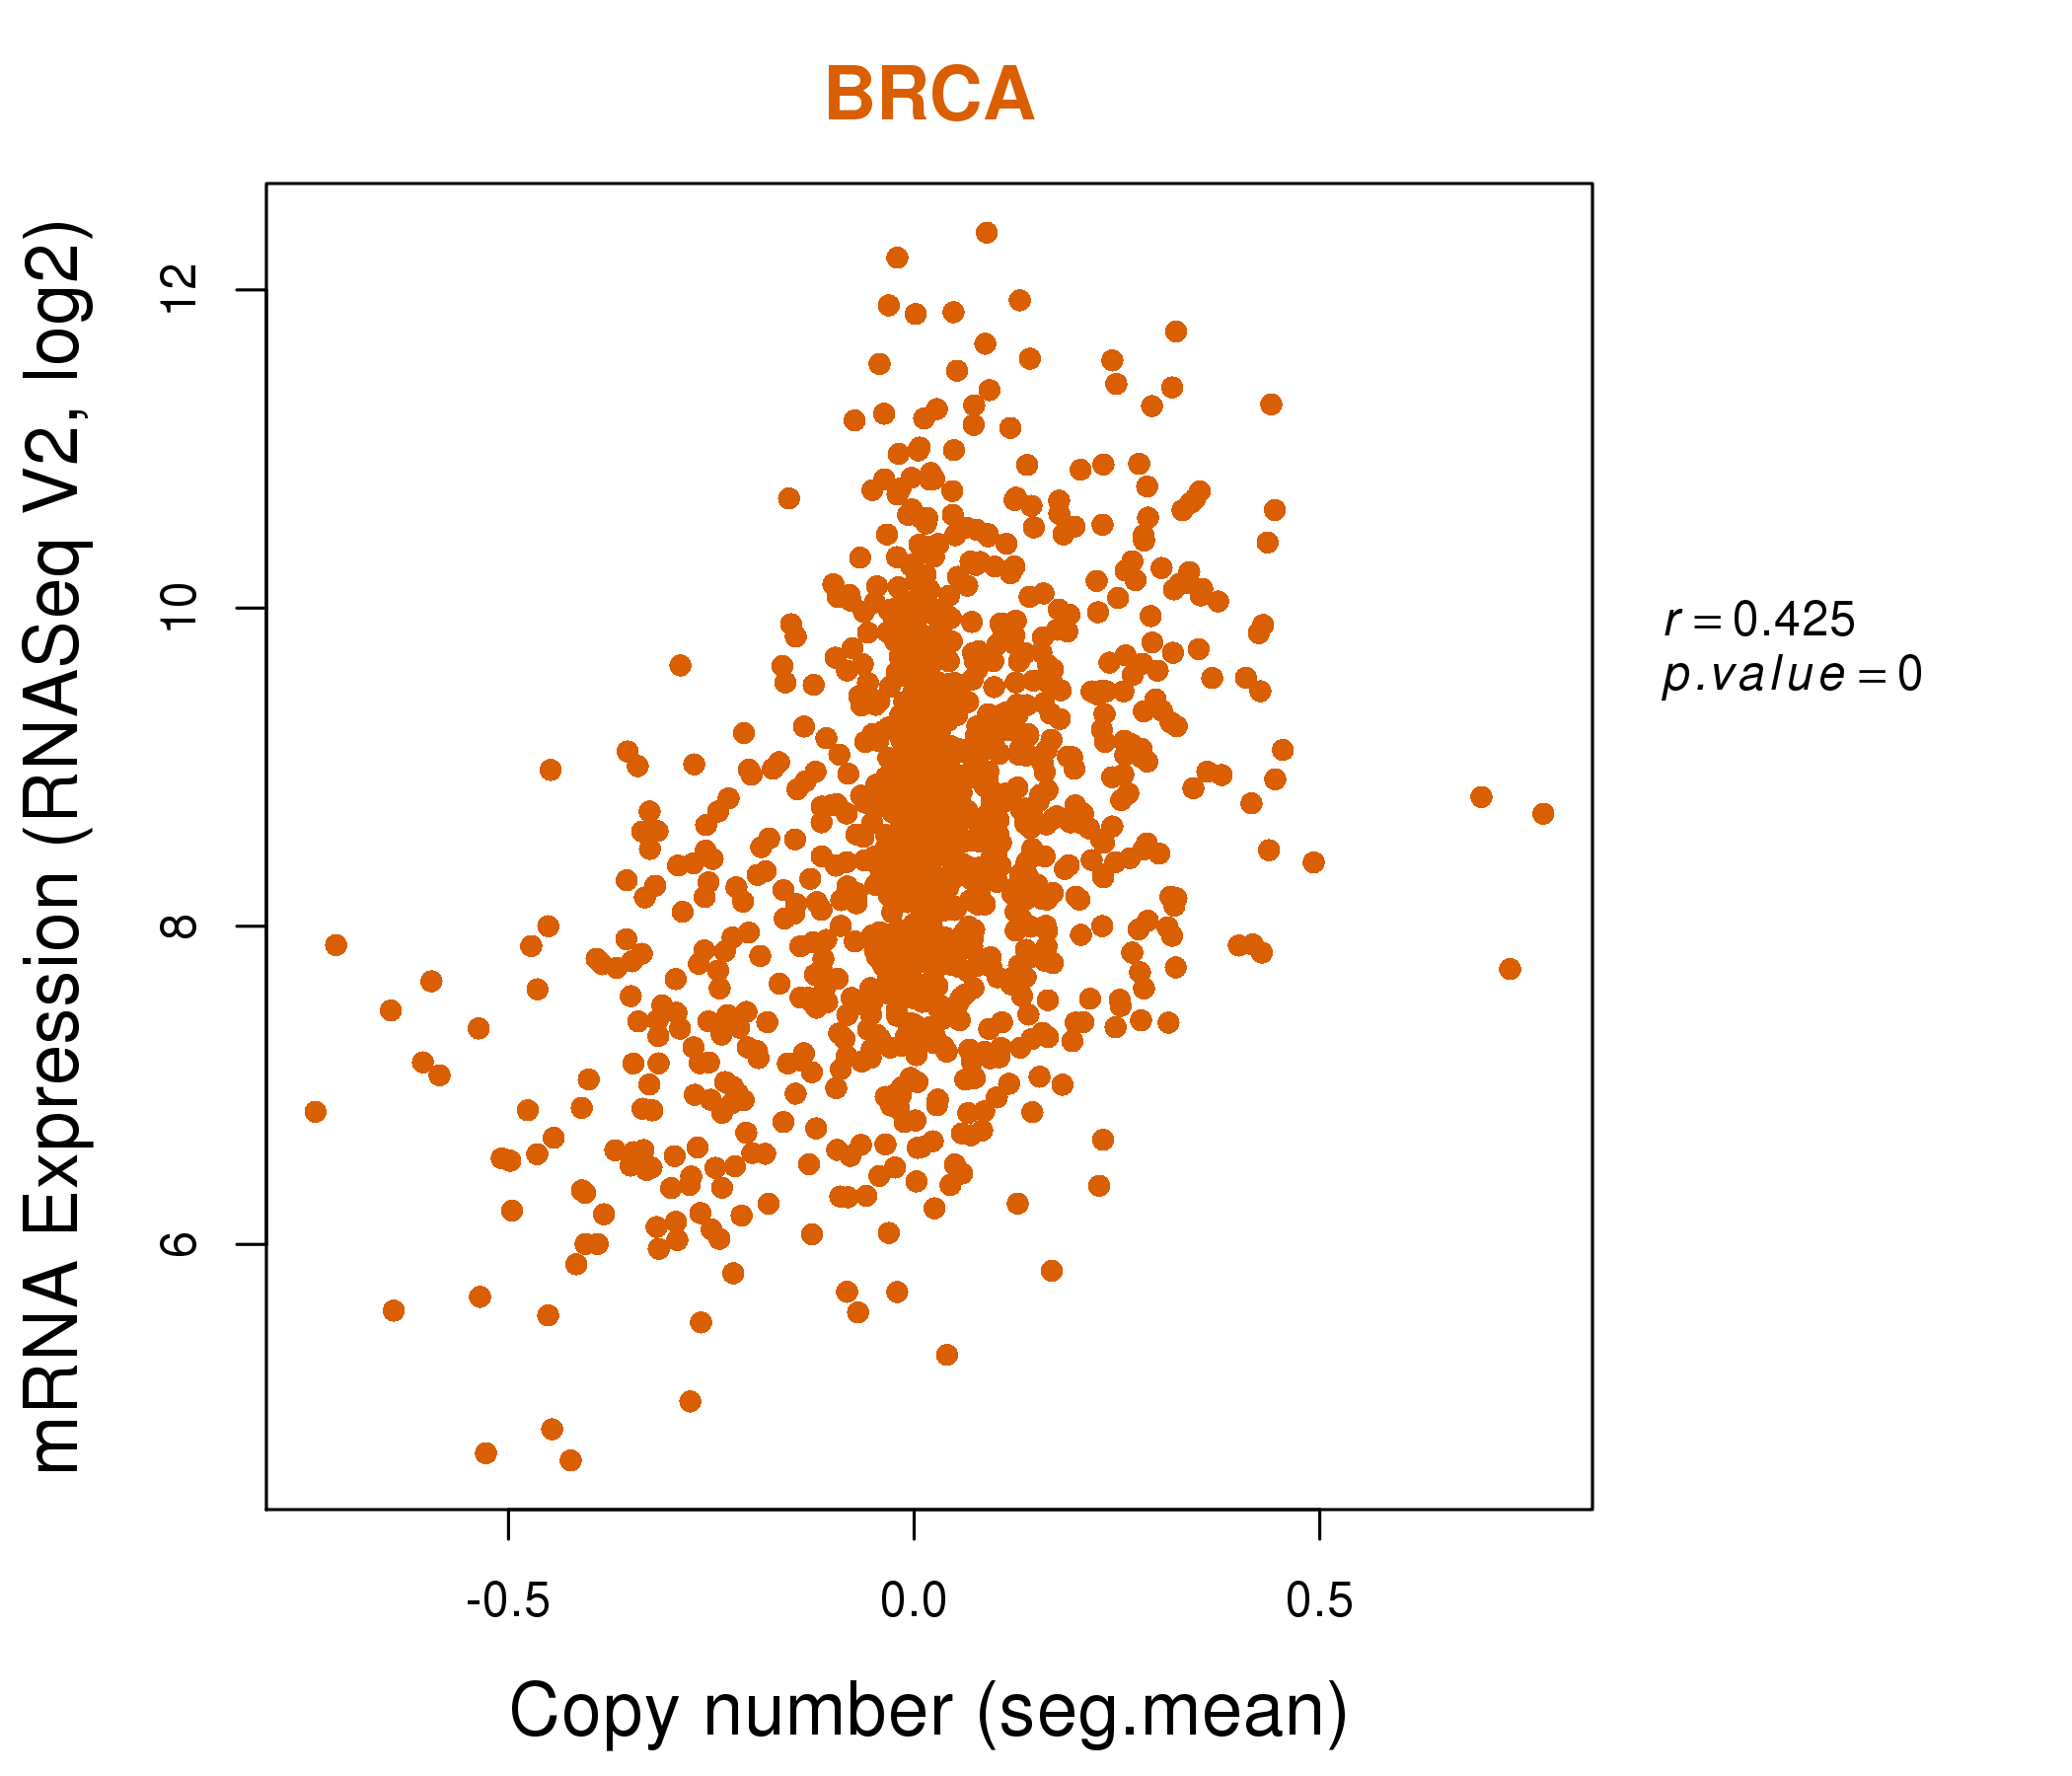
| * Copy number data were extracted from TCGA using R package TCGA-Assembler. The URLs of all public data files on TCGA DCC data server were gathered on Jan-05-2015. Function ProcessCNAData in TCGA-Assembler package was used to obtain gene-level copy number value which is calculated as the average copy number of the genomic region of a gene. |
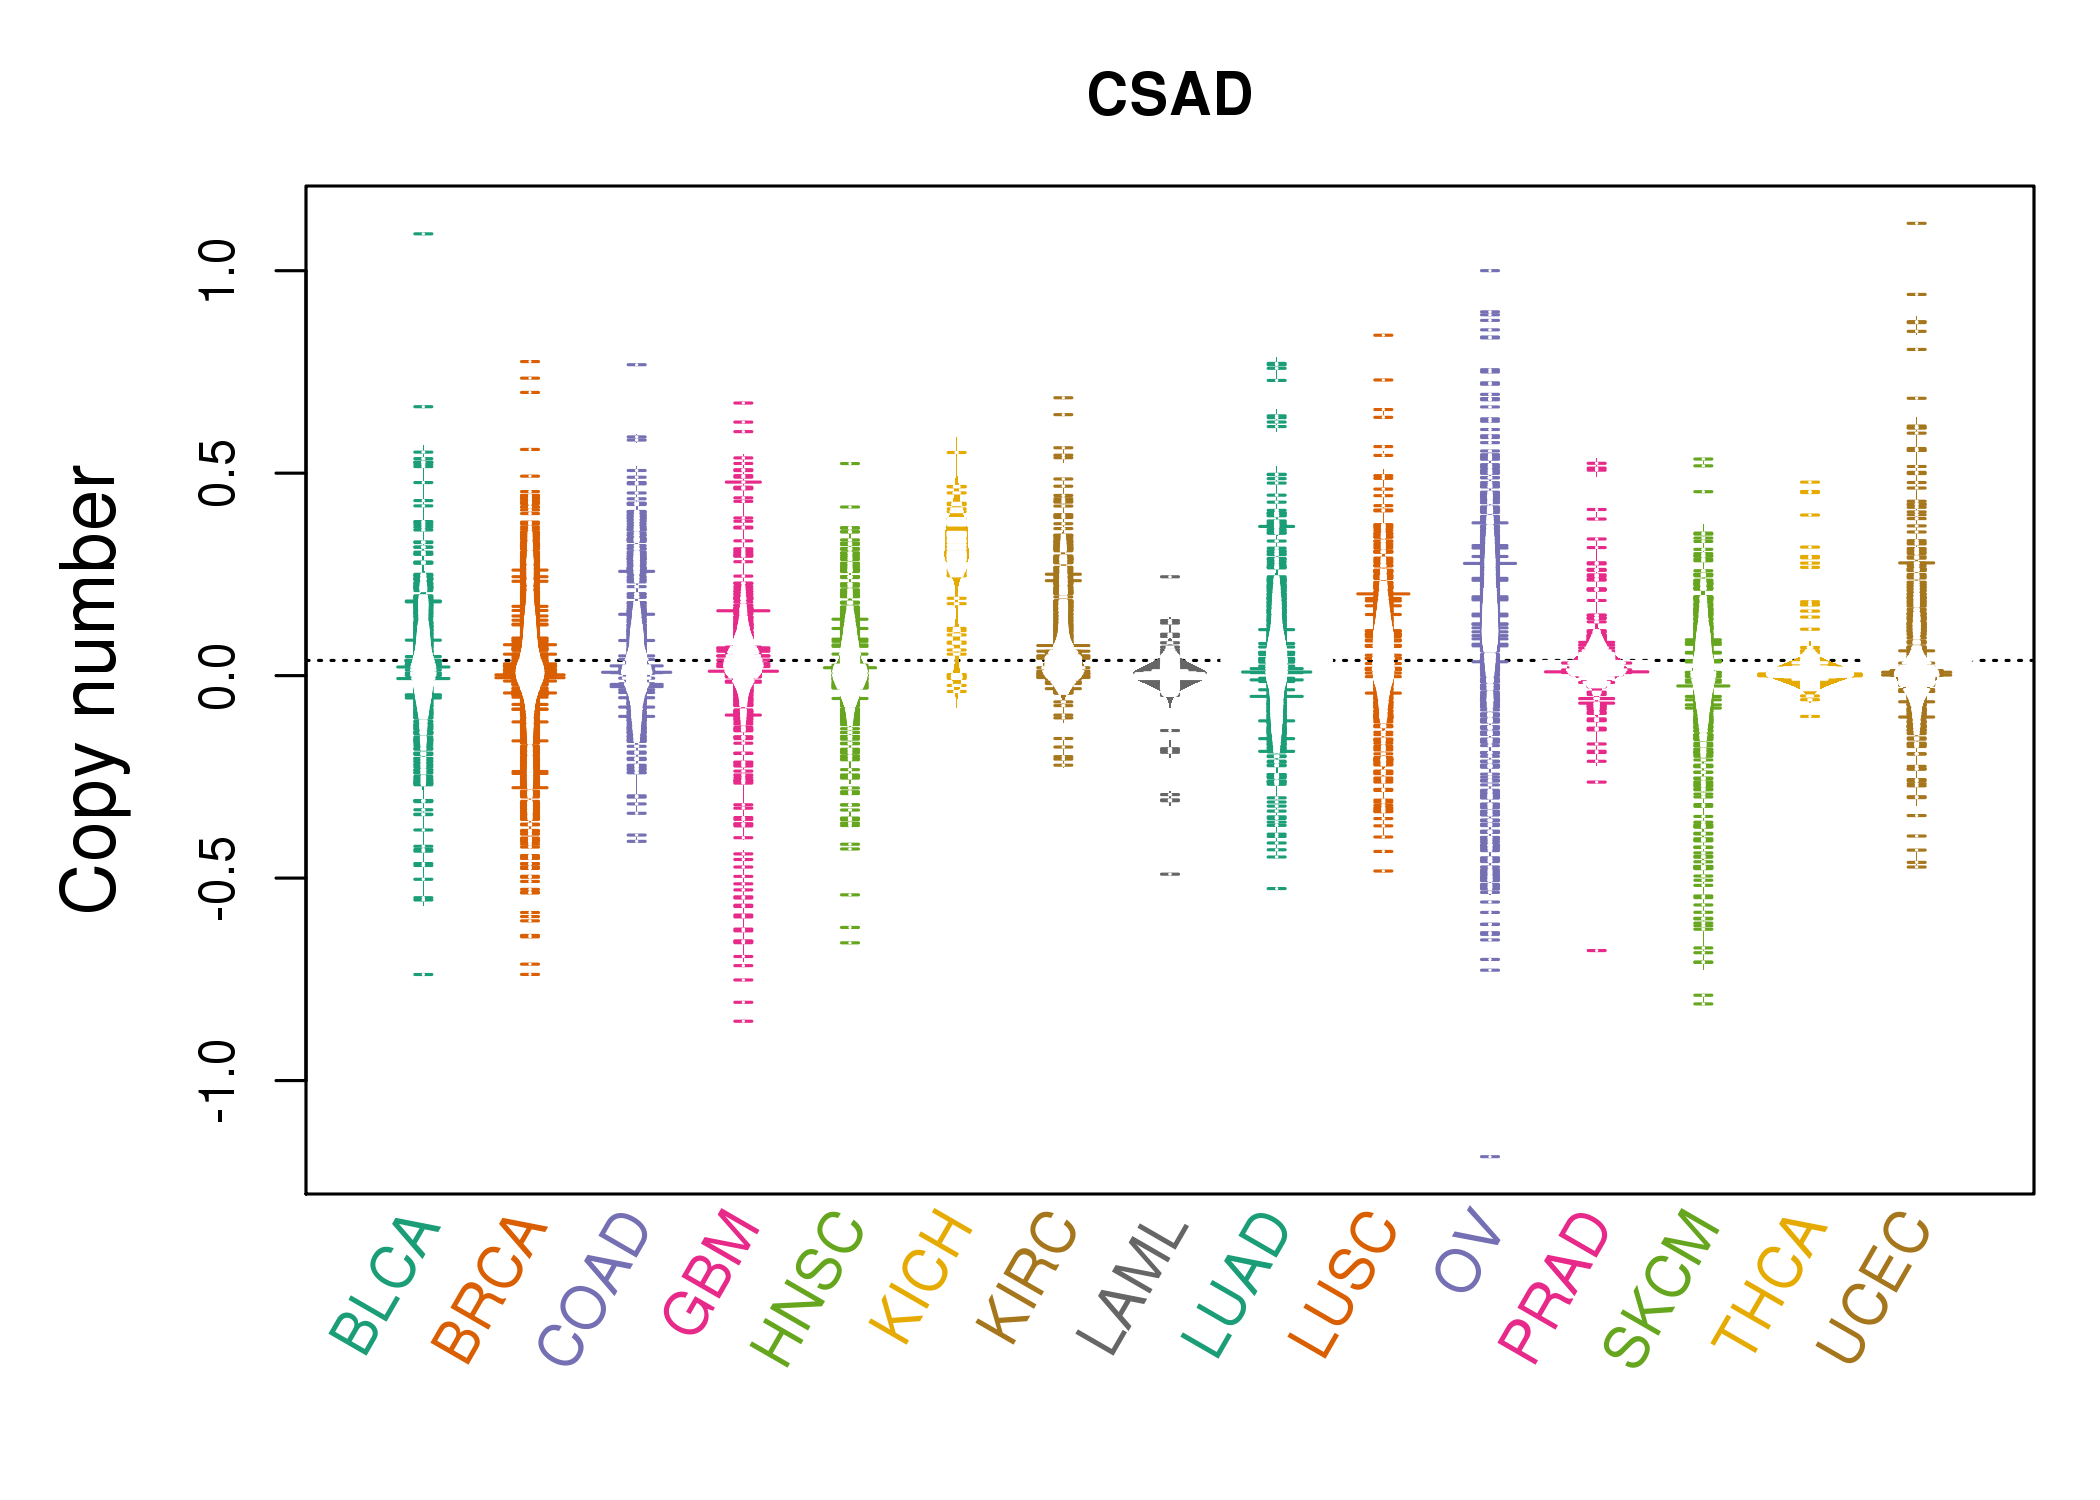 |
| cf) Tissue ID[Tissue type]: BLCA[Bladder Urothelial Carcinoma], BRCA[Breast invasive carcinoma], CESC[Cervical squamous cell carcinoma and endocervical adenocarcinoma], COAD[Colon adenocarcinoma], GBM[Glioblastoma multiforme], Glioma Low Grade, HNSC[Head and Neck squamous cell carcinoma], KICH[Kidney Chromophobe], KIRC[Kidney renal clear cell carcinoma], KIRP[Kidney renal papillary cell carcinoma], LAML[Acute Myeloid Leukemia], LUAD[Lung adenocarcinoma], LUSC[Lung squamous cell carcinoma], OV[Ovarian serous cystadenocarcinoma ], PAAD[Pancreatic adenocarcinoma], PRAD[Prostate adenocarcinoma], SKCM[Skin Cutaneous Melanoma], STAD[Stomach adenocarcinoma], THCA[Thyroid carcinoma], UCEC[Uterine Corpus Endometrial Carcinoma] |
| Top |
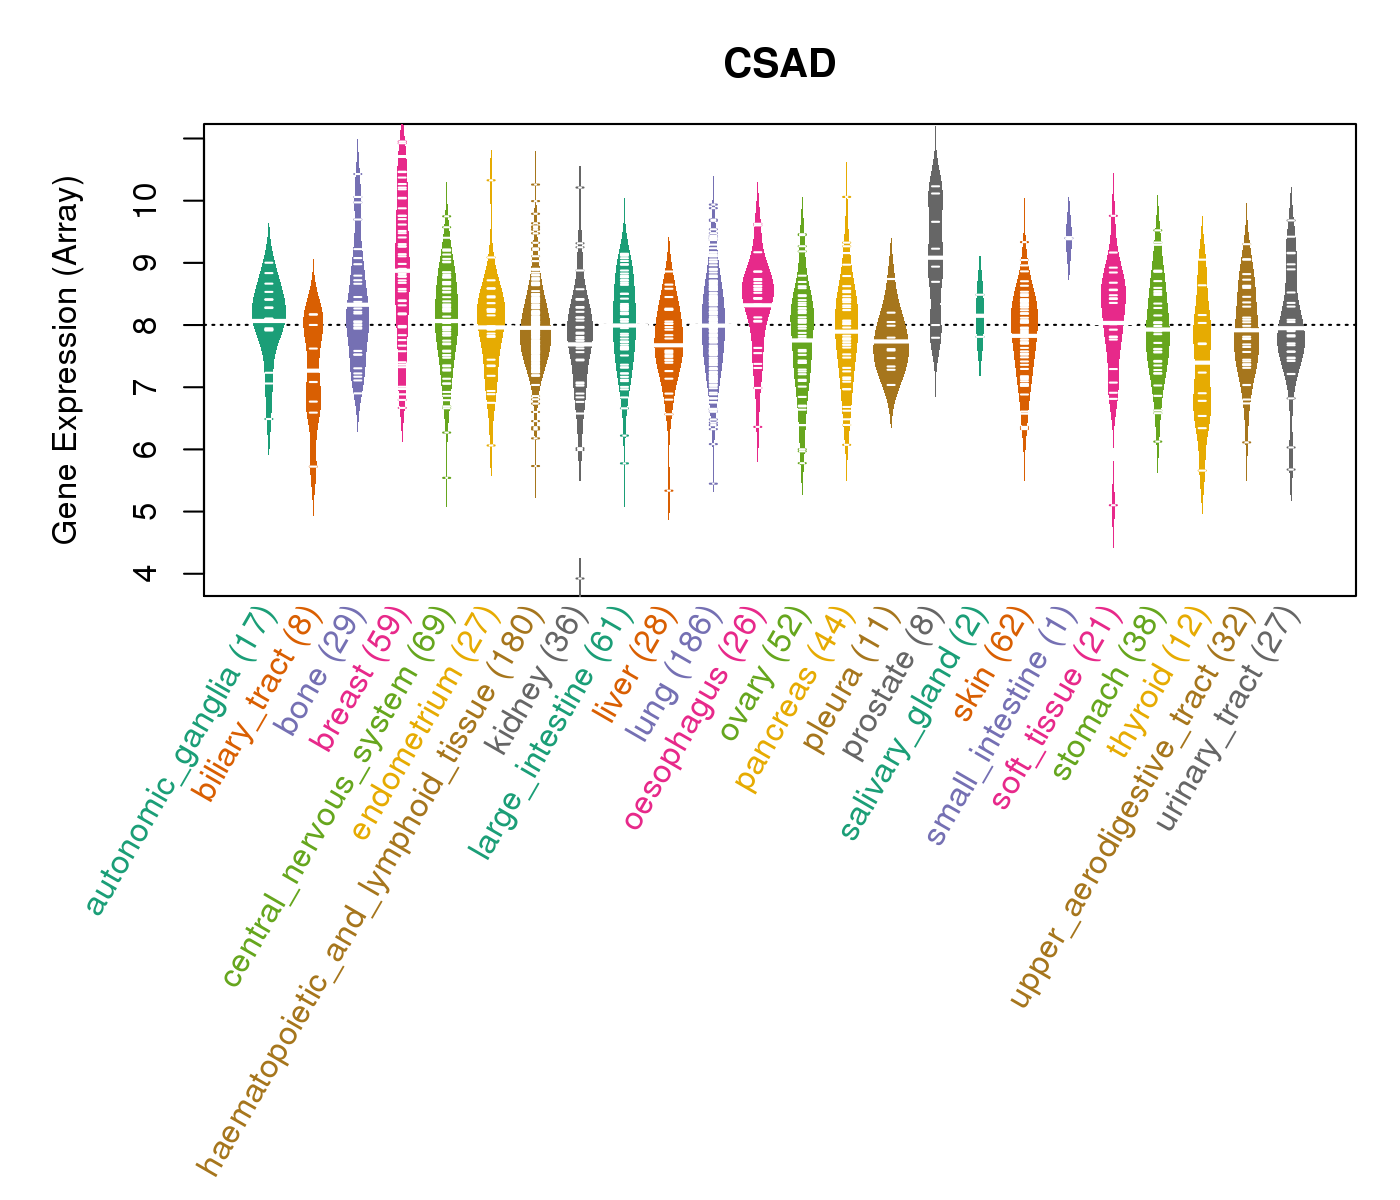
| Gene Expression for CSAD |
| * CCLE gene expression data were extracted from CCLE_Expression_Entrez_2012-10-18.res: Gene-centric RMA-normalized mRNA expression data. |
 |
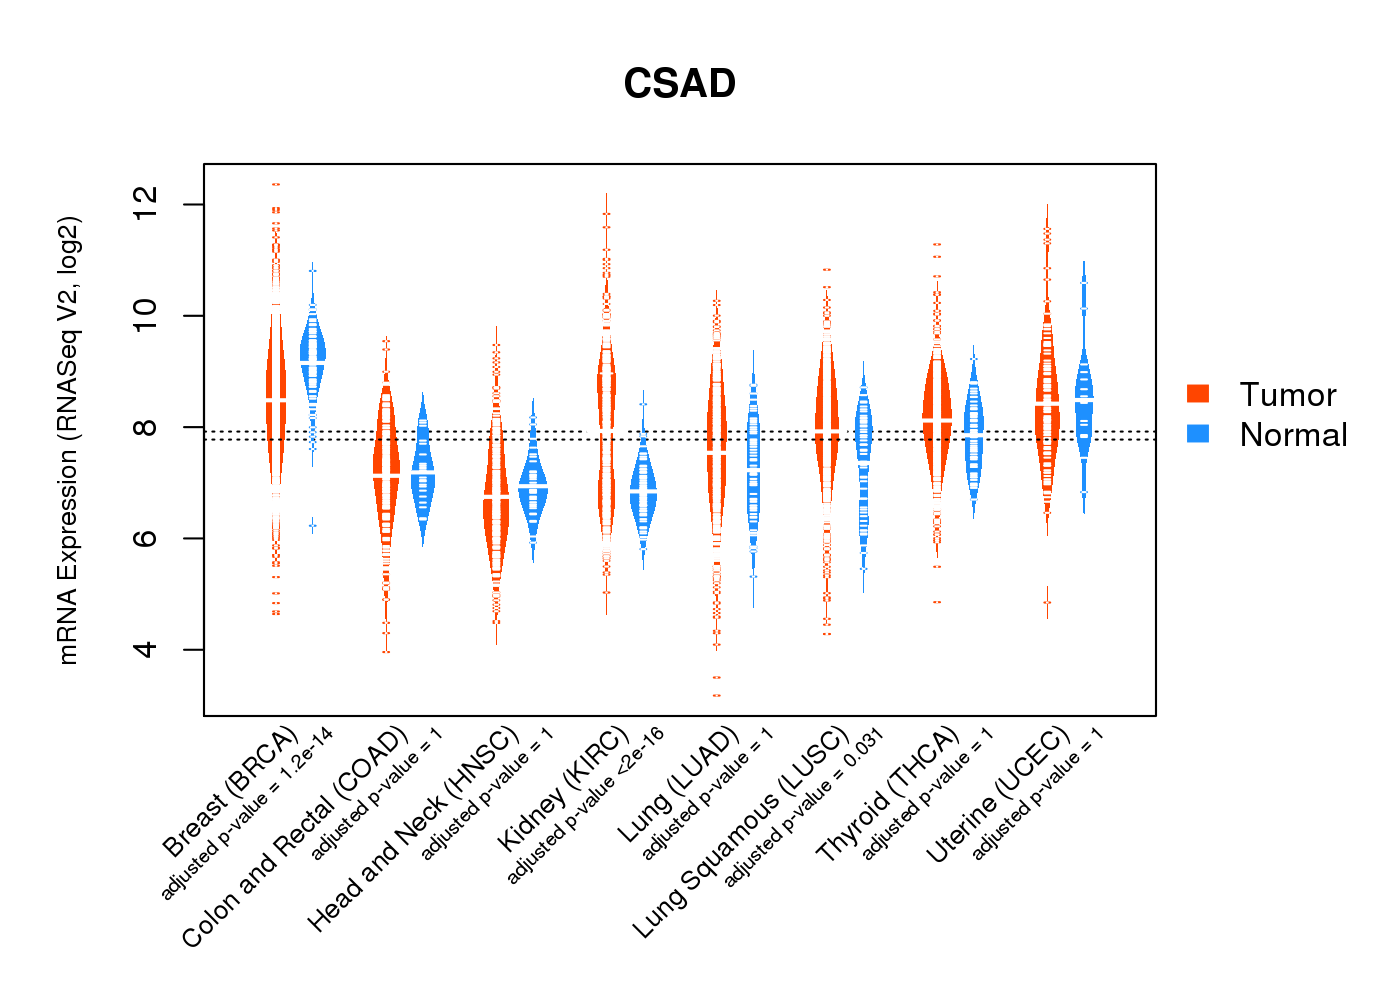
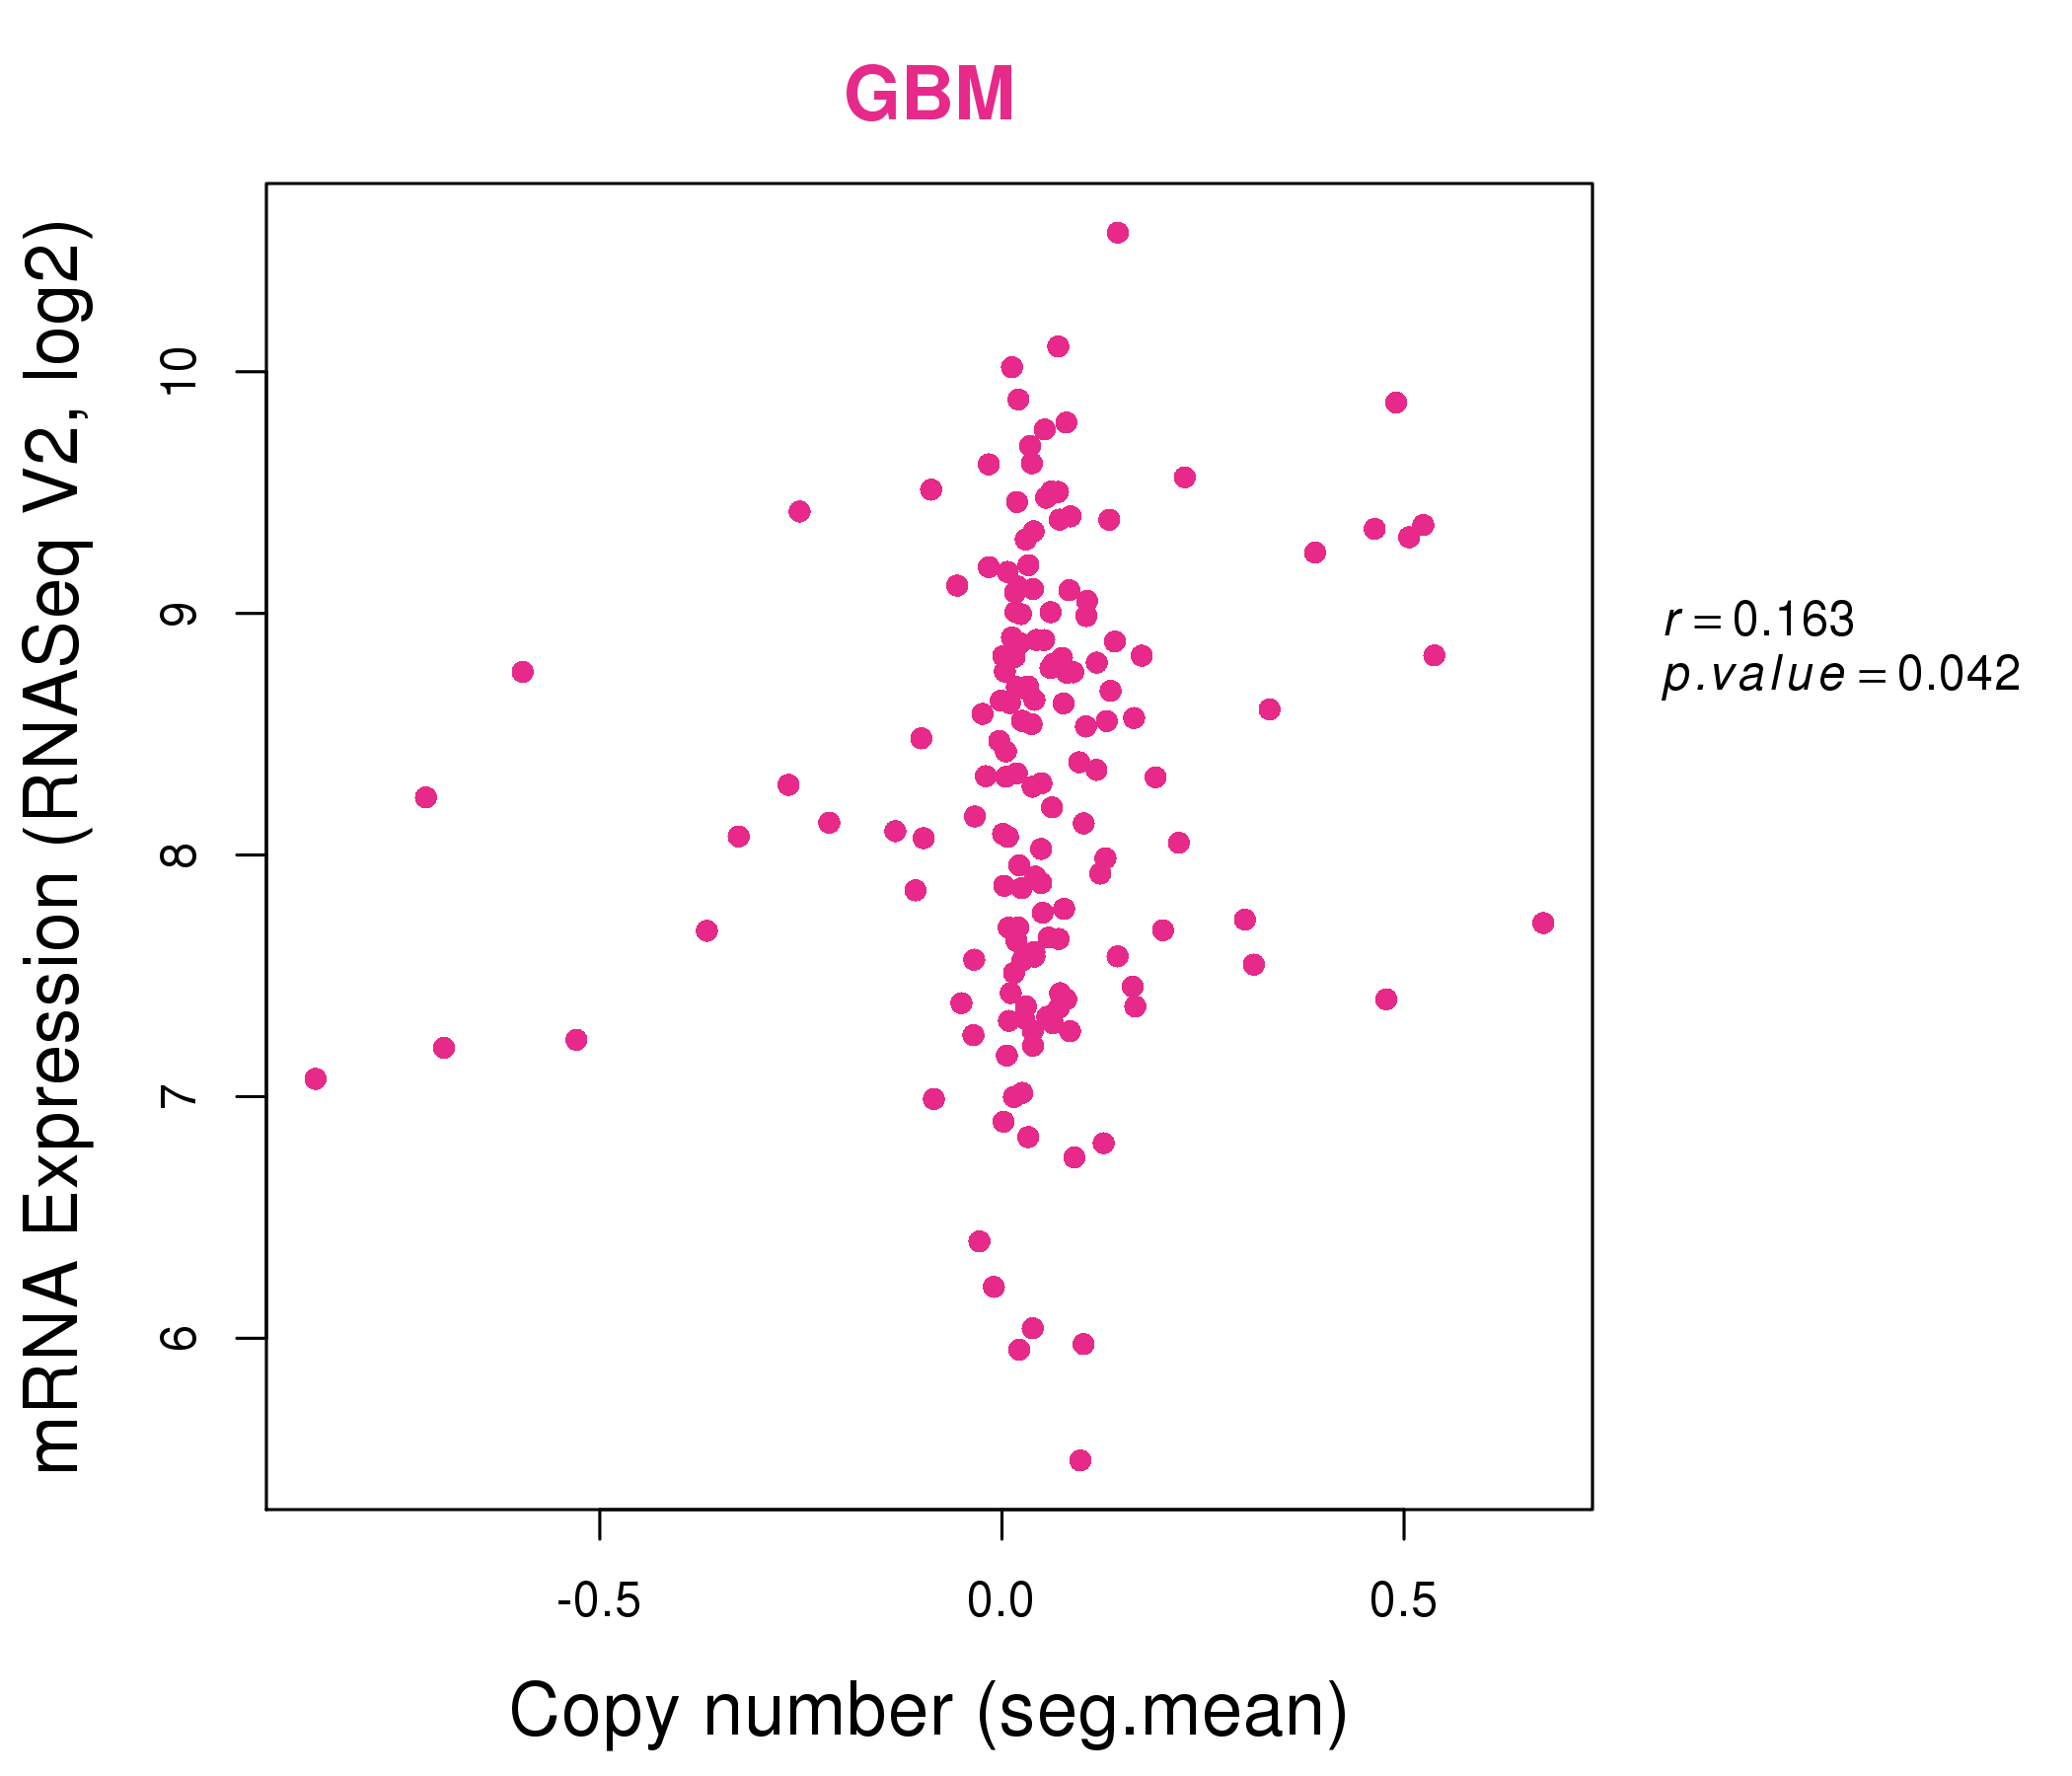
| * Normalized gene expression data of RNASeqV2 was extracted from TCGA using R package TCGA-Assembler. The URLs of all public data files on TCGA DCC data server were gathered at Jan-05-2015. Only eight cancer types have enough normal control samples for differential expression analysis. (t test, adjusted p<0.05 (using Benjamini-Hochberg FDR)) |
 |
| Top |
| * This plots show the correlation between CNV and gene expression. |
: Open all plots for all cancer types
 |
|
 |
|
| Top |
| Gene-Gene Network Information |
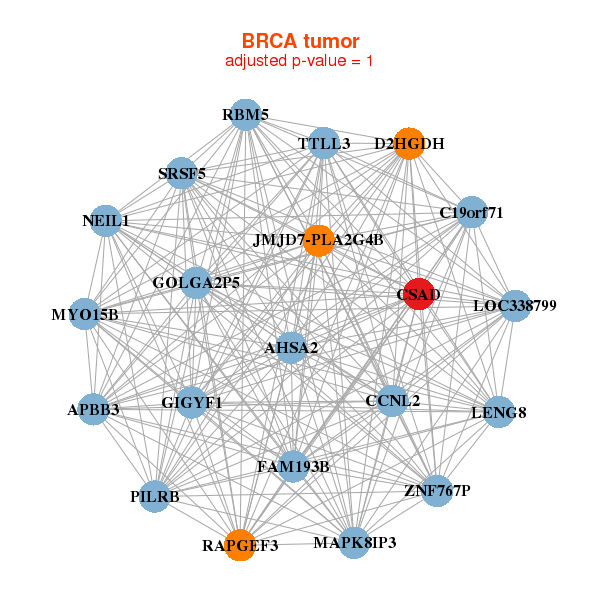
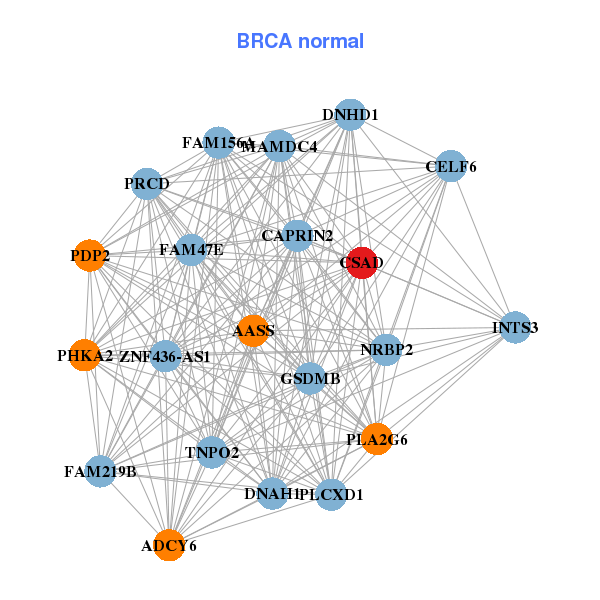
| * Co-Expression network figures were drawn using R package igraph. Only the top 20 genes with the highest correlations were shown. Red circle: input gene, orange circle: cell metabolism gene, sky circle: other gene |
: Open all plots for all cancer types
 |
| ||||
| AHSA2,APBB3,C19orf71,CCNL2,CSAD,D2HGDH,FAM193B, GIGYF1,GOLGA2P5,JMJD7-PLA2G4B,LENG8,LOC338799,MAPK8IP3,MYO15B, NEIL1,PILRB,RAPGEF3,RBM5,SRSF5,TTLL3,ZNF767P | AASS,ADCY6,FAM219B,ZNF436-AS1,CAPRIN2,CELF6,CSAD, DNAH1,DNHD1,FAM156A,FAM47E,GSDMB,INTS3,MAMDC4, NRBP2,PDP2,PHKA2,PLA2G6,PLCXD1,PRCD,TNPO2 | ||||
 |
| ||||
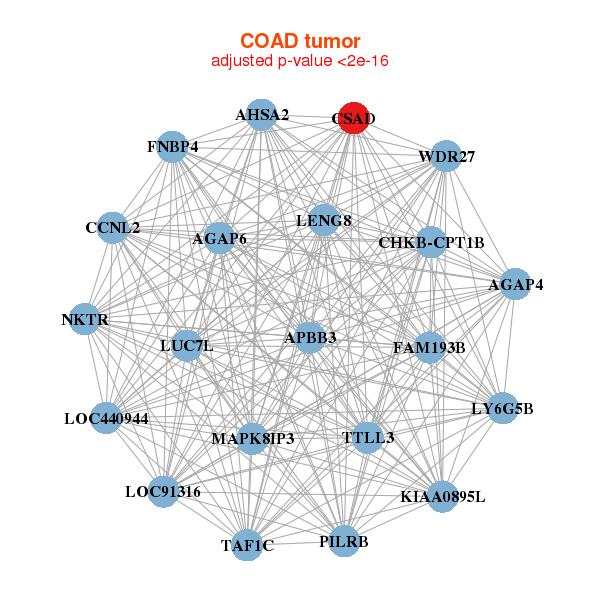
| AGAP4,AGAP6,AHSA2,APBB3,CCNL2,CHKB-CPT1B,CSAD, FAM193B,FNBP4,KIAA0895L,LENG8,LOC440944,LOC91316,LUC7L, LY6G5B,MAPK8IP3,NKTR,PILRB,TAF1C,TTLL3,WDR27 | ADAMTS10,AGAP4,ANKRD23,CCDC57,CSAD,DNHD1,FAM156A, FAM193B,GIGYF1,GOLGA8A,HSF4,L3MBTL1,MEG3,NXF1, SIN3B,SLC25A27,STX16,TAF1C,TTLL3,WDR27,ZNF767P |
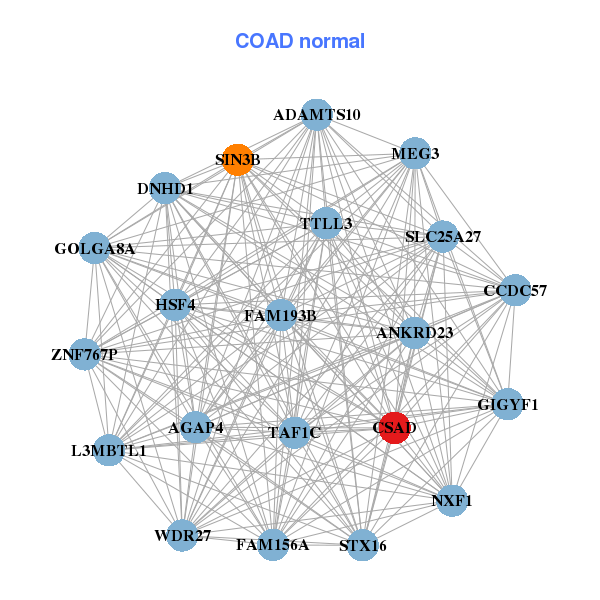
| * Co-Expression network figures were drawn using R package igraph. Only the top 20 genes with the highest correlations were shown. Red circle: input gene, orange circle: cell metabolism gene, sky circle: other gene |
: Open all plots for all cancer types
| Top |
: Open all interacting genes' information including KEGG pathway for all interacting genes from DAVID
| Top |
| Pharmacological Information for CSAD |
| DB Category | DB Name | DB's ID and Url link |
| * Gene Centered Interaction Network. |
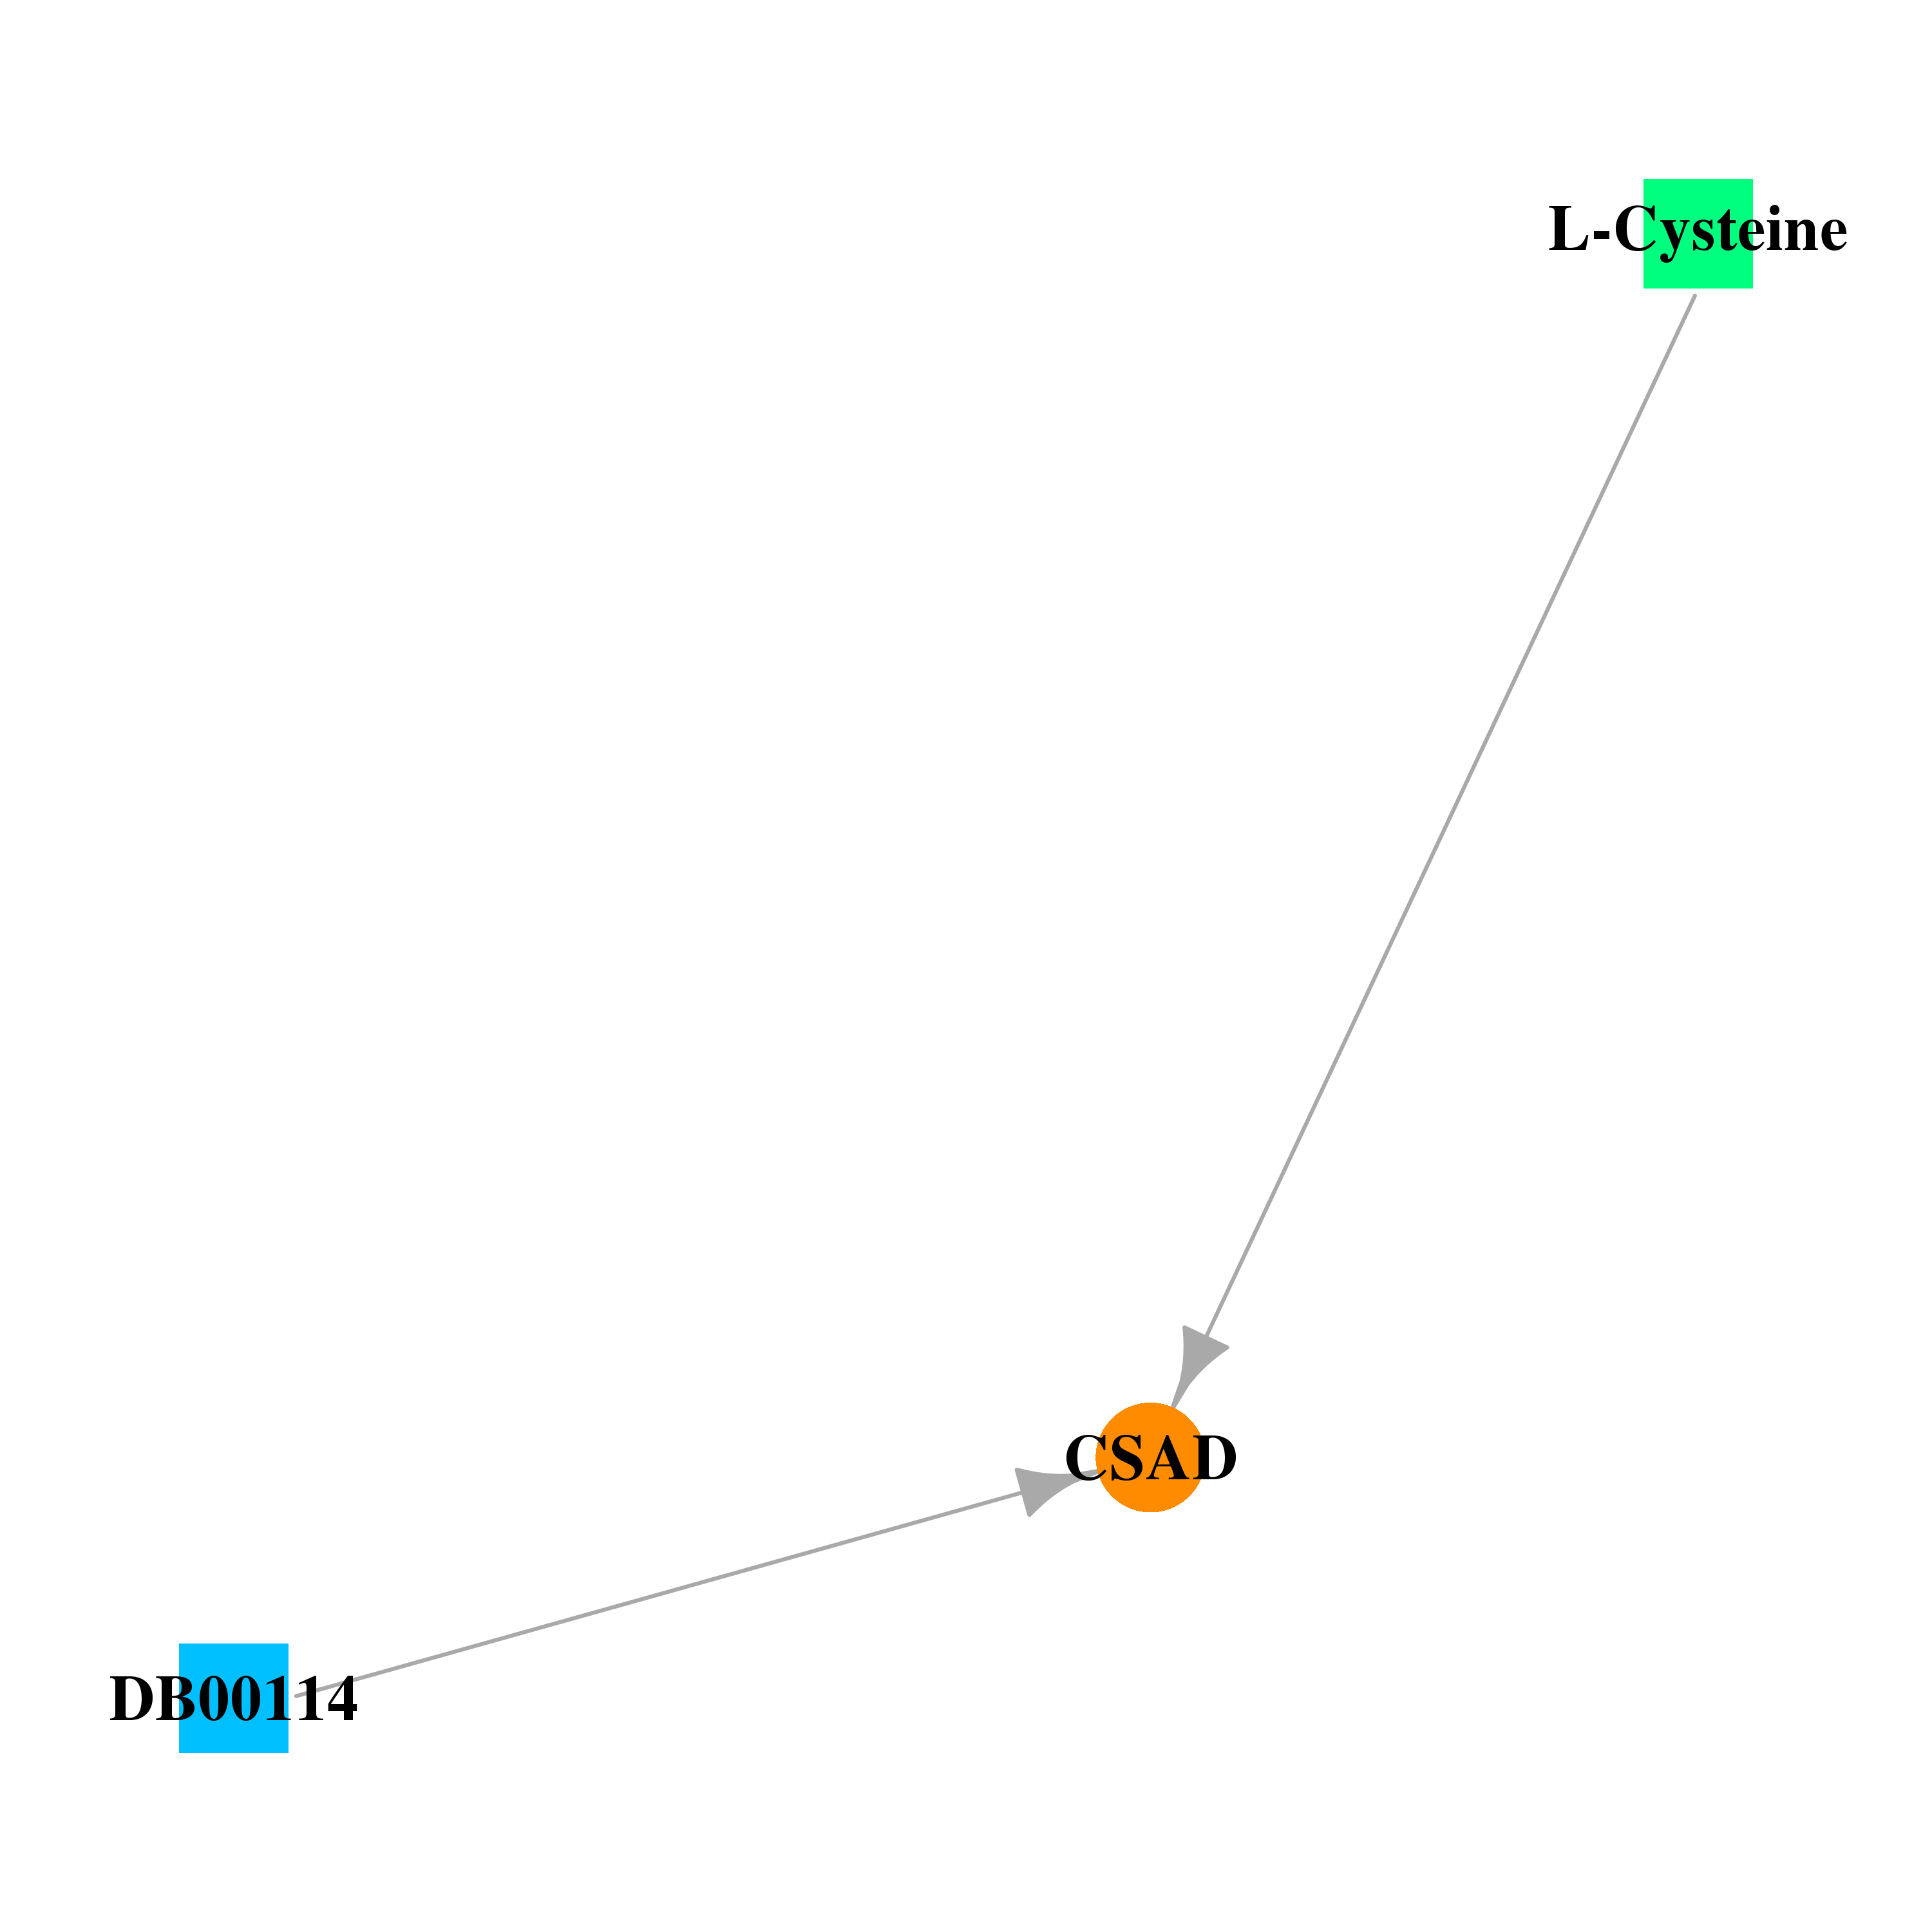 |
| * Drug Centered Interaction Network. |
| DrugBank ID | Target Name | Drug Groups | Generic Name | Drug Centered Network | Drug Structure |
| DB00114 | cysteine sulfinic acid decarboxylase | nutraceutical | Pyridoxal Phosphate |  |  |
| DB00151 | cysteine sulfinic acid decarboxylase | approved; nutraceutical | L-Cysteine | 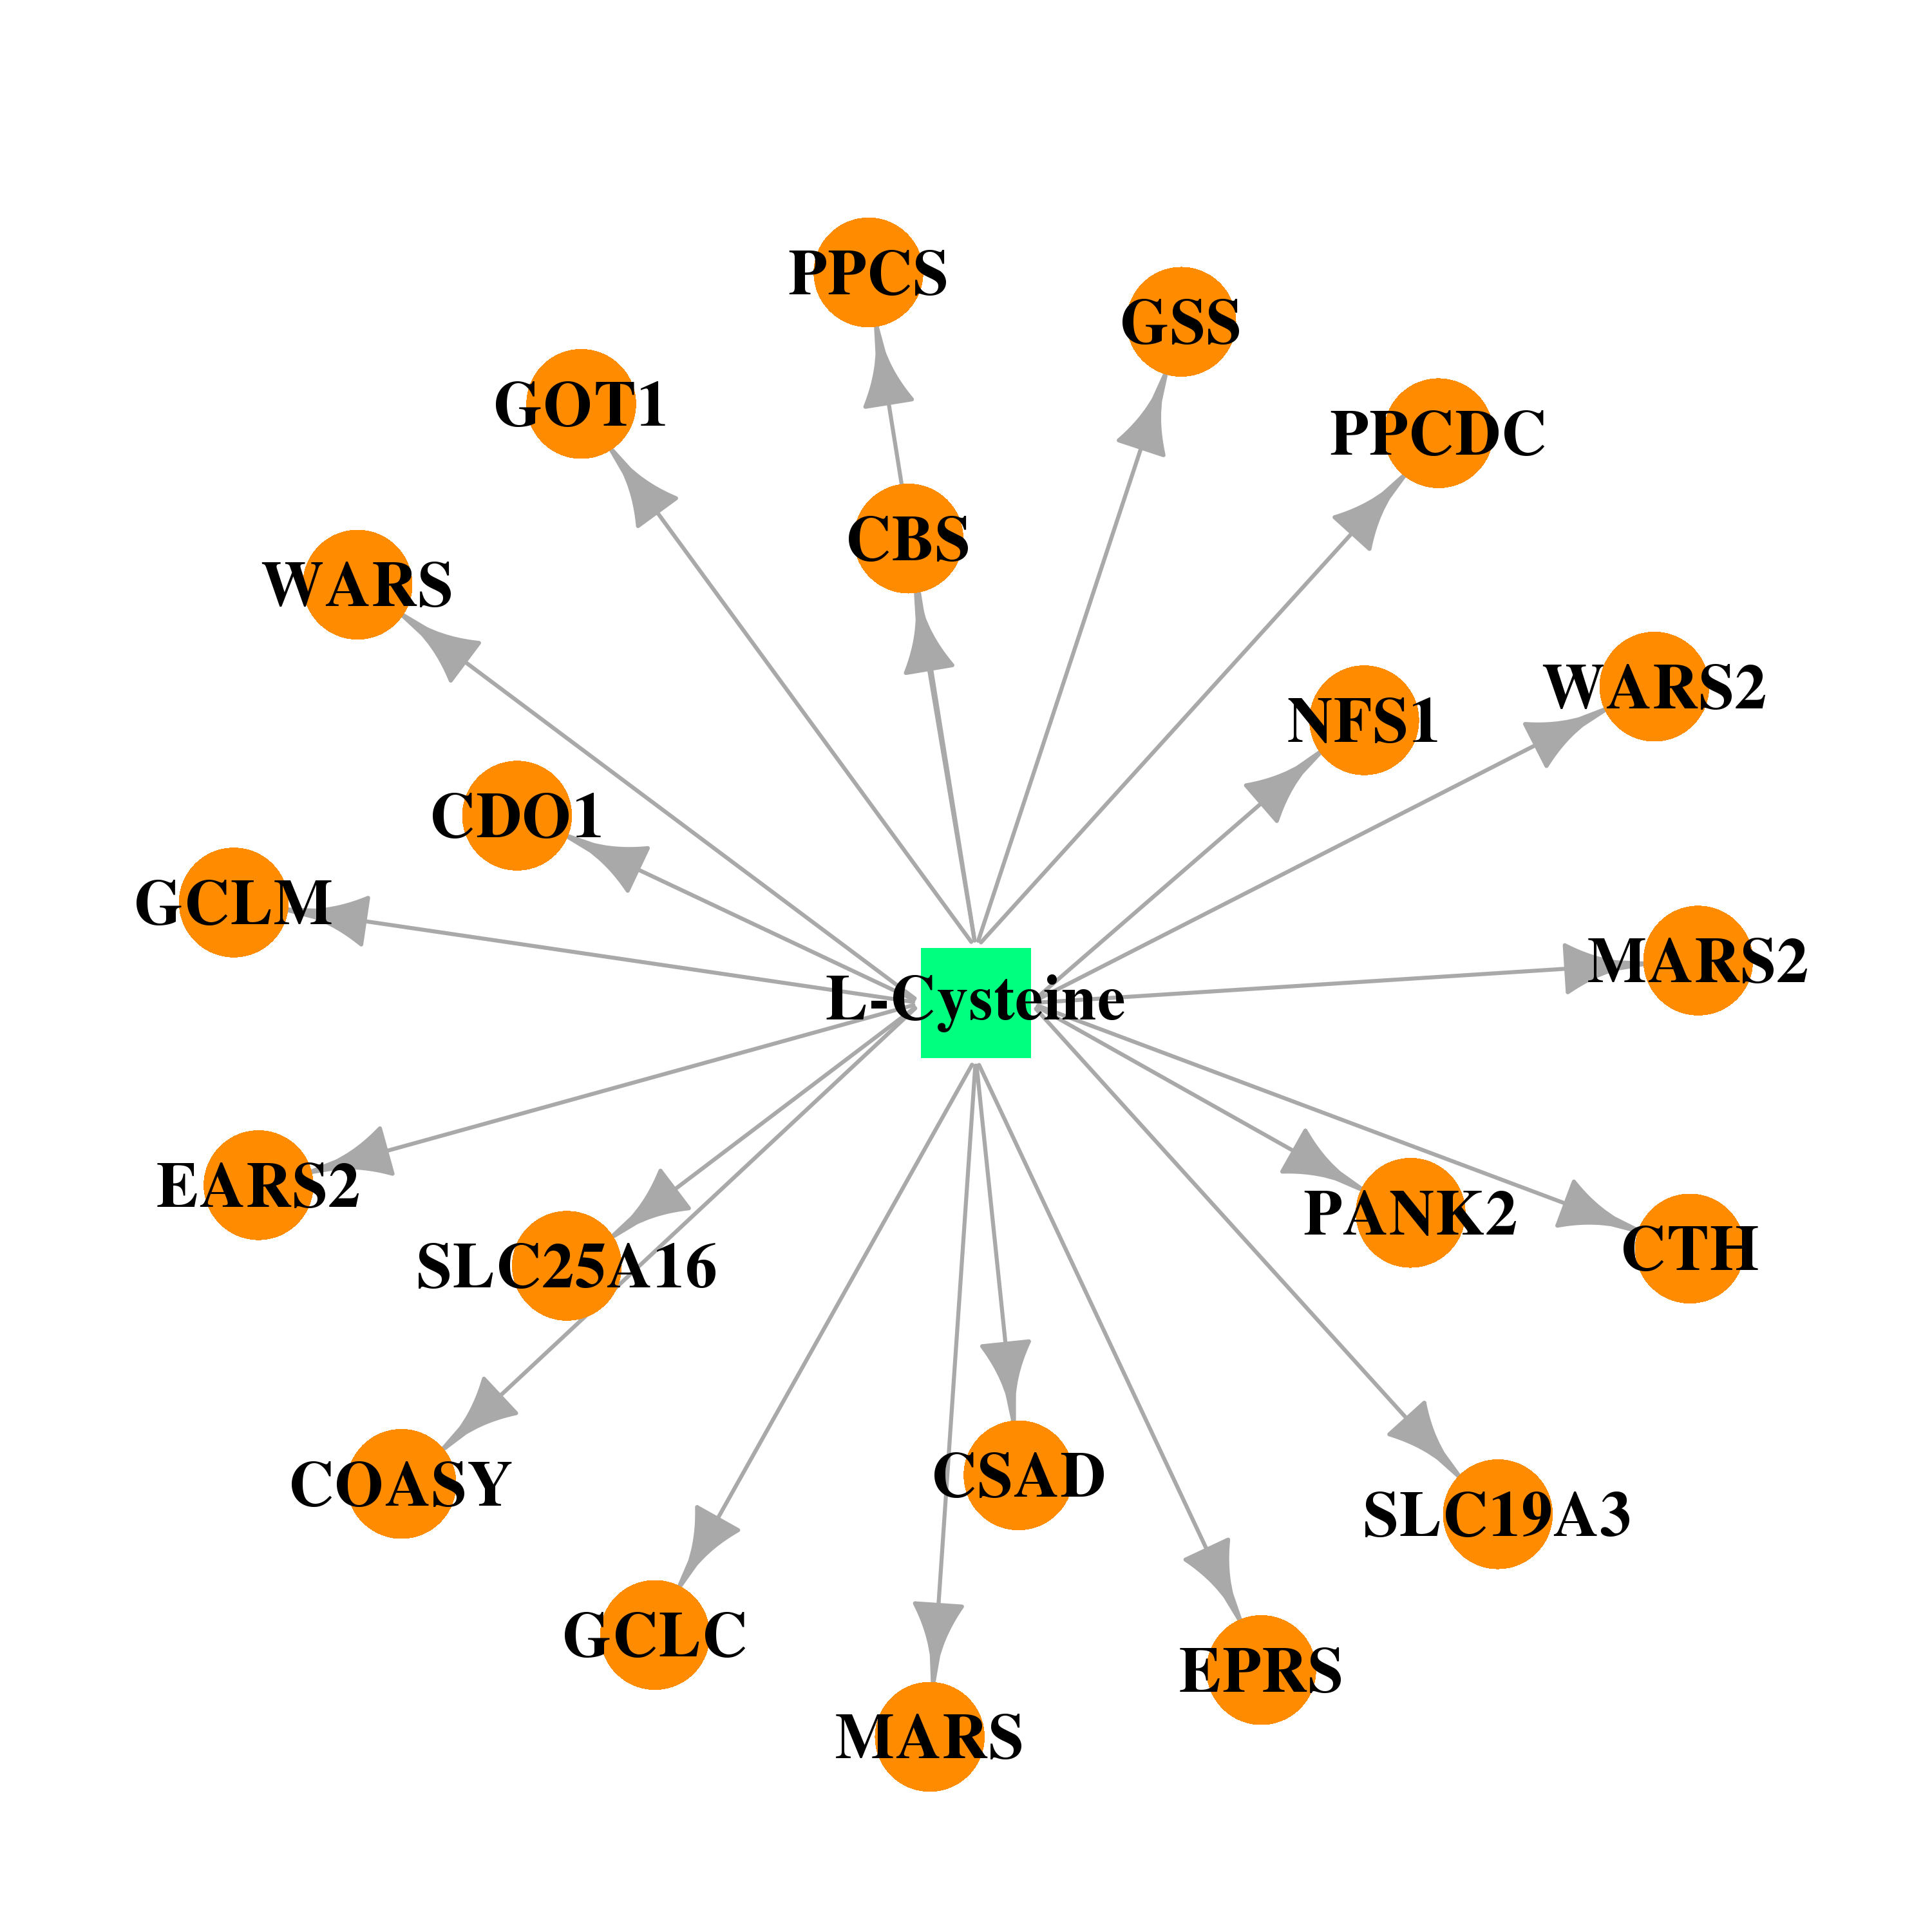 | 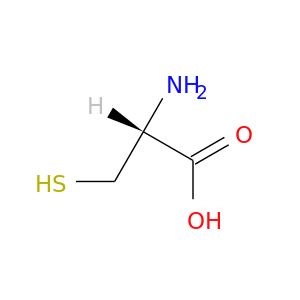 |
| Top |
| Cross referenced IDs for CSAD |
| * We obtained these cross-references from Uniprot database. It covers 150 different DBs, 18 categories. http://www.uniprot.org/help/cross_references_section |
: Open all cross reference information
|
Copyright © 2016-Present - The Univsersity of Texas Health Science Center at Houston @ |