|
||||||||||||||||||||||||||||||||||||||||||||||||||||||||||||||||||||||||||||||||||||||||||||||||||||||||||||||||||||||||||||||||||||||||||||||||||||||||||||||||||||||||||||||||||||||||||||||||||||||||||||||||||||||||||||||||||||||||||||||||||||||||||||||||||||||||||||||||||||||||||||||||||||||||||||||||||||||||||||||||||||||||||||||||||||||||||||||||||||||||||||||||||||||||||||||||
| |
| Phenotypic Information (metabolism pathway, cancer, disease, phenome) |
| |
| |
| Gene-Gene Network Information: Co-Expression Network, Interacting Genes & KEGG |
| |
|


| Gene Summary for PDE3B |
| Basic gene info. | Gene symbol | PDE3B |
| Gene name | phosphodiesterase 3B, cGMP-inhibited | |
| Synonyms | HcGIP1|cGIPDE1 | |
| Cytomap | UCSC genome browser: 11p15.1 | |
| Genomic location | chr11 :14665268-14893604 | |
| Type of gene | protein-coding | |
| RefGenes | NM_000922.3, | |
| Ensembl id | ENSG00000261923 | |
| Description | CGI-PDE BCGIP1cGMP-inhibited 3',5'-cyclic phosphodiesterase Bcyclic GMP-inhibited phosphodiesterase Bcyclic nucleotide phosphodiesterase | |
| Modification date | 20141207 | |
| dbXrefs | MIM : 602047 | |
| HGNC : HGNC | ||
| Ensembl : ENSG00000152270 | ||
| HPRD : 03626 | ||
| Vega : OTTHUMG00000165898 | ||
| Protein | UniProt: Q13370 go to UniProt's Cross Reference DB Table | |
| Expression | CleanEX: HS_PDE3B | |
| BioGPS: 5140 | ||
| Gene Expression Atlas: ENSG00000261923 | ||
| The Human Protein Atlas: ENSG00000261923 | ||
| Pathway | NCI Pathway Interaction Database: PDE3B | |
| KEGG: PDE3B | ||
| REACTOME: PDE3B | ||
| ConsensusPathDB | ||
| Pathway Commons: PDE3B | ||
| Metabolism | MetaCyc: PDE3B | |
| HUMANCyc: PDE3B | ||
| Regulation | Ensembl's Regulation: ENSG00000261923 | |
| miRBase: chr11 :14,665,268-14,893,604 | ||
| TargetScan: NM_000922 | ||
| cisRED: ENSG00000261923 | ||
| Context | iHOP: PDE3B | |
| cancer metabolism search in PubMed: PDE3B | ||
| UCL Cancer Institute: PDE3B | ||
| Assigned class in ccmGDB | B - This gene belongs to cancer gene. | |
| Top |
| Phenotypic Information for PDE3B(metabolism pathway, cancer, disease, phenome) |
| Cancer | CGAP: PDE3B |
| Familial Cancer Database: PDE3B | |
| * This gene is included in those cancer gene databases. |
|
|
|
|
|
| . | ||||||||||||||||||||||||||||||||||||||||||||||||||||||||||||||||||||||||||||||||||||||||||||||||||||||||||||||||||||||||||||||||||||||||||||||||||||||||||||||||||||||||||||||||||||||||||||||||||||||||||||||||||||||||||||||||||||||||||||||||||||||||||||||||||||||||||||||||||||||||||||||||||||||||||||||||||||||||||||||||||||||||||||||||||||||||||||||||||||||||||||||||||||||||||
Oncogene 1 | Significant driver gene in | |||||||||||||||||||||||||||||||||||||||||||||||||||||||||||||||||||||||||||||||||||||||||||||||||||||||||||||||||||||||||||||||||||||||||||||||||||||||||||||||||||||||||||||||||||||||||||||||||||||||||||||||||||||||||||||||||||||||||||||||||||||||||||||||||||||||||||||||||||||||||||||||||||||||||||||||||||||||||||||||||||||||||||||||||||||||||||||||||||||||||||||||||||||||||||||||
| cf) number; DB name 1 Oncogene; http://nar.oxfordjournals.org/content/35/suppl_1/D721.long, 2 Tumor Suppressor gene; https://bioinfo.uth.edu/TSGene/, 3 Cancer Gene Census; http://www.nature.com/nrc/journal/v4/n3/abs/nrc1299.html, 4 CancerGenes; http://nar.oxfordjournals.org/content/35/suppl_1/D721.long, 5 Network of Cancer Gene; http://ncg.kcl.ac.uk/index.php, 1Therapeutic Vulnerabilities in Cancer; http://cbio.mskcc.org/cancergenomics/statius/ |
| KEGG_PURINE_METABOLISM | |
| OMIM | 602047; gene. |
| Orphanet | |
| Disease | KEGG Disease: PDE3B |
| MedGen: PDE3B (Human Medical Genetics with Condition) | |
| ClinVar: PDE3B | |
| Phenotype | MGI: PDE3B (International Mouse Phenotyping Consortium) |
| PhenomicDB: PDE3B | |
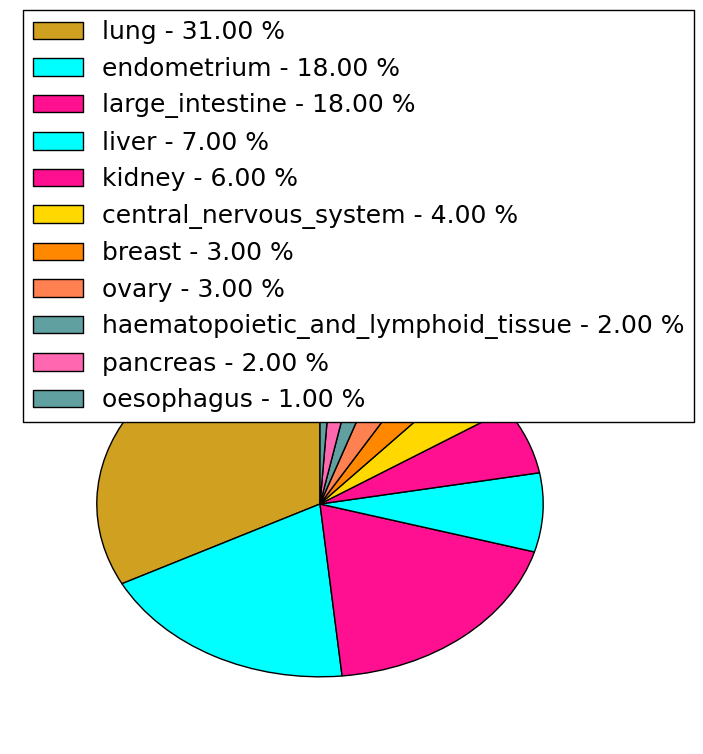
| Mutations for PDE3B |
| * Under tables are showing count per each tissue to give us broad intuition about tissue specific mutation patterns.You can go to the detailed page for each mutation database's web site. |
| - Statistics for Tissue and Mutation type | Top |
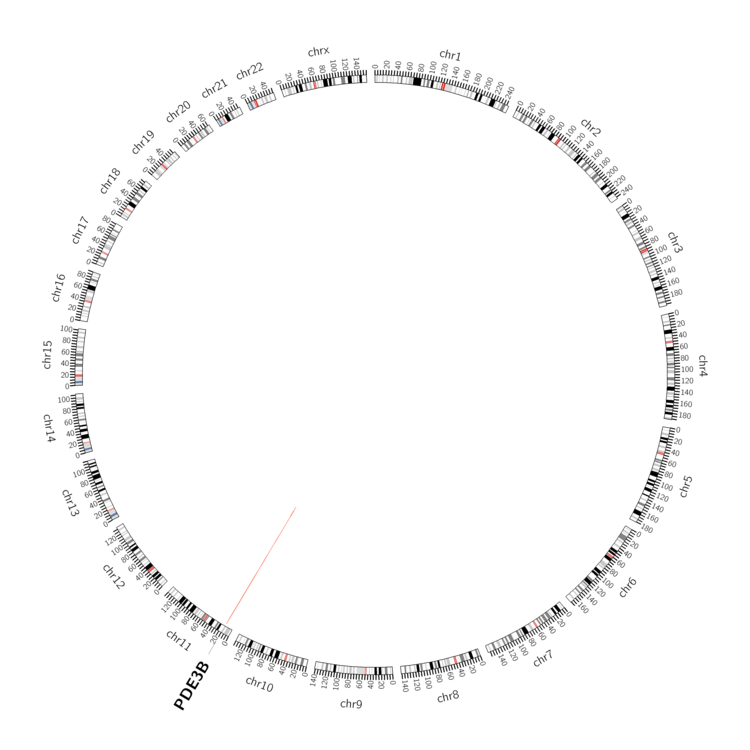 |
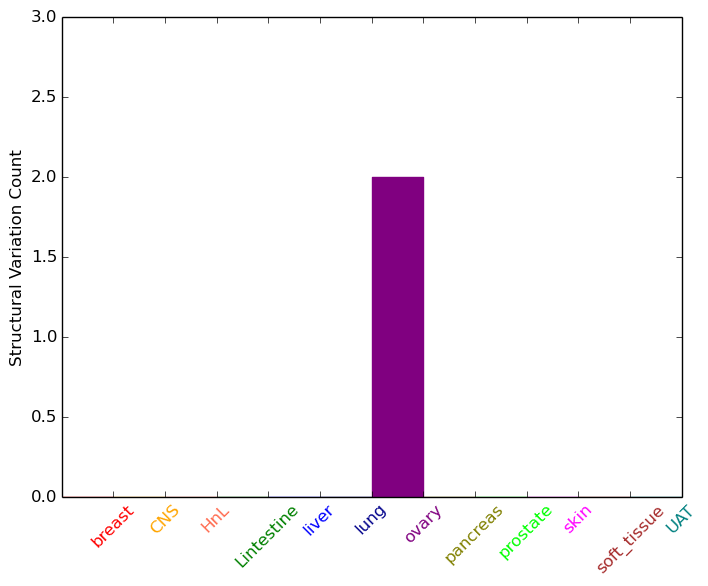
| - For Inter-chromosomal Variations |
| * Inter-chromosomal variantions includes 'interchromosomal amplicon to amplicon', 'interchromosomal amplicon to non-amplified dna', 'interchromosomal insertion', 'Interchromosomal unknown type'. |
 |
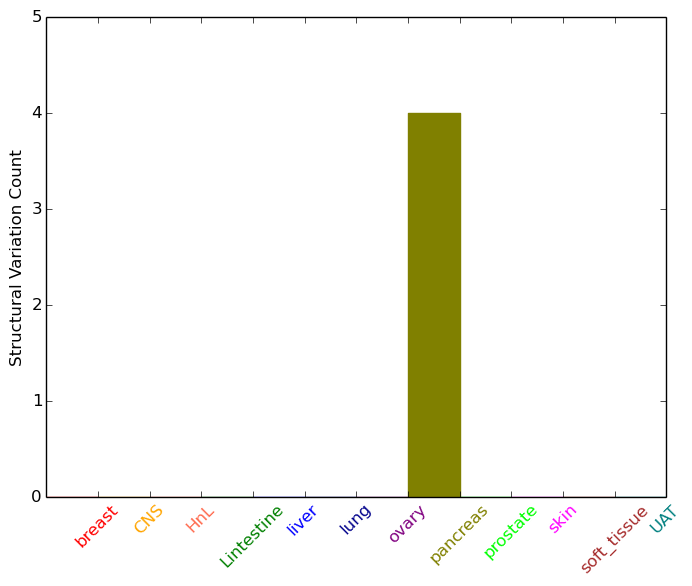
| - For Intra-chromosomal Variations |
| * Intra-chromosomal variantions includes 'intrachromosomal amplicon to amplicon', 'intrachromosomal amplicon to non-amplified dna', 'intrachromosomal deletion', 'intrachromosomal fold-back inversion', 'intrachromosomal inversion', 'intrachromosomal tandem duplication', 'Intrachromosomal unknown type', 'intrachromosomal with inverted orientation', 'intrachromosomal with non-inverted orientation'. |
 |
| Sample | Symbol_a | Chr_a | Start_a | End_a | Symbol_b | Chr_b | Start_b | End_b |
| ovary | PDE3B | chr11 | 14849898 | 14849918 | chr23 | 73796772 | 73796792 | |
| ovary | PDE3B | chr11 | 14863139 | 14863339 | chr23 | 73796878 | 73797078 | |
| pancreas | PDE3B | chr11 | 14714587 | 14714787 | chr11 | 15073088 | 15073288 | |
| pancreas | PDE3B | chr11 | 14714680 | 14714700 | chr11 | 15073977 | 15073997 | |
| pancreas | PDE3B | chr11 | 14715045 | 14715245 | chr11 | 15073872 | 15074072 | |
| pancreas | PDE3B | chr11 | 14715127 | 14715147 | chr11 | 15073157 | 15073177 |
| cf) Tissue number; Tissue name (1;Breast, 2;Central_nervous_system, 3;Haematopoietic_and_lymphoid_tissue, 4;Large_intestine, 5;Liver, 6;Lung, 7;Ovary, 8;Pancreas, 9;Prostate, 10;Skin, 11;Soft_tissue, 12;Upper_aerodigestive_tract) |
| * From mRNA Sanger sequences, Chitars2.0 arranged chimeric transcripts. This table shows PDE3B related fusion information. |
| ID | Head Gene | Tail Gene | Accession | Gene_a | qStart_a | qEnd_a | Chromosome_a | tStart_a | tEnd_a | Gene_a | qStart_a | qEnd_a | Chromosome_a | tStart_a | tEnd_a |
| AI969380 | SPATA8 | 1 | 228 | 15 | 97328609 | 97328836 | PDE3B | 223 | 412 | 11 | 14666444 | 14793516 | |
| AI651372 | SPATA8 | 1 | 228 | 15 | 97328609 | 97328836 | PDE3B | 223 | 460 | 11 | 14666396 | 14793516 | |
| Top |
| Mutation type/ Tissue ID | brca | cns | cerv | endome | haematopo | kidn | Lintest | liver | lung | ns | ovary | pancre | prost | skin | stoma | thyro | urina | |||
| Total # sample | 2 | 1 | 5 | |||||||||||||||||
| GAIN (# sample) | 2 | 5 | ||||||||||||||||||
| LOSS (# sample) | 1 |
| cf) Tissue ID; Tissue type (1; Breast, 2; Central_nervous_system, 3; Cervix, 4; Endometrium, 5; Haematopoietic_and_lymphoid_tissue, 6; Kidney, 7; Large_intestine, 8; Liver, 9; Lung, 10; NS, 11; Ovary, 12; Pancreas, 13; Prostate, 14; Skin, 15; Stomach, 16; Thyroid, 17; Urinary_tract) |
| Top |
|
 |
| Top |
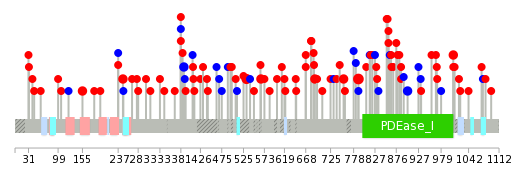
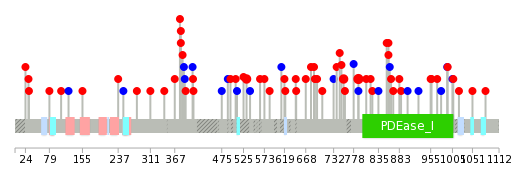
| Stat. for Non-Synonymous SNVs (# total SNVs=82) | (# total SNVs=19) |
 |  |
(# total SNVs=0) | (# total SNVs=1) |
 |
| Top |
| * When you move the cursor on each content, you can see more deailed mutation information on the Tooltip. Those are primary_site,primary_histology,mutation(aa),pubmedID. |
| GRCh37 position | Mutation(aa) | Unique sampleID count |
| chr11:14865418-14865418 | p.S789L | 4 |
| chr11:14839801-14839801 | p.R532Q | 3 |
| chr11:14666364-14666364 | p.L248P | 2 |
| chr11:14808095-14808095 | p.R381Q | 2 |
| chr11:14856585-14856585 | p.R755L | 2 |
| chr11:14808117-14808117 | p.G388G | 2 |
| chr11:14889184-14889184 | p.G1007S | 2 |
| chr11:14853295-14853295 | p.G689E | 2 |
| chr11:14882859-14882859 | p.R945* | 2 |
| chr11:14666084-14666084 | p.L155M | 2 |
| Top |
|
 |
| Point Mutation/ Tissue ID | 1 | 2 | 3 | 4 | 5 | 6 | 7 | 8 | 9 | 10 | 11 | 12 | 13 | 14 | 15 | 16 | 17 | 18 | 19 | 20 |
| # sample | 4 | 3 | 12 | 3 | 3 | 12 | 5 | 1 | 6 | 14 | 10 | |||||||||
| # mutation | 4 | 3 | 12 | 3 | 3 | 13 | 5 | 1 | 6 | 16 | 15 | |||||||||
| nonsynonymous SNV | 1 | 2 | 7 | 3 | 3 | 12 | 4 | 1 | 5 | 14 | 10 | |||||||||
| synonymous SNV | 3 | 1 | 5 | 1 | 1 | 1 | 2 | 5 |
| cf) Tissue ID; Tissue type (1; BLCA[Bladder Urothelial Carcinoma], 2; BRCA[Breast invasive carcinoma], 3; CESC[Cervical squamous cell carcinoma and endocervical adenocarcinoma], 4; COAD[Colon adenocarcinoma], 5; GBM[Glioblastoma multiforme], 6; Glioma Low Grade, 7; HNSC[Head and Neck squamous cell carcinoma], 8; KICH[Kidney Chromophobe], 9; KIRC[Kidney renal clear cell carcinoma], 10; KIRP[Kidney renal papillary cell carcinoma], 11; LAML[Acute Myeloid Leukemia], 12; LUAD[Lung adenocarcinoma], 13; LUSC[Lung squamous cell carcinoma], 14; OV[Ovarian serous cystadenocarcinoma ], 15; PAAD[Pancreatic adenocarcinoma], 16; PRAD[Prostate adenocarcinoma], 17; SKCM[Skin Cutaneous Melanoma], 18:STAD[Stomach adenocarcinoma], 19:THCA[Thyroid carcinoma], 20:UCEC[Uterine Corpus Endometrial Carcinoma]) |
| Top |
| * We represented just top 10 SNVs. When you move the cursor on each content, you can see more deailed mutation information on the Tooltip. Those are primary_site, primary_histology, mutation(aa), pubmedID. |
| Genomic Position | Mutation(aa) | Unique sampleID count |
| chr11:14865418 | p.S789L | 3 |
| chr11:14808095 | p.R532Q | 2 |
| chr11:14856585 | p.R381Q | 2 |
| chr11:14839801 | p.R755L | 2 |
| chr11:14825558 | p.Y408Y | 1 |
| chr11:14865557 | p.Q621K | 1 |
| chr11:14852297 | p.I955T | 1 |
| chr11:14882890 | p.R79P | 1 |
| chr11:14665857 | p.P409H | 1 |
| chr11:14856557 | p.A645V | 1 |
| * Copy number data were extracted from TCGA using R package TCGA-Assembler. The URLs of all public data files on TCGA DCC data server were gathered on Jan-05-2015. Function ProcessCNAData in TCGA-Assembler package was used to obtain gene-level copy number value which is calculated as the average copy number of the genomic region of a gene. |
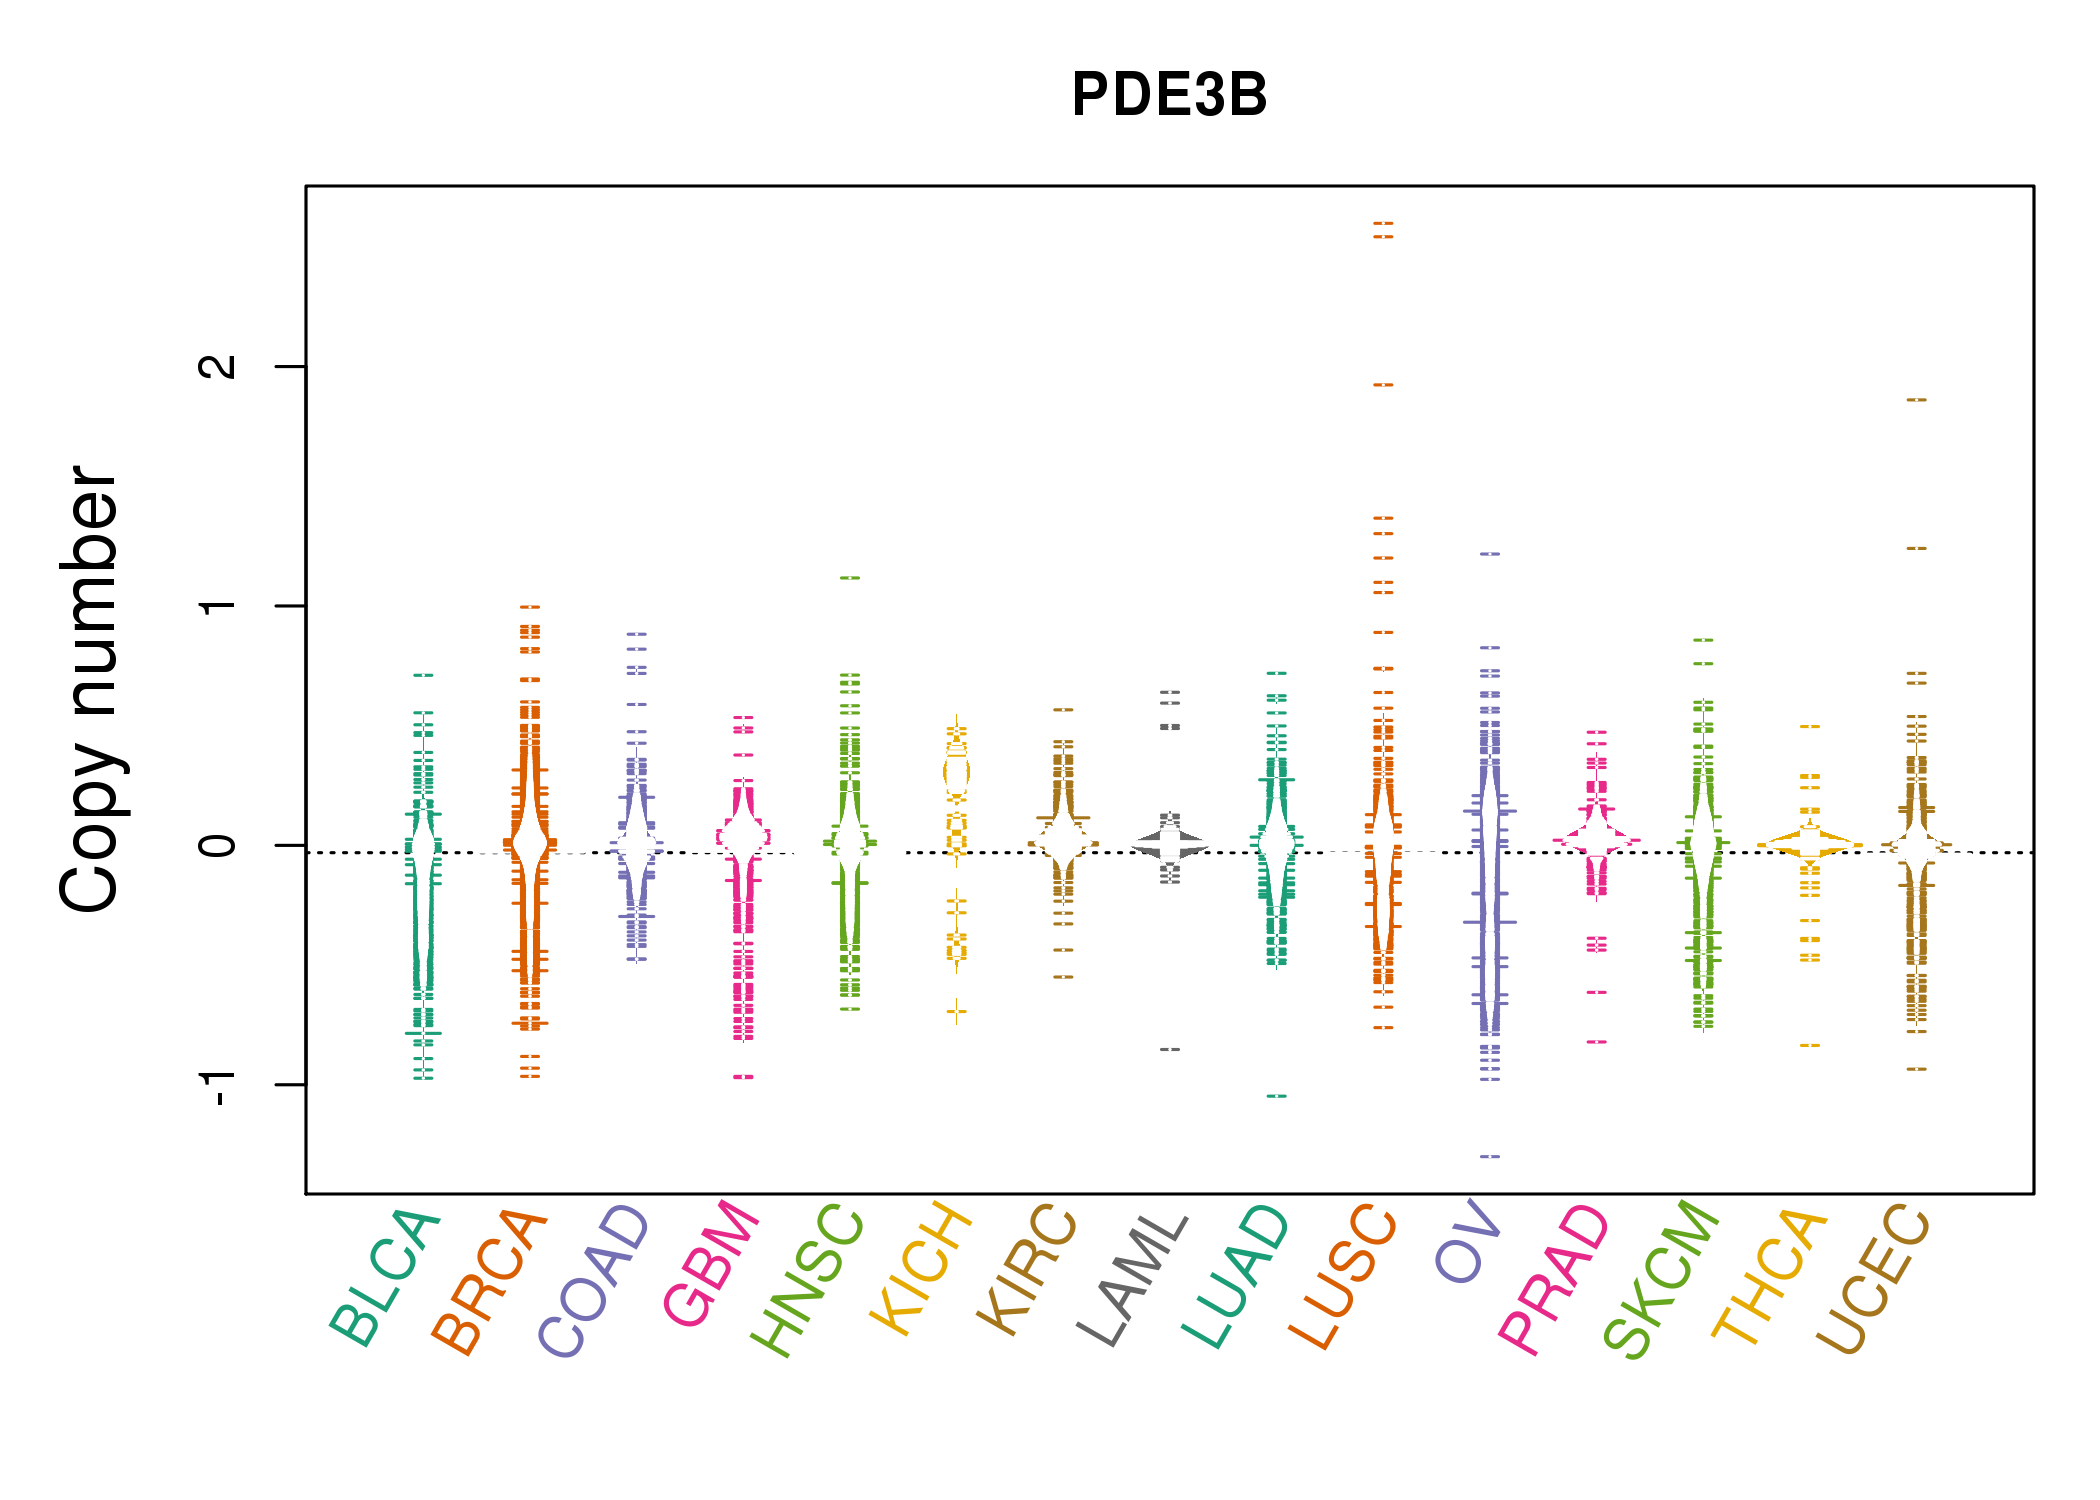 |
| cf) Tissue ID[Tissue type]: BLCA[Bladder Urothelial Carcinoma], BRCA[Breast invasive carcinoma], CESC[Cervical squamous cell carcinoma and endocervical adenocarcinoma], COAD[Colon adenocarcinoma], GBM[Glioblastoma multiforme], Glioma Low Grade, HNSC[Head and Neck squamous cell carcinoma], KICH[Kidney Chromophobe], KIRC[Kidney renal clear cell carcinoma], KIRP[Kidney renal papillary cell carcinoma], LAML[Acute Myeloid Leukemia], LUAD[Lung adenocarcinoma], LUSC[Lung squamous cell carcinoma], OV[Ovarian serous cystadenocarcinoma ], PAAD[Pancreatic adenocarcinoma], PRAD[Prostate adenocarcinoma], SKCM[Skin Cutaneous Melanoma], STAD[Stomach adenocarcinoma], THCA[Thyroid carcinoma], UCEC[Uterine Corpus Endometrial Carcinoma] |
| Top |
| Gene Expression for PDE3B |
| * CCLE gene expression data were extracted from CCLE_Expression_Entrez_2012-10-18.res: Gene-centric RMA-normalized mRNA expression data. |
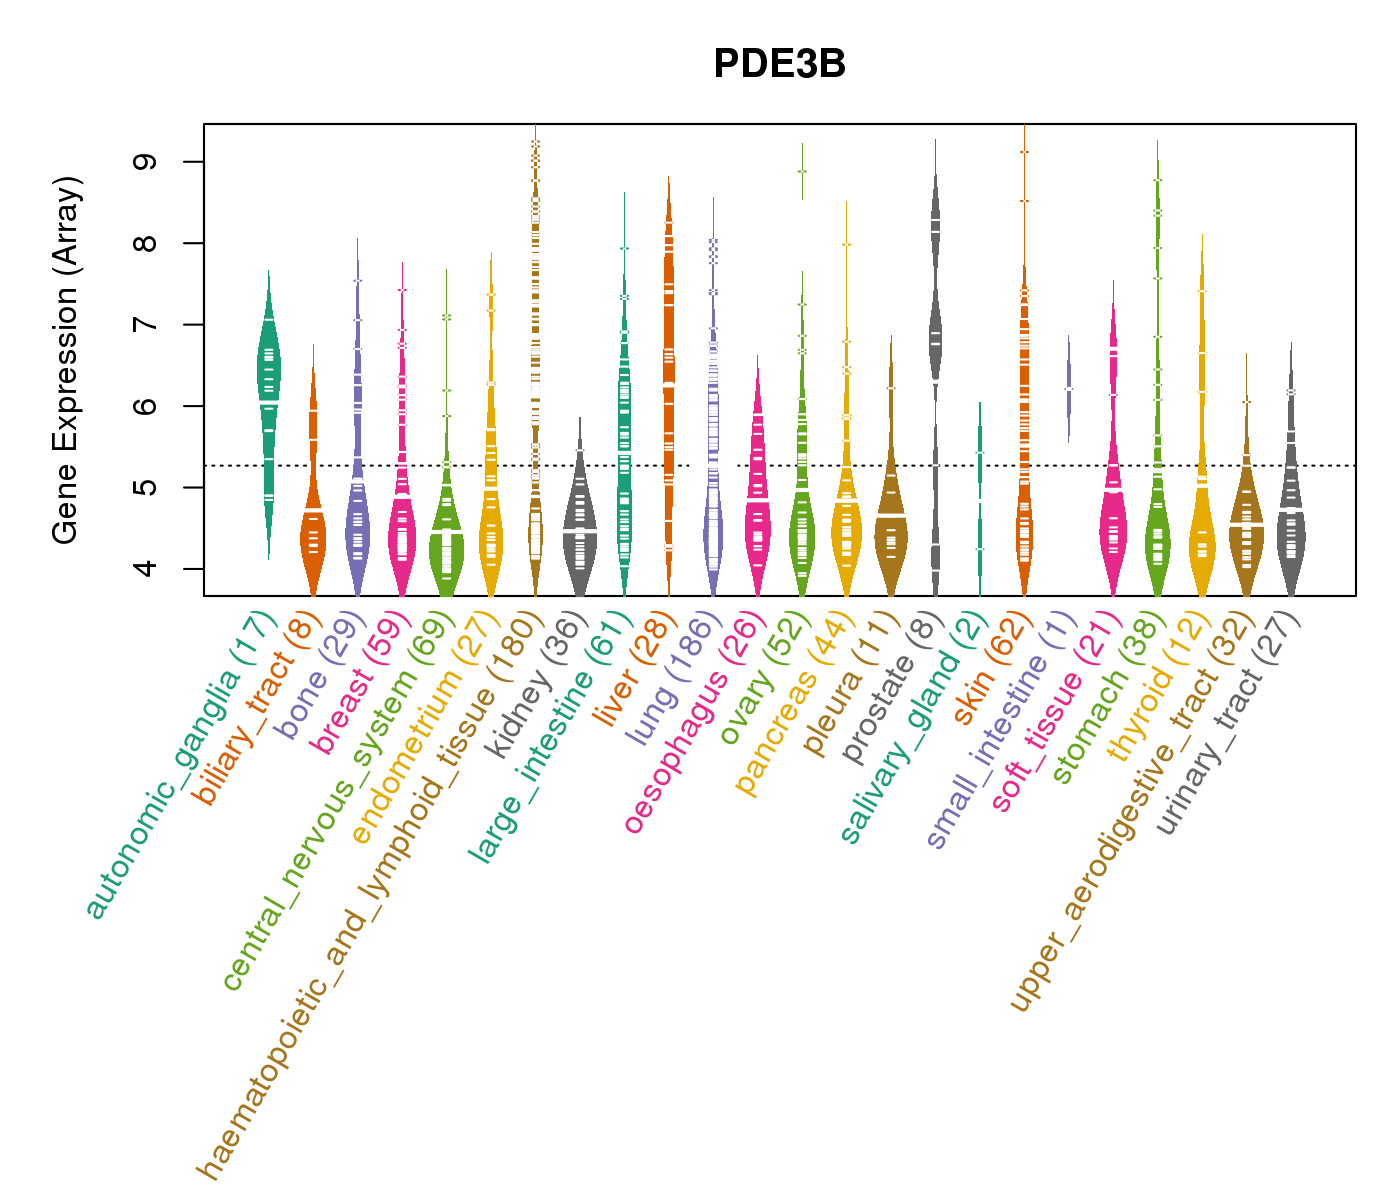 |
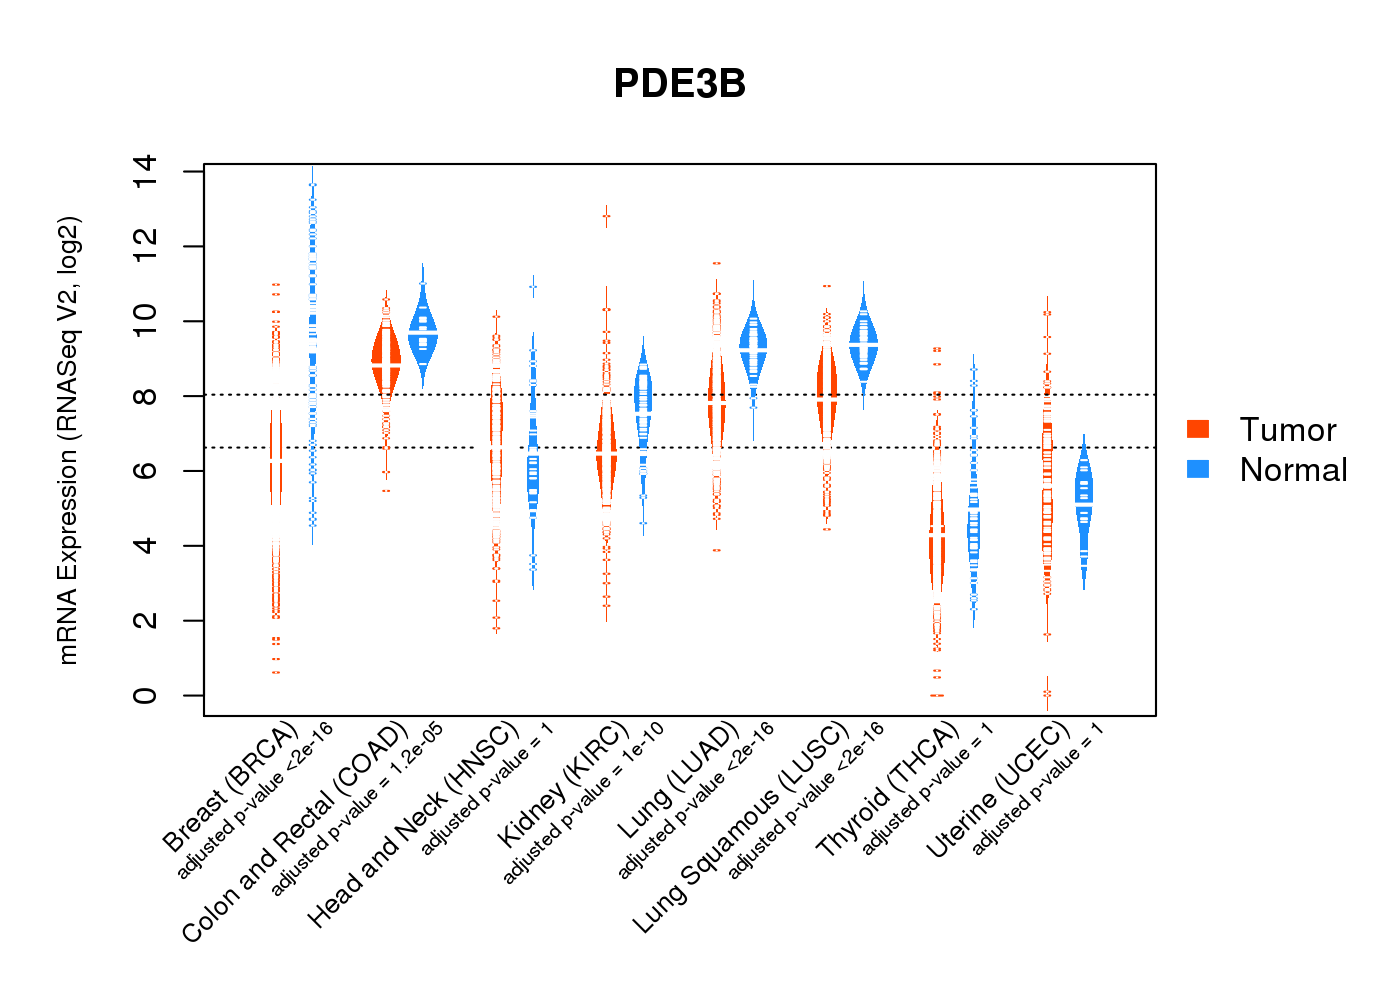
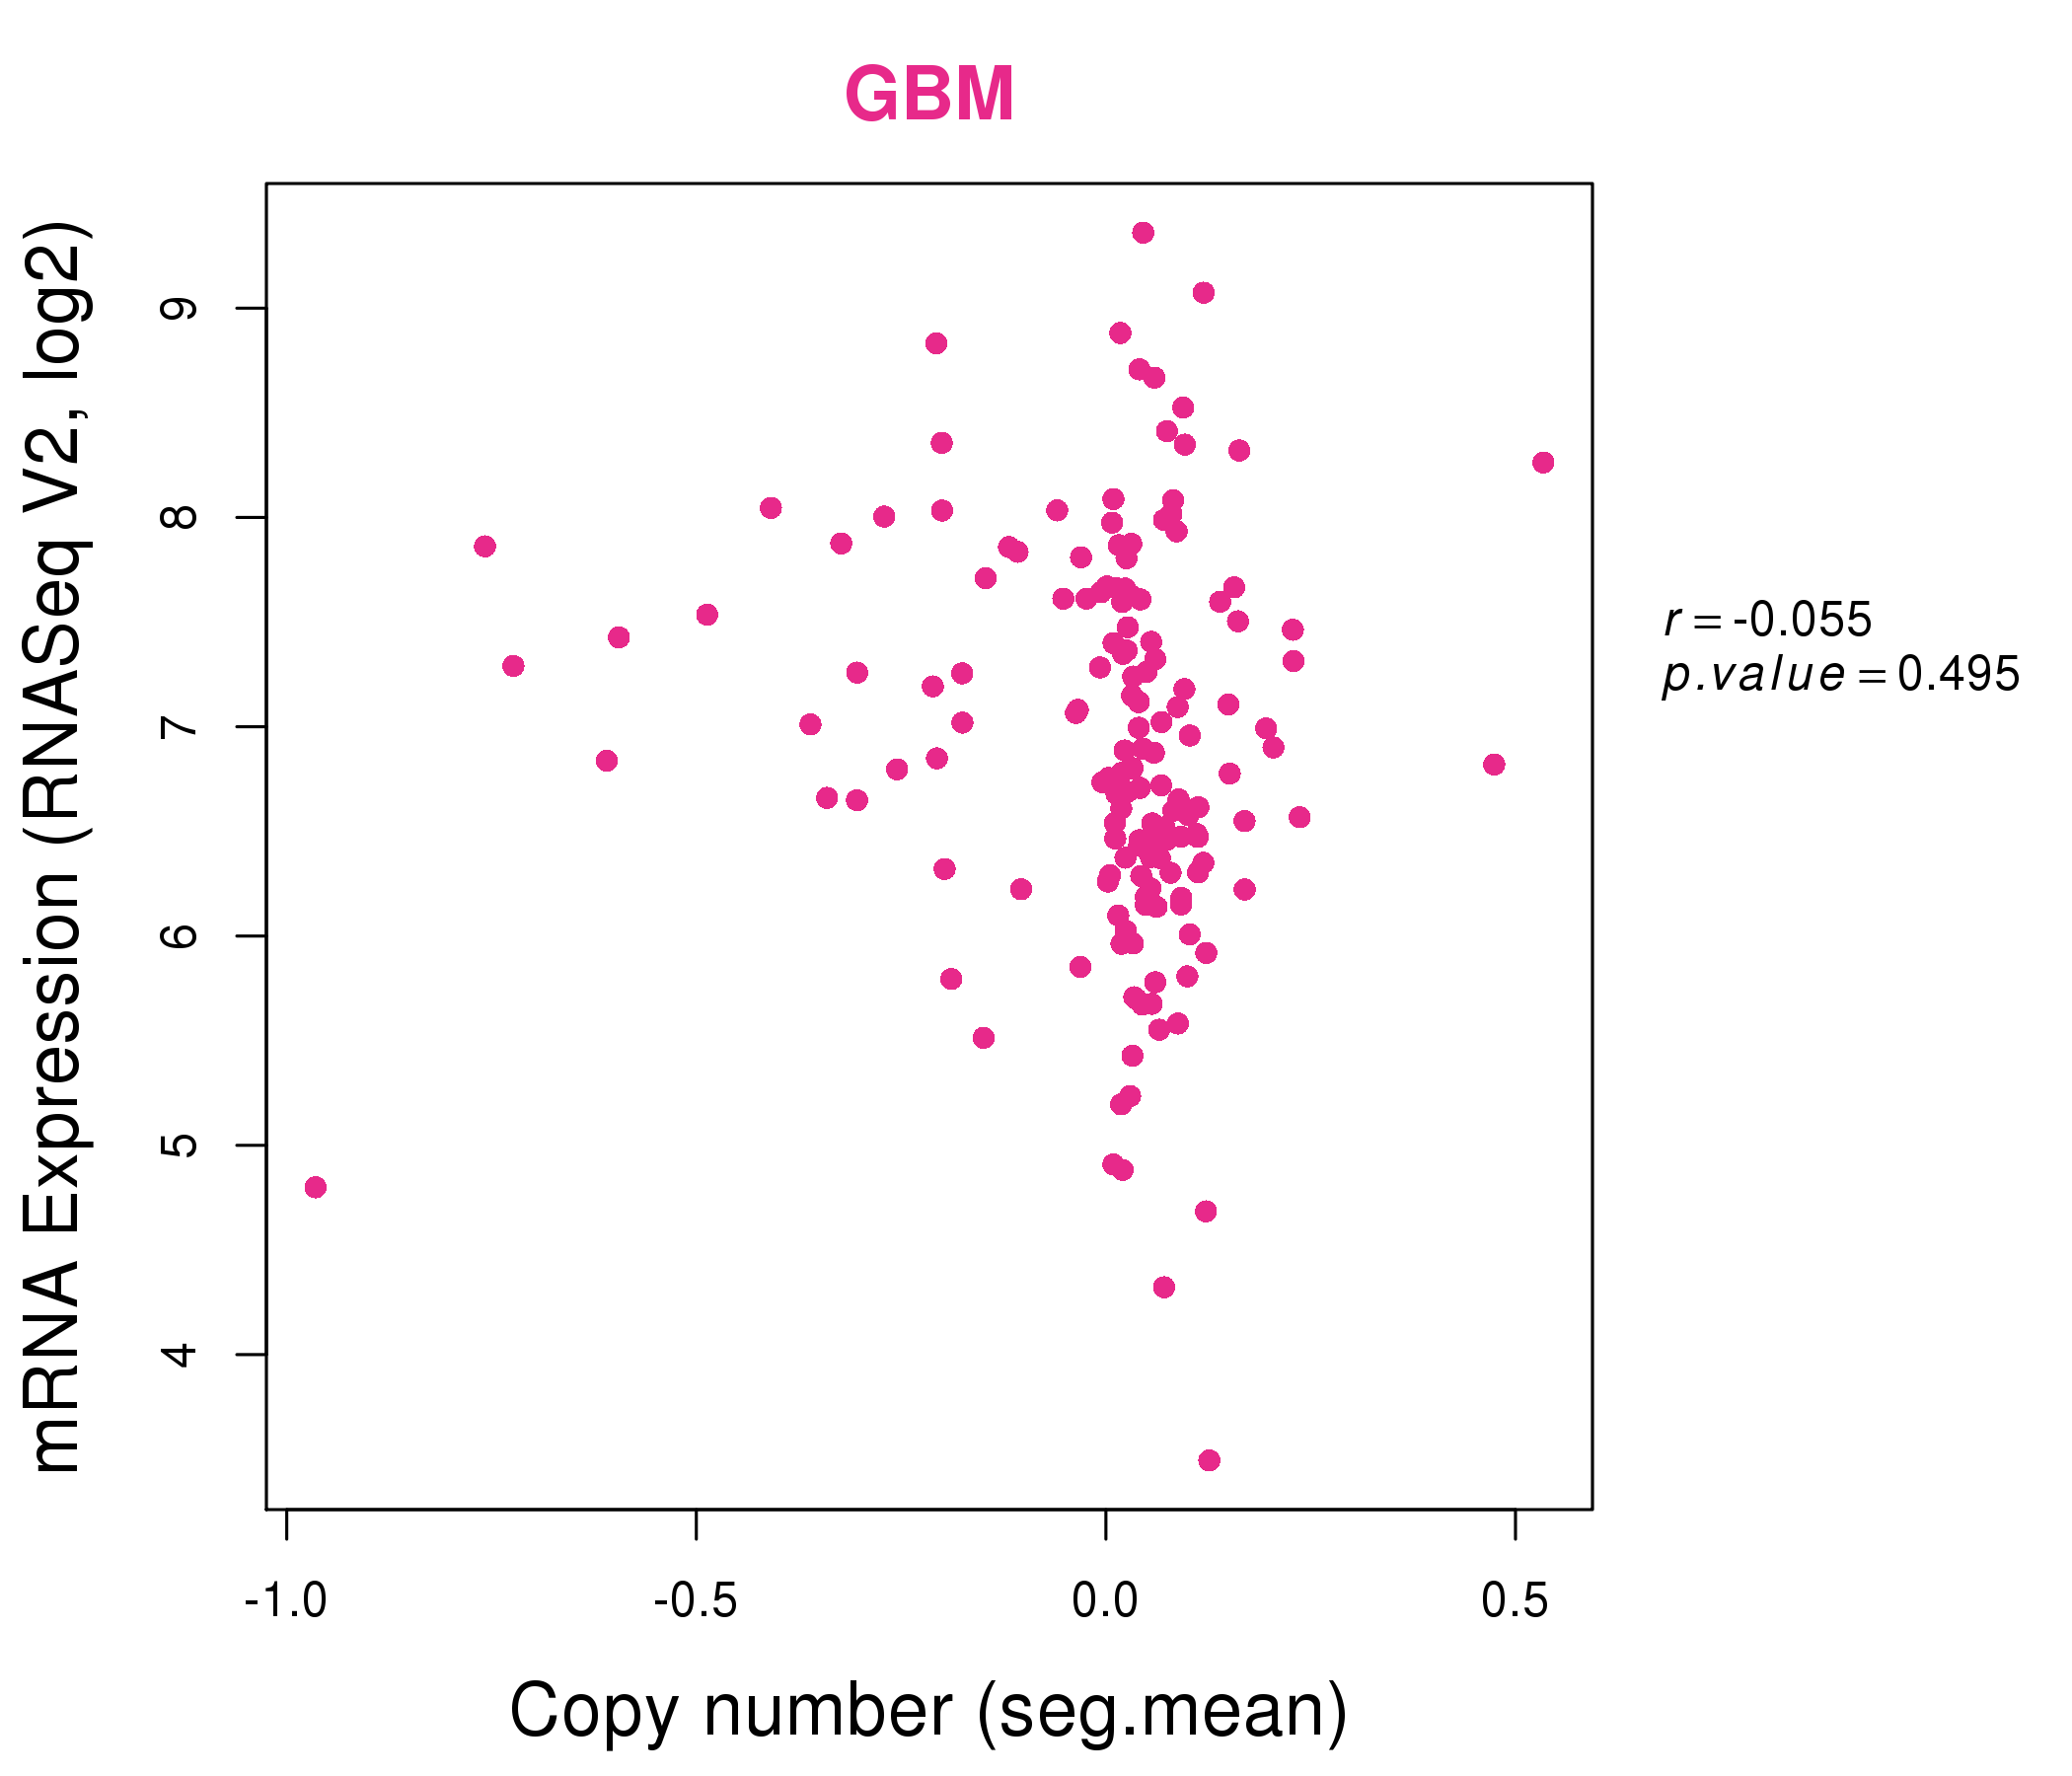
| * Normalized gene expression data of RNASeqV2 was extracted from TCGA using R package TCGA-Assembler. The URLs of all public data files on TCGA DCC data server were gathered at Jan-05-2015. Only eight cancer types have enough normal control samples for differential expression analysis. (t test, adjusted p<0.05 (using Benjamini-Hochberg FDR)) |
 |
| Top |
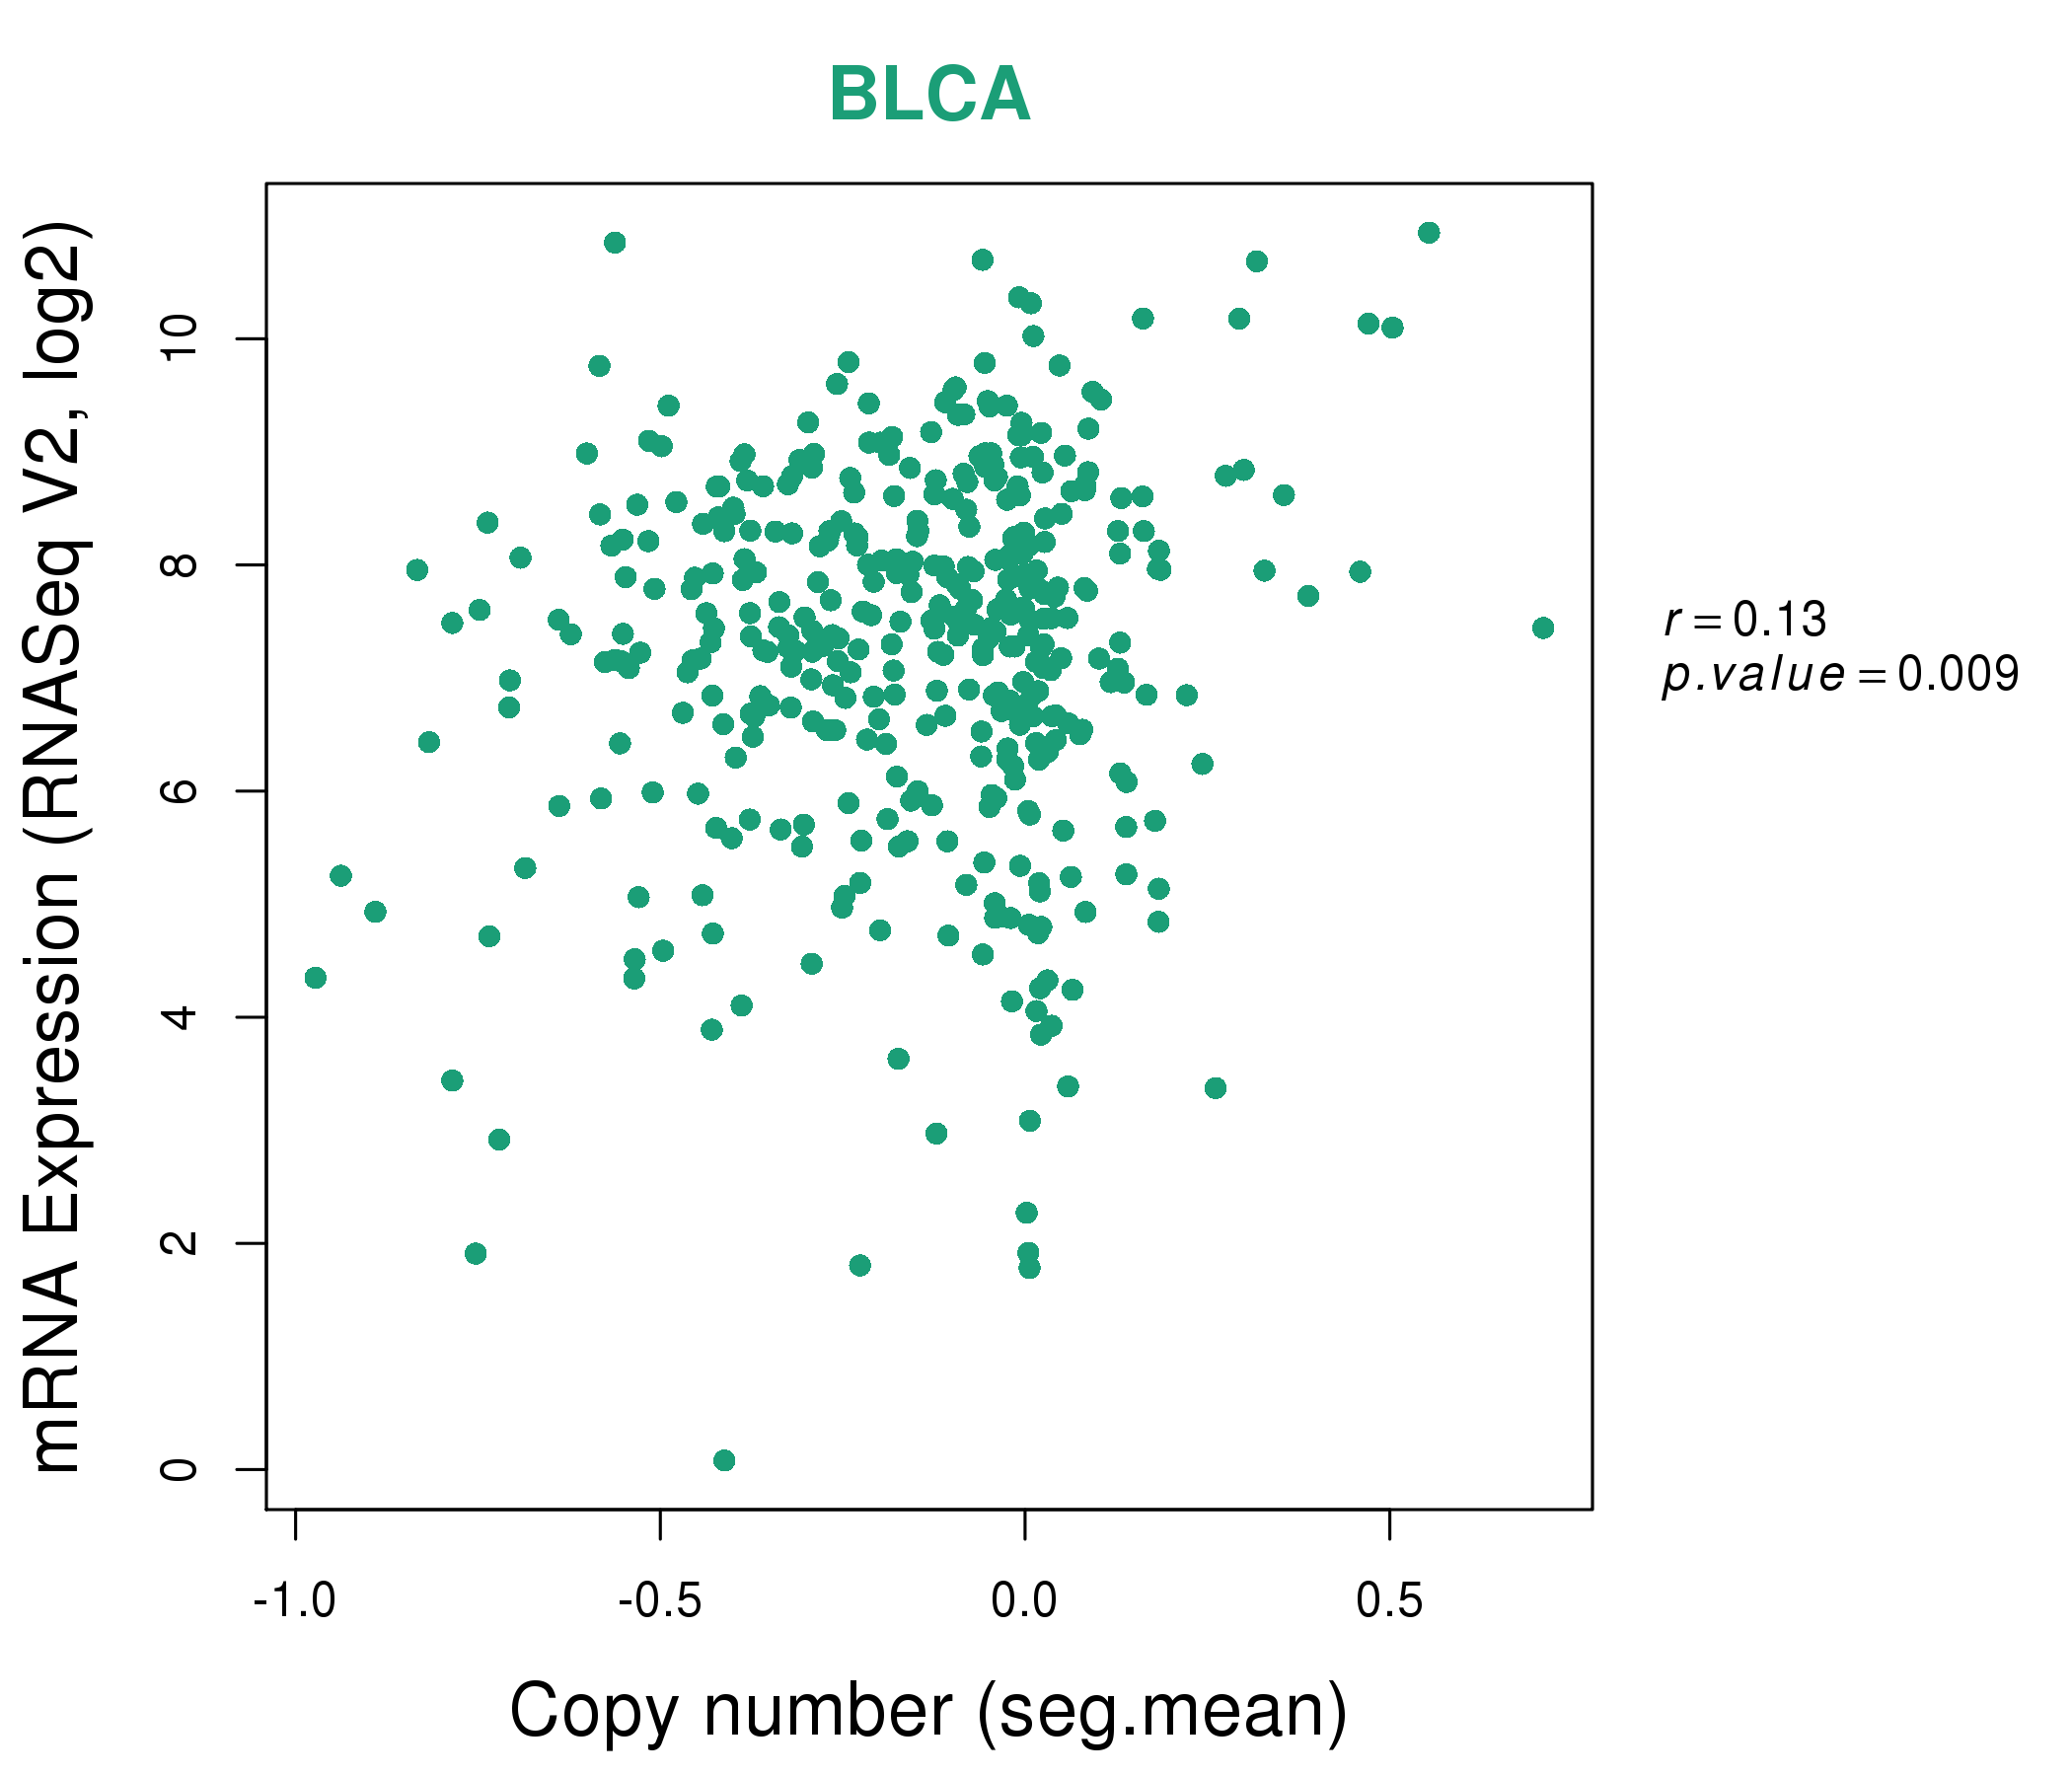
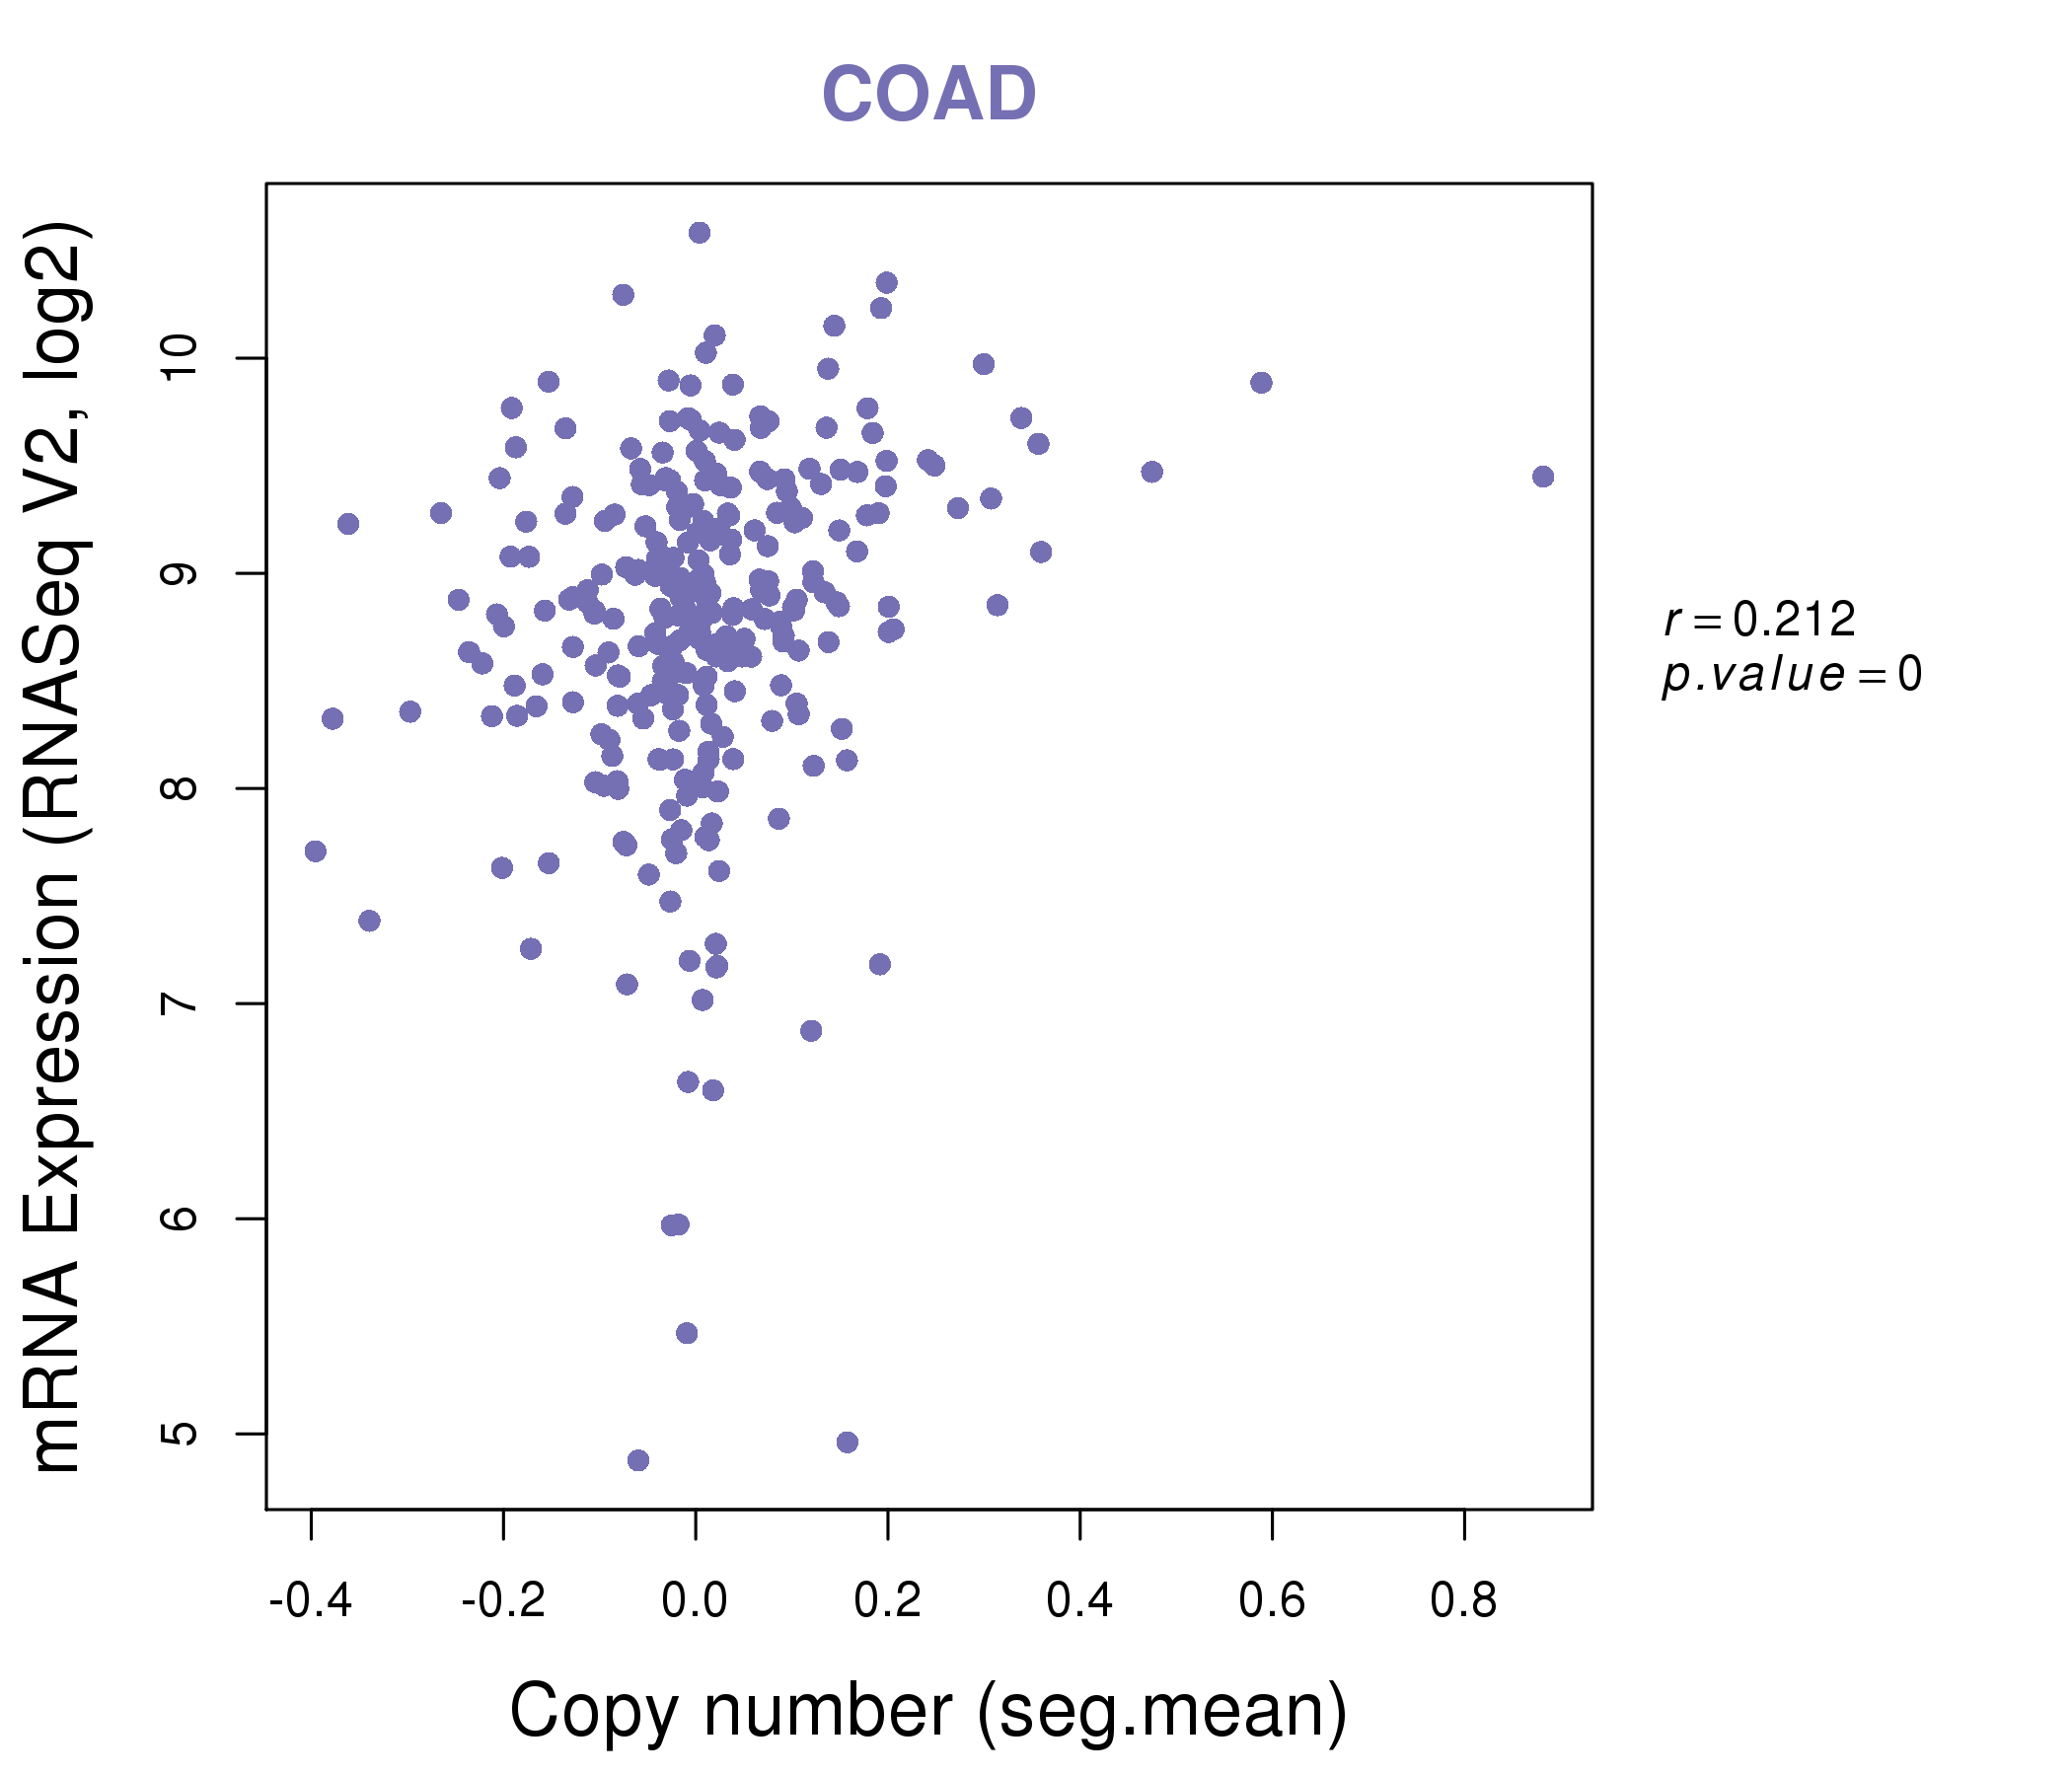
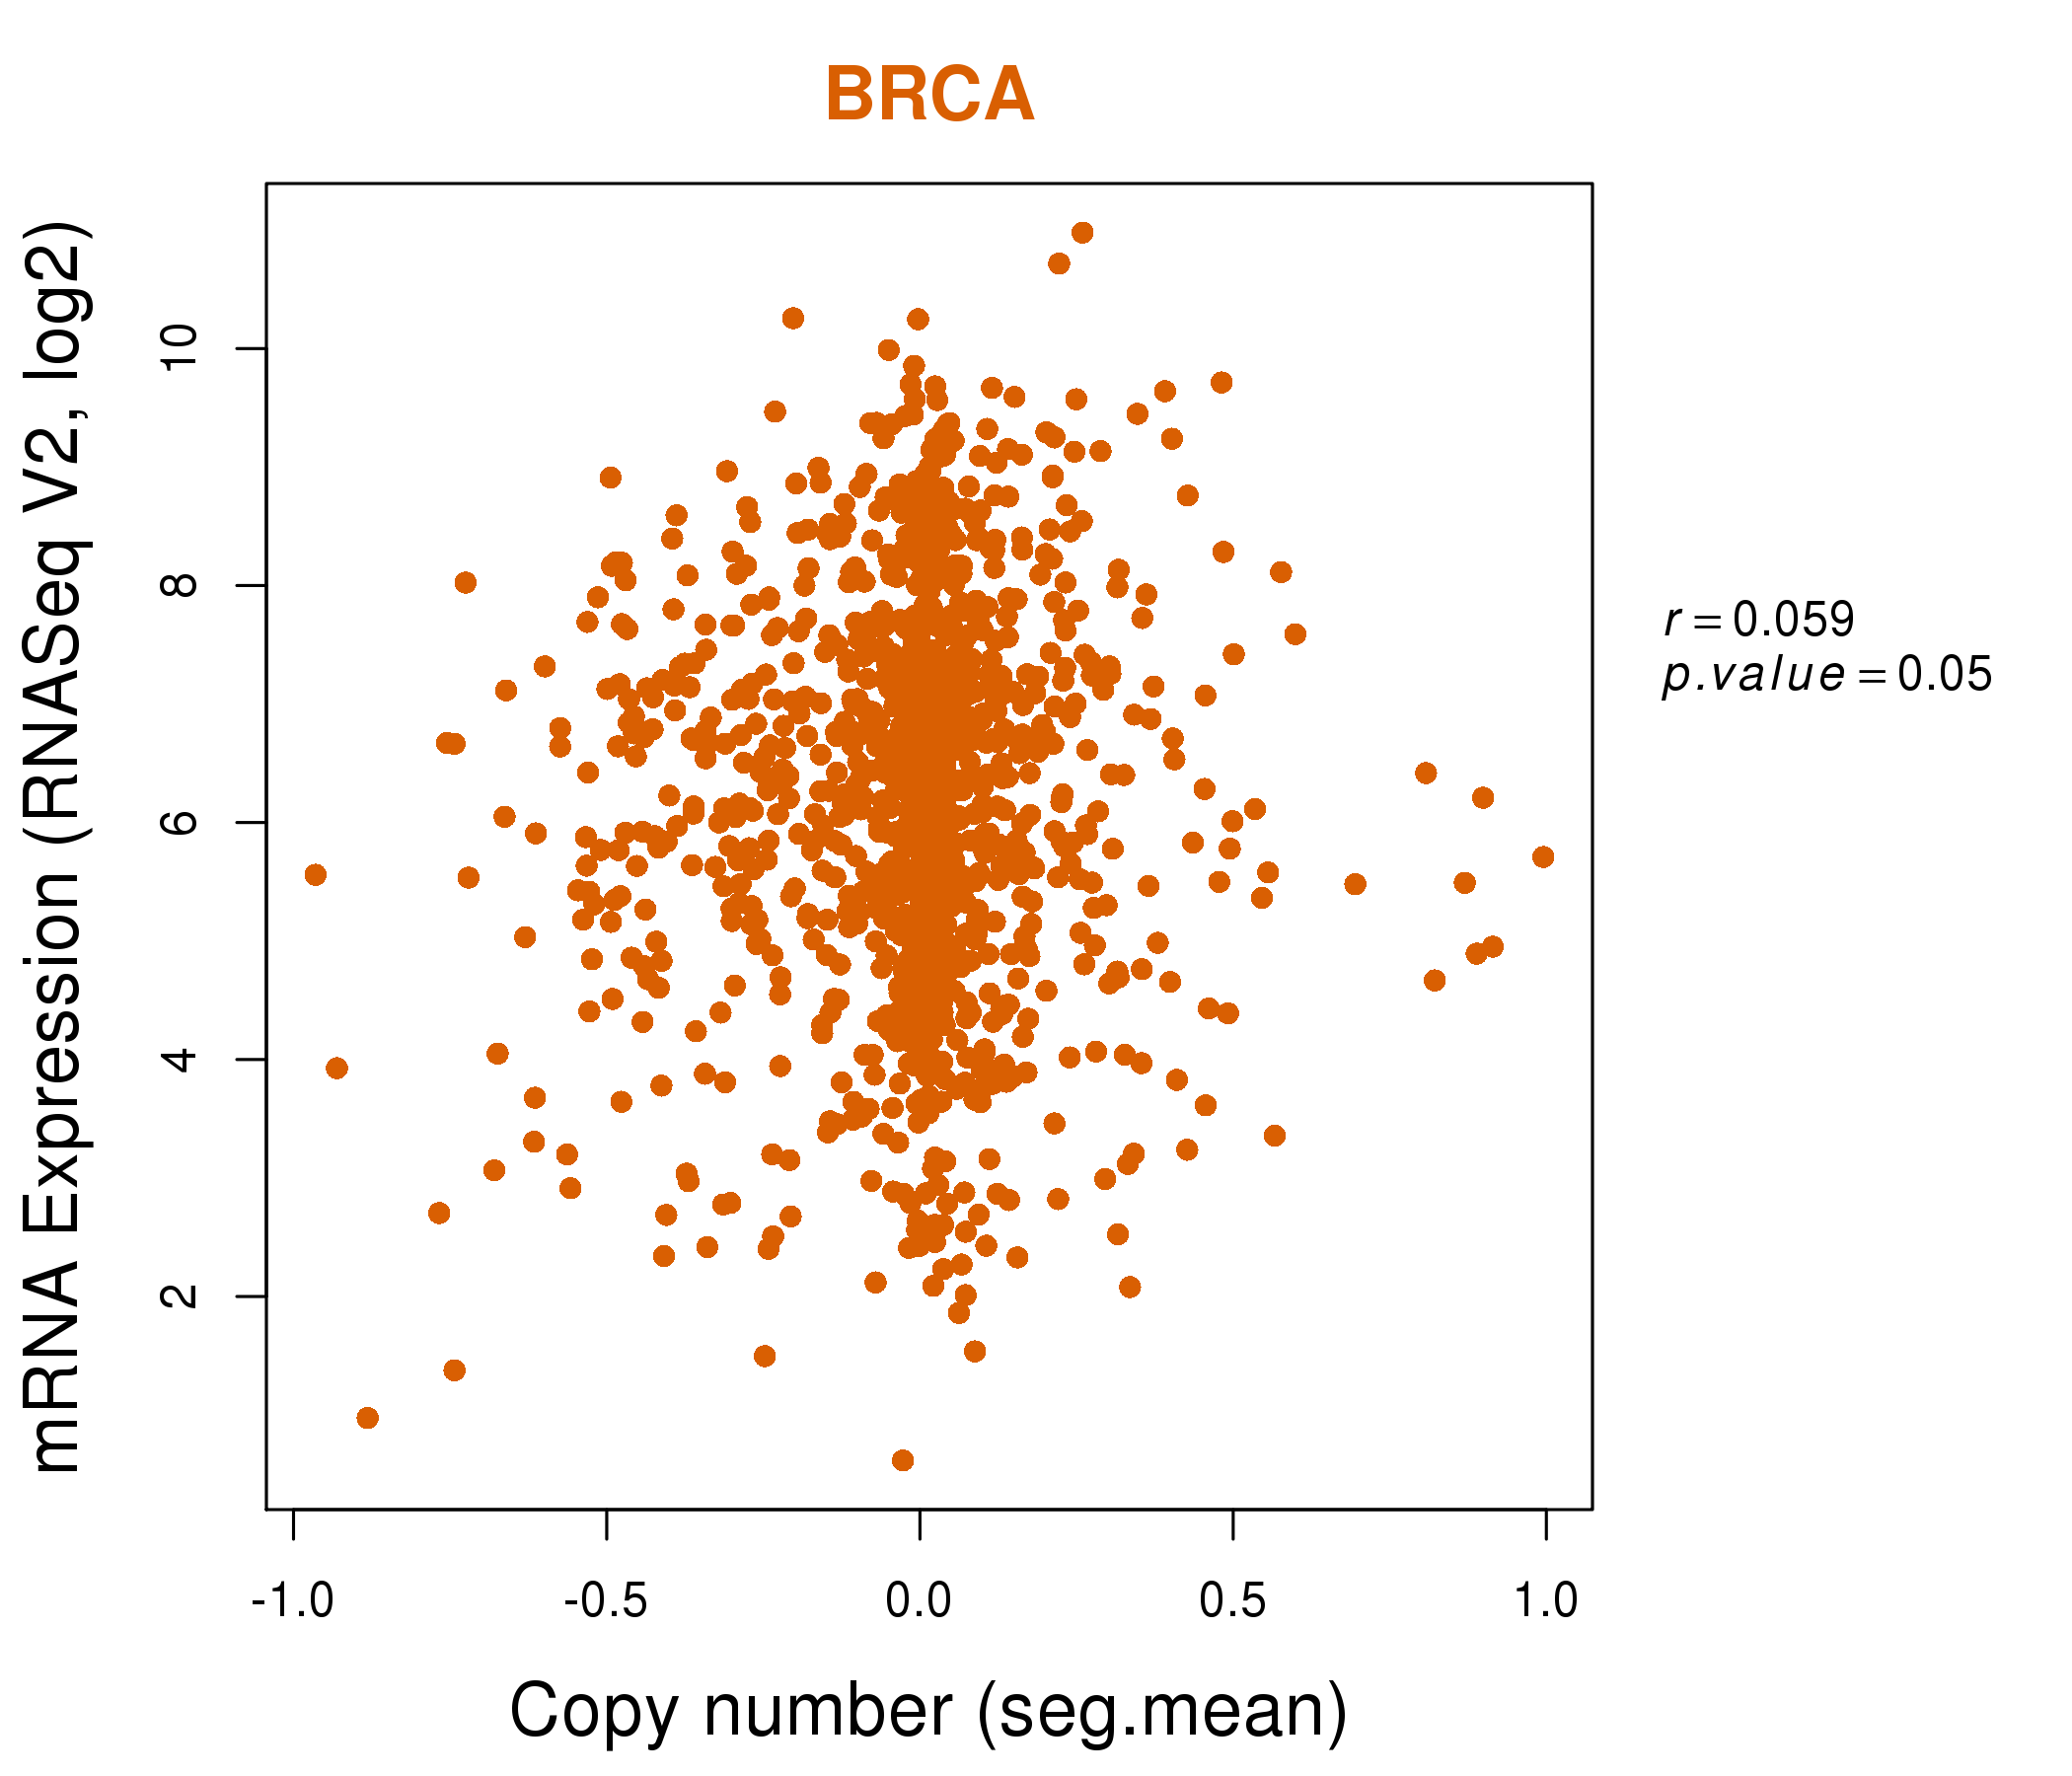
| * This plots show the correlation between CNV and gene expression. |
: Open all plots for all cancer types
 |
|
 |
|
| Top |
| Gene-Gene Network Information |
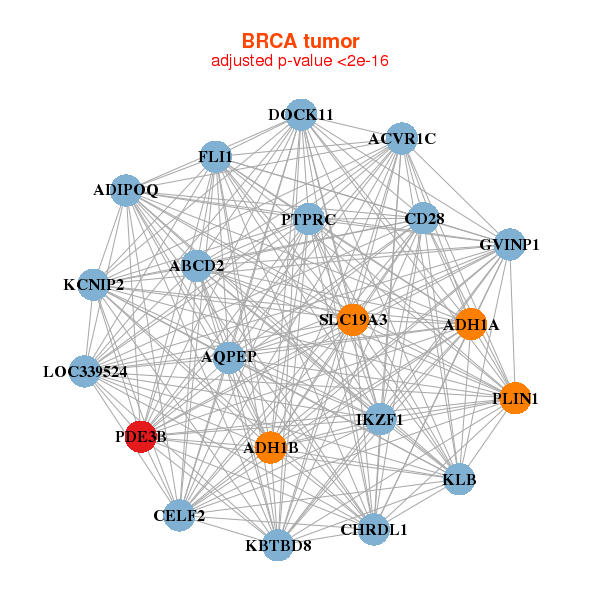
| * Co-Expression network figures were drawn using R package igraph. Only the top 20 genes with the highest correlations were shown. Red circle: input gene, orange circle: cell metabolism gene, sky circle: other gene |
: Open all plots for all cancer types
 |
| ||||
| ABCD2,ACVR1C,ADH1A,ADH1B,ADIPOQ,AQPEP,CD28, CELF2,CHRDL1,DOCK11,FLI1,GVINP1,IKZF1,KBTBD8, KCNIP2,KLB,LOC339524,PDE3B,PLIN1,PTPRC,SLC19A3 | ABCD2,ACO1,ADIPOQ,ANO6,AQPEP,CAT,GYG2, HEPACAM,HRASLS5,KCNIP2,LPL,MARC1,PDE3B,PECR, PEX19,PLIN1,PPARG,PPP2R5A,PRKAR2B,SIK2,SLC16A7 | ||||
 |
| ||||
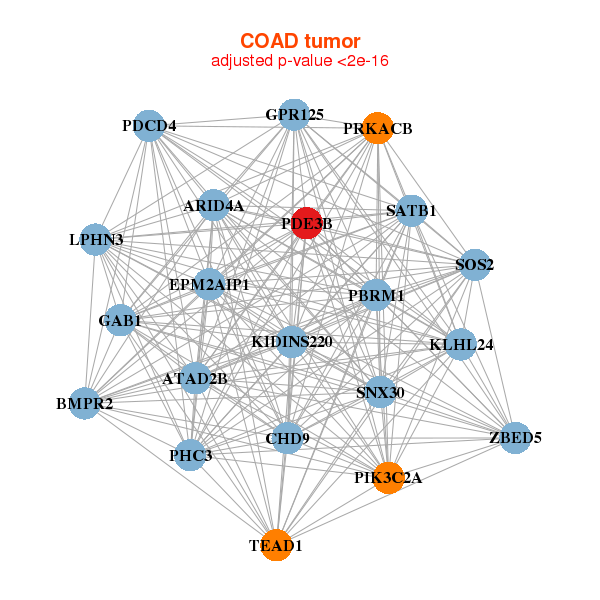
| ARID4A,ATAD2B,BMPR2,CHD9,EPM2AIP1,GAB1,GPR125, KIDINS220,KLHL24,LPHN3,PBRM1,PDCD4,PDE3B,PHC3, PIK3C2A,PRKACB,SATB1,SNX30,SOS2,TEAD1,ZBED5 | ABI2,ADARB1,VSTM4,C3orf58,CRYBG3,DCBLD2,FOXJ2, JMY,LOC92249,MTMR9,NFIA,PDE3B,PDE5A,POU3F4, PTGS1,RABGAP1,RBFOX2,RNF38,SATB1,SEMA3C,SETBP1 |
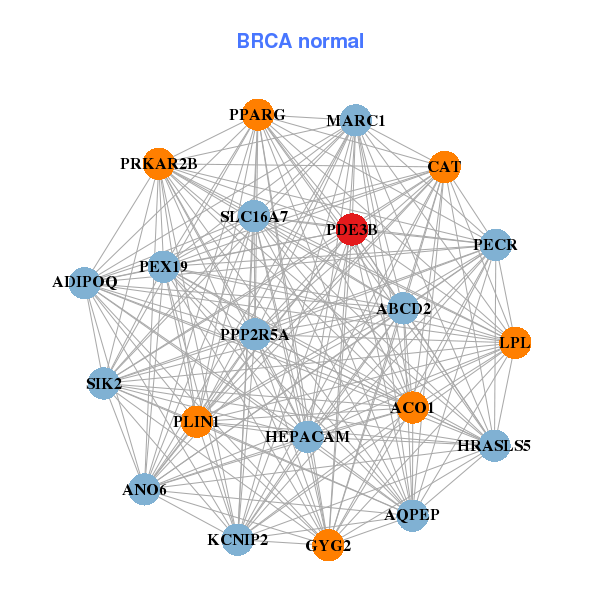
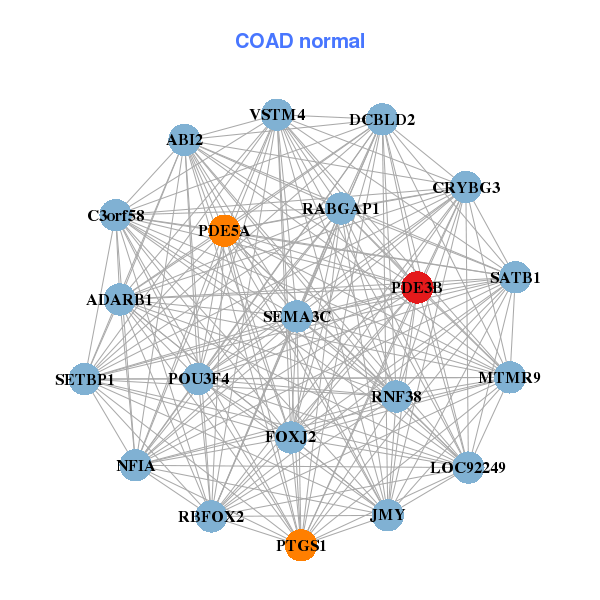
| * Co-Expression network figures were drawn using R package igraph. Only the top 20 genes with the highest correlations were shown. Red circle: input gene, orange circle: cell metabolism gene, sky circle: other gene |
: Open all plots for all cancer types
| Top |
: Open all interacting genes' information including KEGG pathway for all interacting genes from DAVID
| Top |
| Pharmacological Information for PDE3B |
| DB Category | DB Name | DB's ID and Url link |
| Chemistry | BindingDB | Q13370; -. |
| Chemistry | ChEMBL | CHEMBL2095153; -. |
| Chemistry | GuidetoPHARMACOLOGY | 1299; -. |
| Organism-specific databases | PharmGKB | PA33127; -. |
| Organism-specific databases | CTD | 5140; -. |
| * Gene Centered Interaction Network. |
 |
| * Drug Centered Interaction Network. |
| DrugBank ID | Target Name | Drug Groups | Generic Name | Drug Centered Network | Drug Structure |
| DB01640 | phosphodiesterase 3B, cGMP-inhibited | experimental | (5r)-6-(4-{[2-(3-Iodobenzyl)-3-Oxocyclohex-1-En-1-Yl]Amino}Phenyl)-5-Methyl-4,5-Dihydropyridazin-3(2h)-One | 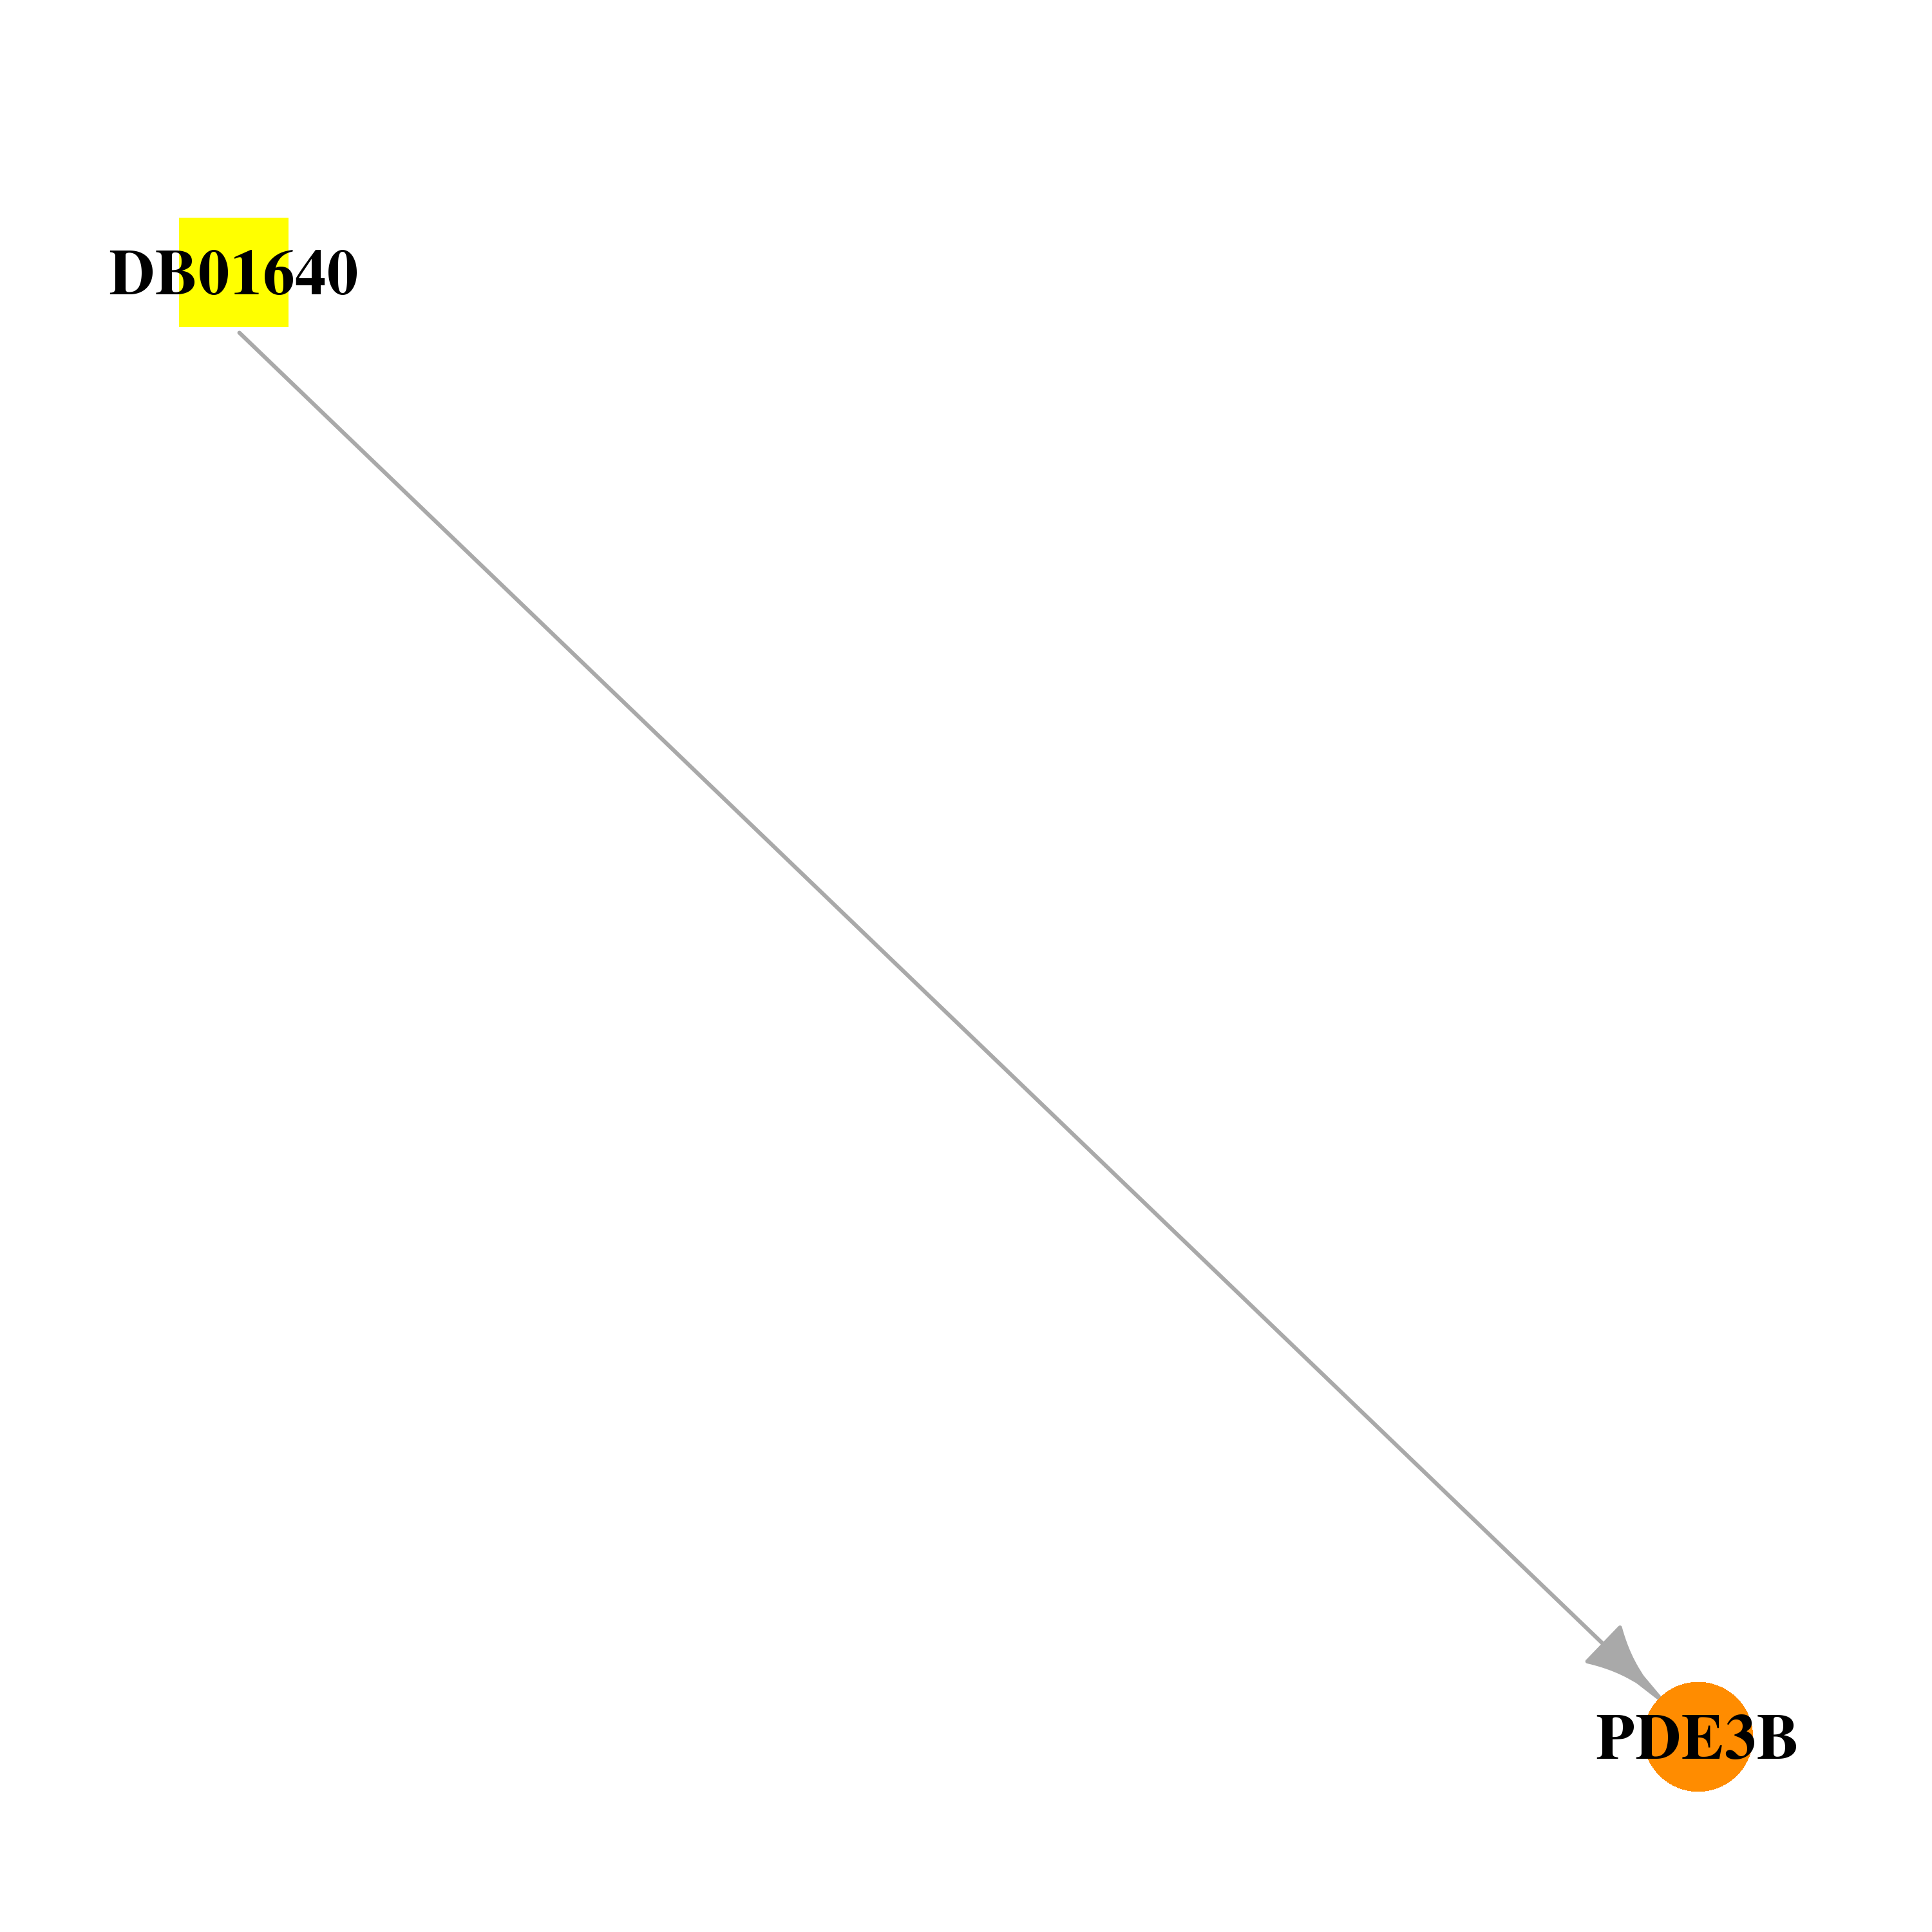 | 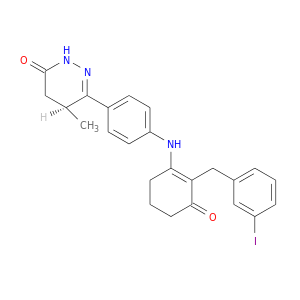 |
| DB01970 | phosphodiesterase 3B, cGMP-inhibited | experimental | Hg9a-9, Nonanoyl-N-Hydroxyethylglucamide |  |  |
| DB07954 | phosphodiesterase 3B, cGMP-inhibited | experimental | 3-ISOBUTYL-1-METHYLXANTHINE | 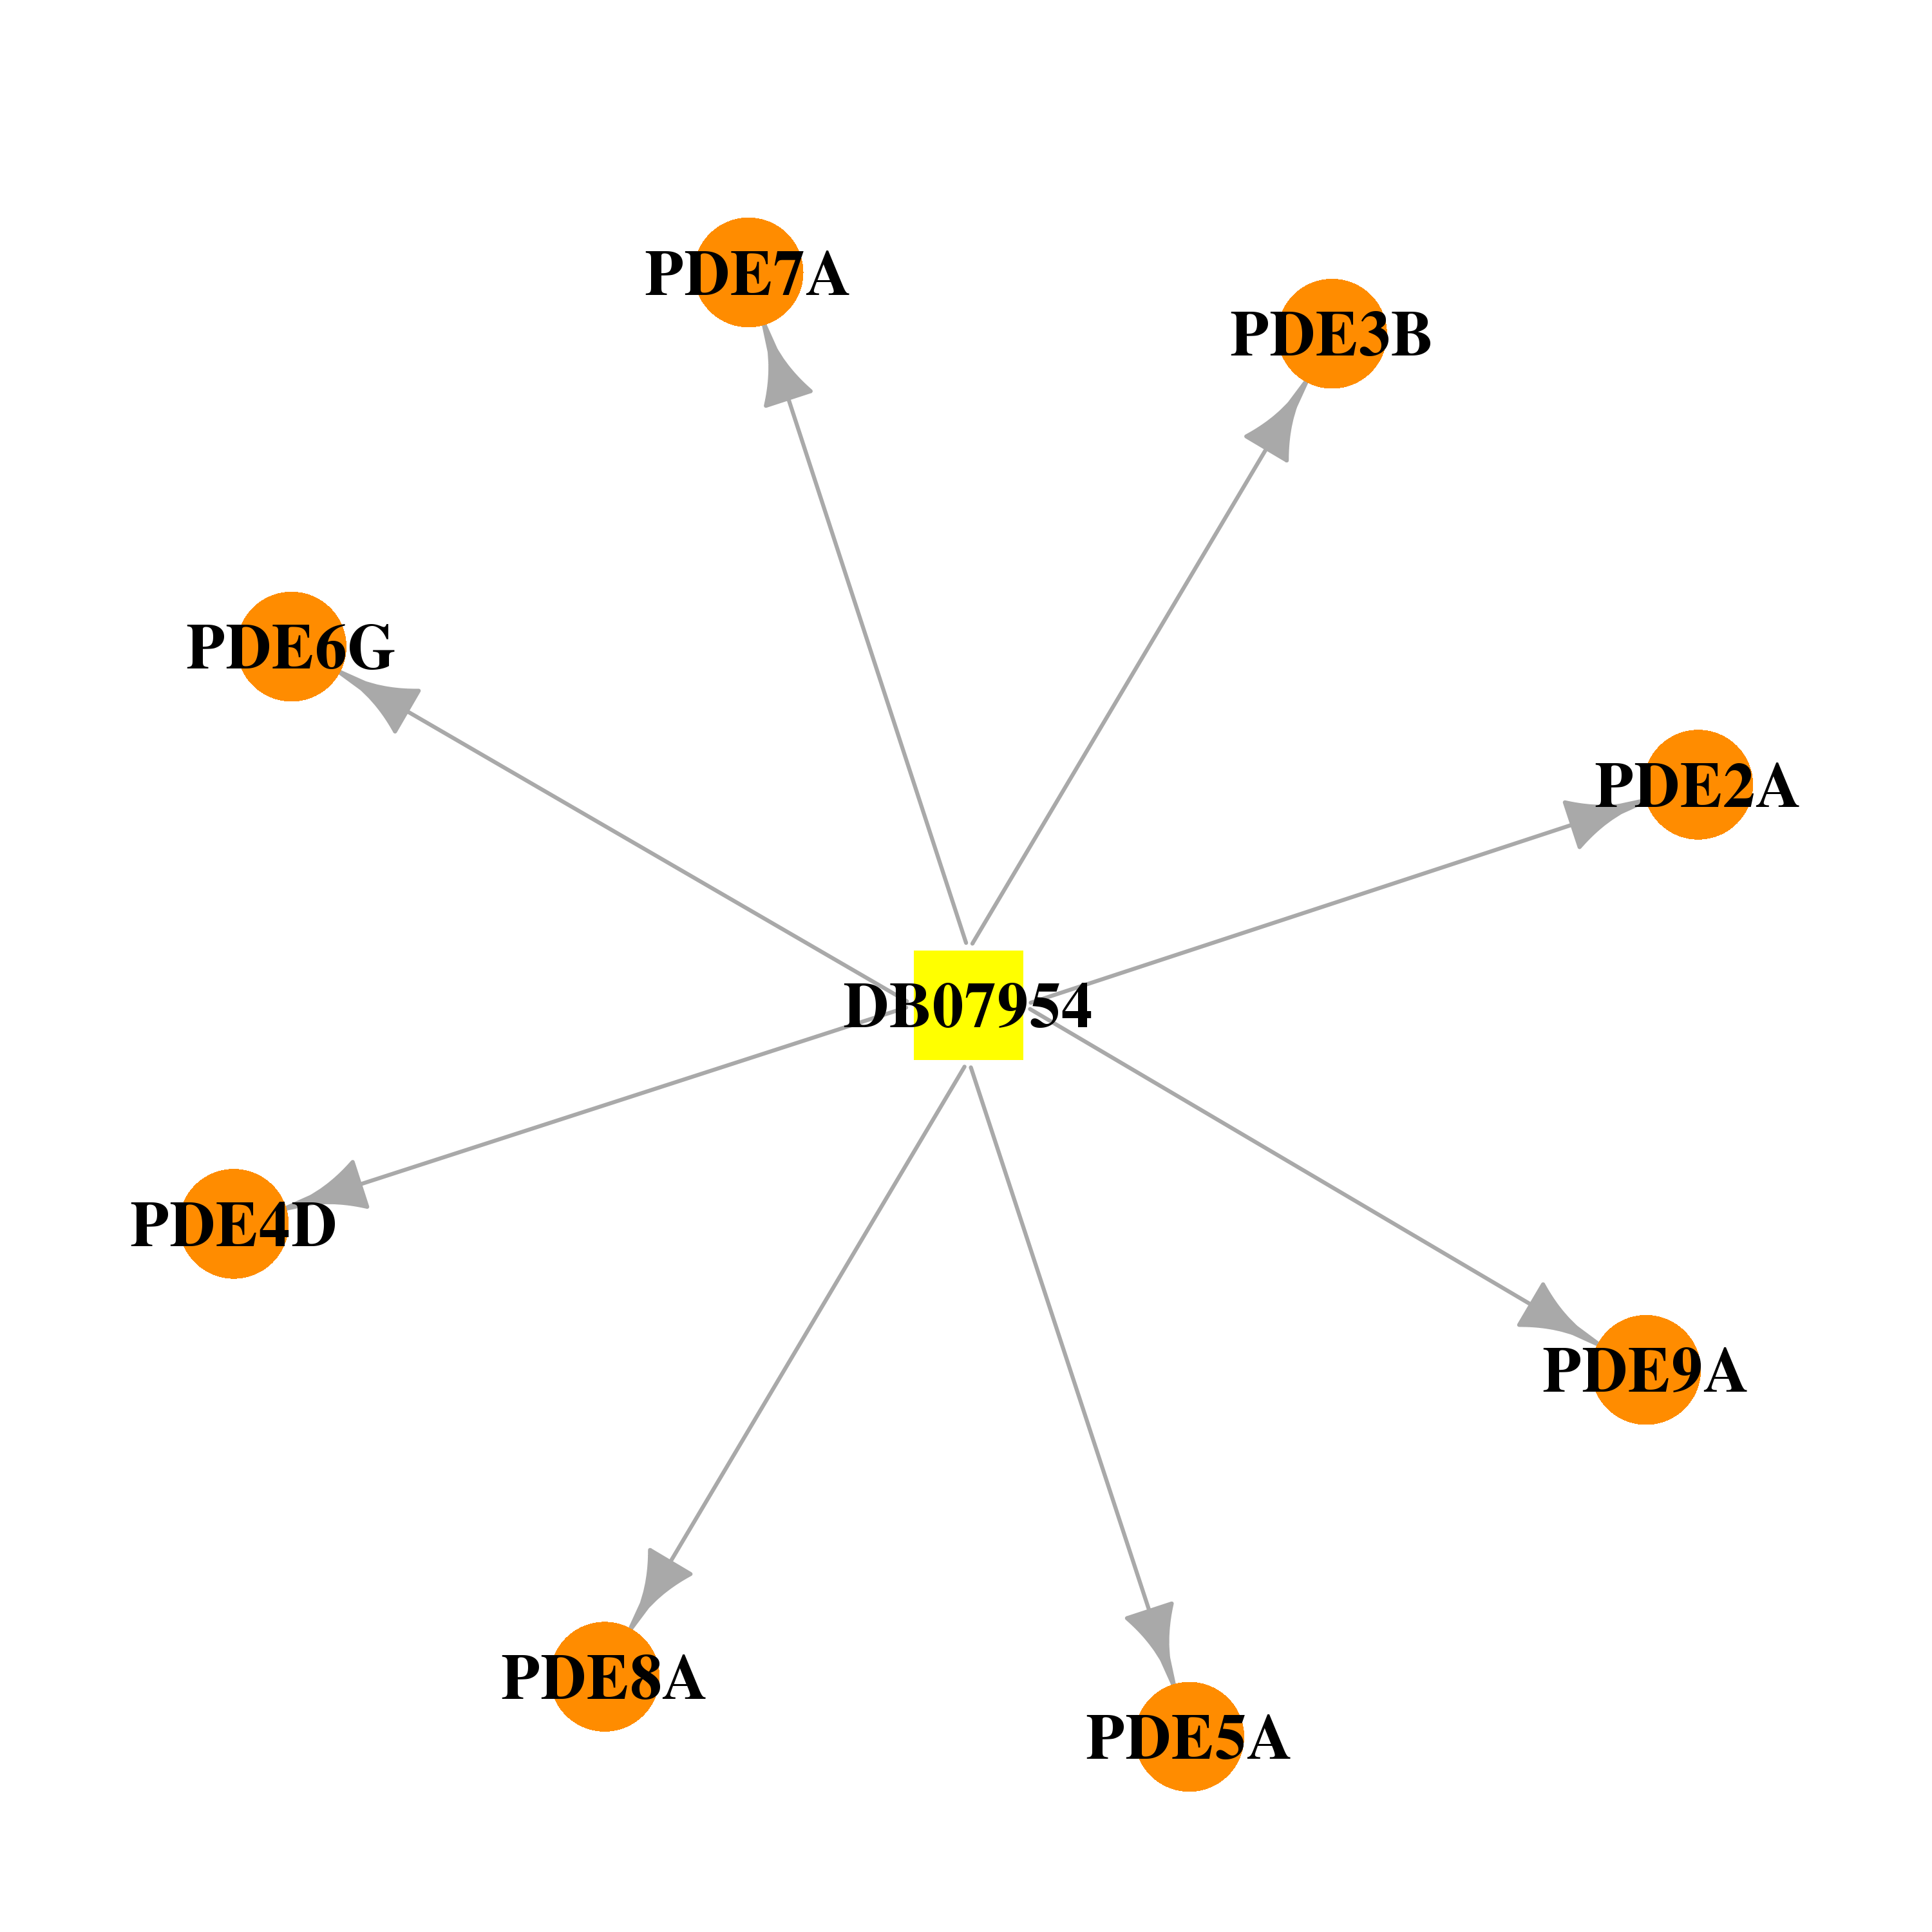 |  |
| DB00131 | phosphodiesterase 3B, cGMP-inhibited | approved; nutraceutical | Adenosine monophosphate | 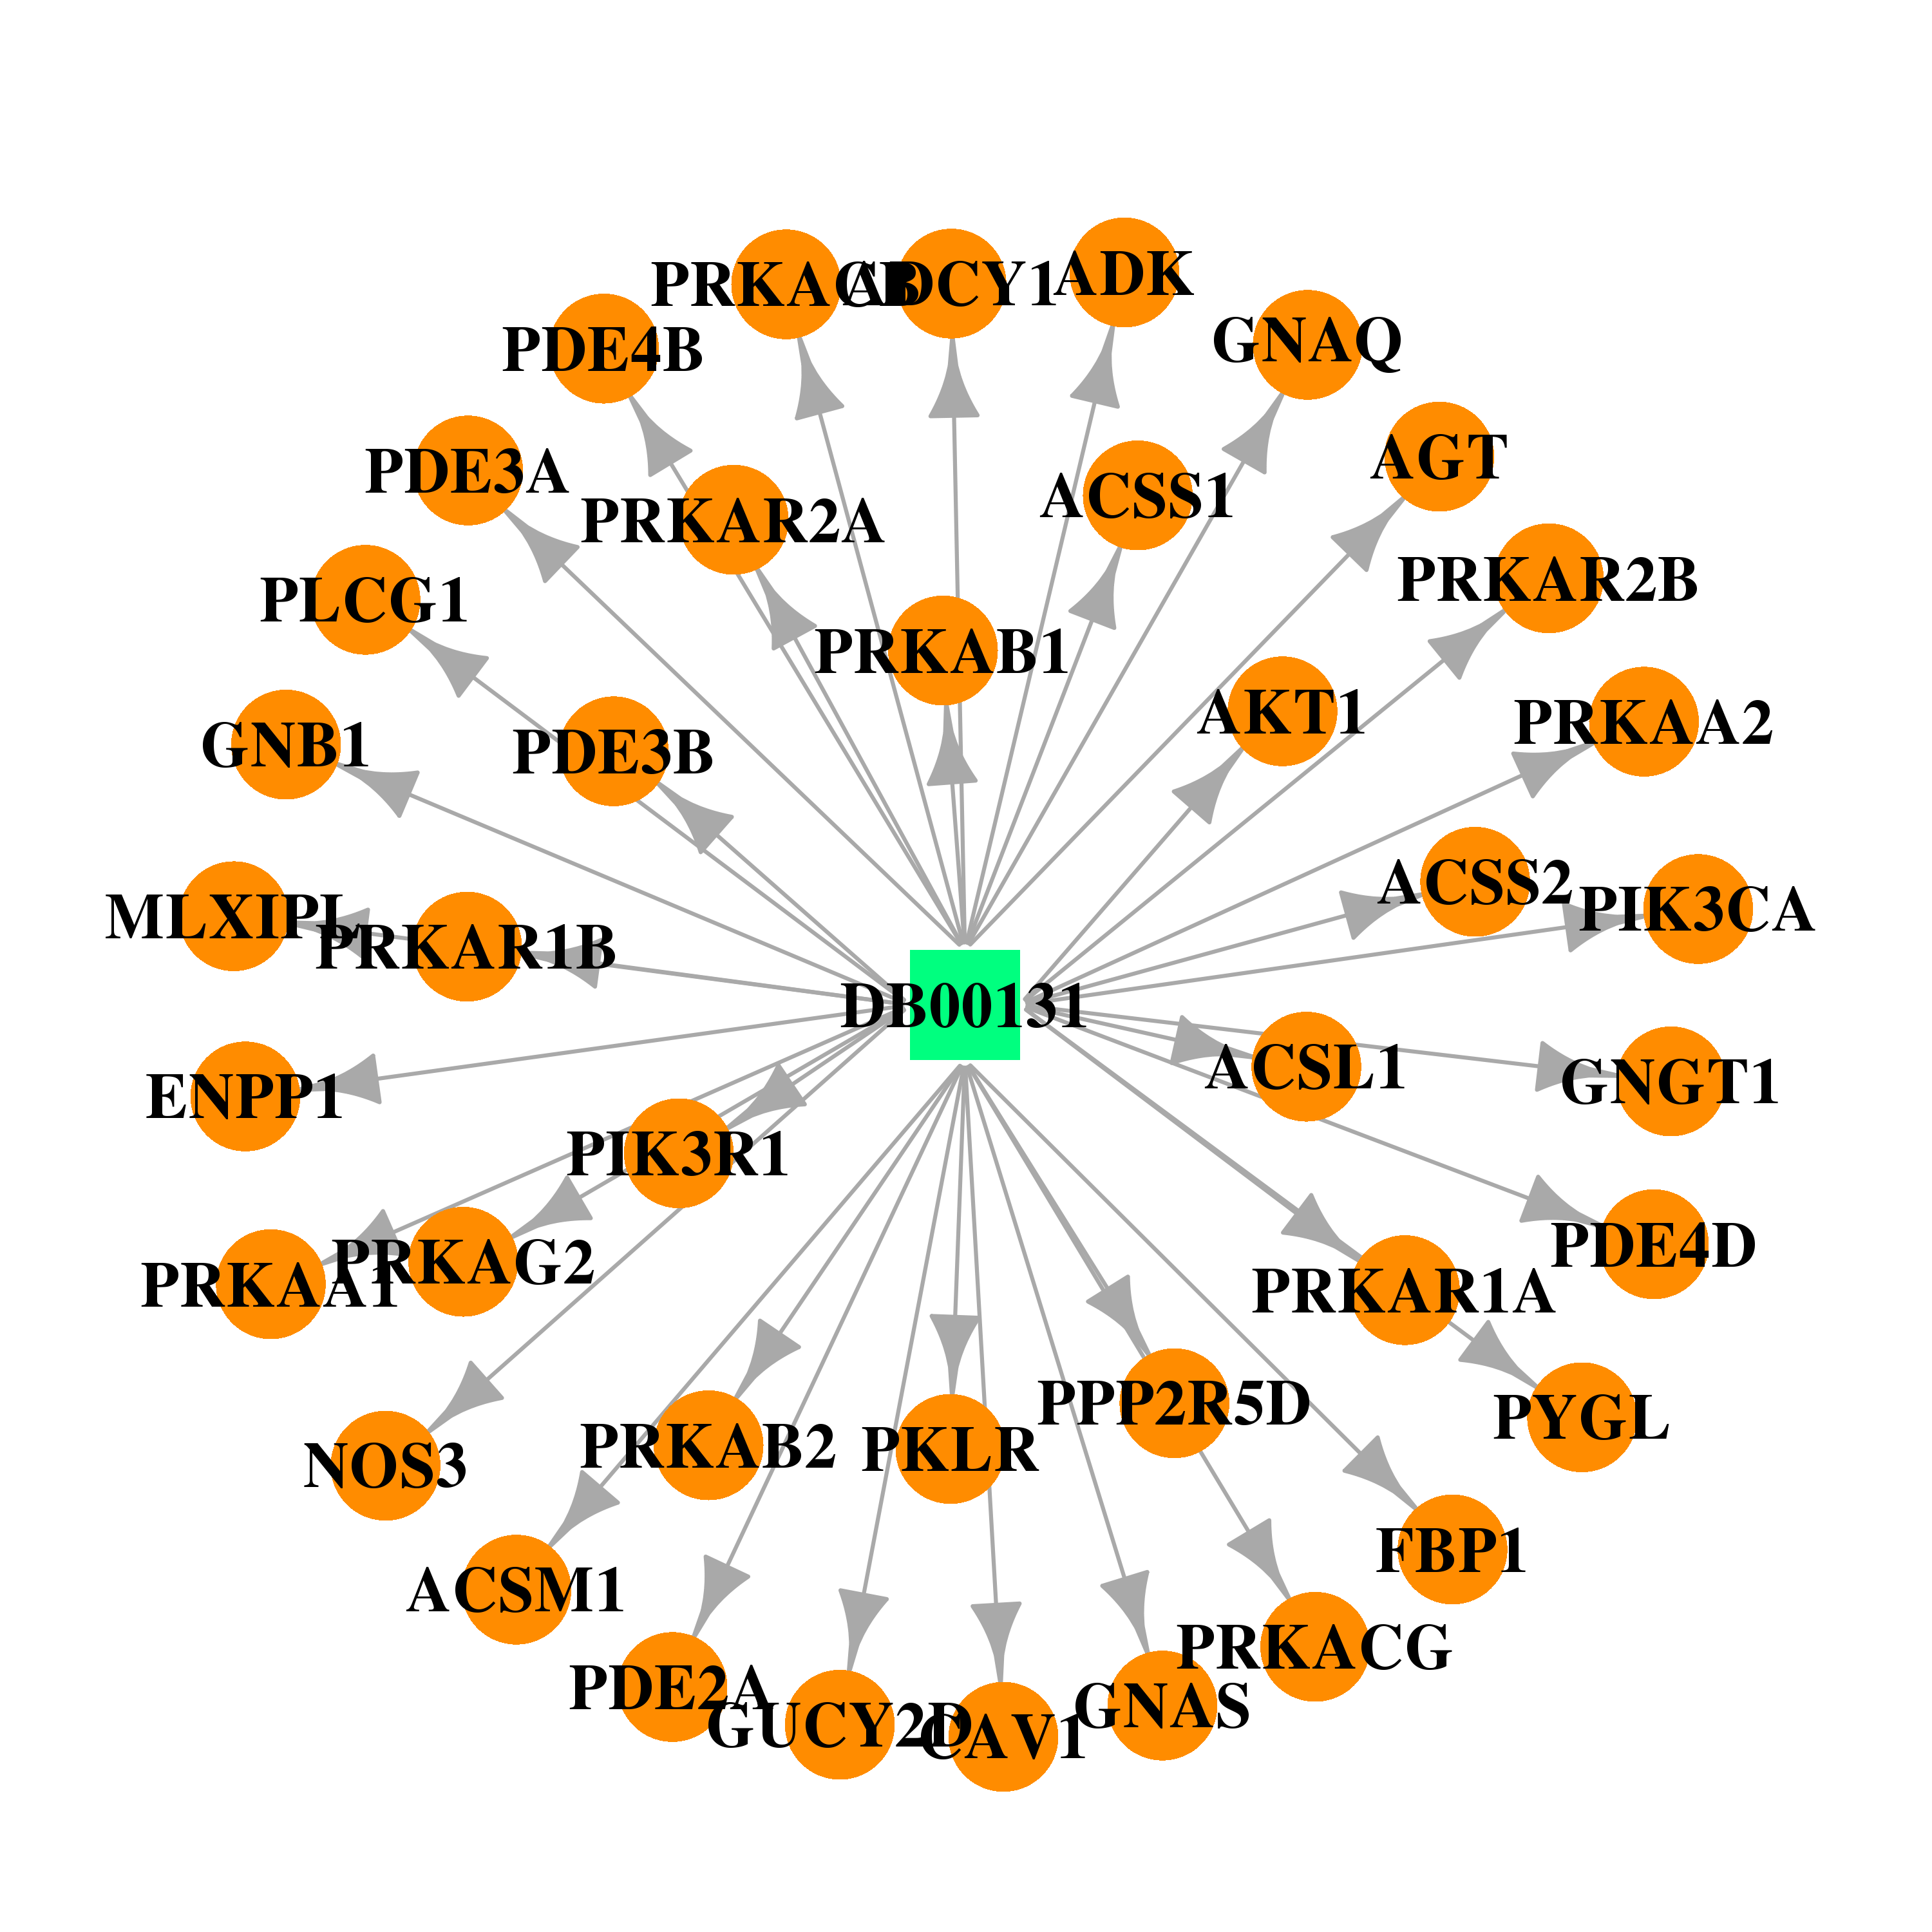 |  |
| DB00125 | phosphodiesterase 3B, cGMP-inhibited | approved; nutraceutical | L-Arginine |  |  |
| DB00155 | phosphodiesterase 3B, cGMP-inhibited | approved; nutraceutical | L-Citrulline | 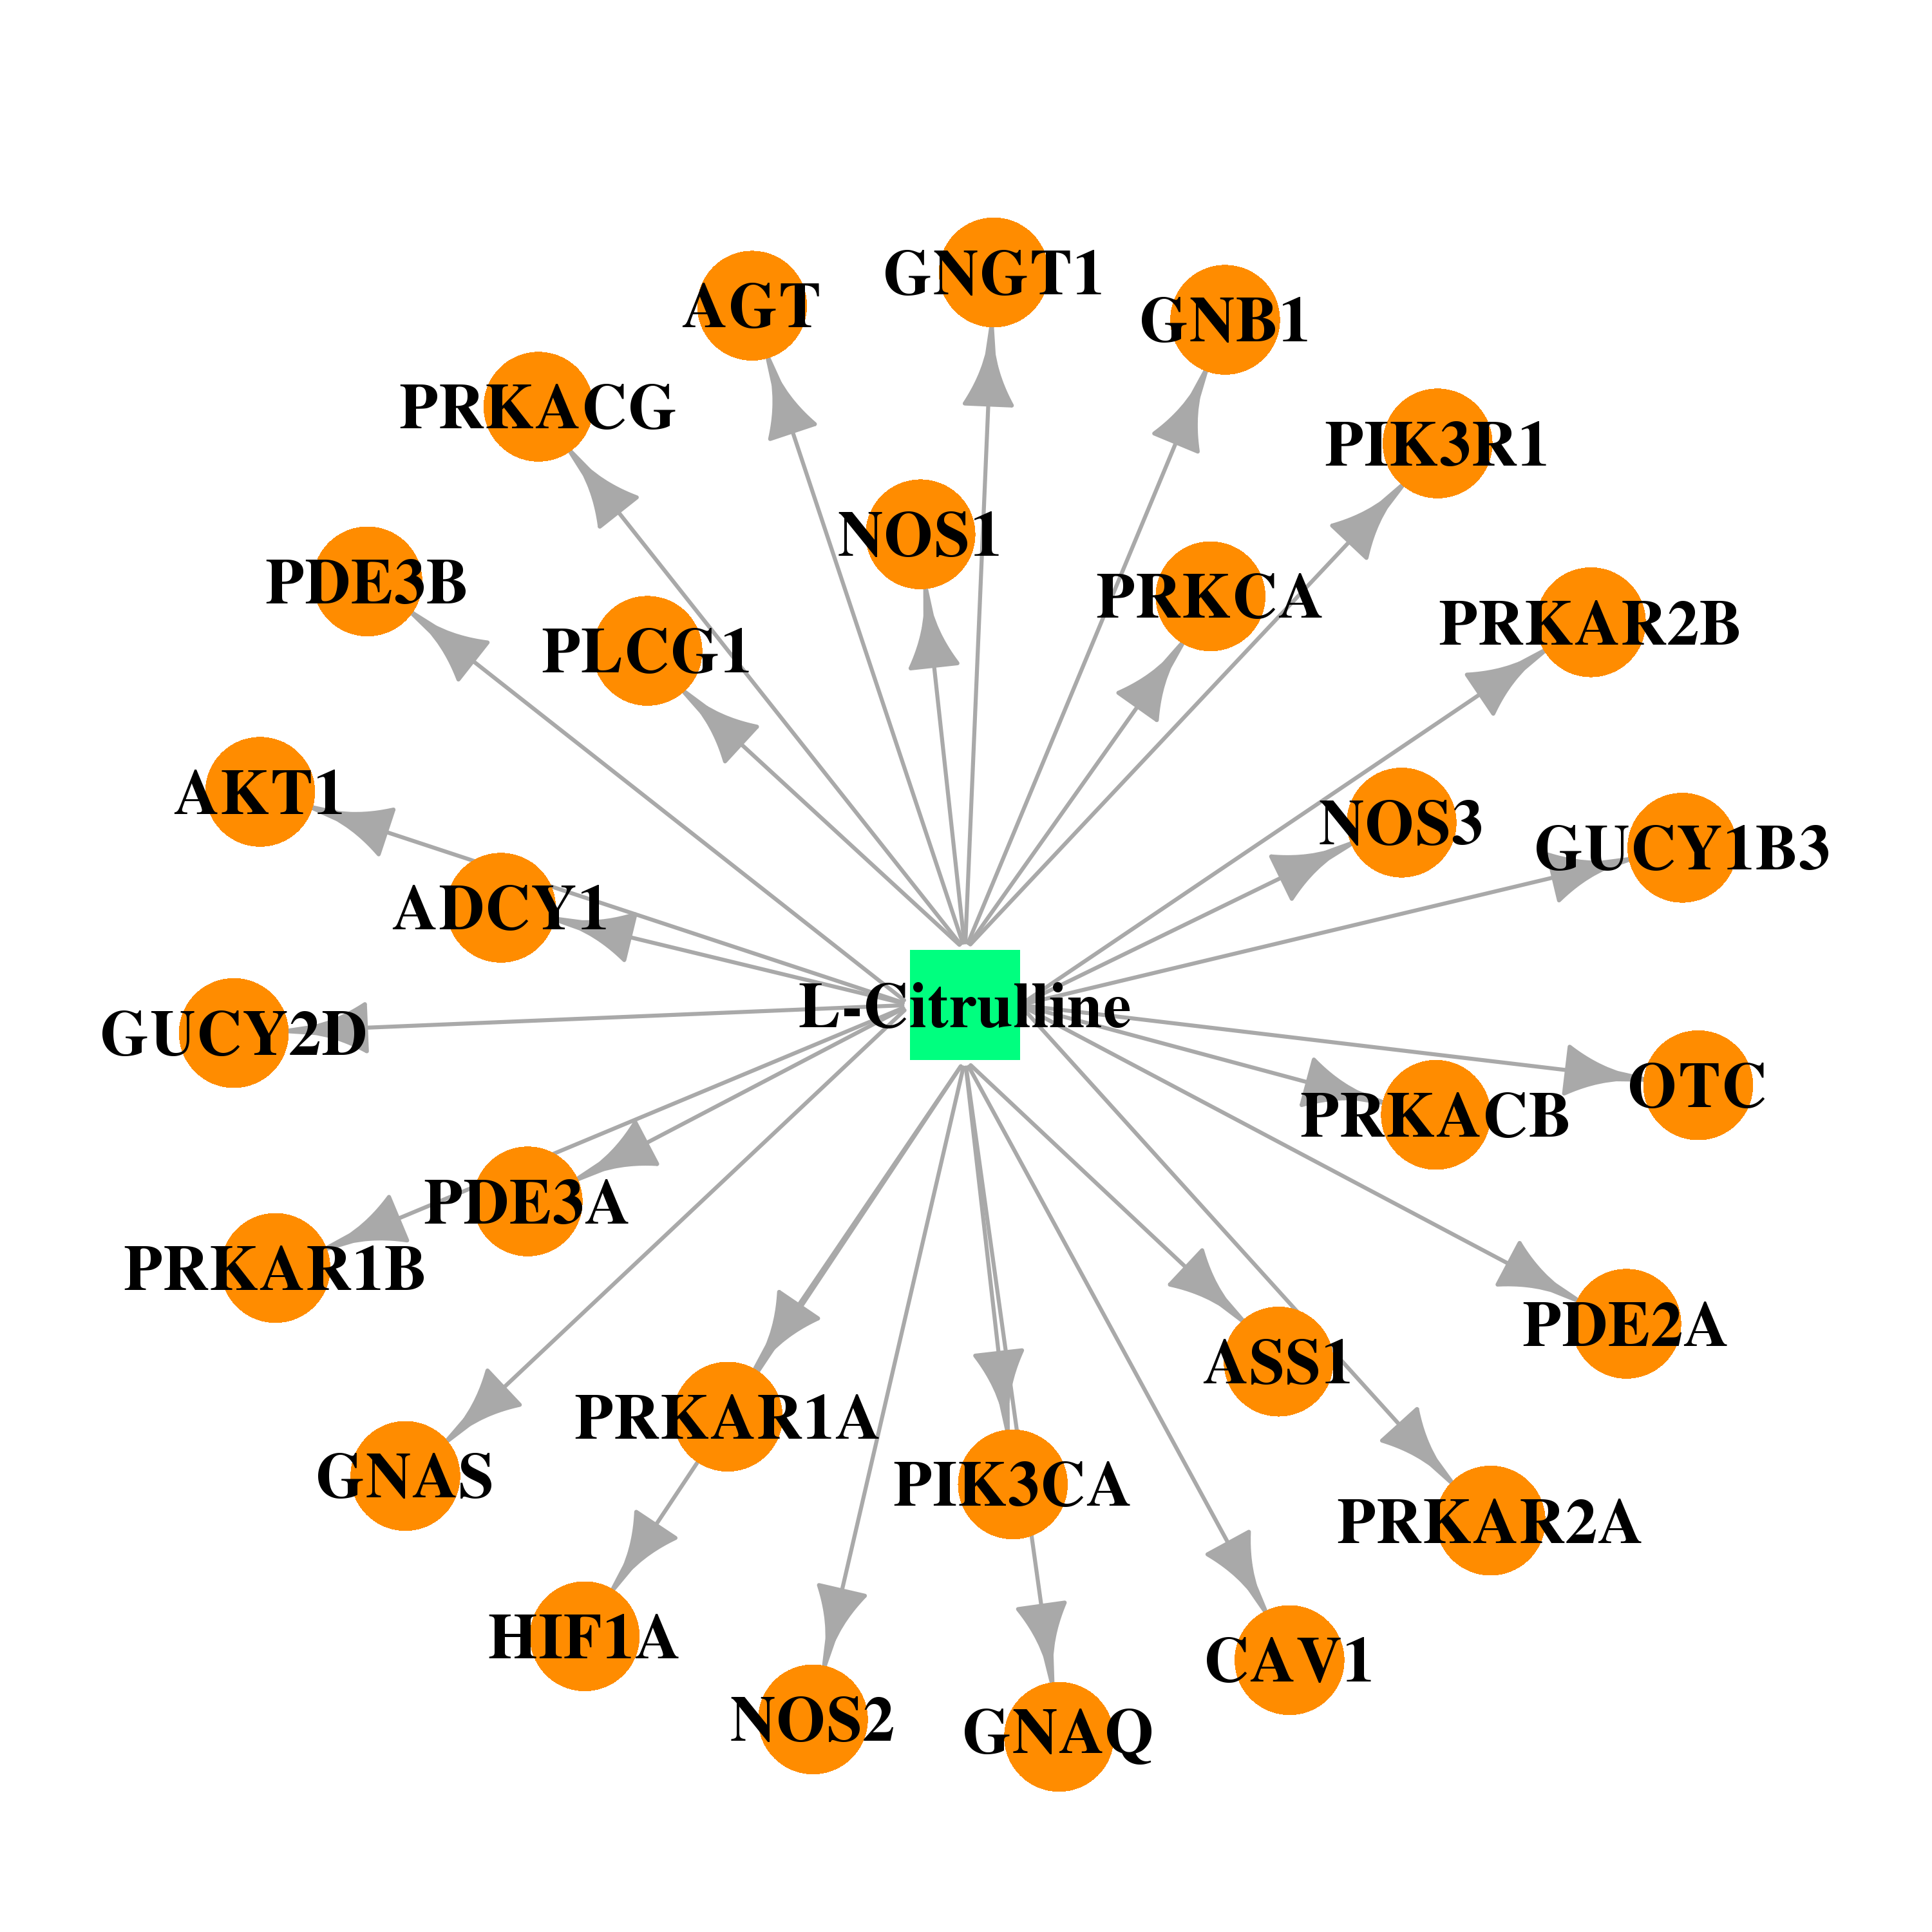 |  |
| DB00435 | phosphodiesterase 3B, cGMP-inhibited | approved | Nitric Oxide | 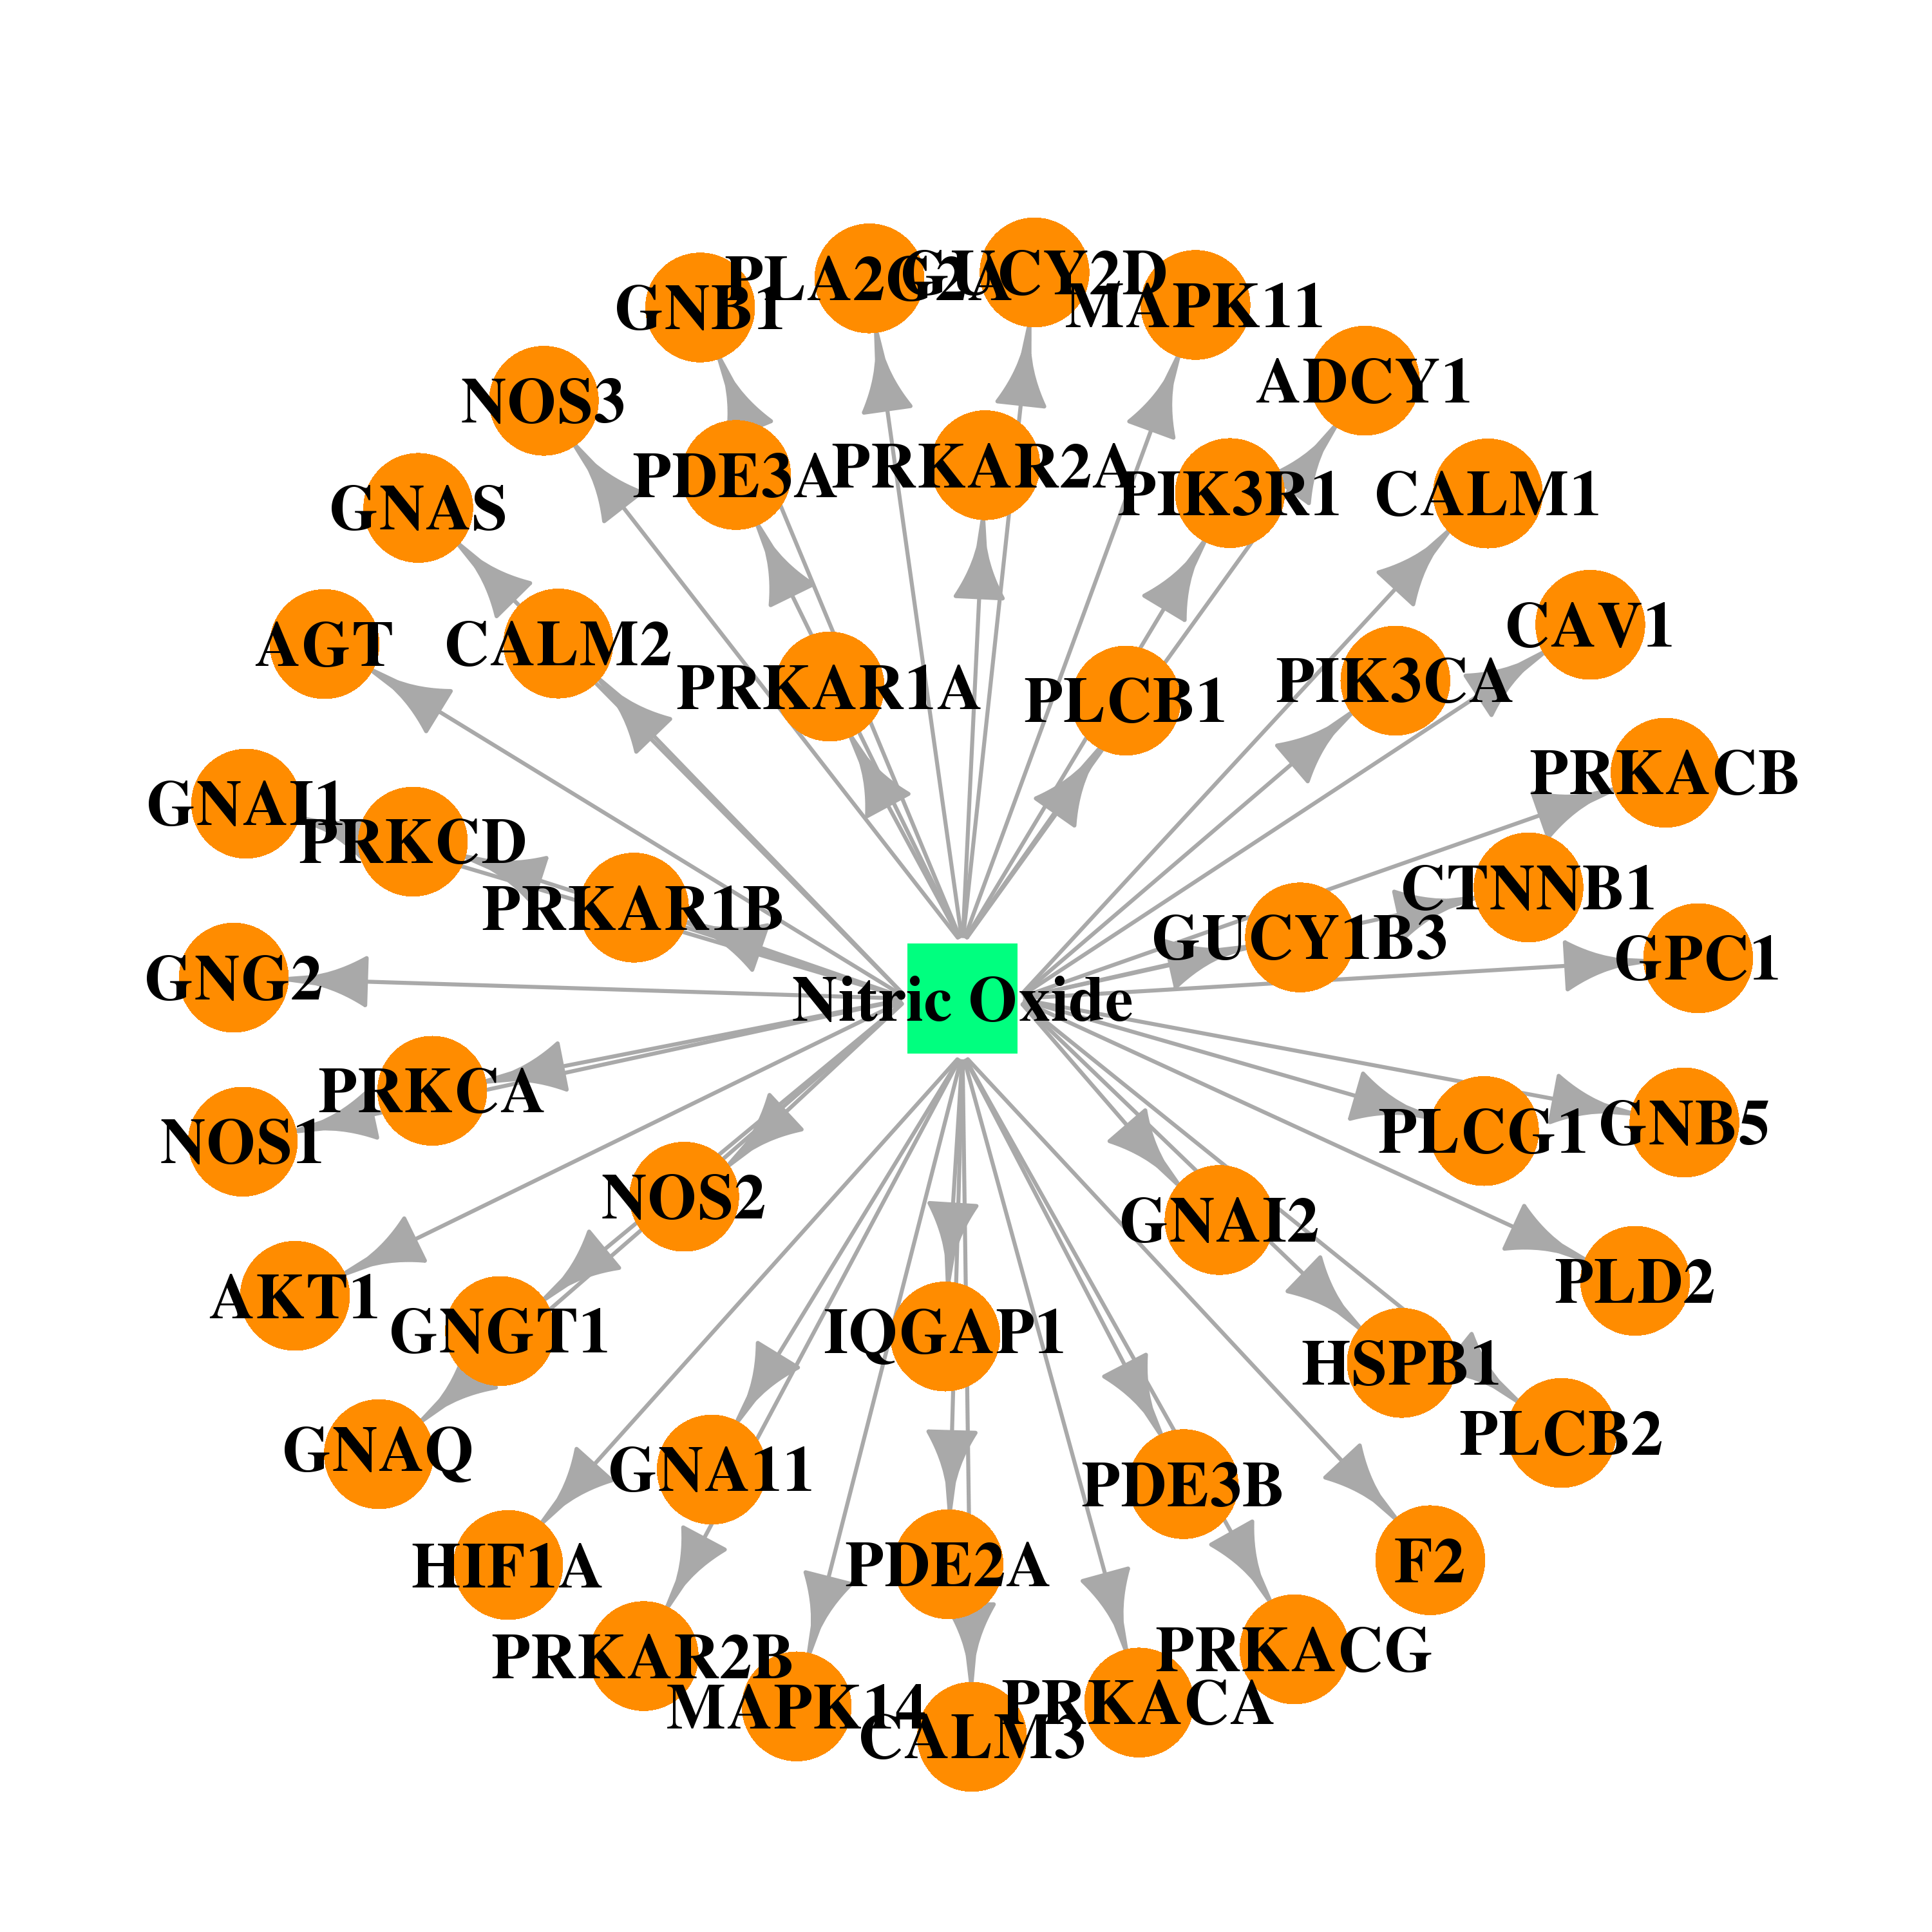 |  |
| Top |
| Cross referenced IDs for PDE3B |
| * We obtained these cross-references from Uniprot database. It covers 150 different DBs, 18 categories. http://www.uniprot.org/help/cross_references_section |
: Open all cross reference information
|
Copyright © 2016-Present - The Univsersity of Texas Health Science Center at Houston @ |