|
||||||||||||||||||||
| |
| Phenotypic Information (metabolism pathway, cancer, disease, phenome) |
| |
| |
| Gene-Gene Network Information: Co-Expression Network, Interacting Genes & KEGG |
| |
|


| Gene Summary for HEMK1 |
| Basic gene info. | Gene symbol | HEMK1 |
| Gene name | HemK methyltransferase family member 1 | |
| Synonyms | HEMK|MTQ1 | |
| Cytomap | UCSC genome browser: 3p21.3 | |
| Genomic location | chr3 :50606908-50622421 | |
| Type of gene | protein-coding | |
| RefGenes | NM_016173.3, | |
| Ensembl id | ENSG00000114735 | |
| Description | HEMK homolog 7kbhemK methyltransferase family member 1m.HsaHemKP | |
| Modification date | 20141207 | |
| dbXrefs | HGNC : HGNC | |
| Ensembl : ENSG00000114735 | ||
| HPRD : 13645 | ||
| Vega : OTTHUMG00000156849 | ||
| Protein | UniProt: go to UniProt's Cross Reference DB Table | |
| Expression | CleanEX: HS_HEMK1 | |
| BioGPS: 51409 | ||
| Gene Expression Atlas: ENSG00000114735 | ||
| The Human Protein Atlas: ENSG00000114735 | ||
| Pathway | NCI Pathway Interaction Database: HEMK1 | |
| KEGG: HEMK1 | ||
| REACTOME: HEMK1 | ||
| ConsensusPathDB | ||
| Pathway Commons: HEMK1 | ||
| Metabolism | MetaCyc: HEMK1 | |
| HUMANCyc: HEMK1 | ||
| Regulation | Ensembl's Regulation: ENSG00000114735 | |
| miRBase: chr3 :50,606,908-50,622,421 | ||
| TargetScan: NM_016173 | ||
| cisRED: ENSG00000114735 | ||
| Context | iHOP: HEMK1 | |
| cancer metabolism search in PubMed: HEMK1 | ||
| UCL Cancer Institute: HEMK1 | ||
| Assigned class in ccmGDB | C | |
| Top |
| Phenotypic Information for HEMK1(metabolism pathway, cancer, disease, phenome) |
| Cancer | CGAP: HEMK1 |
| Familial Cancer Database: HEMK1 | |
| * This gene is included in those cancer gene databases. |
|
|
|
|
|
| . | ||||||||||||||
Oncogene 1 | Significant driver gene in | |||||||||||||||||||
| cf) number; DB name 1 Oncogene; http://nar.oxfordjournals.org/content/35/suppl_1/D721.long, 2 Tumor Suppressor gene; https://bioinfo.uth.edu/TSGene/, 3 Cancer Gene Census; http://www.nature.com/nrc/journal/v4/n3/abs/nrc1299.html, 4 CancerGenes; http://nar.oxfordjournals.org/content/35/suppl_1/D721.long, 5 Network of Cancer Gene; http://ncg.kcl.ac.uk/index.php, 1Therapeutic Vulnerabilities in Cancer; http://cbio.mskcc.org/cancergenomics/statius/ |
| KEGG_HISTIDINE_METABOLISM KEGG_TYROSINE_METABOLISM KEGG_SELENOAMINO_ACID_METABOLISM | |
| OMIM | |
| Orphanet | |
| Disease | KEGG Disease: HEMK1 |
| MedGen: HEMK1 (Human Medical Genetics with Condition) | |
| ClinVar: HEMK1 | |
| Phenotype | MGI: HEMK1 (International Mouse Phenotyping Consortium) |
| PhenomicDB: HEMK1 | |
| Mutations for HEMK1 |
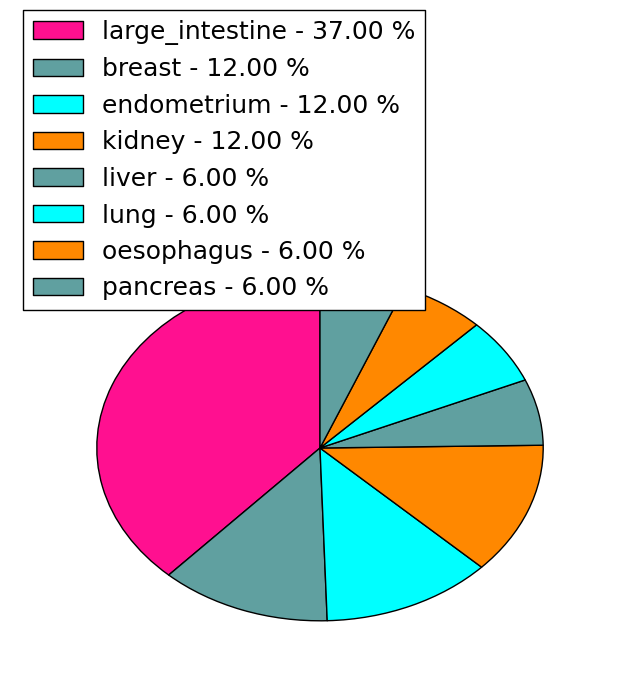
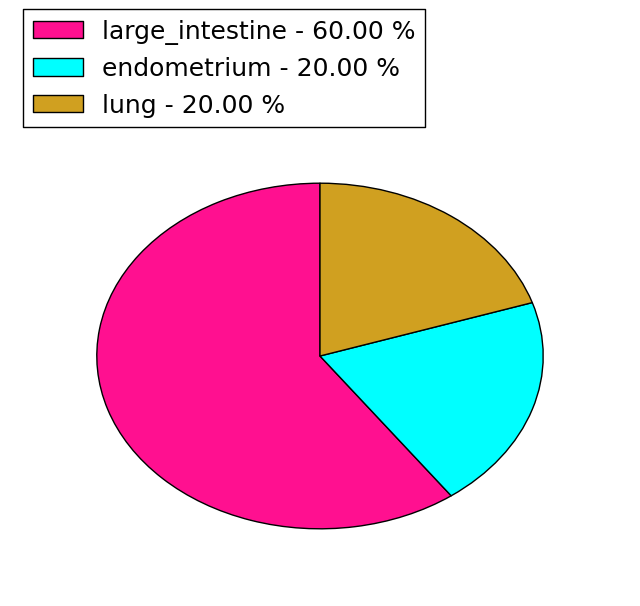
| * Under tables are showing count per each tissue to give us broad intuition about tissue specific mutation patterns.You can go to the detailed page for each mutation database's web site. |
| There's no structural variation information in COSMIC data for this gene. |
| * From mRNA Sanger sequences, Chitars2.0 arranged chimeric transcripts. This table shows HEMK1 related fusion information. |
| ID | Head Gene | Tail Gene | Accession | Gene_a | qStart_a | qEnd_a | Chromosome_a | tStart_a | tEnd_a | Gene_a | qStart_a | qEnd_a | Chromosome_a | tStart_a | tEnd_a |
| Top |
| There's no copy number variation information in COSMIC data for this gene. |
| Top |
|
 |
| Top |
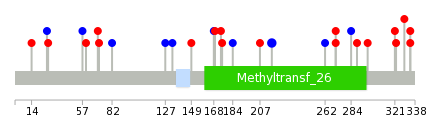
| Stat. for Non-Synonymous SNVs (# total SNVs=16) | (# total SNVs=5) |
 |  |
(# total SNVs=0) | (# total SNVs=0) |
| Top |
| * When you move the cursor on each content, you can see more deailed mutation information on the Tooltip. Those are primary_site,primary_histology,mutation(aa),pubmedID. |
| GRCh37 position | Mutation(aa) | Unique sampleID count |
| chr3:50615293-50615293 | p.L217L | 2 |
| chr3:50617315-50617315 | p.M271V | 2 |
| chr3:50617356-50617356 | p.L284L | 1 |
| chr3:50608616-50608616 | p.S27S | 1 |
| chr3:50614572-50614572 | p.C168C | 1 |
| chr3:50617370-50617370 | p.G289A | 1 |
| chr3:50608618-50608618 | p.S28L | 1 |
| chr3:50614573-50614573 | p.G169R | 1 |
| chr3:50617573-50617573 | p.R298M | 1 |
| chr3:50608706-50608706 | p.I57I | 1 |
| Top |
|
 |
| Point Mutation/ Tissue ID | 1 | 2 | 3 | 4 | 5 | 6 | 7 | 8 | 9 | 10 | 11 | 12 | 13 | 14 | 15 | 16 | 17 | 18 | 19 | 20 |
| # sample | 1 | 2 | 1 | 1 | 4 | 3 | 3 | |||||||||||||
| # mutation | 1 | 2 | 1 | 1 | 4 | 3 | 3 | |||||||||||||
| nonsynonymous SNV | 1 | 1 | 1 | 3 | 1 | 2 | ||||||||||||||
| synonymous SNV | 1 | 1 | 1 | 2 | 1 |
| cf) Tissue ID; Tissue type (1; BLCA[Bladder Urothelial Carcinoma], 2; BRCA[Breast invasive carcinoma], 3; CESC[Cervical squamous cell carcinoma and endocervical adenocarcinoma], 4; COAD[Colon adenocarcinoma], 5; GBM[Glioblastoma multiforme], 6; Glioma Low Grade, 7; HNSC[Head and Neck squamous cell carcinoma], 8; KICH[Kidney Chromophobe], 9; KIRC[Kidney renal clear cell carcinoma], 10; KIRP[Kidney renal papillary cell carcinoma], 11; LAML[Acute Myeloid Leukemia], 12; LUAD[Lung adenocarcinoma], 13; LUSC[Lung squamous cell carcinoma], 14; OV[Ovarian serous cystadenocarcinoma ], 15; PAAD[Pancreatic adenocarcinoma], 16; PRAD[Prostate adenocarcinoma], 17; SKCM[Skin Cutaneous Melanoma], 18:STAD[Stomach adenocarcinoma], 19:THCA[Thyroid carcinoma], 20:UCEC[Uterine Corpus Endometrial Carcinoma]) |
| Top |
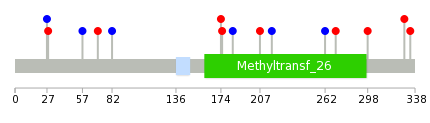
| * We represented just top 10 SNVs. When you move the cursor on each content, you can see more deailed mutation information on the Tooltip. Those are primary_site, primary_histology, mutation(aa), pubmedID. |
| Genomic Position | Mutation(aa) | Unique sampleID count |
| chr3:50608618 | p.H70Y | 1 |
| chr3:50617573 | p.P82P | 1 |
| chr3:50608706 | p.S174F | 1 |
| chr3:50617817 | p.L175F | 1 |
| chr3:50608743 | p.S184S | 1 |
| chr3:50617831 | p.R207W | 1 |
| chr3:50609158 | p.L217L | 1 |
| chr3:50614589 | p.A262A | 1 |
| chr3:50614591 | p.M271V | 1 |
| chr3:50614942 | p.R298M | 1 |
| * Copy number data were extracted from TCGA using R package TCGA-Assembler. The URLs of all public data files on TCGA DCC data server were gathered on Jan-05-2015. Function ProcessCNAData in TCGA-Assembler package was used to obtain gene-level copy number value which is calculated as the average copy number of the genomic region of a gene. |
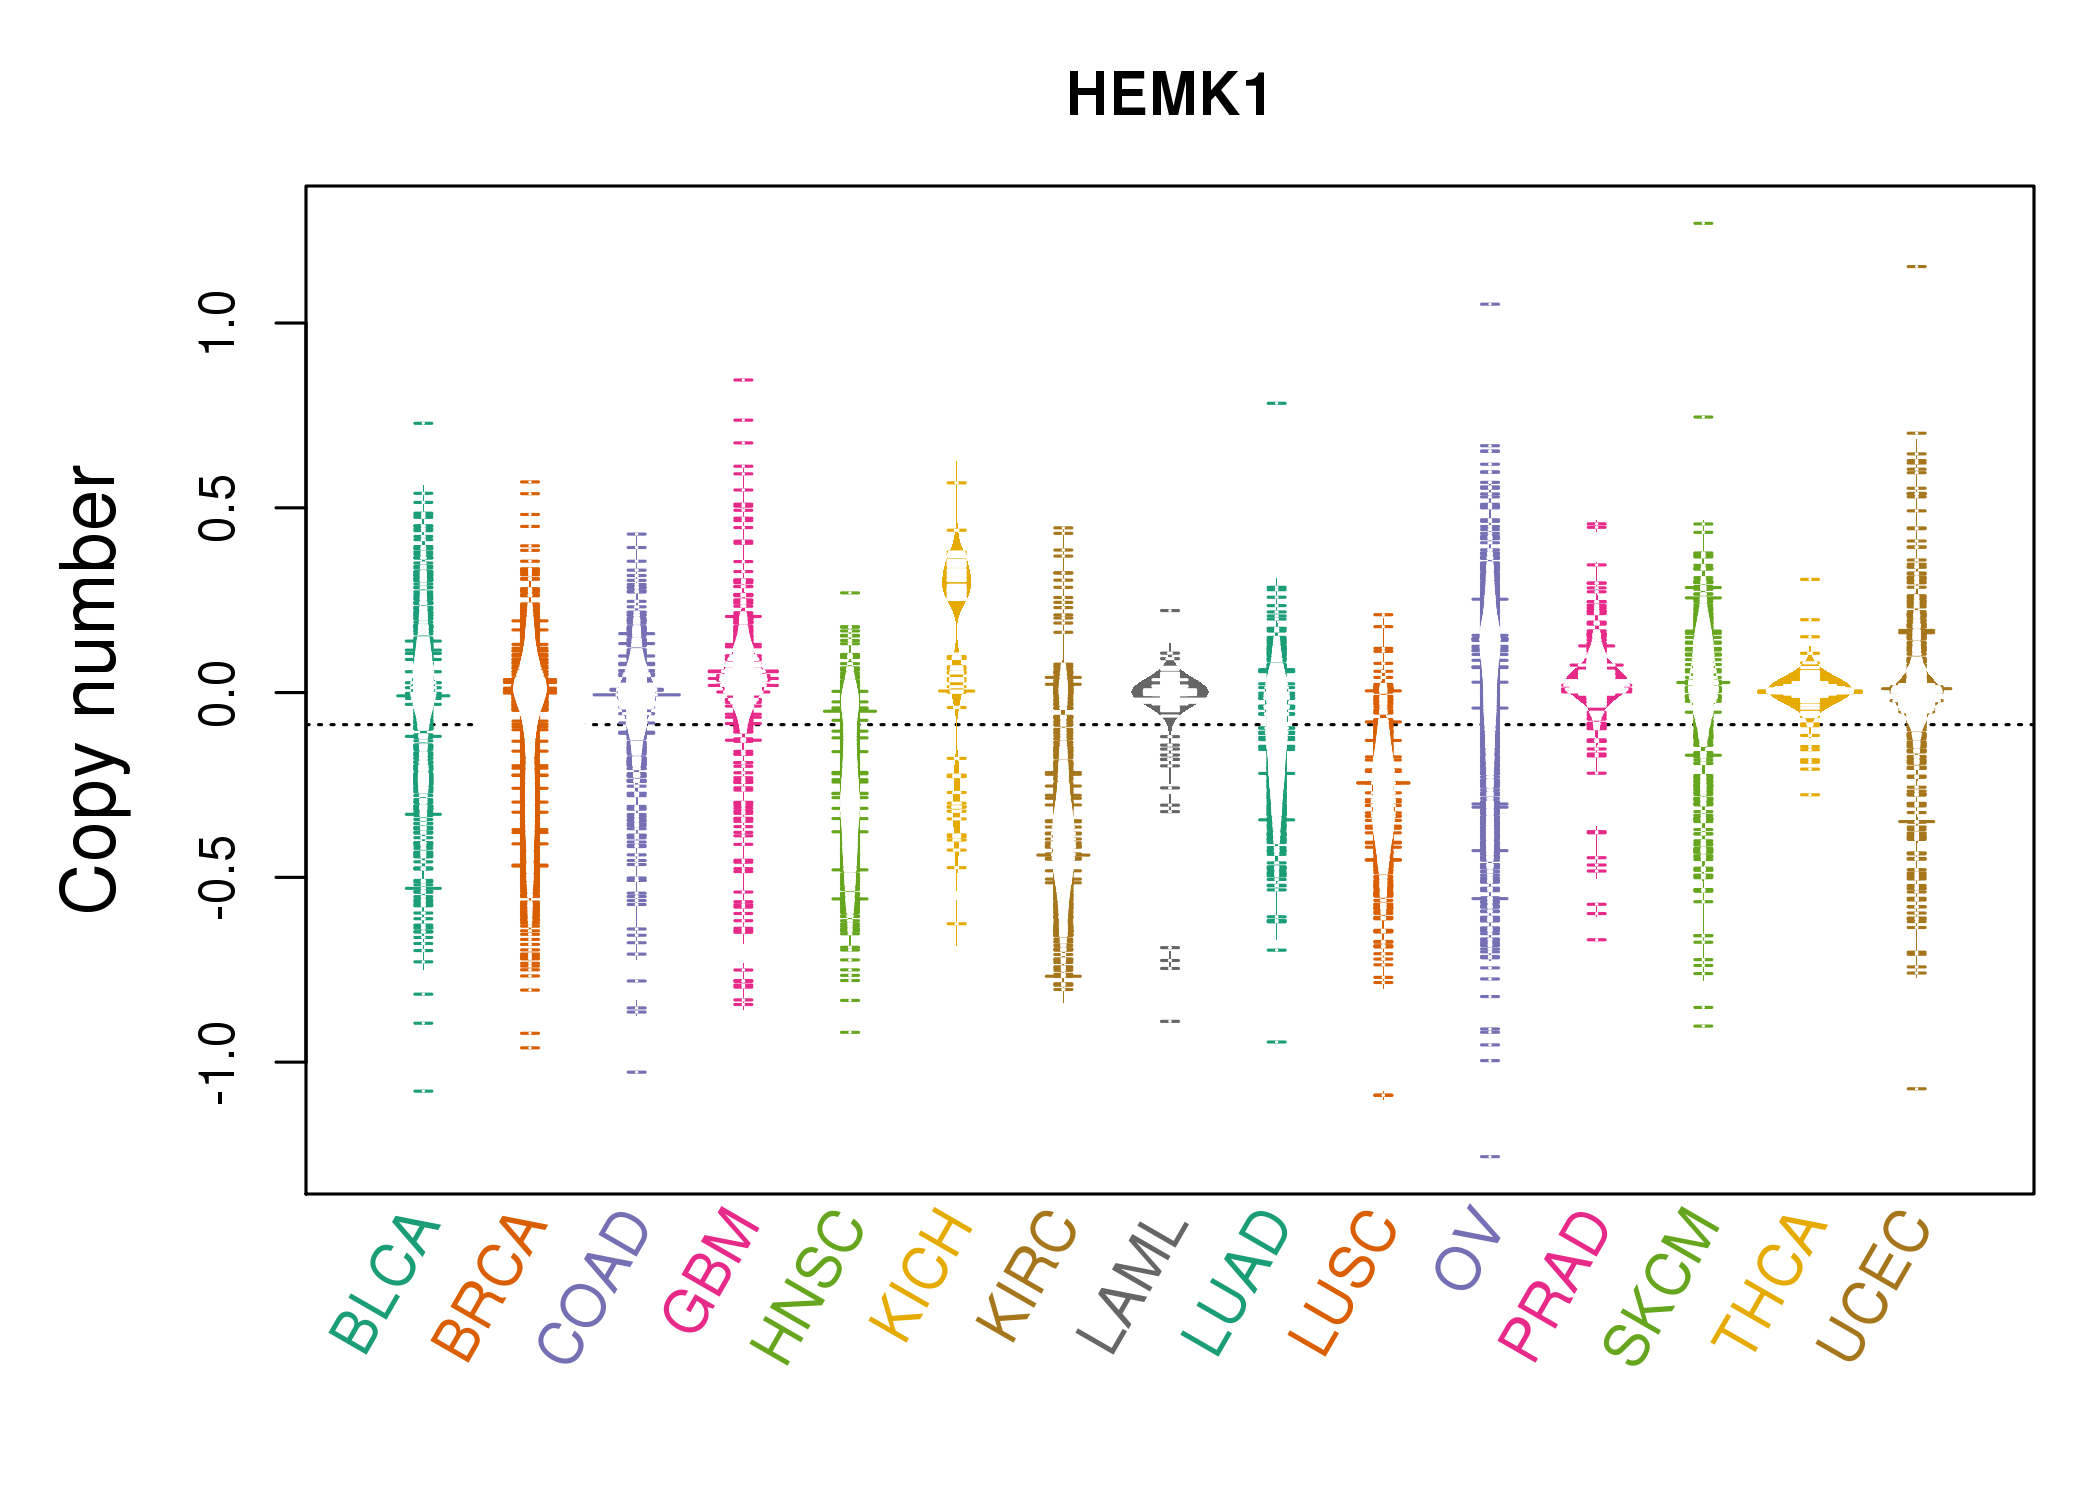 |
| cf) Tissue ID[Tissue type]: BLCA[Bladder Urothelial Carcinoma], BRCA[Breast invasive carcinoma], CESC[Cervical squamous cell carcinoma and endocervical adenocarcinoma], COAD[Colon adenocarcinoma], GBM[Glioblastoma multiforme], Glioma Low Grade, HNSC[Head and Neck squamous cell carcinoma], KICH[Kidney Chromophobe], KIRC[Kidney renal clear cell carcinoma], KIRP[Kidney renal papillary cell carcinoma], LAML[Acute Myeloid Leukemia], LUAD[Lung adenocarcinoma], LUSC[Lung squamous cell carcinoma], OV[Ovarian serous cystadenocarcinoma ], PAAD[Pancreatic adenocarcinoma], PRAD[Prostate adenocarcinoma], SKCM[Skin Cutaneous Melanoma], STAD[Stomach adenocarcinoma], THCA[Thyroid carcinoma], UCEC[Uterine Corpus Endometrial Carcinoma] |
| Top |
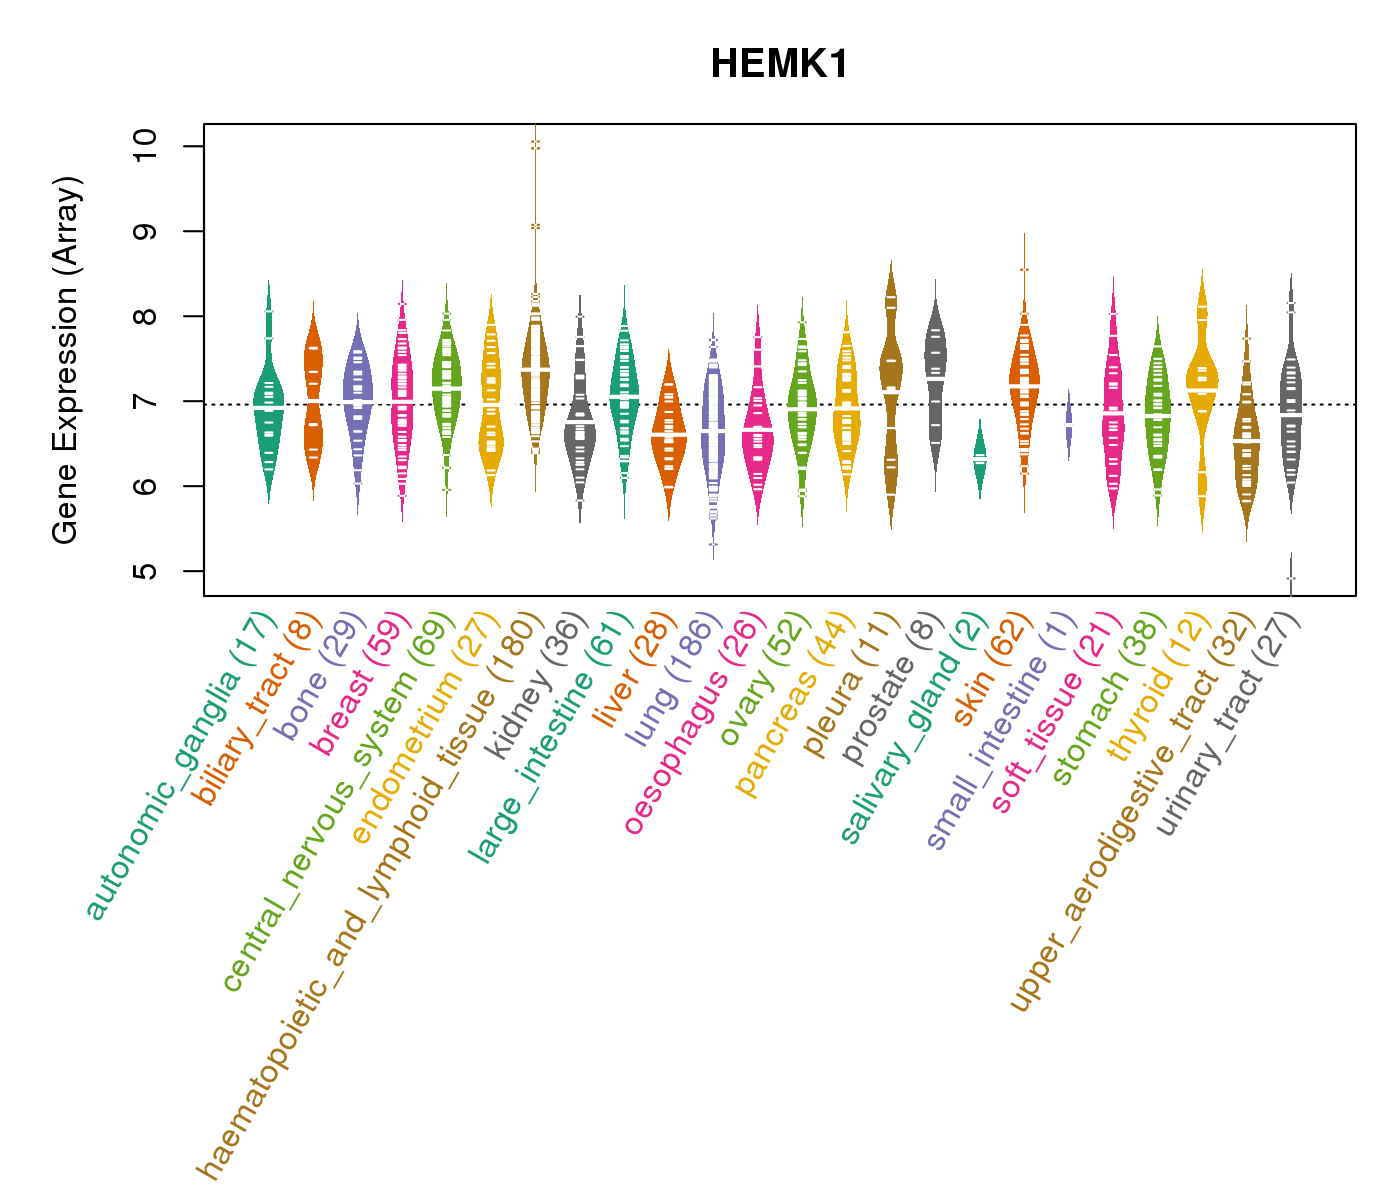
| Gene Expression for HEMK1 |
| * CCLE gene expression data were extracted from CCLE_Expression_Entrez_2012-10-18.res: Gene-centric RMA-normalized mRNA expression data. |
 |
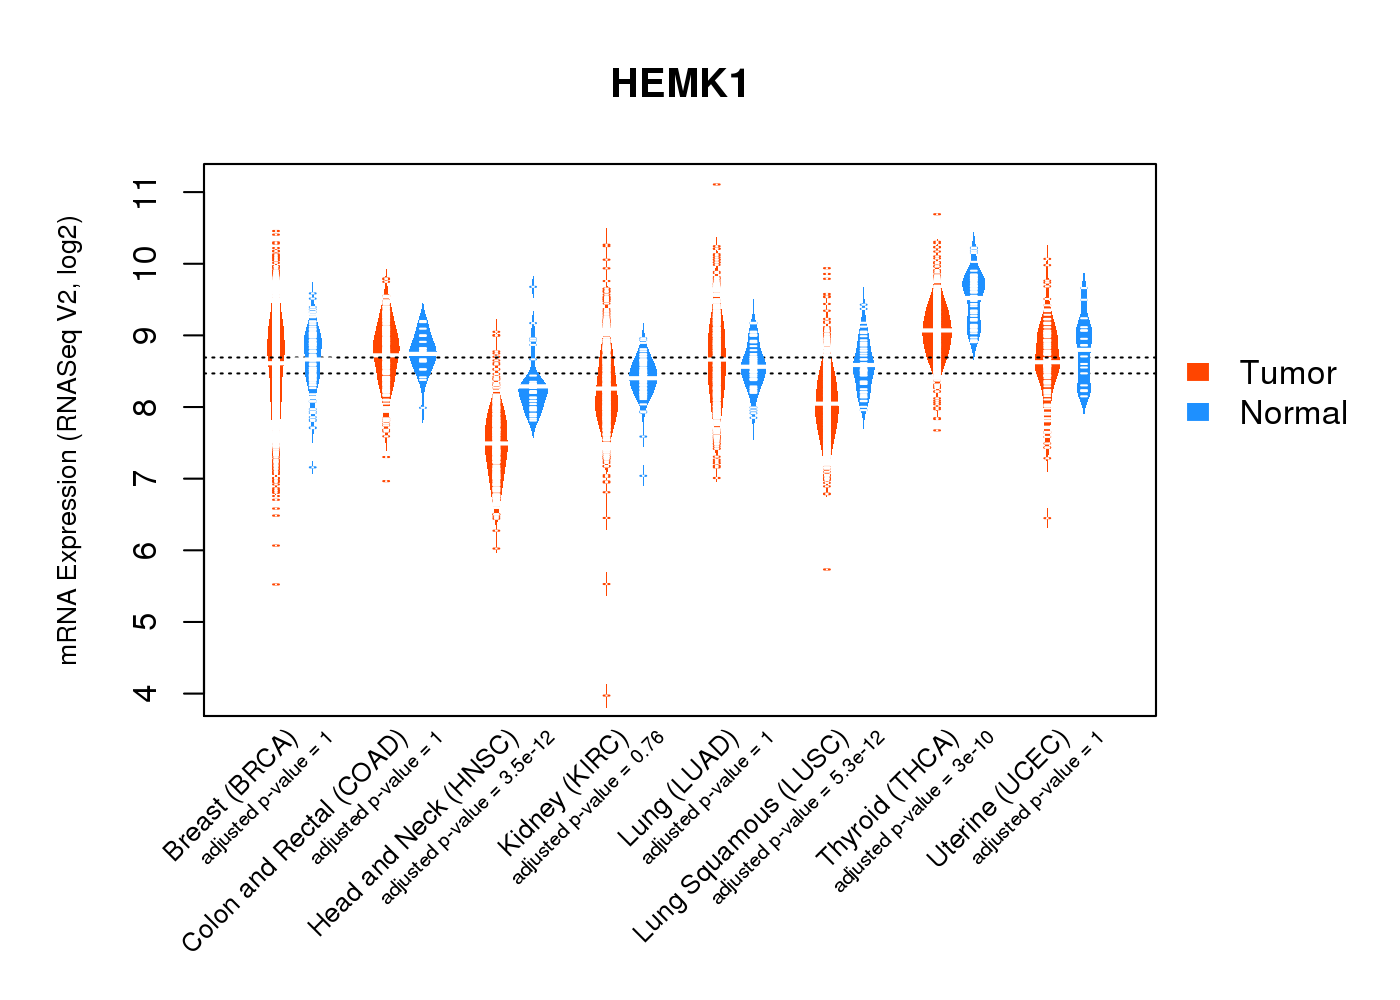
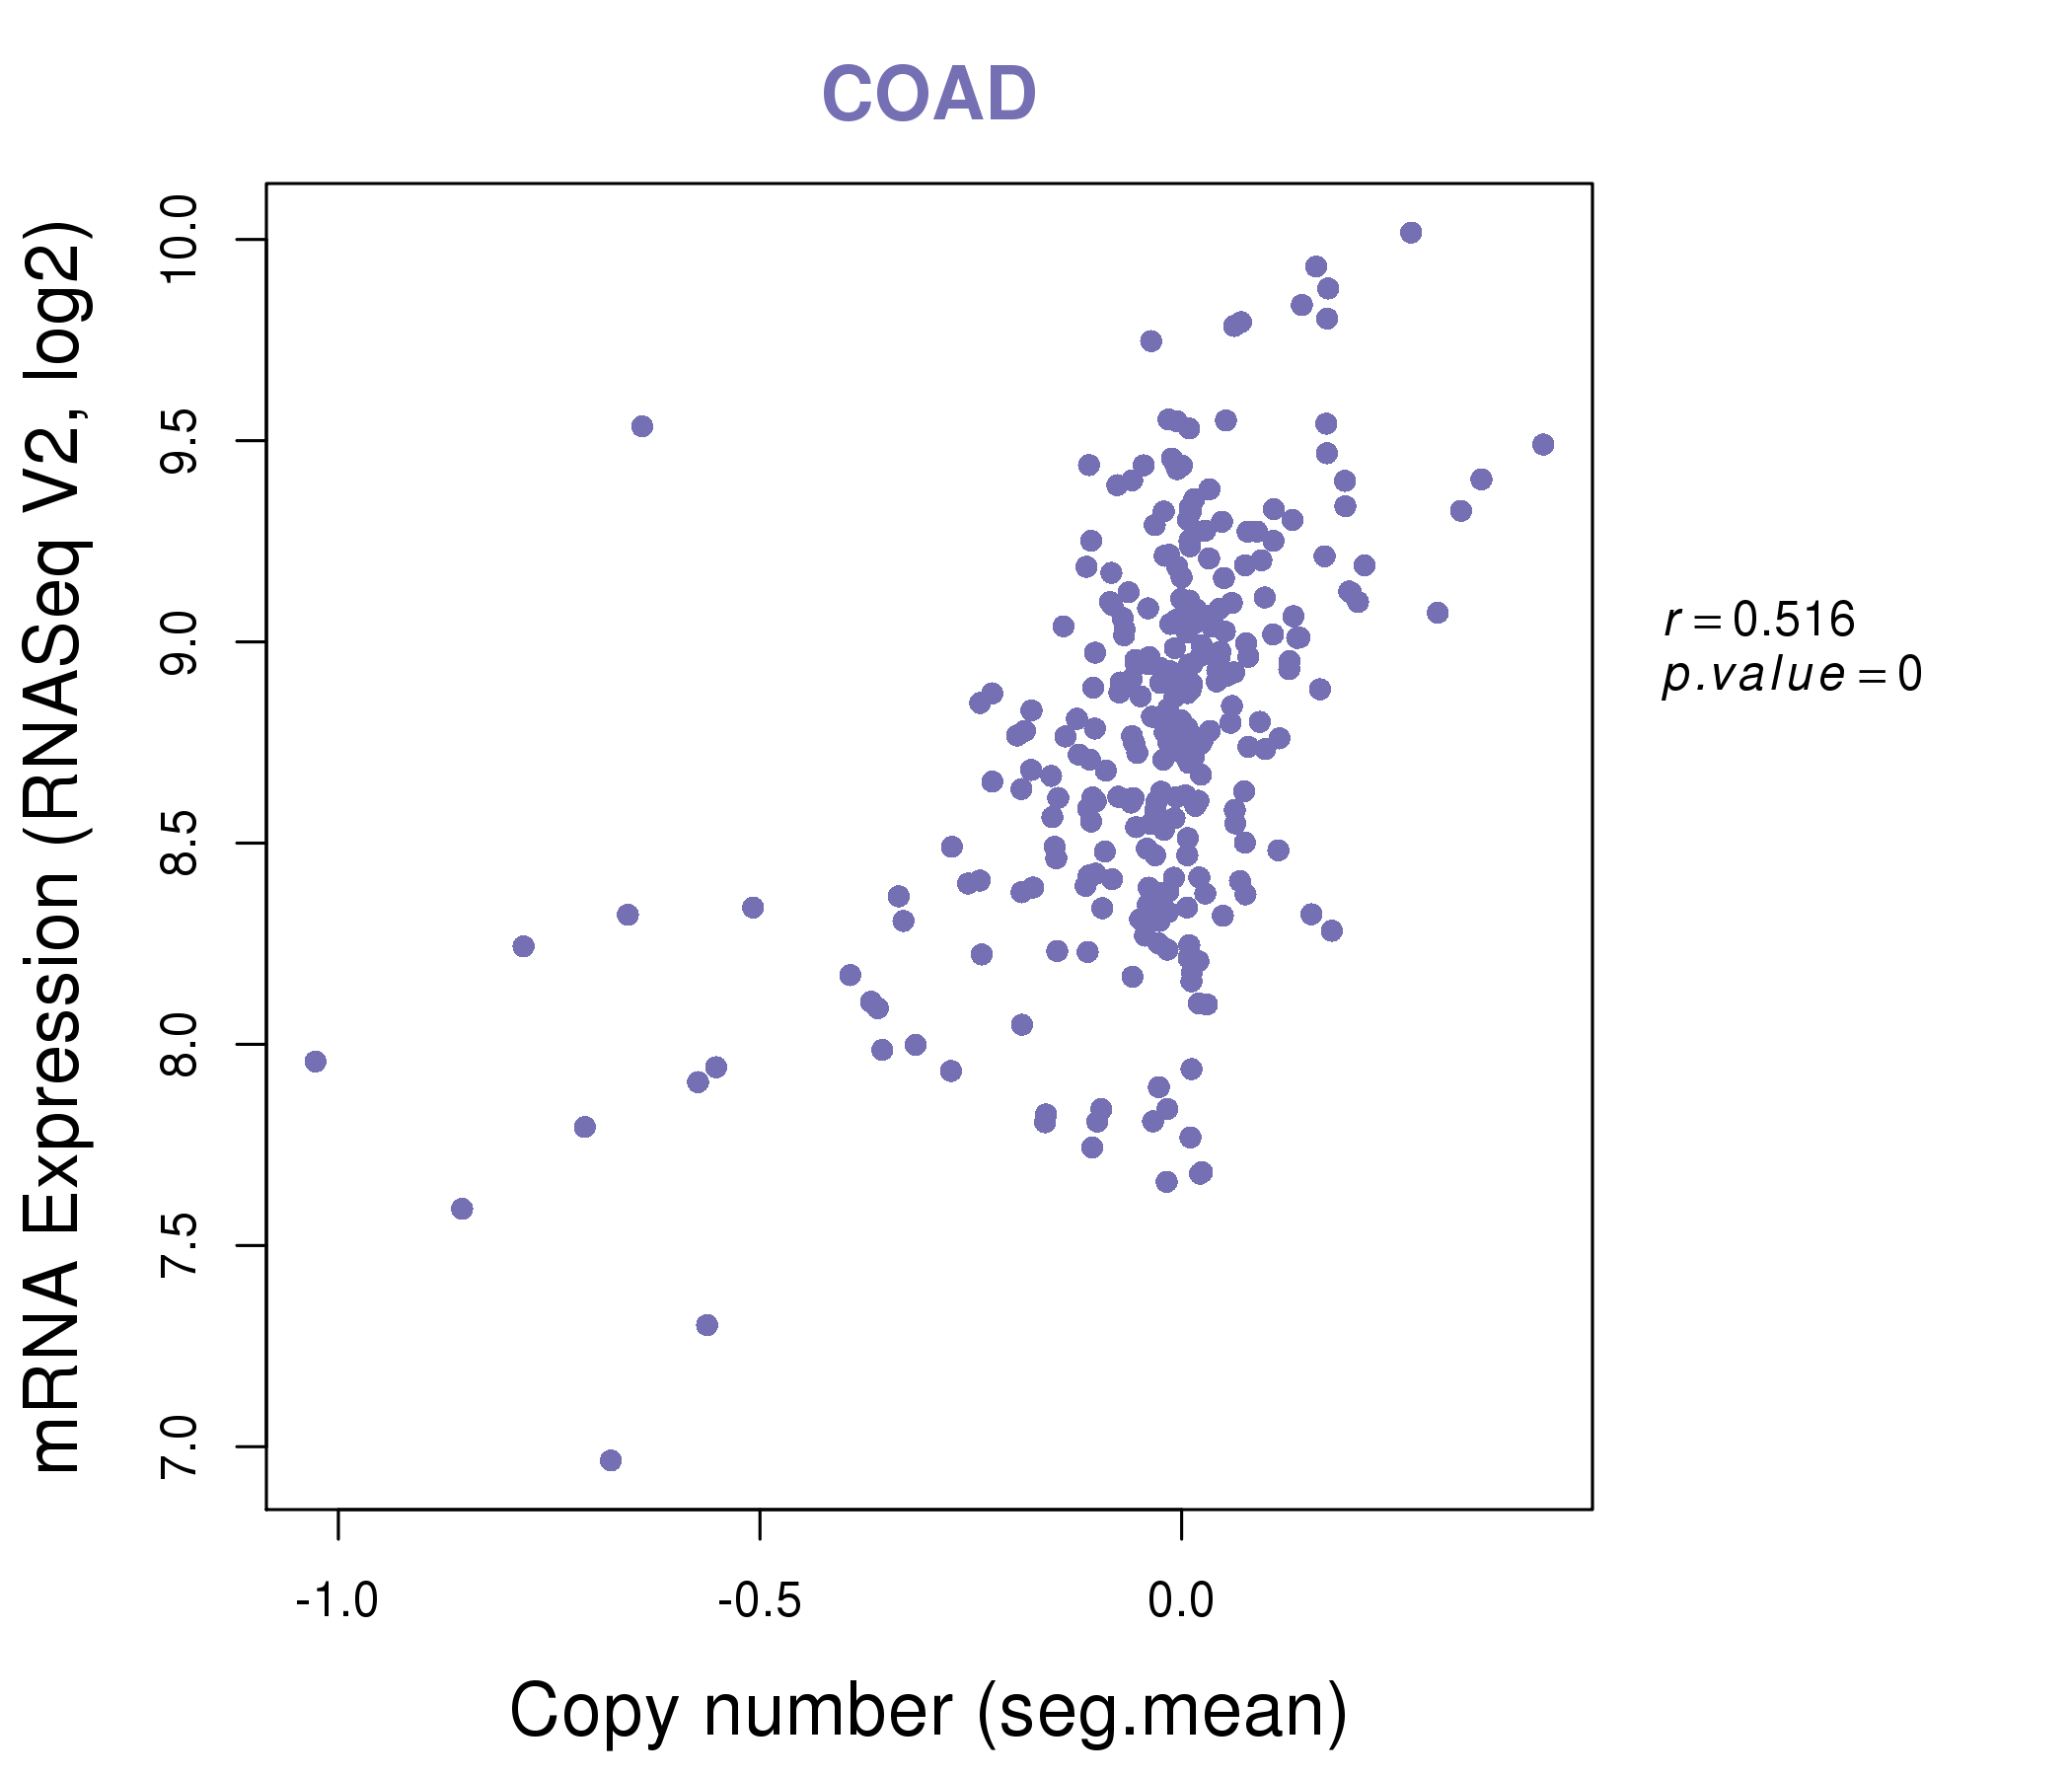
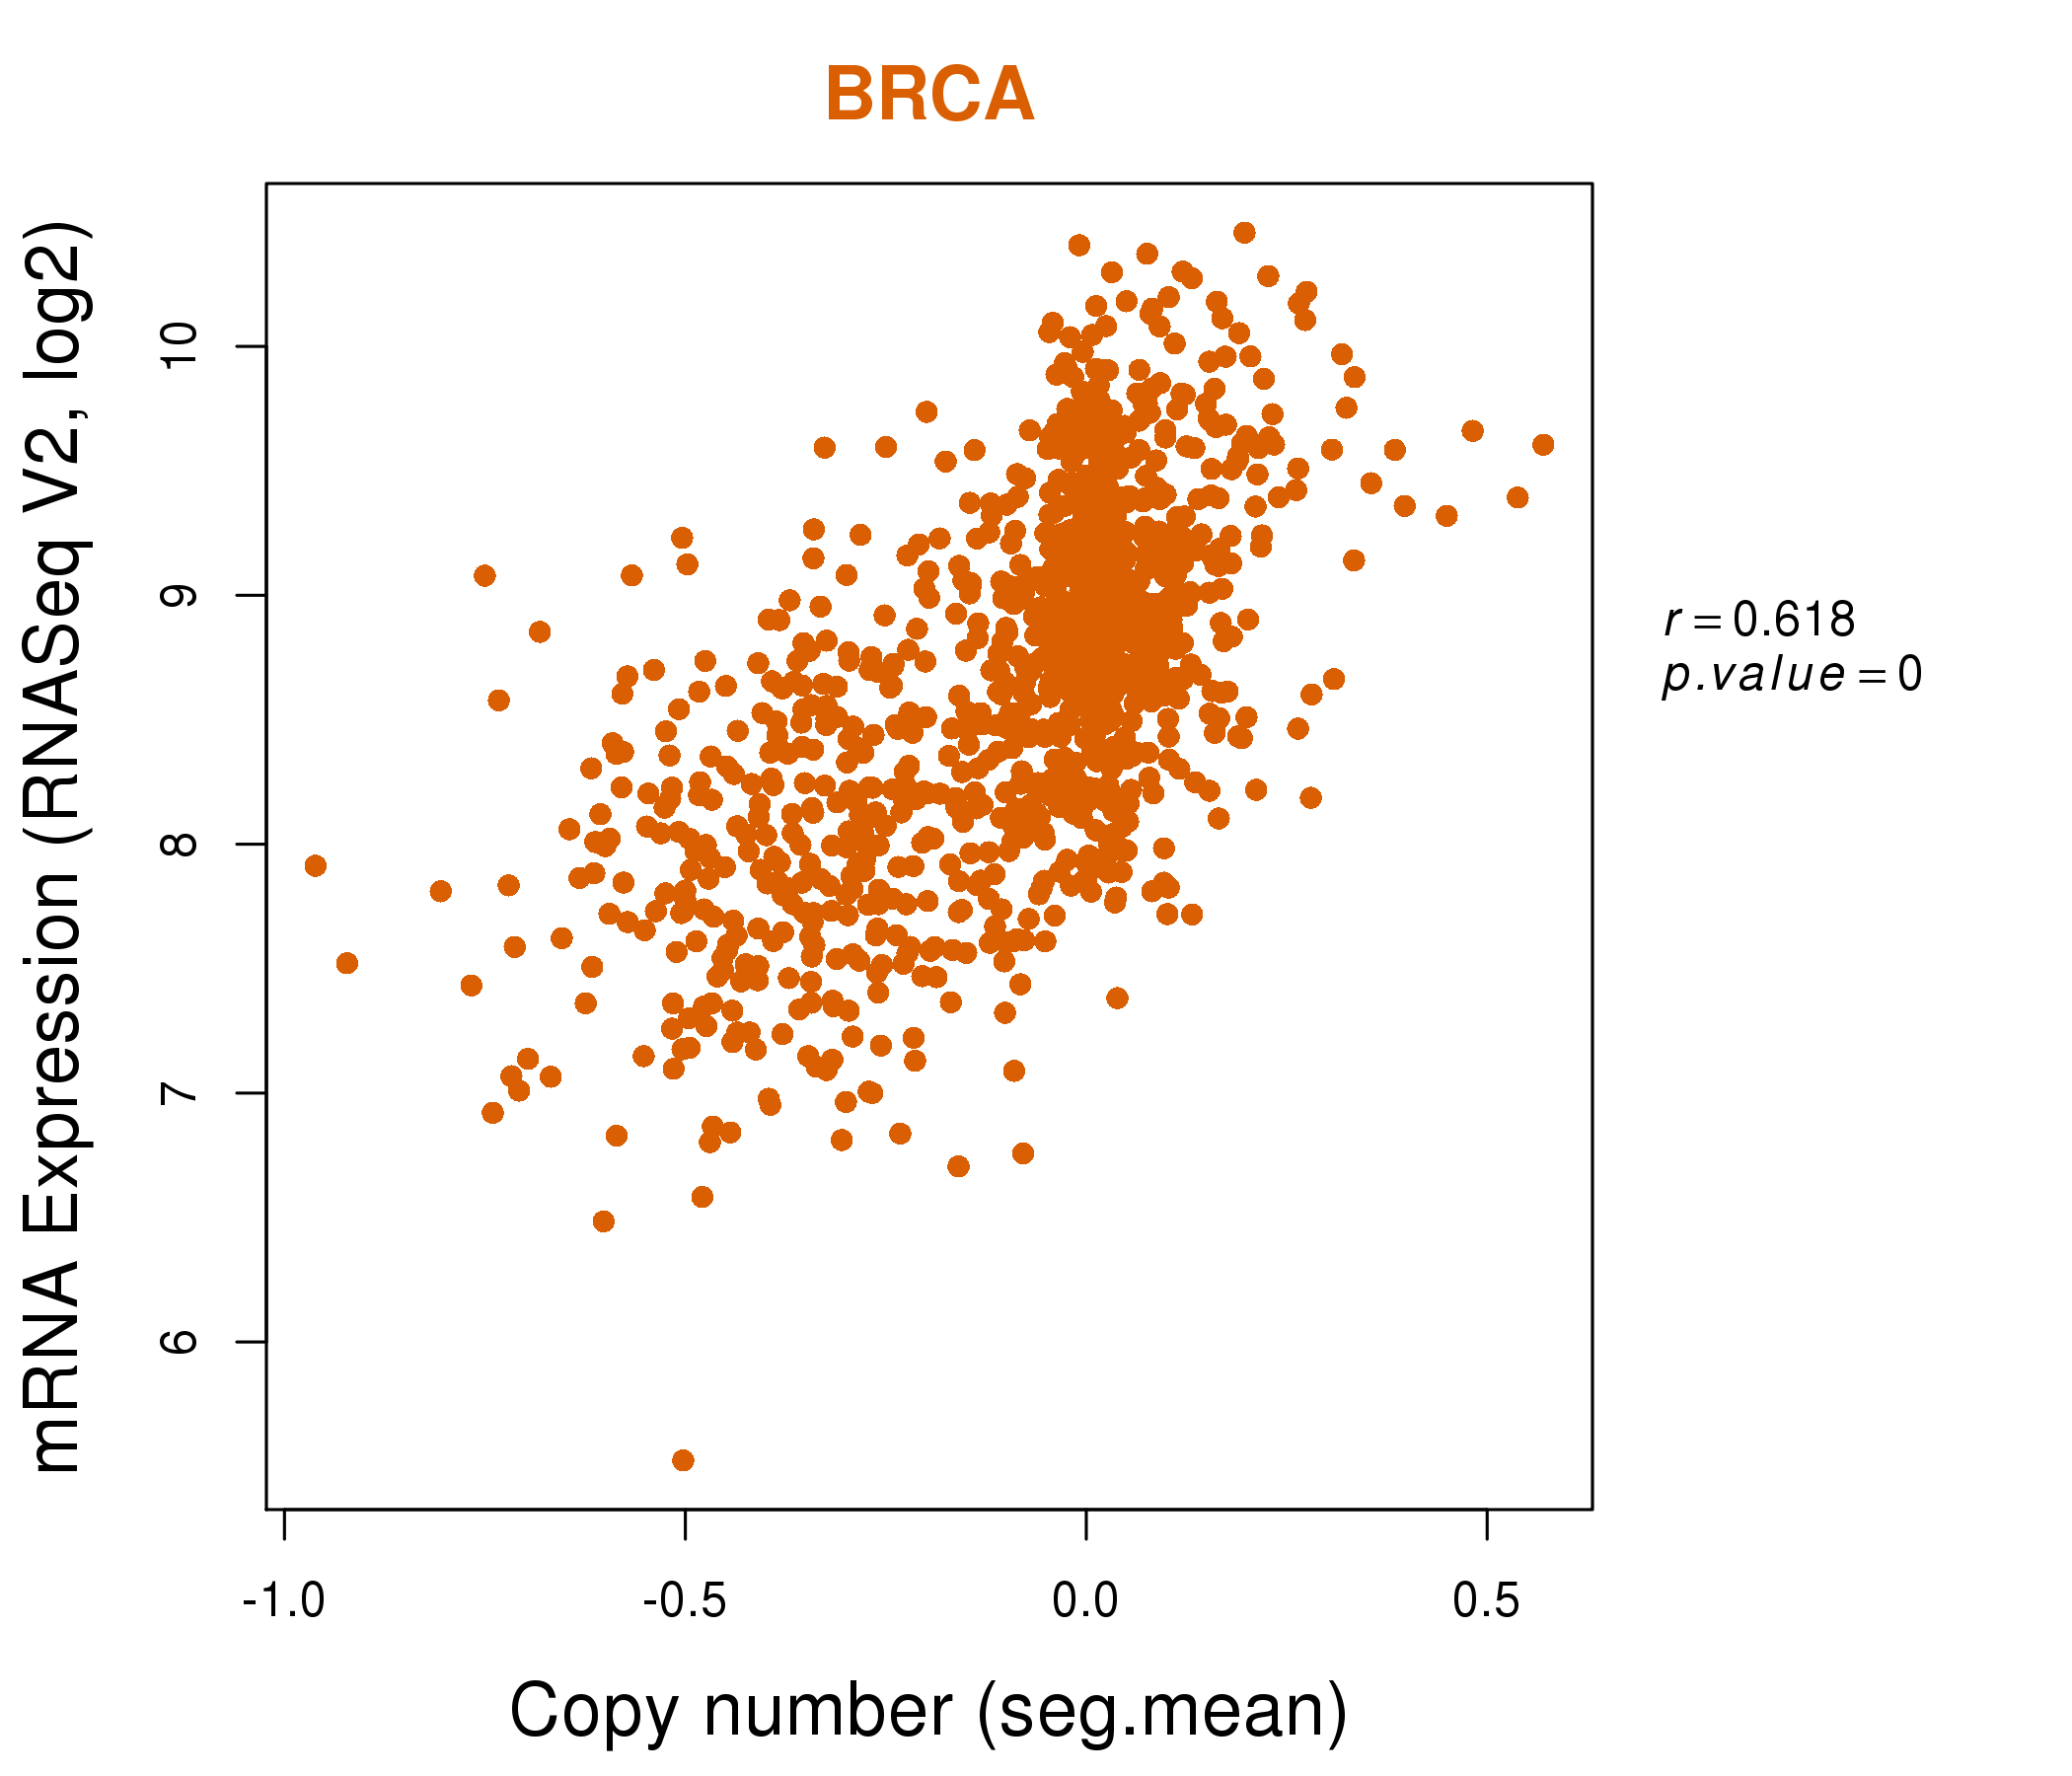
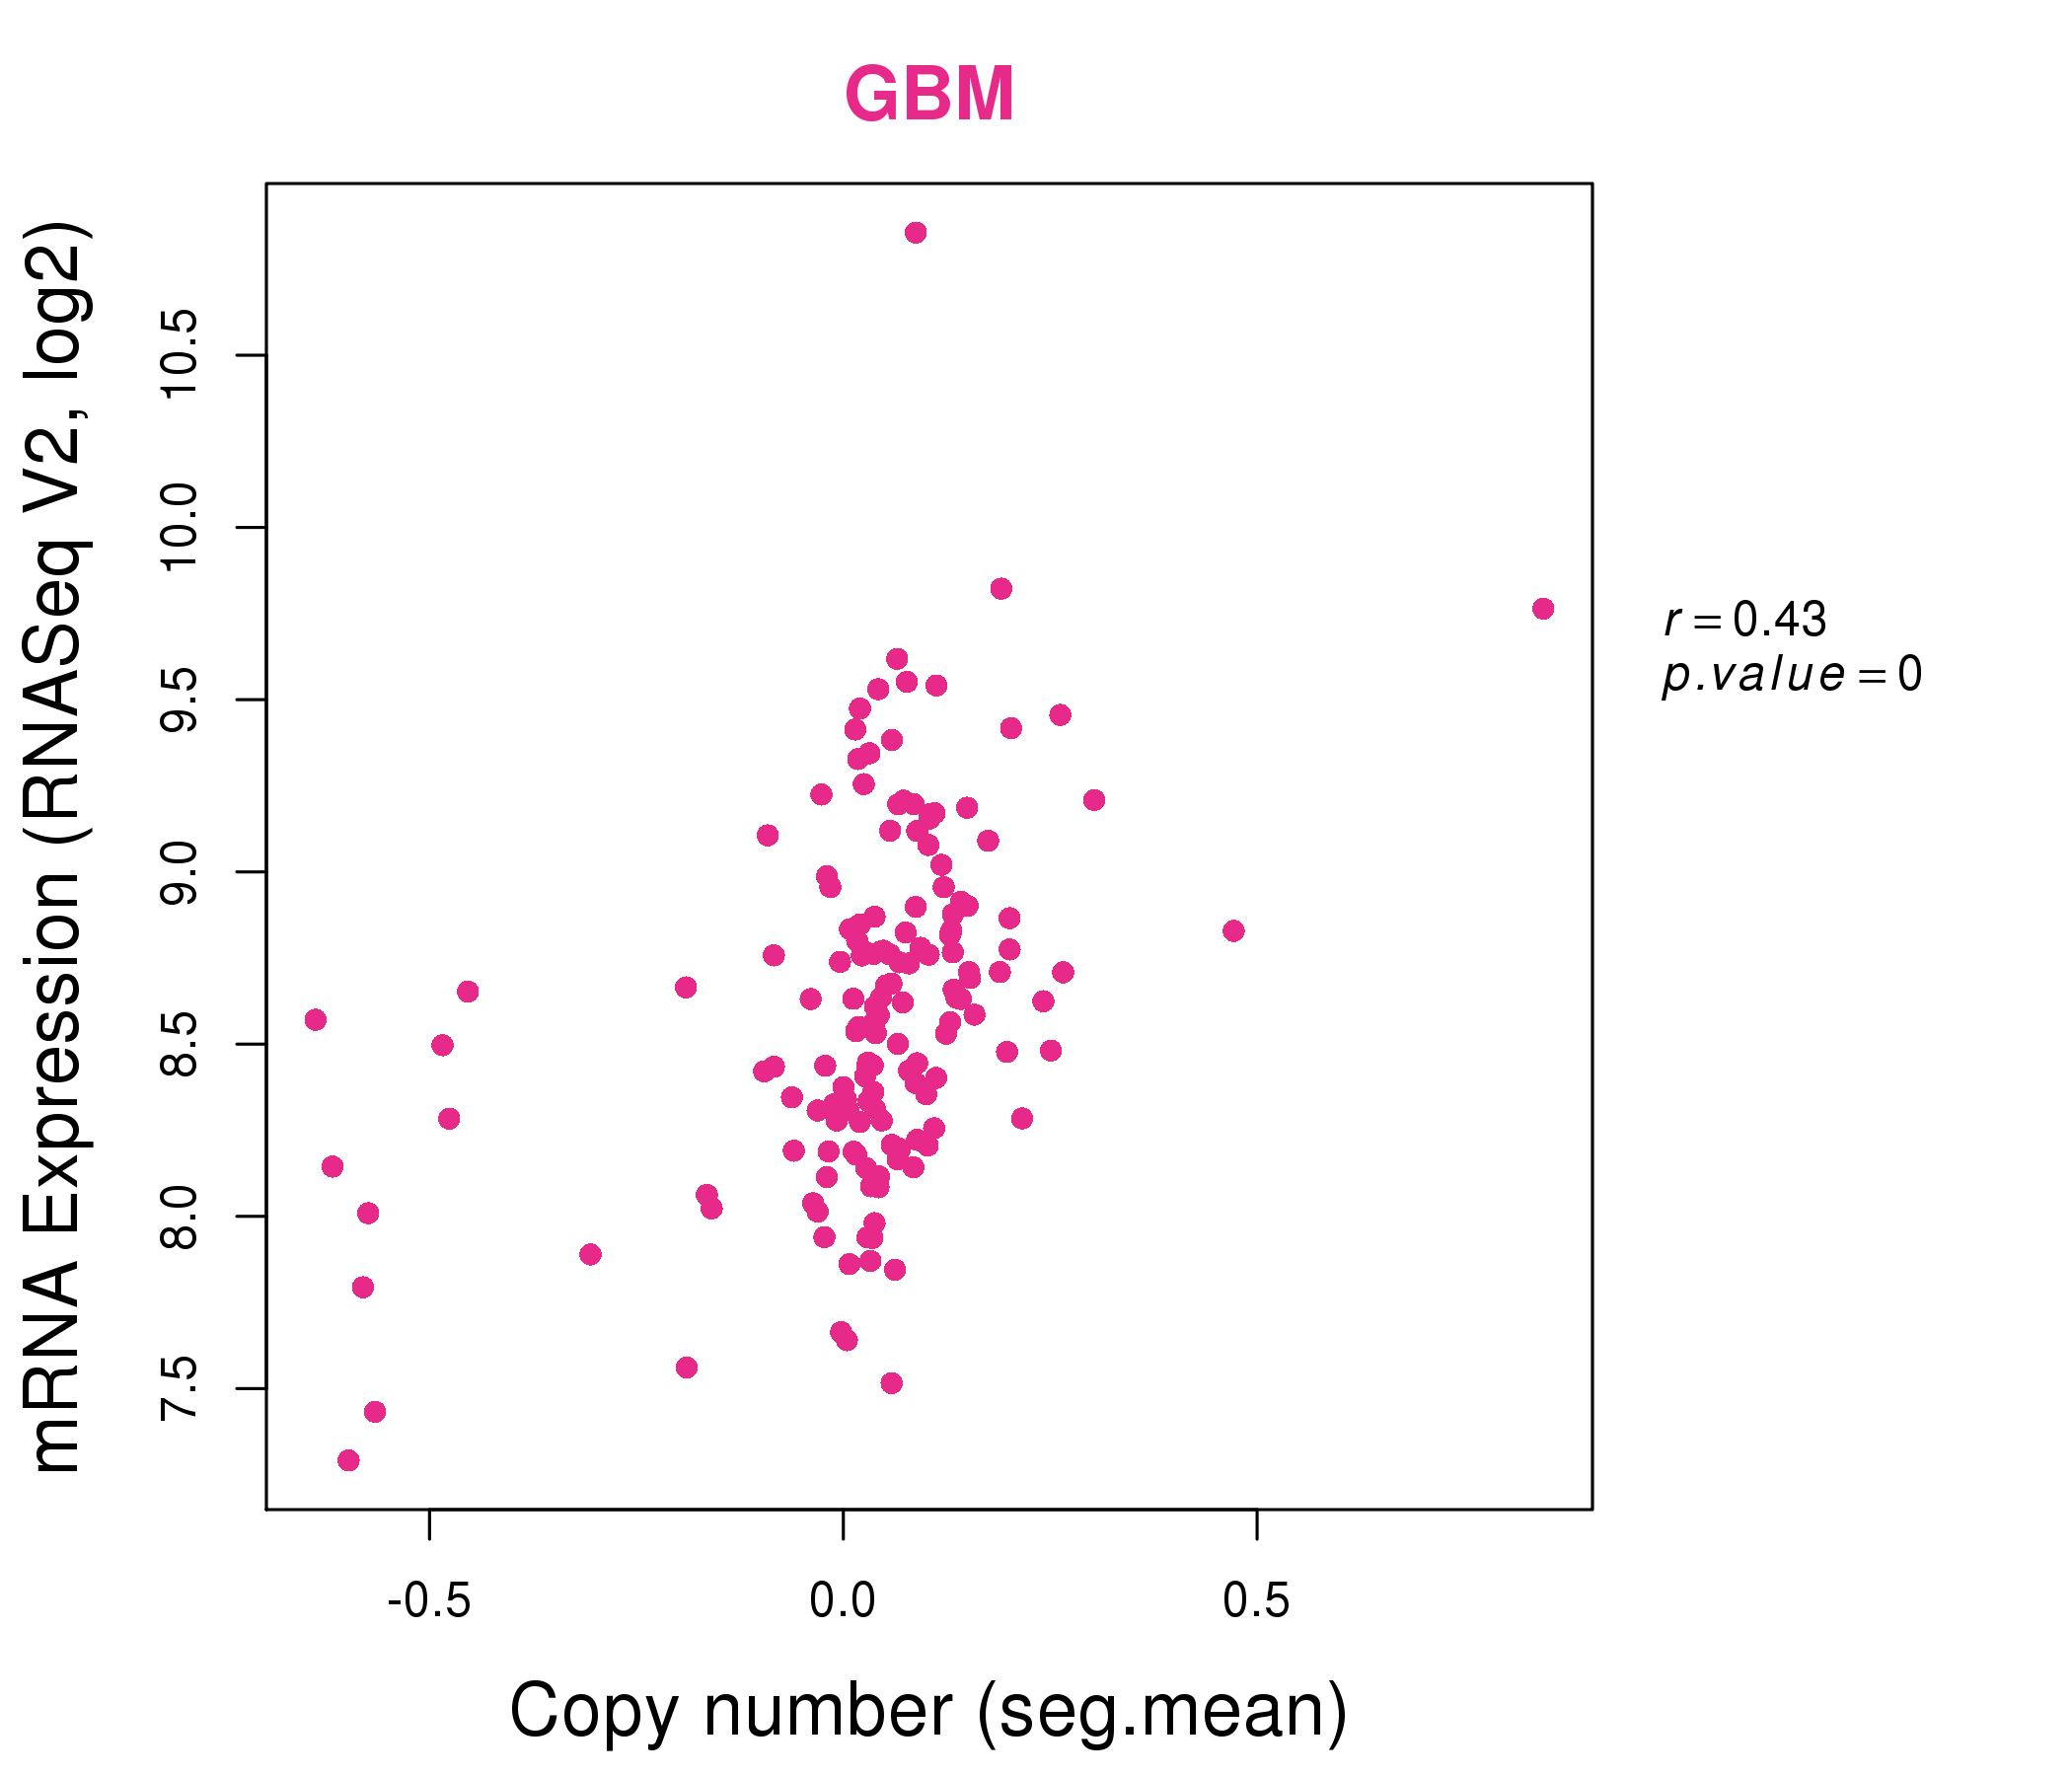
| * Normalized gene expression data of RNASeqV2 was extracted from TCGA using R package TCGA-Assembler. The URLs of all public data files on TCGA DCC data server were gathered at Jan-05-2015. Only eight cancer types have enough normal control samples for differential expression analysis. (t test, adjusted p<0.05 (using Benjamini-Hochberg FDR)) |
 |
| Top |
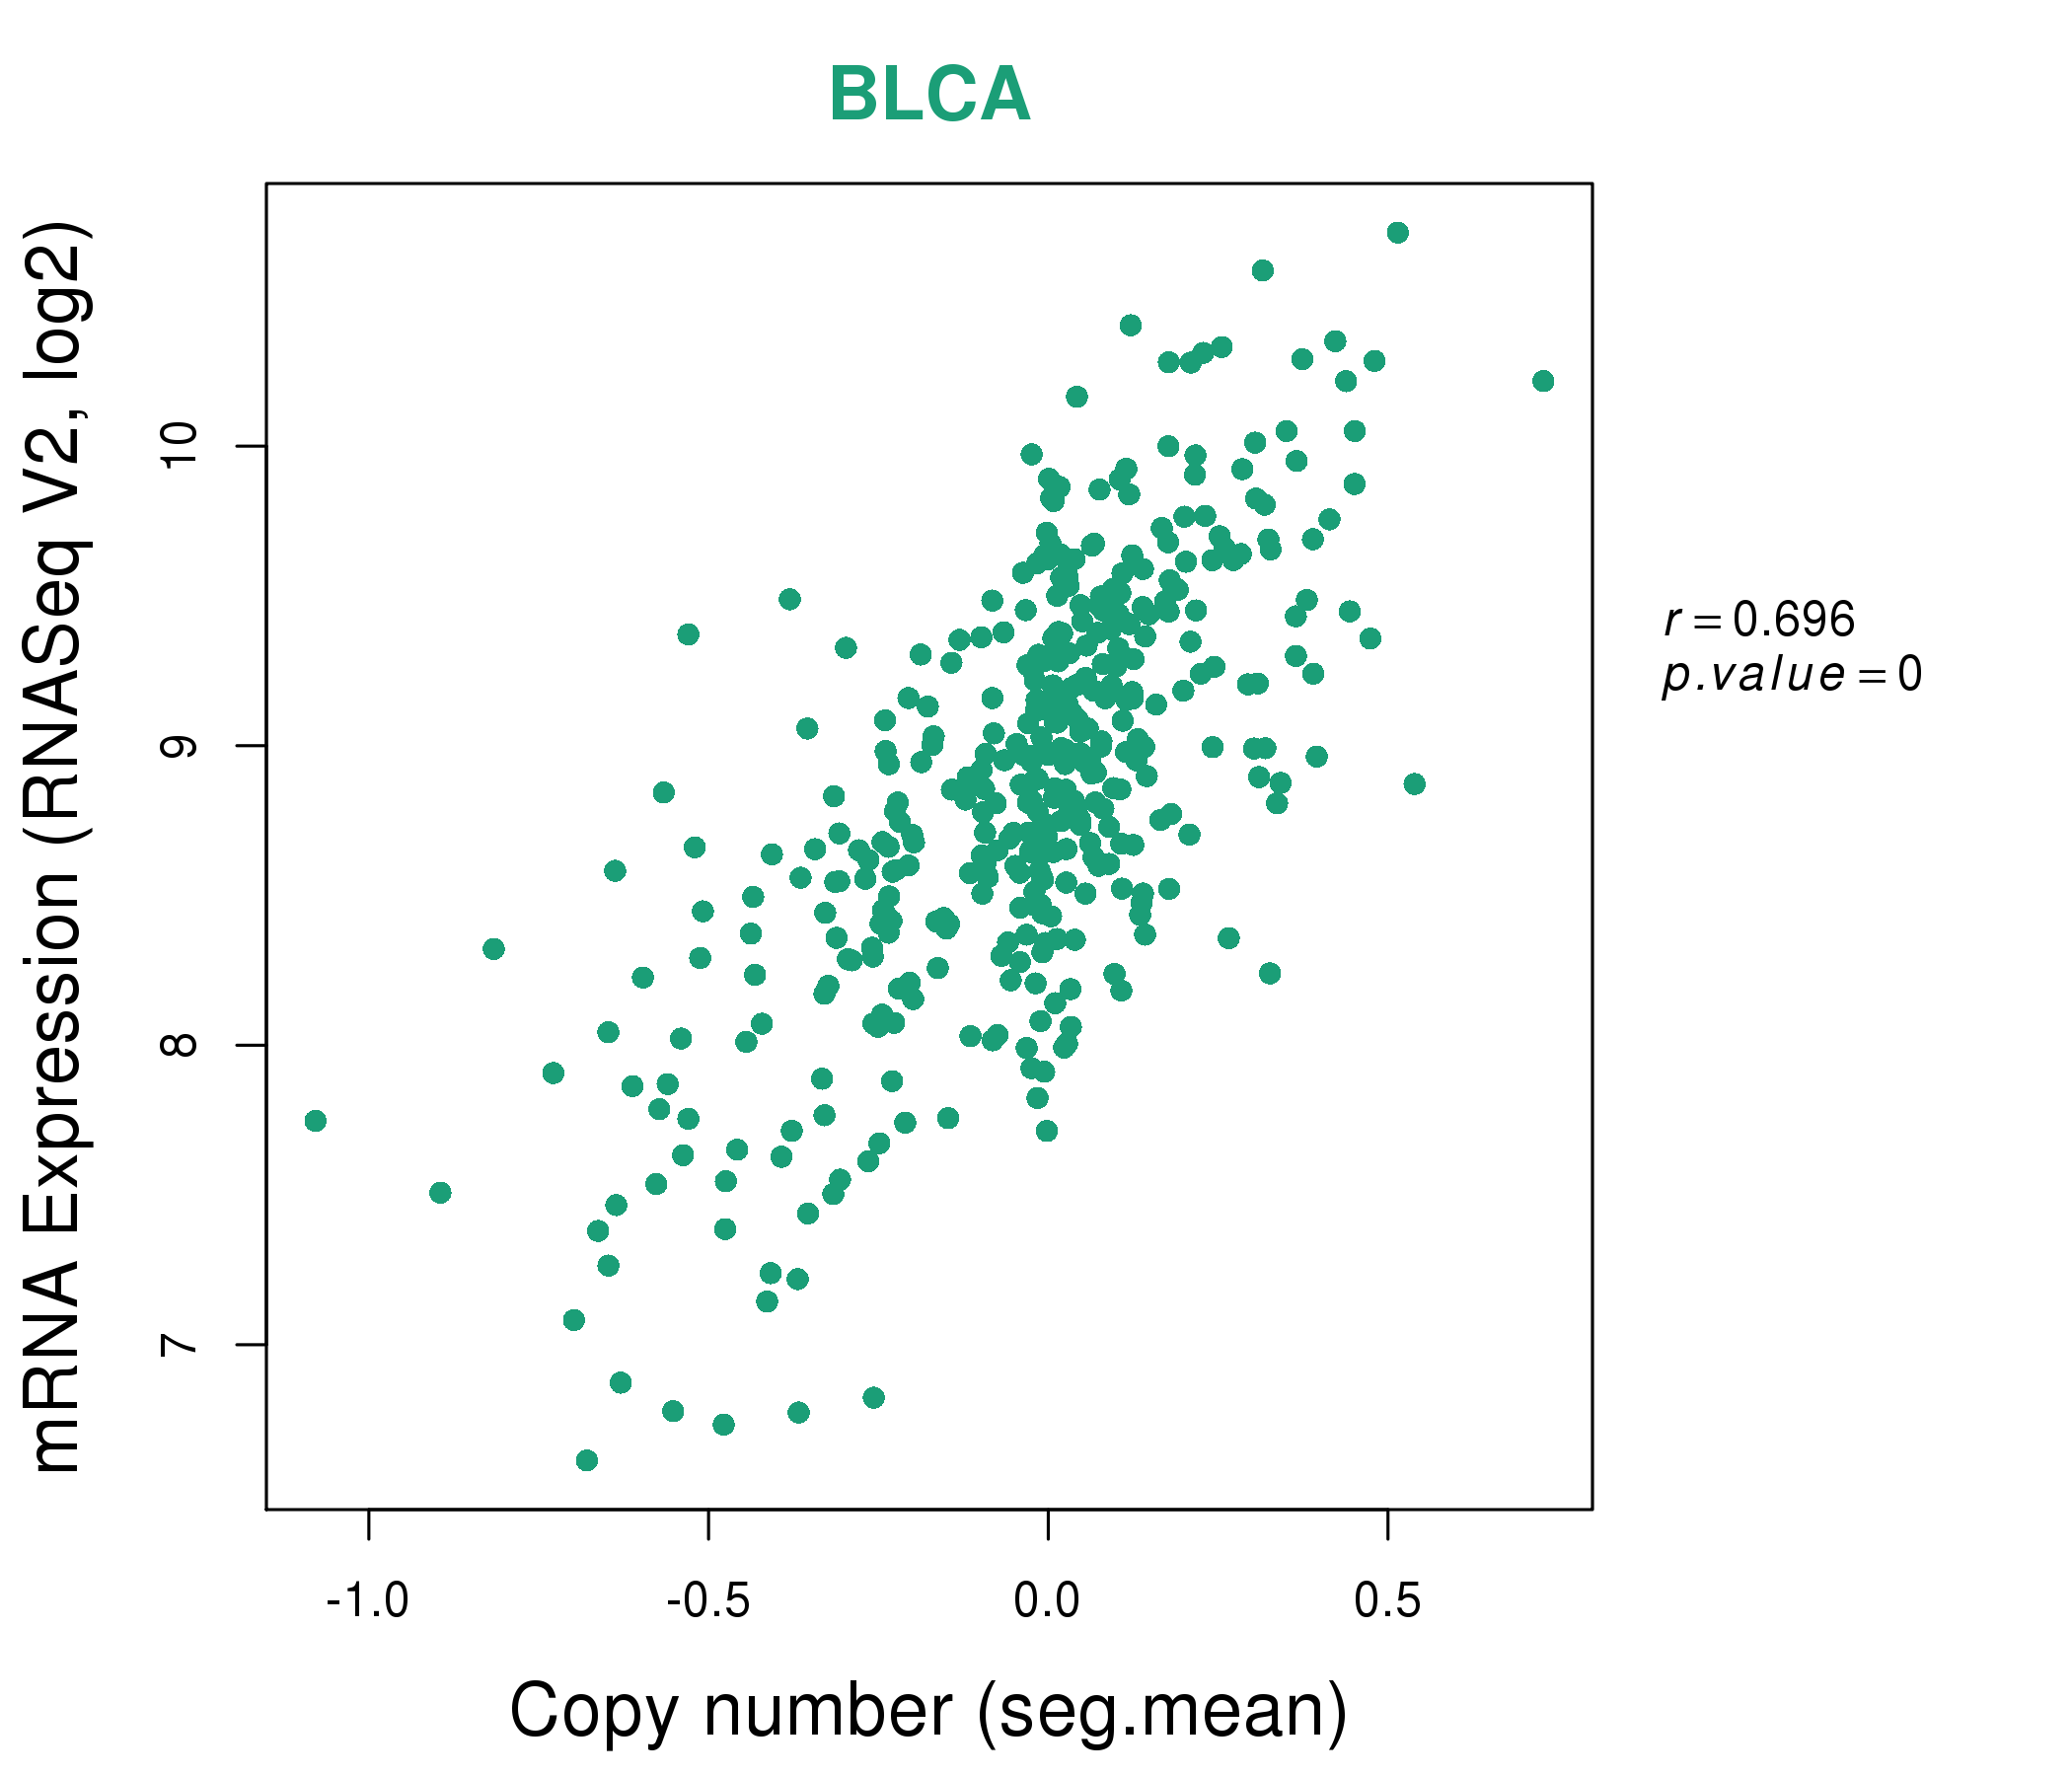
| * This plots show the correlation between CNV and gene expression. |
: Open all plots for all cancer types
 |
|
 |
|
| Top |
| Gene-Gene Network Information |
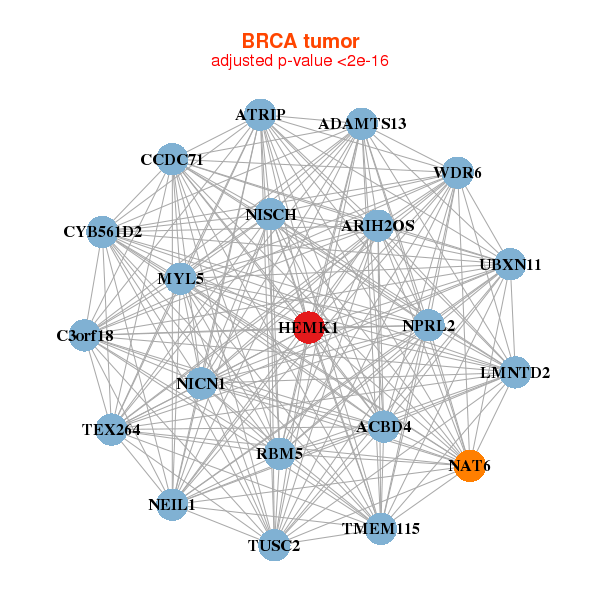
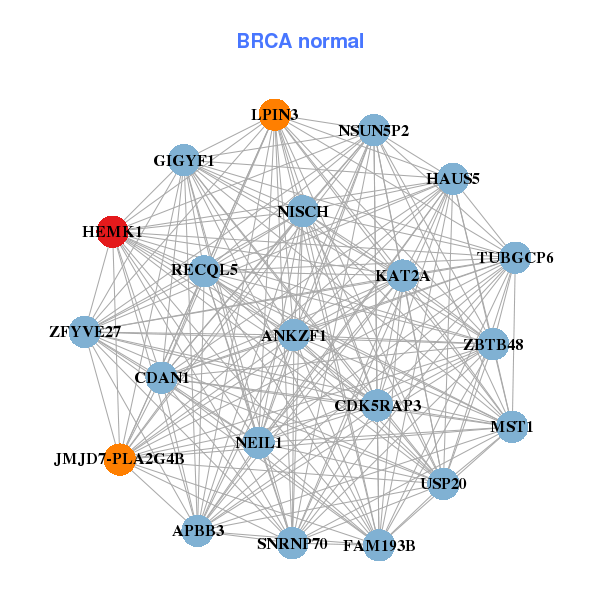
| * Co-Expression network figures were drawn using R package igraph. Only the top 20 genes with the highest correlations were shown. Red circle: input gene, orange circle: cell metabolism gene, sky circle: other gene |
: Open all plots for all cancer types
 |
| ||||
| ACBD4,ADAMTS13,ATRIP,LMNTD2,C3orf18,ARIH2OS,CCDC71, CYB561D2,HEMK1,MYL5,NAT6,NEIL1,NICN1,NISCH, NPRL2,RBM5,TEX264,TMEM115,TUSC2,UBXN11,WDR6 | ANKZF1,APBB3,CDAN1,CDK5RAP3,FAM193B,GIGYF1,HAUS5, HEMK1,JMJD7-PLA2G4B,KAT2A,LPIN3,MST1,NEIL1,NISCH, NSUN5P2,RECQL5,SNRNP70,TUBGCP6,USP20,ZBTB48,ZFYVE27 | ||||
 |
| ||||
| ARIH2OS,CDK10,DALRD3,HEMK1,IFRD2,IP6K2,LOC440944, LOC440957,MRPS25,NAT6,NDUFAF3,NICN1,NPRL2,NSUN5P1, NSUN5P2,RFT1,SLC26A6,SPATA24,TEX264,TMEM42,TUSC2 | BCS1L,C16orf58,DFFB,DXO,EIF4EBP1,GTF2H4,HEMK1, IFT27,INO80E,LGTN,MLST8,PPOX,RPUSD3,SARS2, SDR39U1,TARBP2,TRMT1,TRMT2A,DPH7,MSS51,ZNF76 |
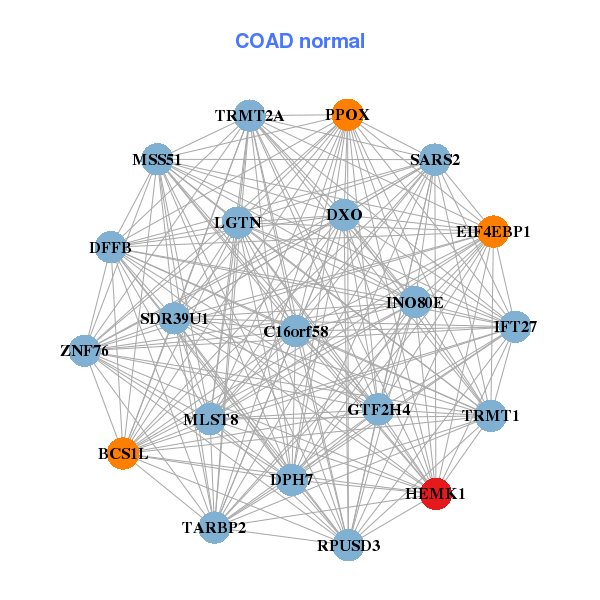
| * Co-Expression network figures were drawn using R package igraph. Only the top 20 genes with the highest correlations were shown. Red circle: input gene, orange circle: cell metabolism gene, sky circle: other gene |
: Open all plots for all cancer types
| Top |
: Open all interacting genes' information including KEGG pathway for all interacting genes from DAVID
| Top |
| Pharmacological Information for HEMK1 |
| DB Category | DB Name | DB's ID and Url link |
| * Gene Centered Interaction Network. |
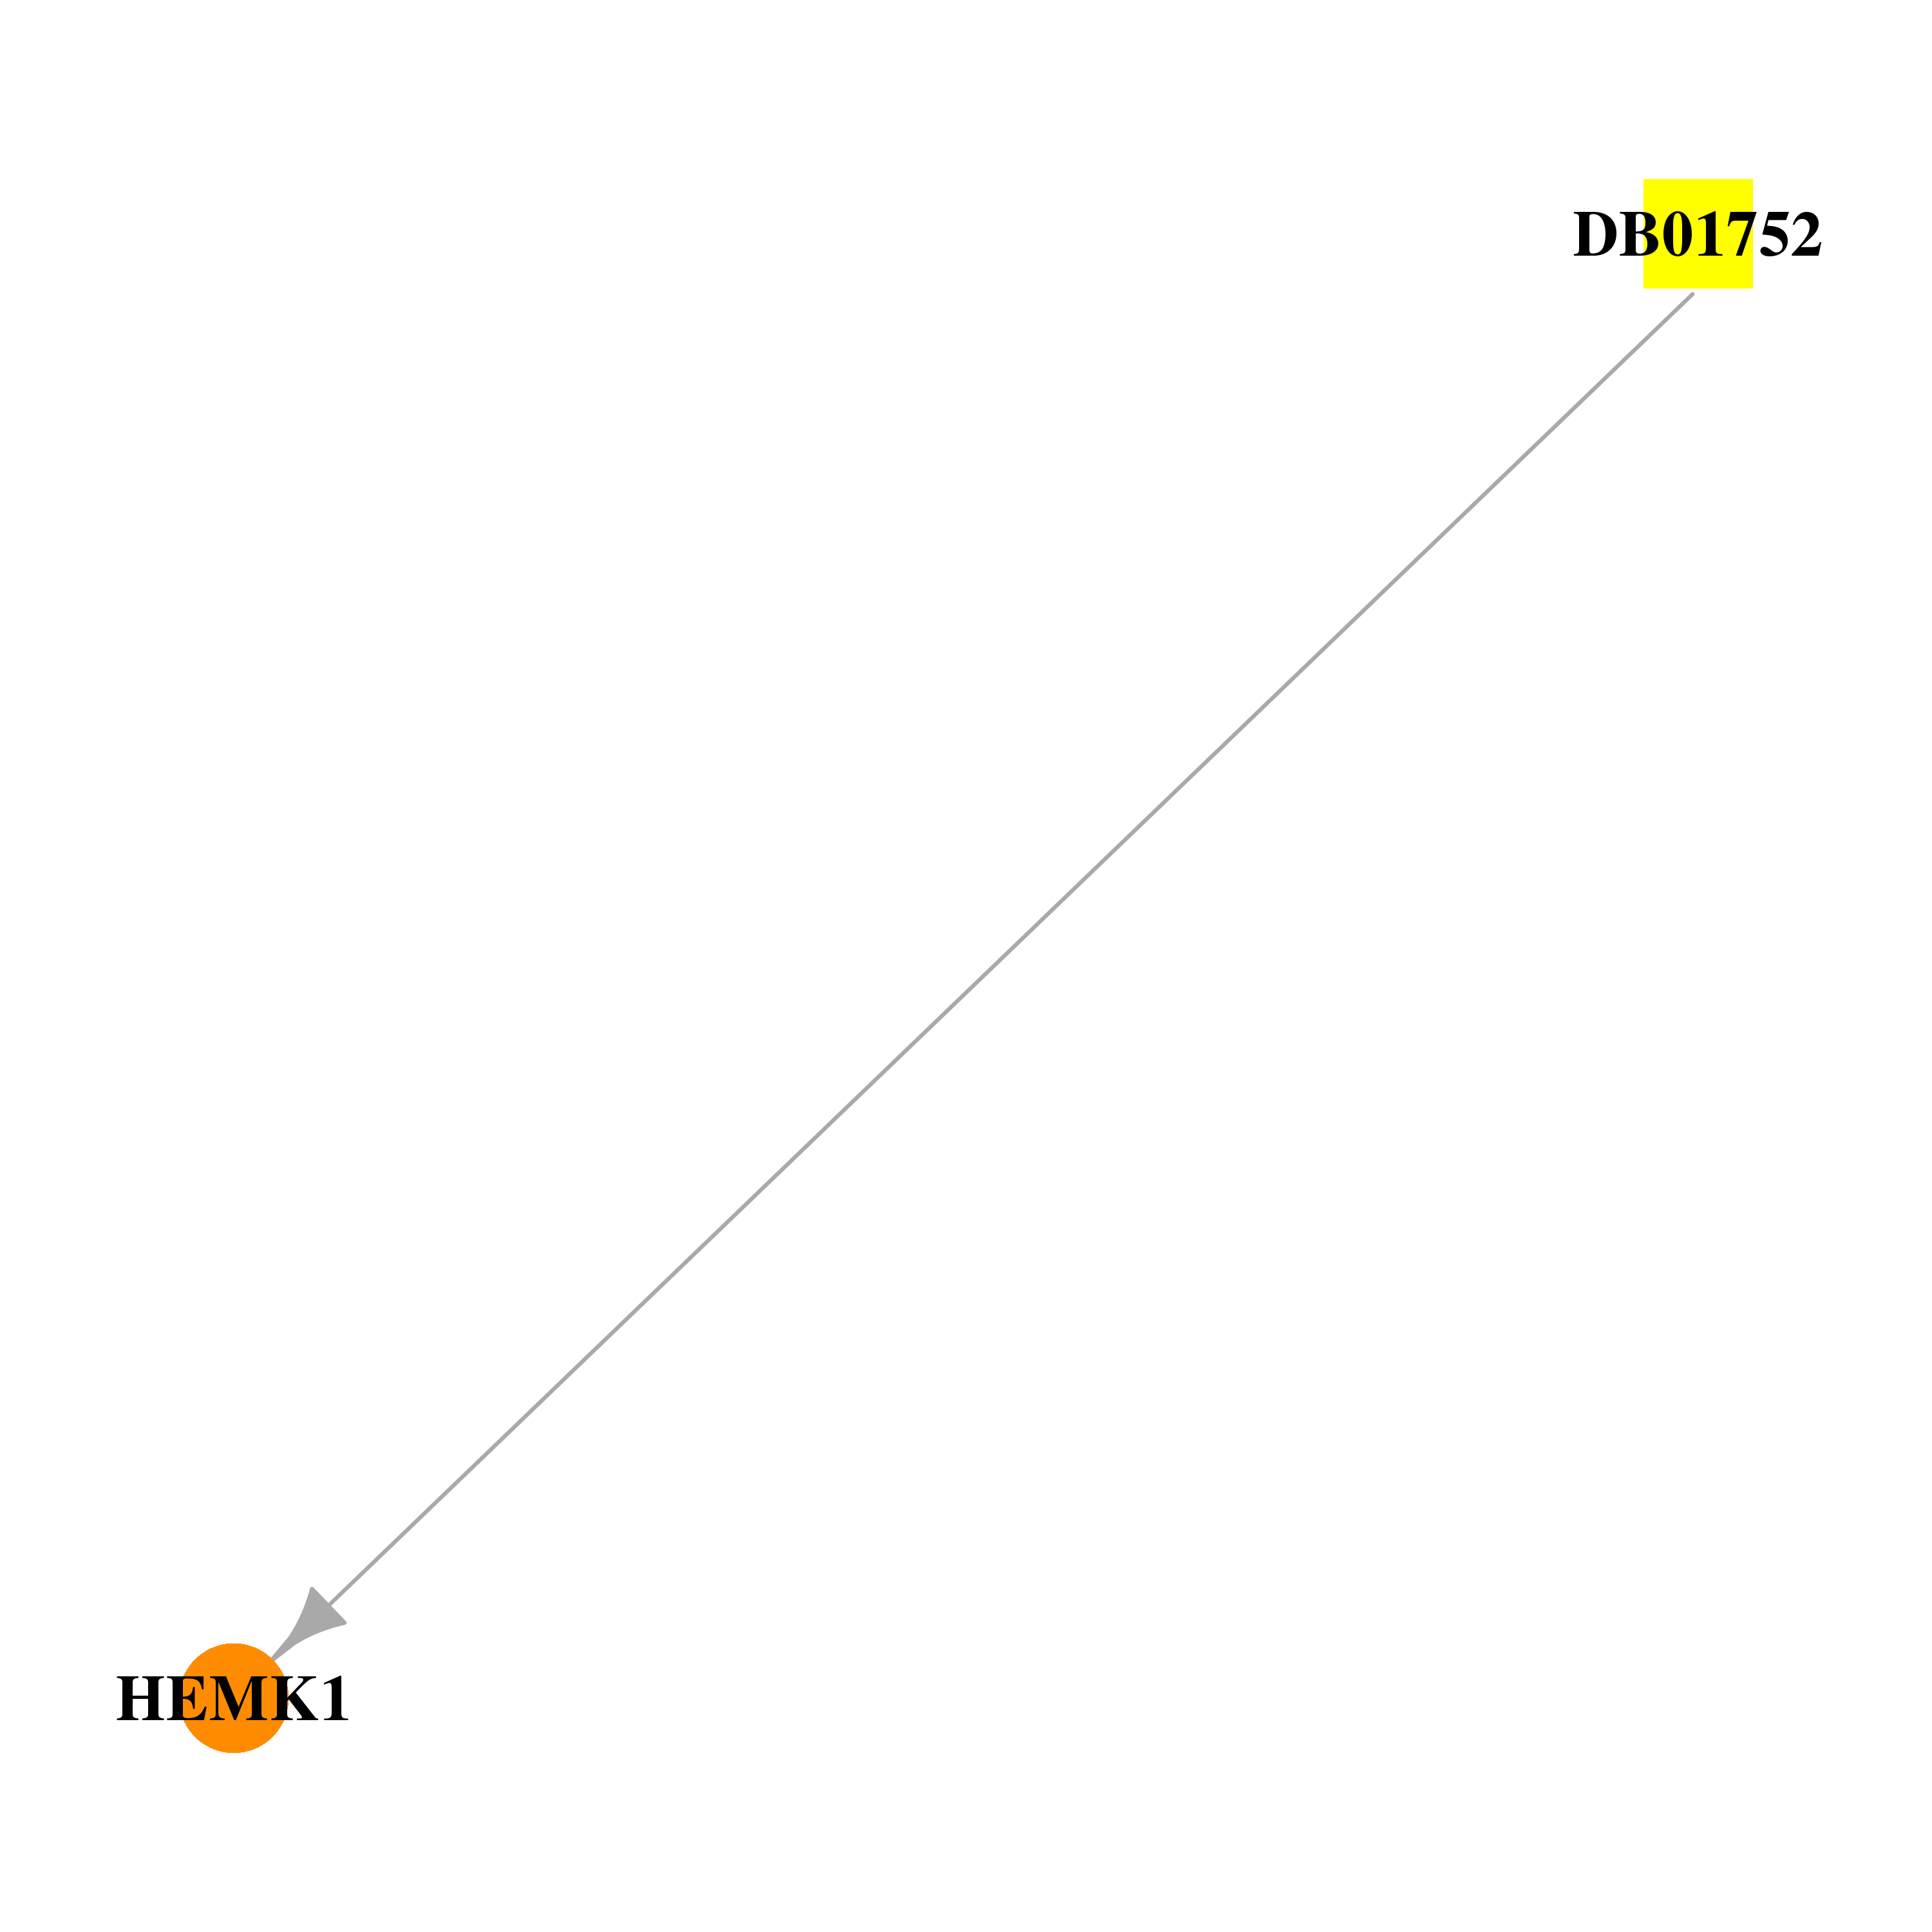 |
| * Drug Centered Interaction Network. |
| DrugBank ID | Target Name | Drug Groups | Generic Name | Drug Centered Network | Drug Structure |
| DB01752 | HemK methyltransferase family member 1 | experimental | S-Adenosyl-L-Homocysteine |  | 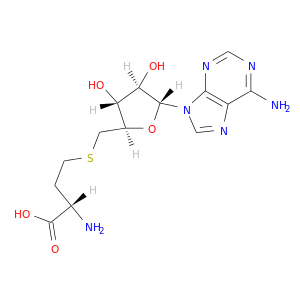 |
| Top |
| Cross referenced IDs for HEMK1 |
| * We obtained these cross-references from Uniprot database. It covers 150 different DBs, 18 categories. http://www.uniprot.org/help/cross_references_section |
: Open all cross reference information
|
Copyright © 2016-Present - The Univsersity of Texas Health Science Center at Houston @ |