|
||||||||||||||||||||
| |
| Phenotypic Information (metabolism pathway, cancer, disease, phenome) |
| |
| |
| Gene-Gene Network Information: Co-Expression Network, Interacting Genes & KEGG |
| |
|


| Gene Summary for PDE6D |
| Top |
| Phenotypic Information for PDE6D(metabolism pathway, cancer, disease, phenome) |
| Cancer | CGAP: PDE6D |
| Familial Cancer Database: PDE6D | |
| * This gene is included in those cancer gene databases. |
|
|
|
|
|
| . | ||||||||||||||
Oncogene 1 | Significant driver gene in | |||||||||||||||||||
| cf) number; DB name 1 Oncogene; http://nar.oxfordjournals.org/content/35/suppl_1/D721.long, 2 Tumor Suppressor gene; https://bioinfo.uth.edu/TSGene/, 3 Cancer Gene Census; http://www.nature.com/nrc/journal/v4/n3/abs/nrc1299.html, 4 CancerGenes; http://nar.oxfordjournals.org/content/35/suppl_1/D721.long, 5 Network of Cancer Gene; http://ncg.kcl.ac.uk/index.php, 1Therapeutic Vulnerabilities in Cancer; http://cbio.mskcc.org/cancergenomics/statius/ |
| KEGG_PURINE_METABOLISM | |
| OMIM | |
| Orphanet | |
| Disease | KEGG Disease: PDE6D |
| MedGen: PDE6D (Human Medical Genetics with Condition) | |
| ClinVar: PDE6D | |
| Phenotype | MGI: PDE6D (International Mouse Phenotyping Consortium) |
| PhenomicDB: PDE6D | |
| Mutations for PDE6D |
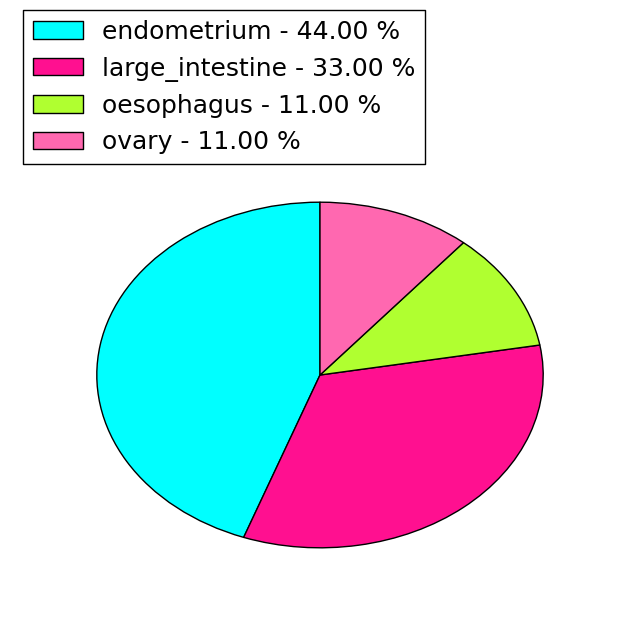
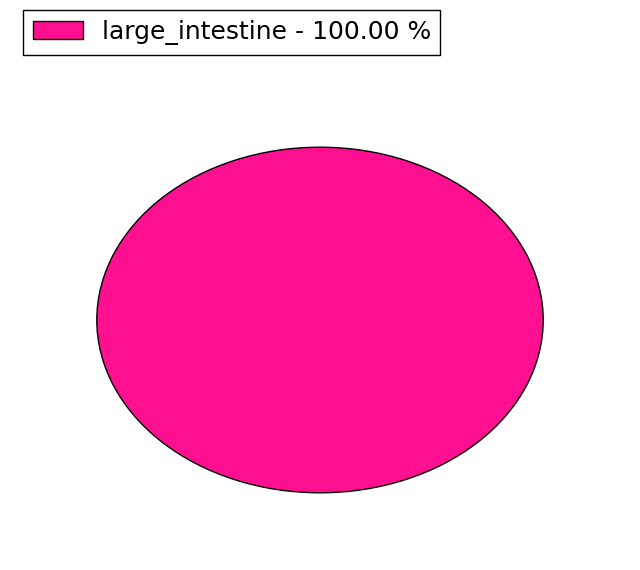
| * Under tables are showing count per each tissue to give us broad intuition about tissue specific mutation patterns.You can go to the detailed page for each mutation database's web site. |
| - Statistics for Tissue and Mutation type | Top |
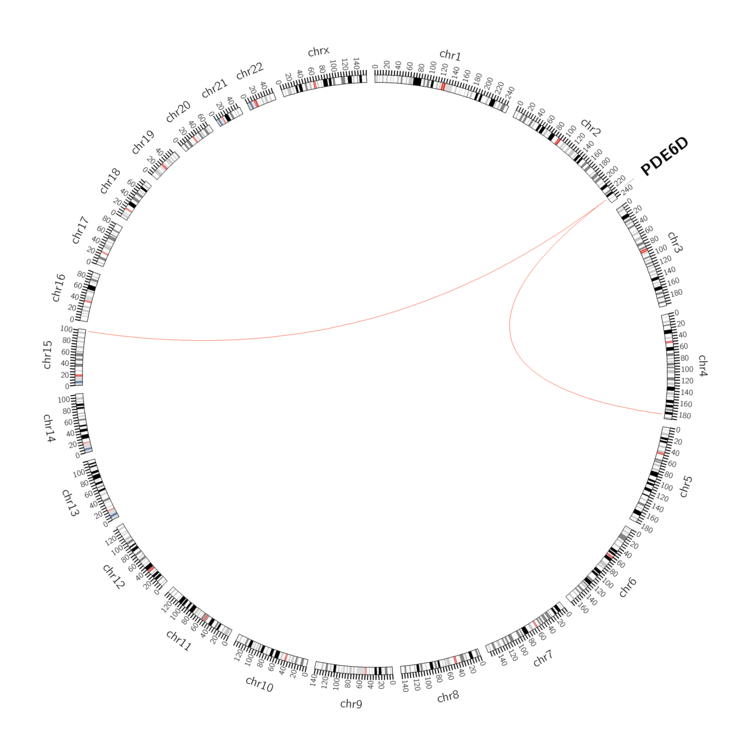 |
| - For Inter-chromosomal Variations |
| * Inter-chromosomal variantions includes 'interchromosomal amplicon to amplicon', 'interchromosomal amplicon to non-amplified dna', 'interchromosomal insertion', 'Interchromosomal unknown type'. |
 |
| - For Intra-chromosomal Variations |
| There's no intra-chromosomal structural variation. |
| Sample | Symbol_a | Chr_a | Start_a | End_a | Symbol_b | Chr_b | Start_b | End_b |
| large_intestine | PDE6D | chr2 | 232622796 | 232622796 | chr4 | 183163103 | 183163103 | |
| ovary | PDE6D | chr2 | 232611819 | 232611839 | chr15 | 100299298 | 100299318 |
| cf) Tissue number; Tissue name (1;Breast, 2;Central_nervous_system, 3;Haematopoietic_and_lymphoid_tissue, 4;Large_intestine, 5;Liver, 6;Lung, 7;Ovary, 8;Pancreas, 9;Prostate, 10;Skin, 11;Soft_tissue, 12;Upper_aerodigestive_tract) |
| * From mRNA Sanger sequences, Chitars2.0 arranged chimeric transcripts. This table shows PDE6D related fusion information. |
| ID | Head Gene | Tail Gene | Accession | Gene_a | qStart_a | qEnd_a | Chromosome_a | tStart_a | tEnd_a | Gene_a | qStart_a | qEnd_a | Chromosome_a | tStart_a | tEnd_a |
| BC004322 | RHBDD2 | 39 | 1462 | 7 | 75511217 | 75518244 | PDE6D | 1461 | 2597 | 2 | 232597140 | 232645986 | |
| AJ001626 | PDE6D | 1 | 597 | 2 | 232597635 | 232645953 | PDE6D | 592 | 832 | 2 | 232597697 | 232602809 | |
| AV724446 | ADAMTS4 | 1 | 322 | 1 | 161168402 | 161168723 | PDE6D | 312 | 465 | 2 | 232597175 | 232597328 | |
| Top |
| There's no copy number variation information in COSMIC data for this gene. |
| Top |
|
 |
| Top |
| Stat. for Non-Synonymous SNVs (# total SNVs=9) | (# total SNVs=1) |
 |  |
(# total SNVs=1) | (# total SNVs=0) |
 |
| Top |
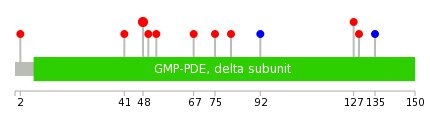
| * When you move the cursor on each content, you can see more deailed mutation information on the Tooltip. Those are primary_site,primary_histology,mutation(aa),pubmedID. |
| GRCh37 position | Mutation(aa) | Unique sampleID count |
| chr2:232602845-232602845 | p.R48H | 3 |
| chr2:232602839-232602839 | p.P50L | 1 |
| chr2:232597710-232597710 | p.D135D | 1 |
| chr2:232597730-232597730 | p.I129V | 1 |
| chr2:232603828-232603828 | p.P41S | 1 |
| chr2:232597735-232597735 | p.V127A | 1 |
| chr2:232645820-232645820 | p.S2L | 1 |
| chr2:232601992-232601992 | p.F92F | 1 |
| chr2:232602730-232602730 | p.C86* | 1 |
| chr2:232602747-232602747 | p.Y81N | 1 |
| Top |
|
 |
| Point Mutation/ Tissue ID | 1 | 2 | 3 | 4 | 5 | 6 | 7 | 8 | 9 | 10 | 11 | 12 | 13 | 14 | 15 | 16 | 17 | 18 | 19 | 20 |
| # sample | 3 | 1 | 2 | 3 | ||||||||||||||||
| # mutation | 3 | 1 | 2 | 2 | ||||||||||||||||
| nonsynonymous SNV | 2 | 1 | 2 | 2 | ||||||||||||||||
| synonymous SNV | 1 |
| cf) Tissue ID; Tissue type (1; BLCA[Bladder Urothelial Carcinoma], 2; BRCA[Breast invasive carcinoma], 3; CESC[Cervical squamous cell carcinoma and endocervical adenocarcinoma], 4; COAD[Colon adenocarcinoma], 5; GBM[Glioblastoma multiforme], 6; Glioma Low Grade, 7; HNSC[Head and Neck squamous cell carcinoma], 8; KICH[Kidney Chromophobe], 9; KIRC[Kidney renal clear cell carcinoma], 10; KIRP[Kidney renal papillary cell carcinoma], 11; LAML[Acute Myeloid Leukemia], 12; LUAD[Lung adenocarcinoma], 13; LUSC[Lung squamous cell carcinoma], 14; OV[Ovarian serous cystadenocarcinoma ], 15; PAAD[Pancreatic adenocarcinoma], 16; PRAD[Prostate adenocarcinoma], 17; SKCM[Skin Cutaneous Melanoma], 18:STAD[Stomach adenocarcinoma], 19:THCA[Thyroid carcinoma], 20:UCEC[Uterine Corpus Endometrial Carcinoma]) |
| Top |
| * We represented just top 10 SNVs. When you move the cursor on each content, you can see more deailed mutation information on the Tooltip. Those are primary_site, primary_histology, mutation(aa), pubmedID. |
| Genomic Position | Mutation(aa) | Unique sampleID count |
| chr2:232602845 | p.R48H,PDE6D | 2 |
| chr2:232597735 | p.V127A | 1 |
| chr2:232601992 | p.F92F | 1 |
| chr2:232602765 | p.R75C,PDE6D | 1 |
| chr2:232602788 | p.S67L,PDE6D | 1 |
| chr2:232602846 | p.R48S,PDE6D | 1 |
| chr2:232603828 | p.P41S,PDE6D | 1 |
| chr2:232645820 | p.S2L,PDE6D | 1 |
| * Copy number data were extracted from TCGA using R package TCGA-Assembler. The URLs of all public data files on TCGA DCC data server were gathered on Jan-05-2015. Function ProcessCNAData in TCGA-Assembler package was used to obtain gene-level copy number value which is calculated as the average copy number of the genomic region of a gene. |
 |
| cf) Tissue ID[Tissue type]: BLCA[Bladder Urothelial Carcinoma], BRCA[Breast invasive carcinoma], CESC[Cervical squamous cell carcinoma and endocervical adenocarcinoma], COAD[Colon adenocarcinoma], GBM[Glioblastoma multiforme], Glioma Low Grade, HNSC[Head and Neck squamous cell carcinoma], KICH[Kidney Chromophobe], KIRC[Kidney renal clear cell carcinoma], KIRP[Kidney renal papillary cell carcinoma], LAML[Acute Myeloid Leukemia], LUAD[Lung adenocarcinoma], LUSC[Lung squamous cell carcinoma], OV[Ovarian serous cystadenocarcinoma ], PAAD[Pancreatic adenocarcinoma], PRAD[Prostate adenocarcinoma], SKCM[Skin Cutaneous Melanoma], STAD[Stomach adenocarcinoma], THCA[Thyroid carcinoma], UCEC[Uterine Corpus Endometrial Carcinoma] |
| Top |
| Gene Expression for PDE6D |
| * CCLE gene expression data were extracted from CCLE_Expression_Entrez_2012-10-18.res: Gene-centric RMA-normalized mRNA expression data. |
 |
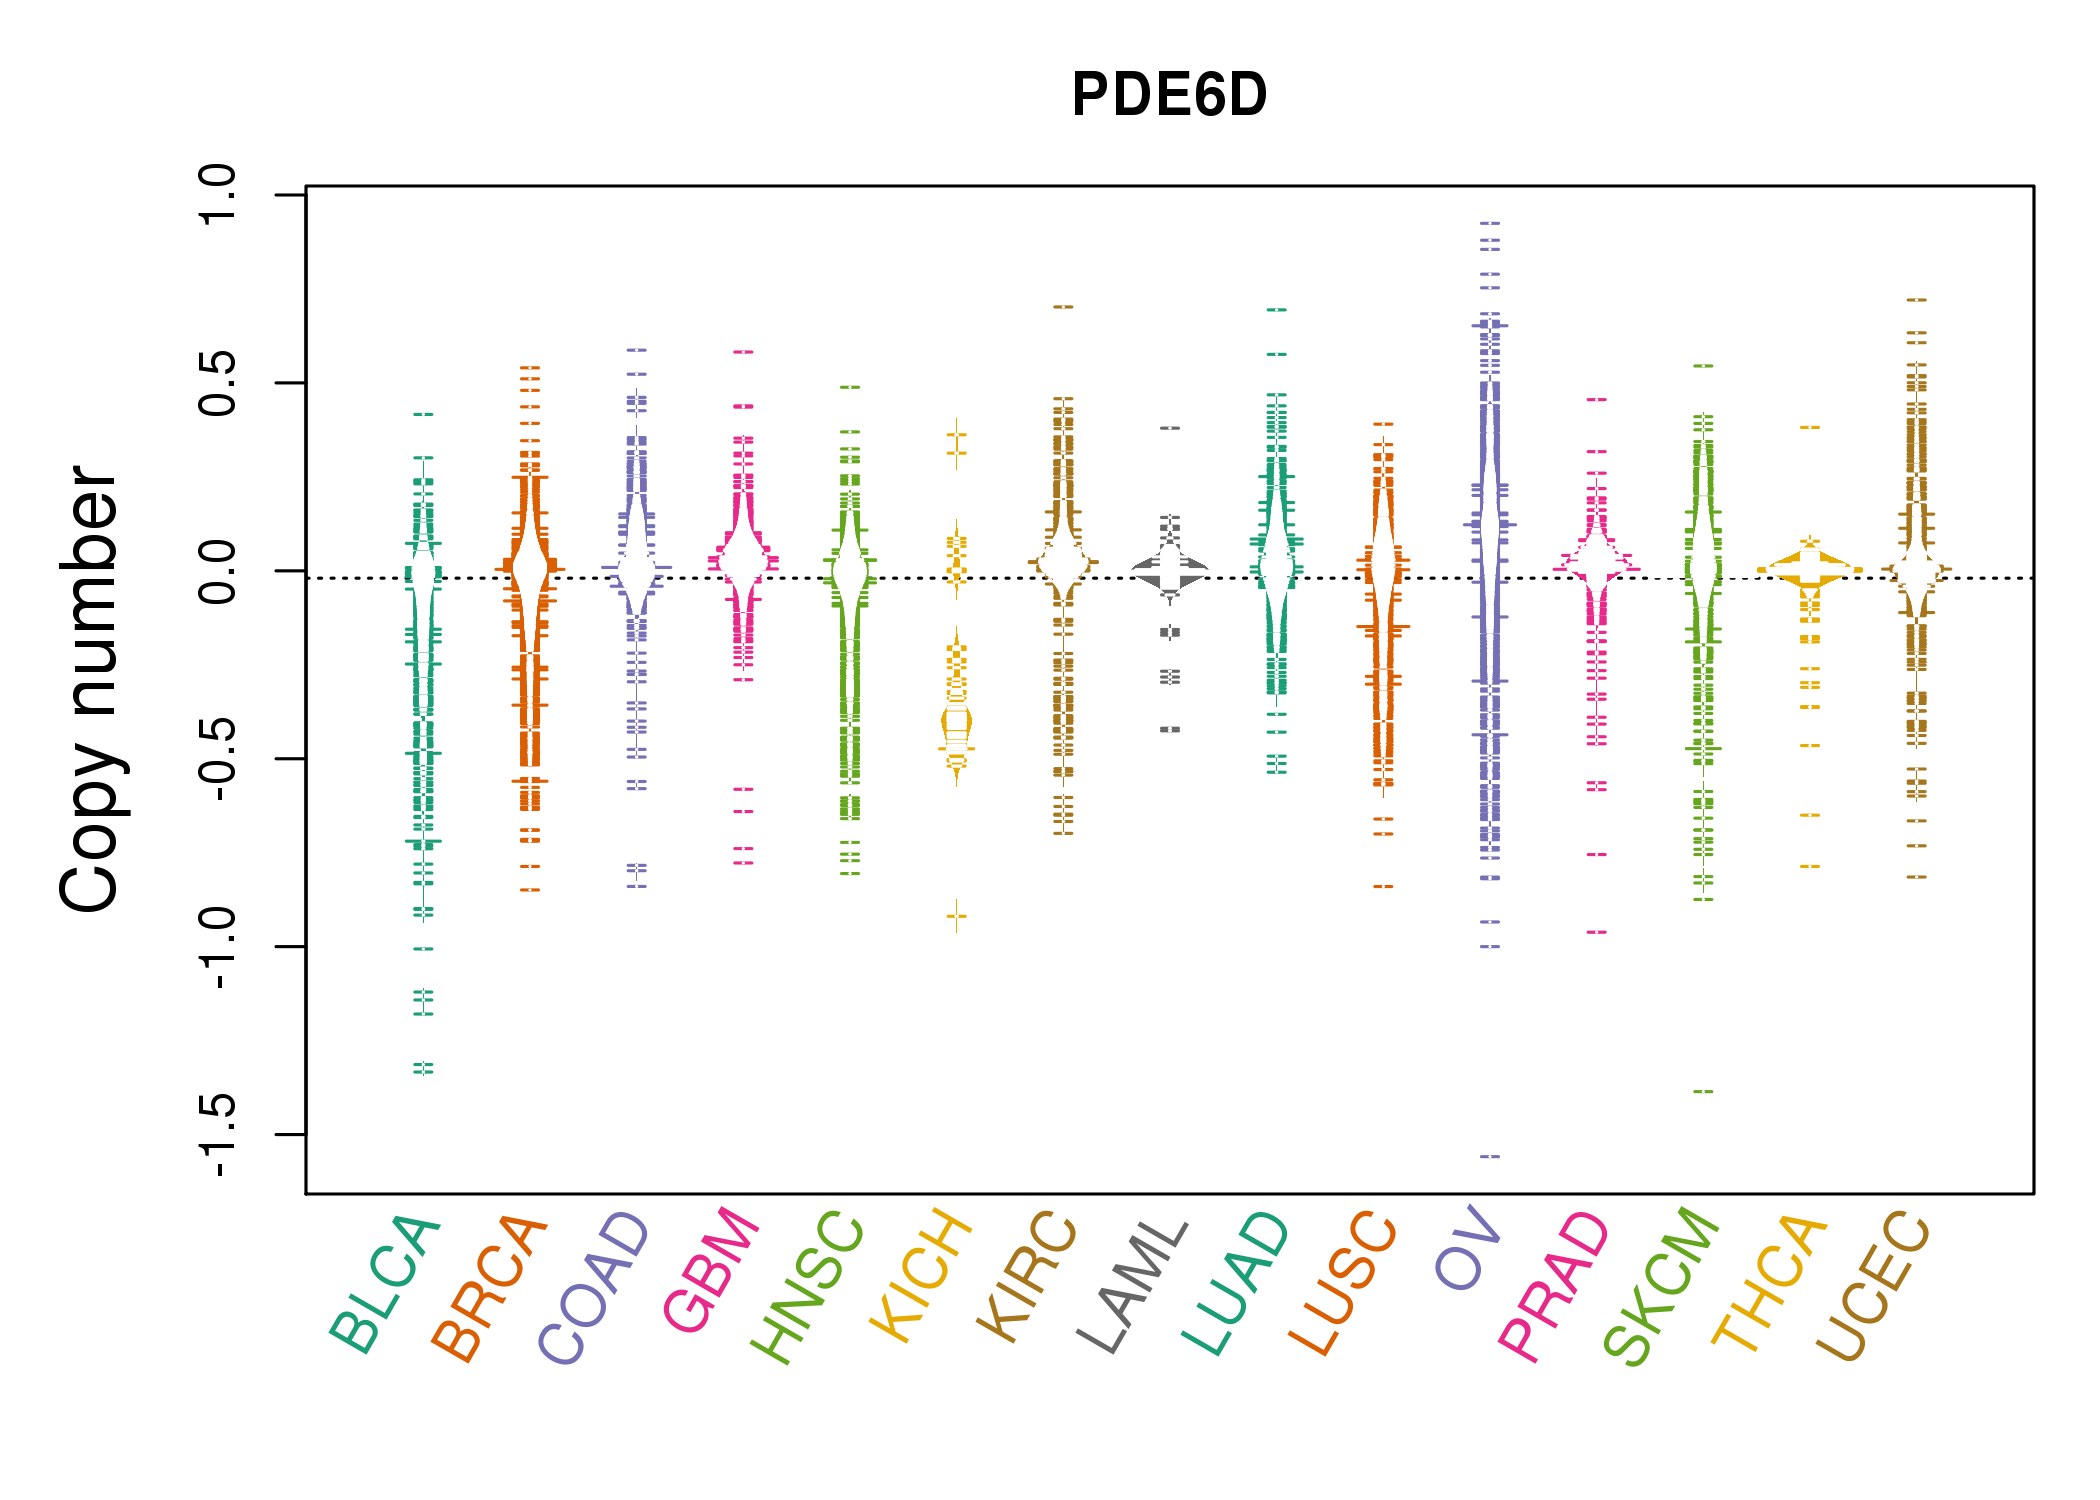
| * Normalized gene expression data of RNASeqV2 was extracted from TCGA using R package TCGA-Assembler. The URLs of all public data files on TCGA DCC data server were gathered at Jan-05-2015. Only eight cancer types have enough normal control samples for differential expression analysis. (t test, adjusted p<0.05 (using Benjamini-Hochberg FDR)) |
 |
| Top |
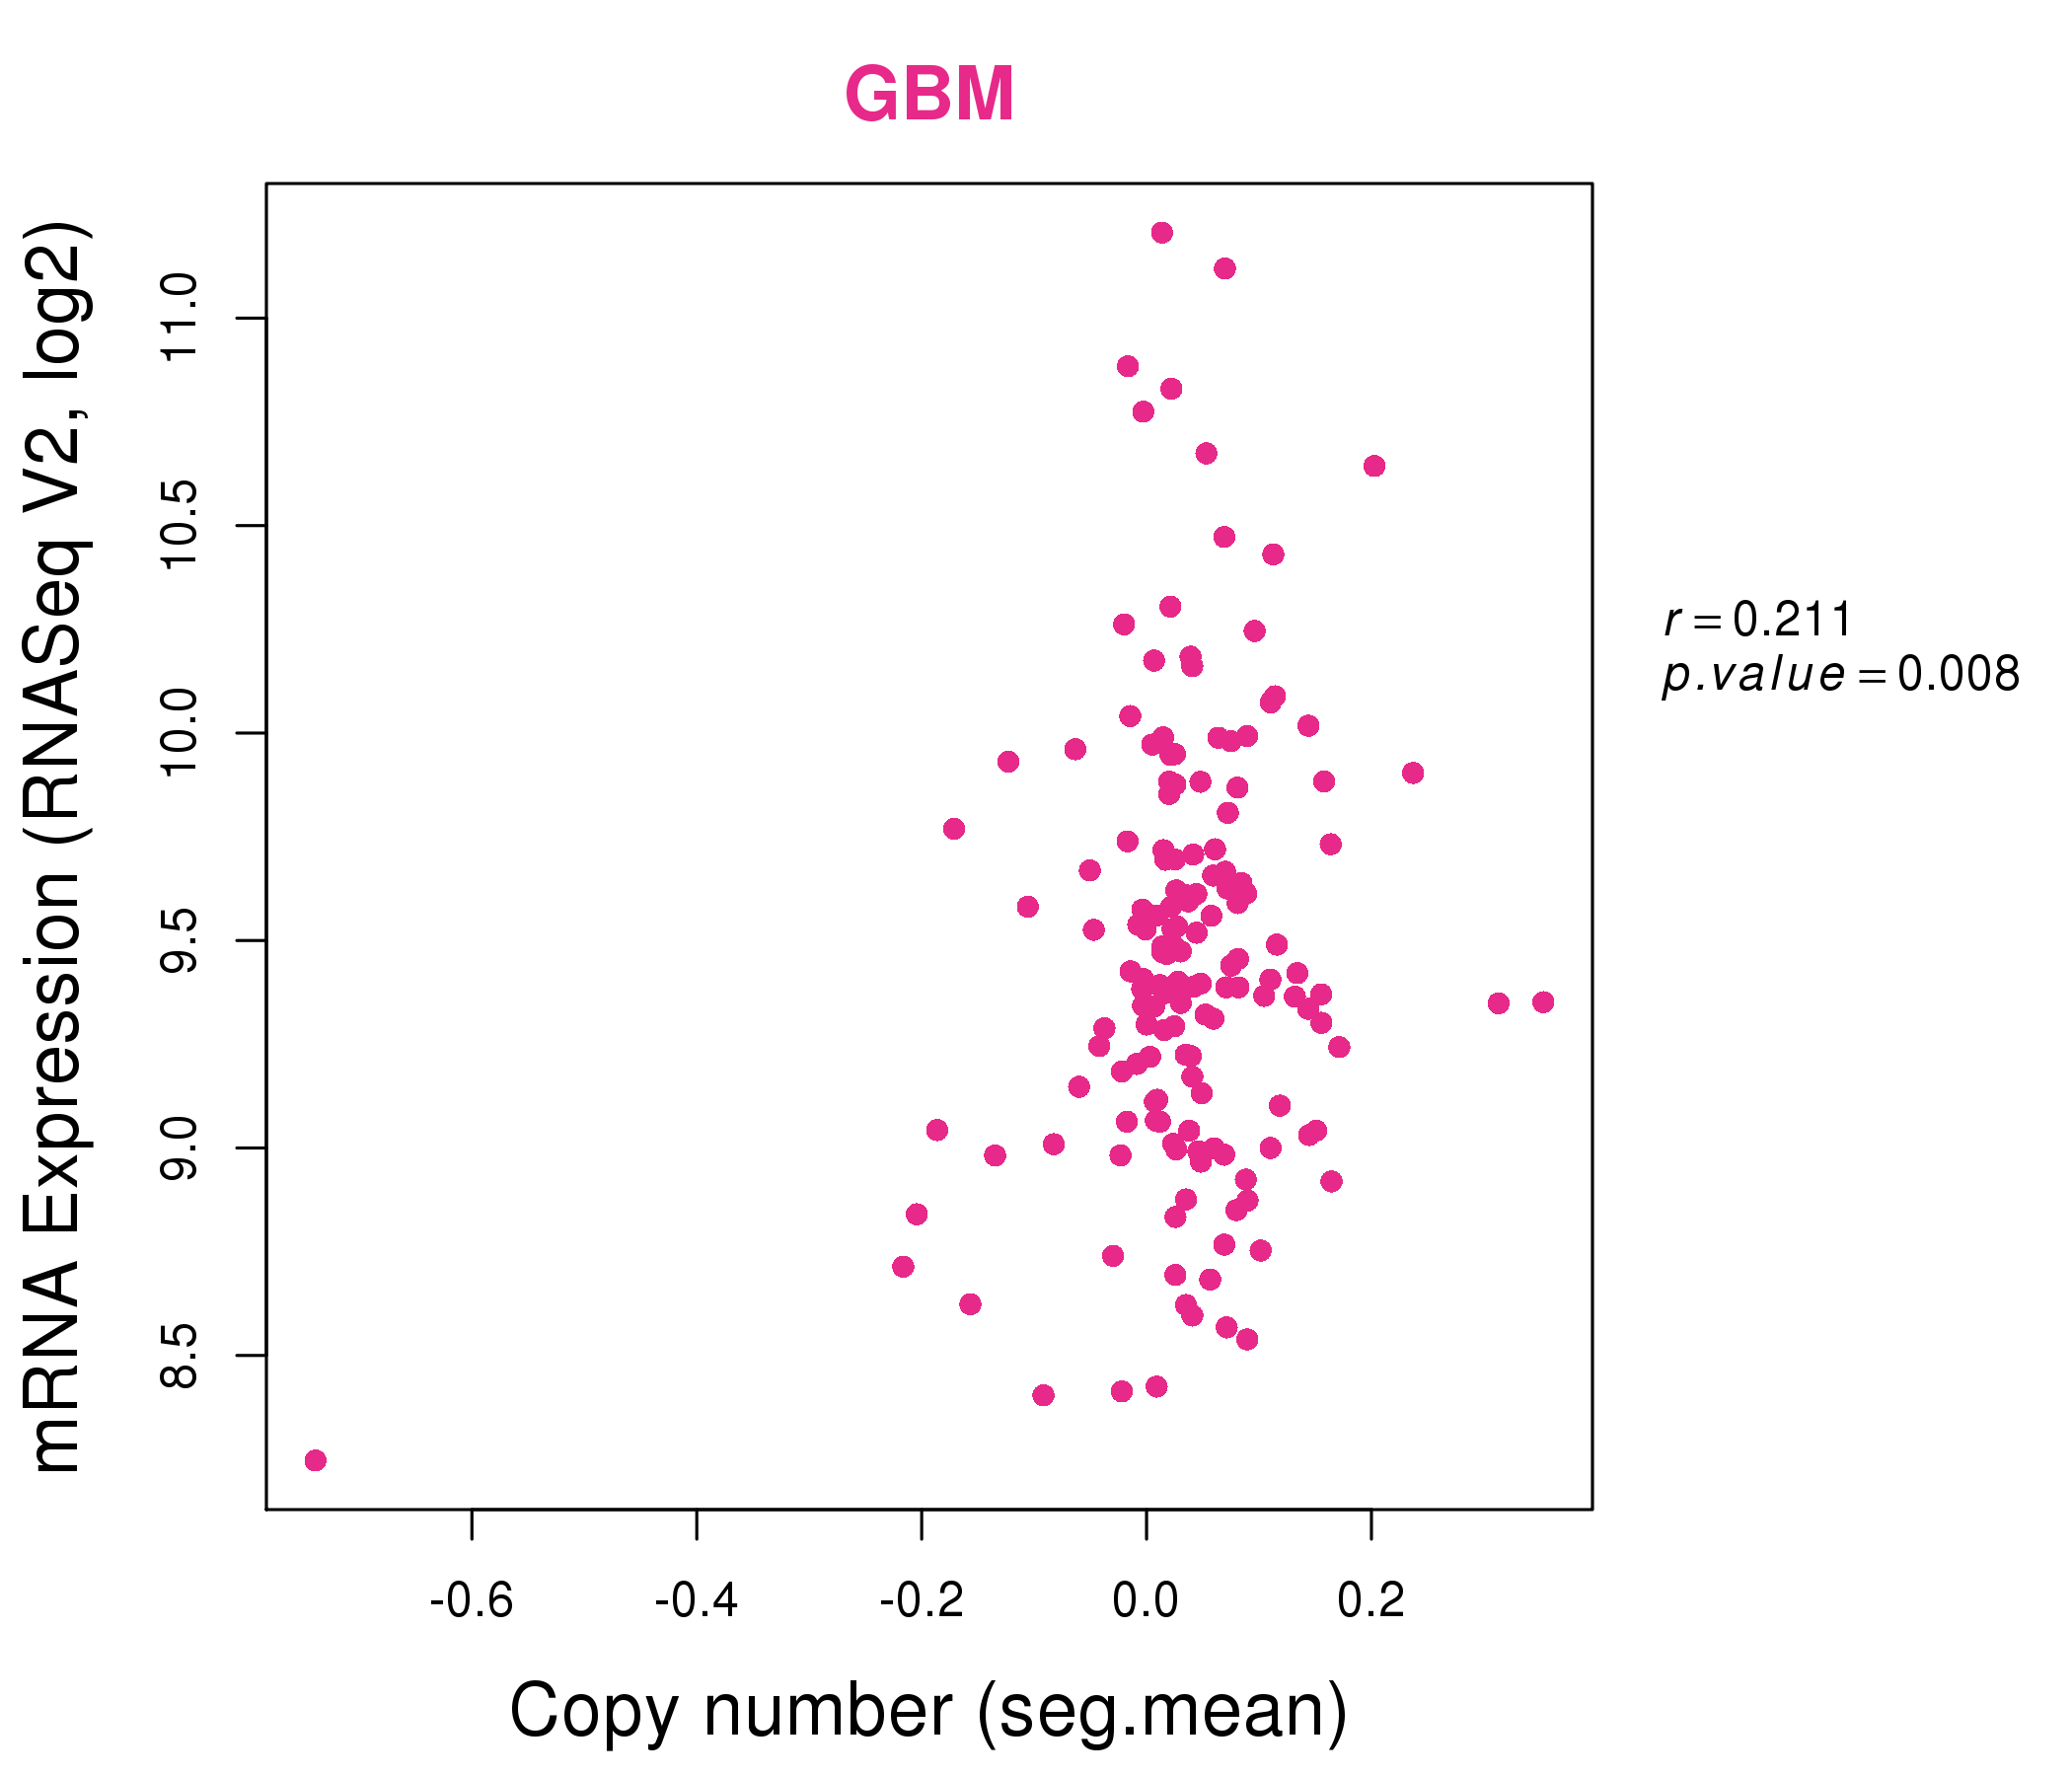
| * This plots show the correlation between CNV and gene expression. |
: Open all plots for all cancer types
 |
|
 |
|

| Top |
| Gene-Gene Network Information |
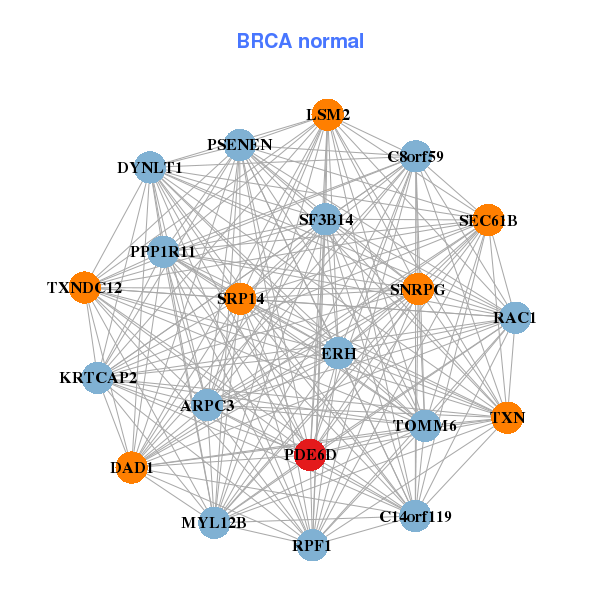
| * Co-Expression network figures were drawn using R package igraph. Only the top 20 genes with the highest correlations were shown. Red circle: input gene, orange circle: cell metabolism gene, sky circle: other gene |
: Open all plots for all cancer types
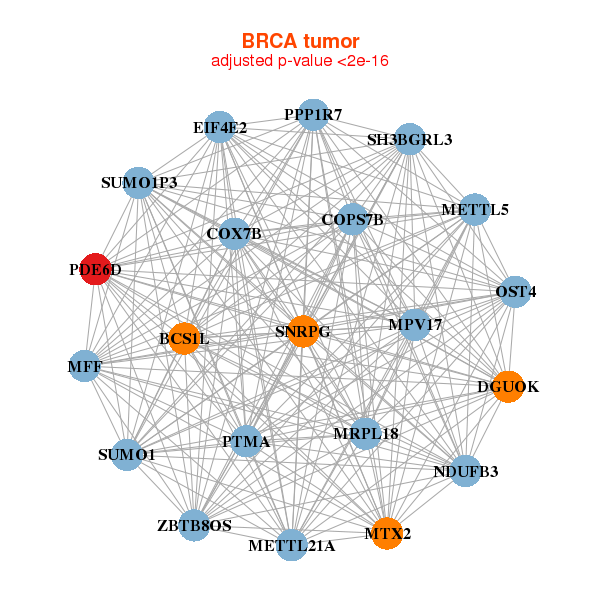 |
| ||||
| BCS1L,COPS7B,COX7B,DGUOK,EIF4E2,METTL21A,METTL5, MFF,MPV17,MRPL18,MTX2,NDUFB3,OST4,PDE6D, PPP1R7,PTMA,SH3BGRL3,SNRPG,SUMO1,SUMO1P3,ZBTB8OS | ARPC3,C14orf119,C8orf59,DAD1,DYNLT1,ERH,KRTCAP2, LSM2,MYL12B,PDE6D,PPP1R11,PSENEN,RAC1,RPF1, SEC61B,SF3B14,SNRPG,SRP14,TOMM6,TXN,TXNDC12 | ||||
 |
| ||||
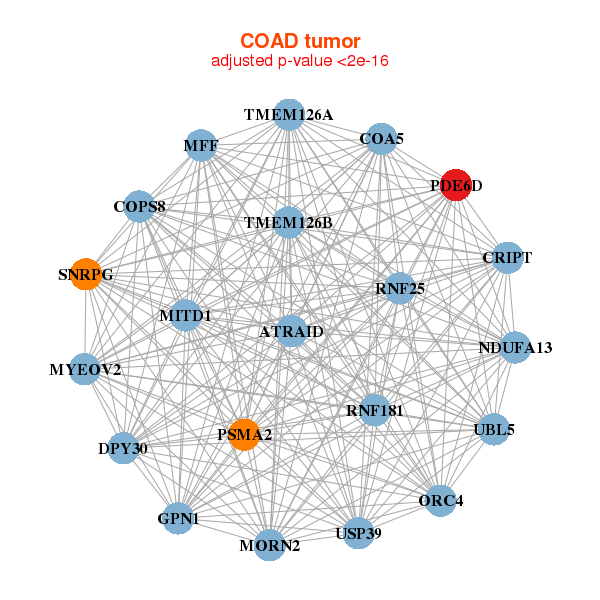
| ATRAID,COA5,COPS8,CRIPT,DPY30,GPN1,MFF, MITD1,MORN2,MYEOV2,NDUFA13,ORC4,PDE6D,PSMA2, RNF181,RNF25,SNRPG,TMEM126A,TMEM126B,UBL5,USP39 | ATP5O,C14orf119,C18orf21,CGRRF1,COMMD3,DCTN3,DPY30, GOLGA7,IAH1,NDUFA11,NDUFA6,NDUFV2,NSMCE2,PDE6D, PEX2,PPP1R8,SNX11,SRP14,SUPT4H1,TXNL1,UQCR11 |

| * Co-Expression network figures were drawn using R package igraph. Only the top 20 genes with the highest correlations were shown. Red circle: input gene, orange circle: cell metabolism gene, sky circle: other gene |
: Open all plots for all cancer types
| Top |
: Open all interacting genes' information including KEGG pathway for all interacting genes from DAVID
| Top |
| Pharmacological Information for PDE6D |
| DB Category | DB Name | DB's ID and Url link |
| * Gene Centered Interaction Network. |
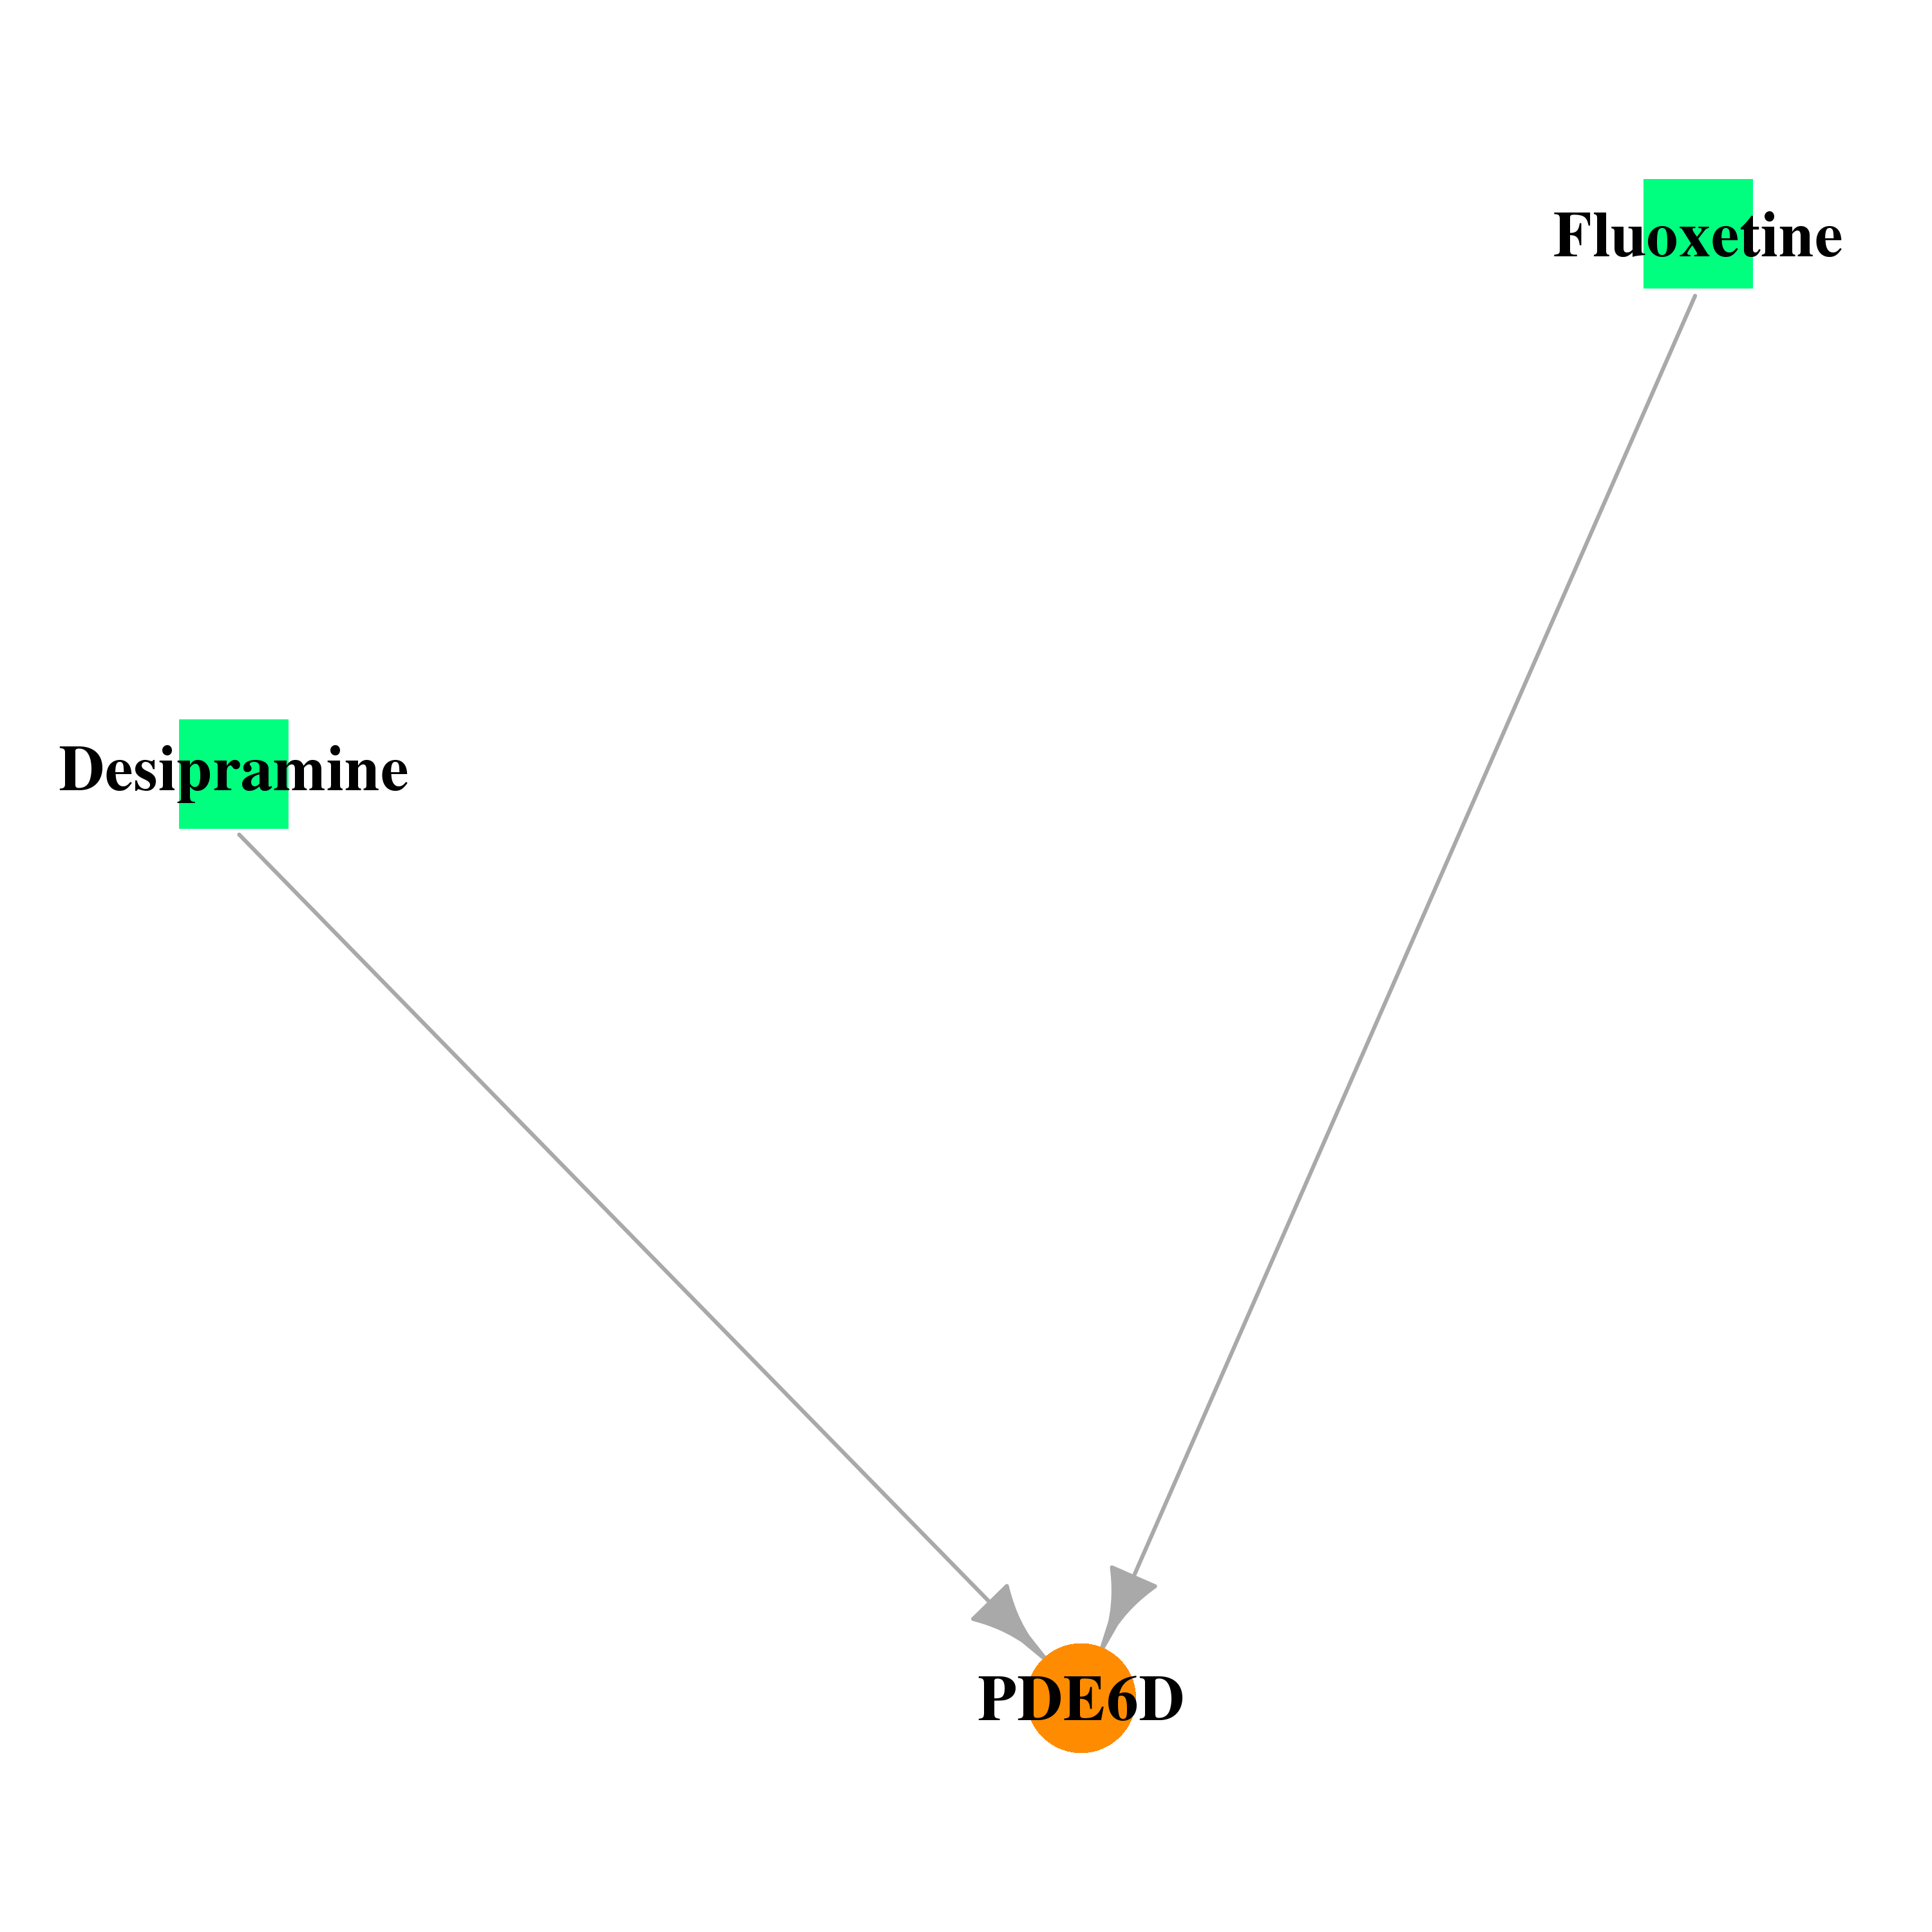 |
| * Drug Centered Interaction Network. |
| DrugBank ID | Target Name | Drug Groups | Generic Name | Drug Centered Network | Drug Structure |
| DB01151 | phosphodiesterase 6D, cGMP-specific, rod, delta | approved | Desipramine | 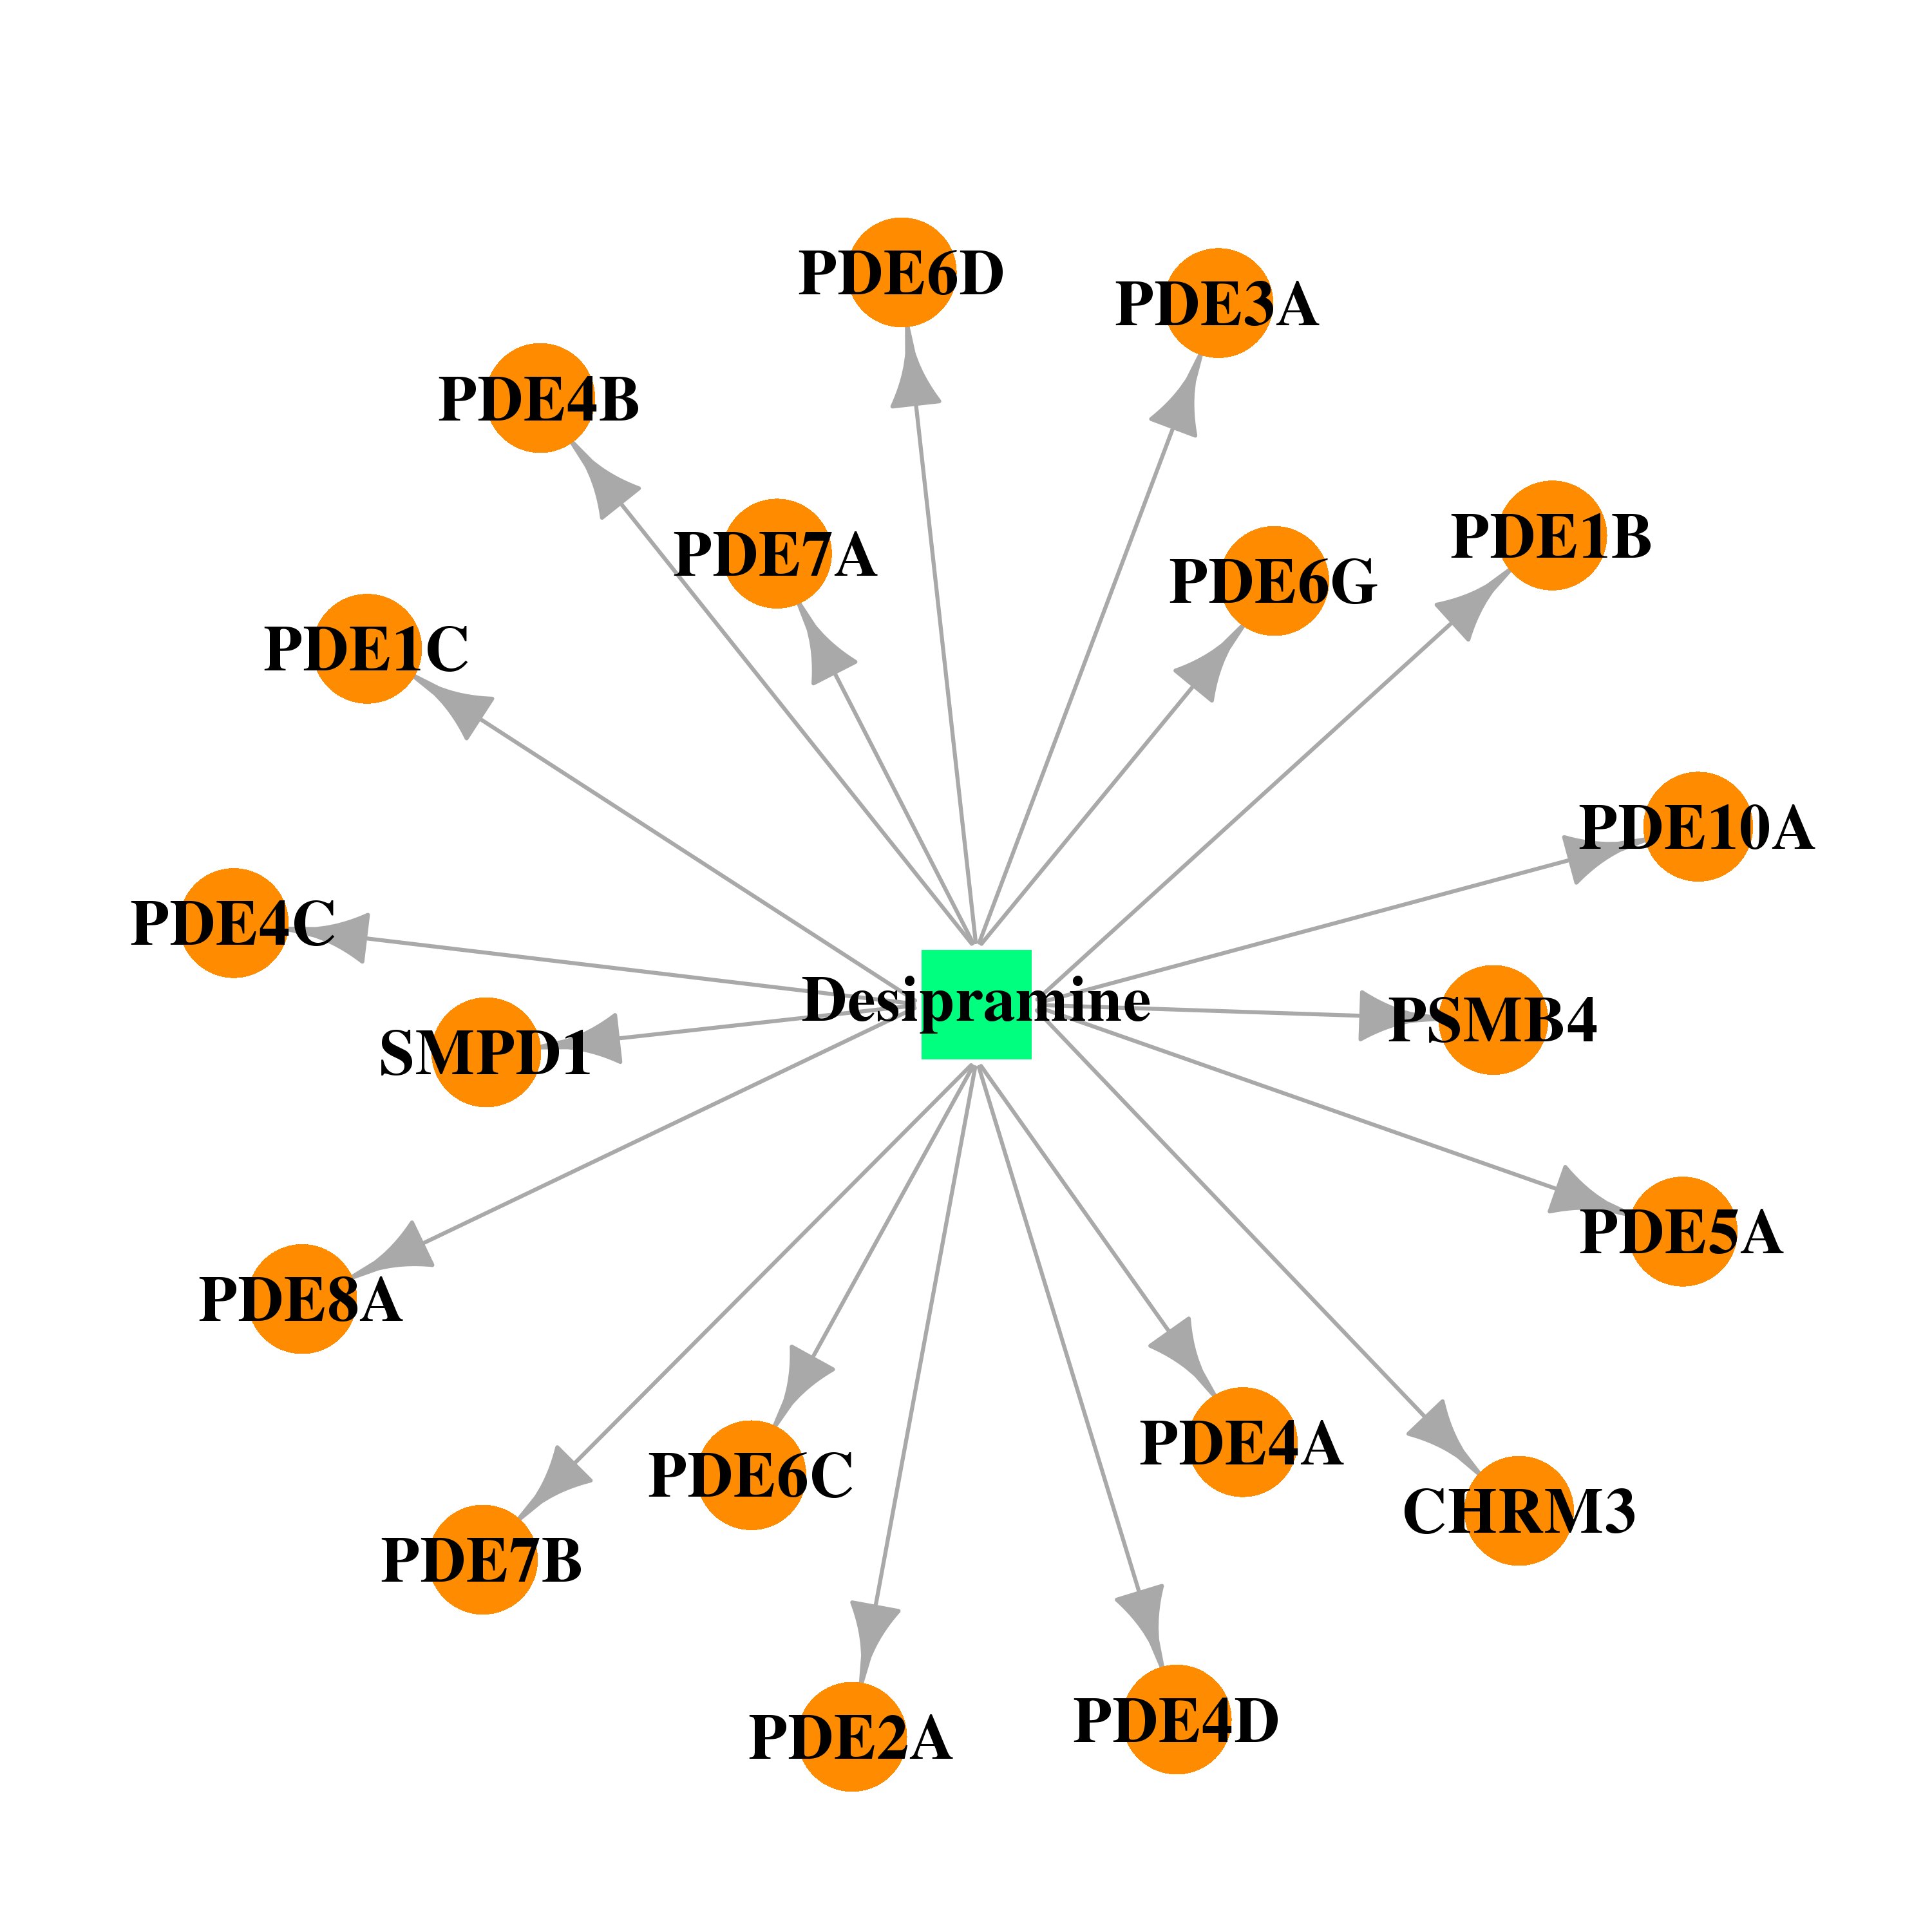 | 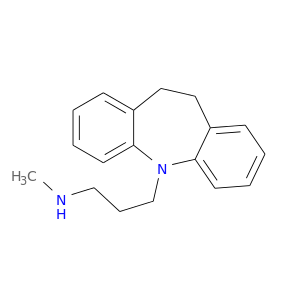 |
| DB00472 | phosphodiesterase 6D, cGMP-specific, rod, delta | approved | Fluoxetine | 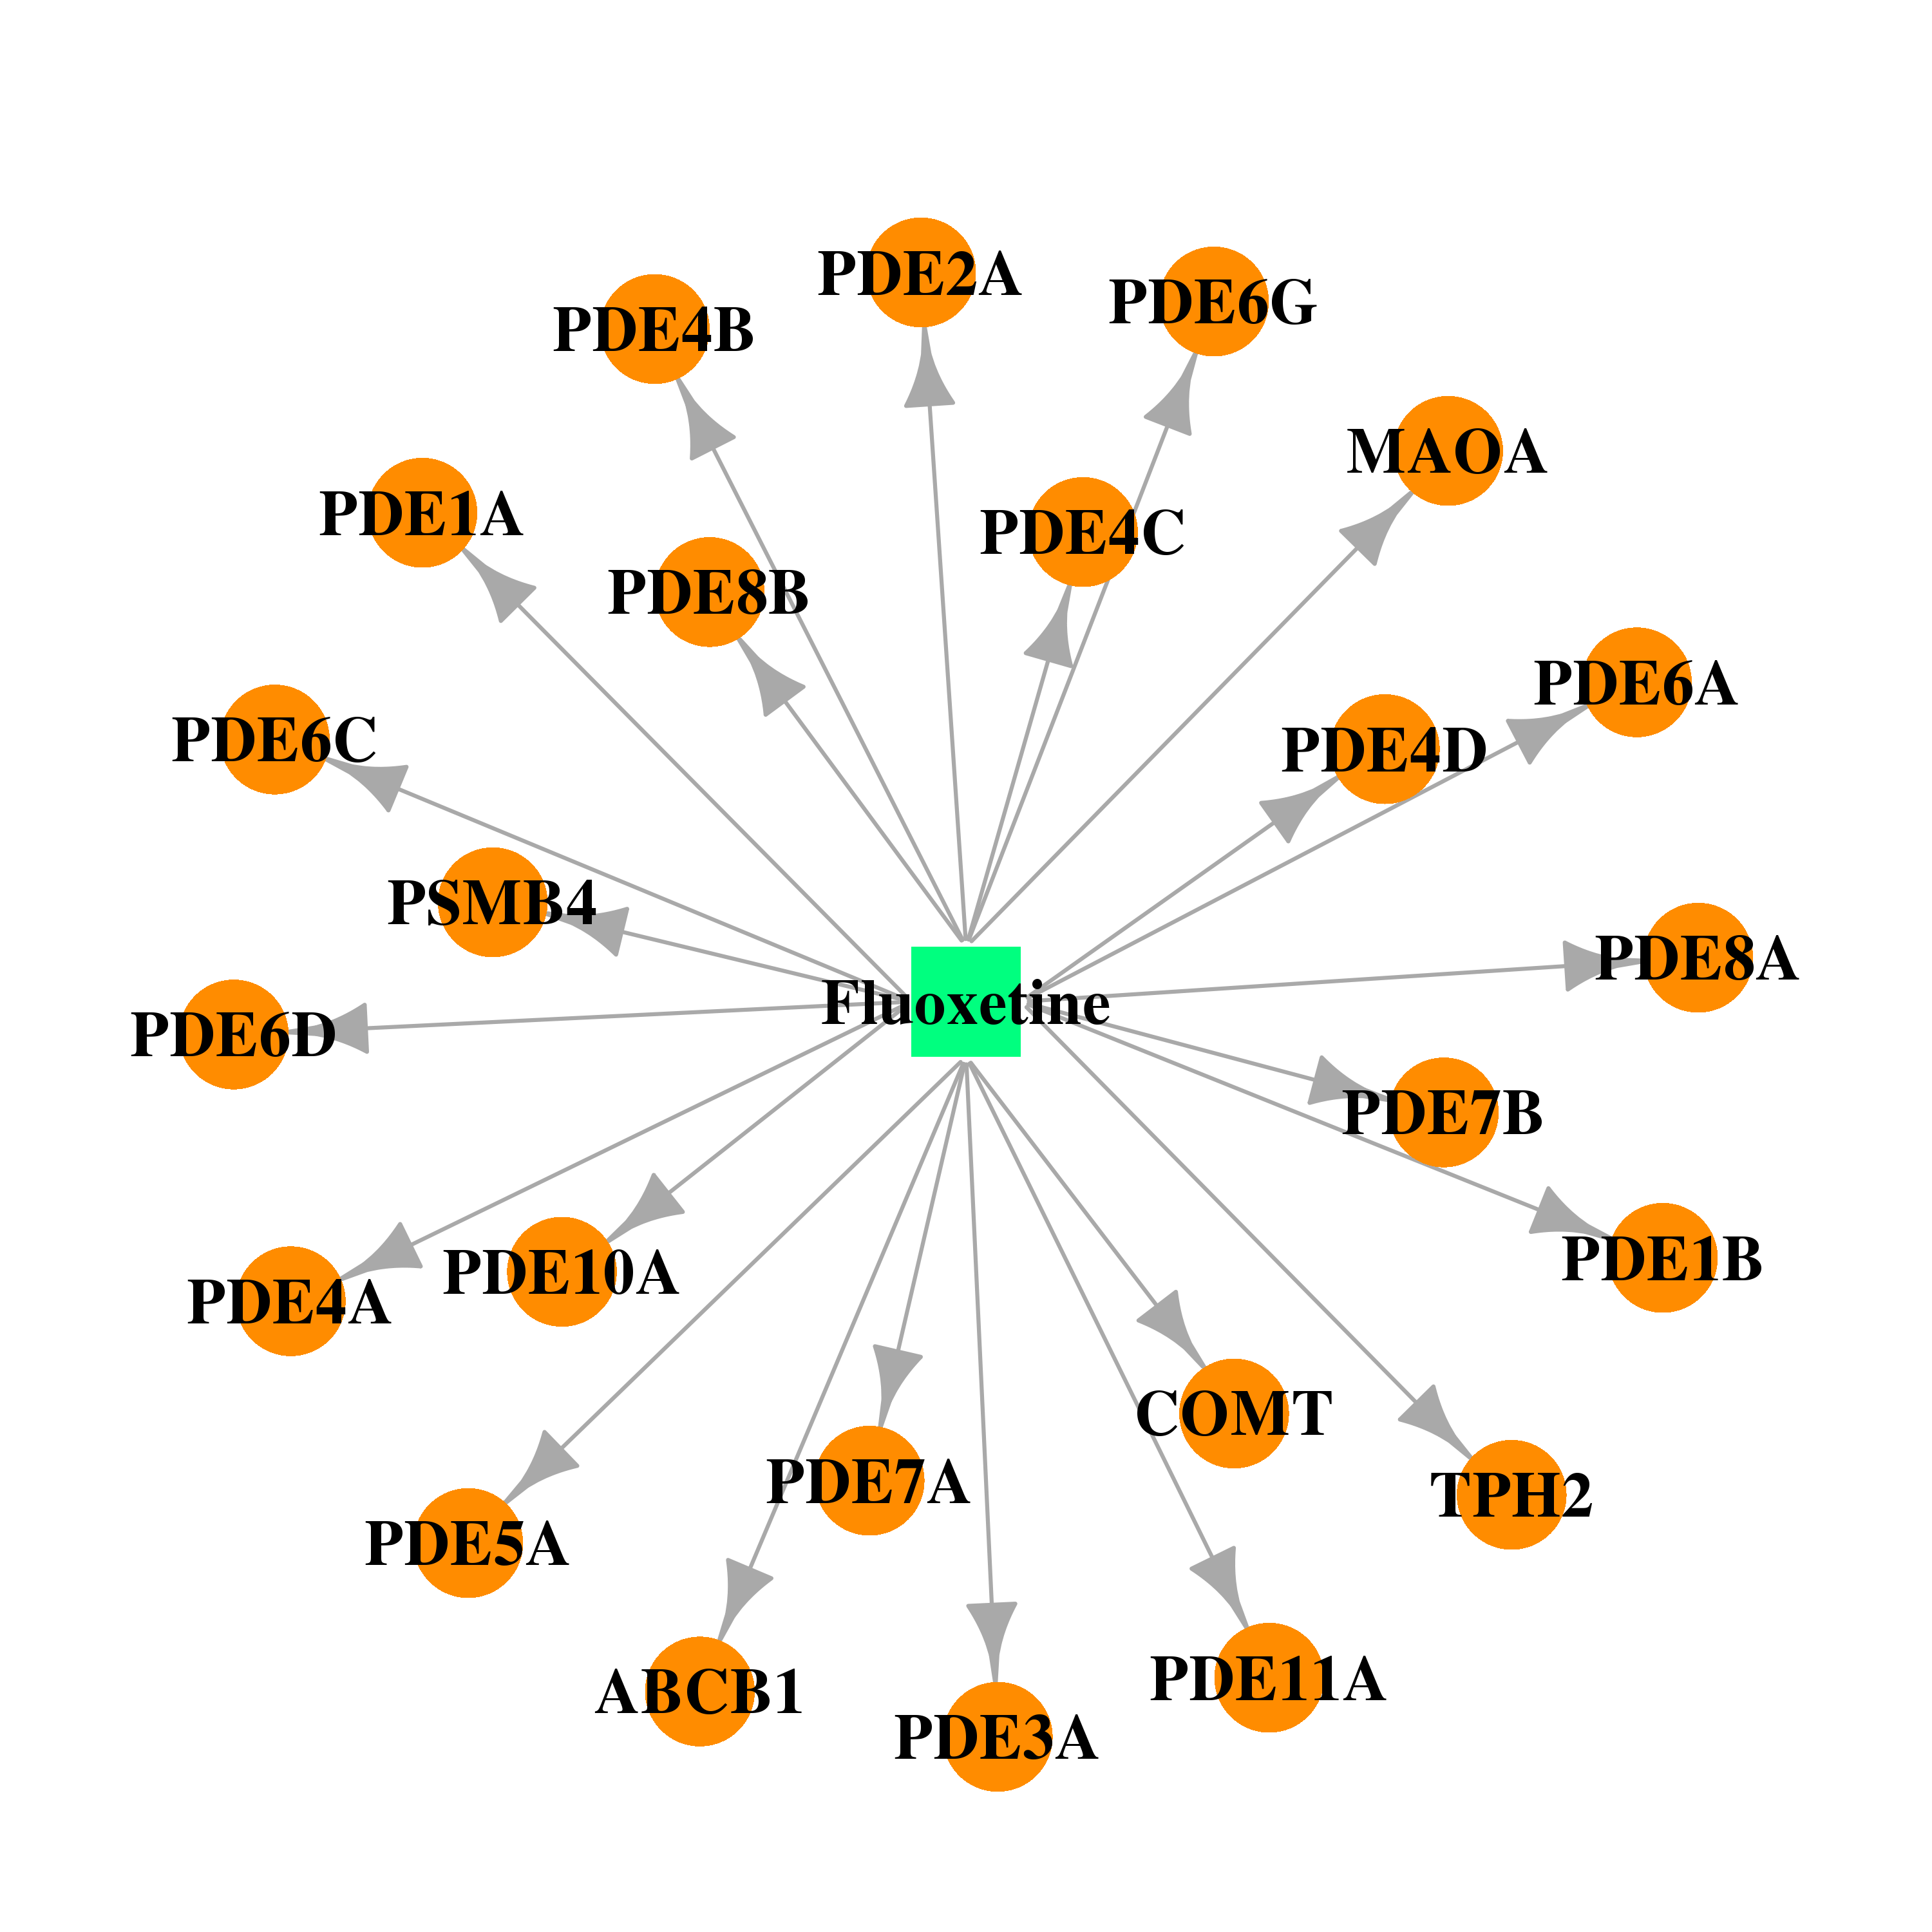 | 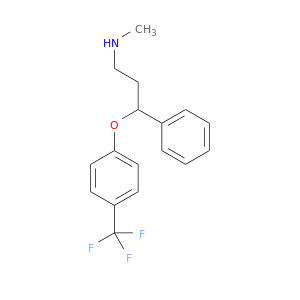 |
| Top |
| Cross referenced IDs for PDE6D |
| * We obtained these cross-references from Uniprot database. It covers 150 different DBs, 18 categories. http://www.uniprot.org/help/cross_references_section |
: Open all cross reference information
|
Copyright © 2016-Present - The Univsersity of Texas Health Science Center at Houston @ |