|
||||||||||||||||||||
| |
| Phenotypic Information (metabolism pathway, cancer, disease, phenome) |
| |
| |
| Gene-Gene Network Information: Co-Expression Network, Interacting Genes & KEGG |
| |
|


| Gene Summary for ISYNA1 |
| Top |
| Phenotypic Information for ISYNA1(metabolism pathway, cancer, disease, phenome) |
| Cancer | CGAP: ISYNA1 |
| Familial Cancer Database: ISYNA1 | |
| * This gene is included in those cancer gene databases. |
|
|
|
|
|
| . | ||||||||||||||
Oncogene 1 | Significant driver gene in | |||||||||||||||||||
| cf) number; DB name 1 Oncogene; http://nar.oxfordjournals.org/content/35/suppl_1/D721.long, 2 Tumor Suppressor gene; https://bioinfo.uth.edu/TSGene/, 3 Cancer Gene Census; http://www.nature.com/nrc/journal/v4/n3/abs/nrc1299.html, 4 CancerGenes; http://nar.oxfordjournals.org/content/35/suppl_1/D721.long, 5 Network of Cancer Gene; http://ncg.kcl.ac.uk/index.php, 1Therapeutic Vulnerabilities in Cancer; http://cbio.mskcc.org/cancergenomics/statius/ |
| KEGG_INOSITOL_PHOSPHATE_METABOLISM | |
| OMIM | |
| Orphanet | |
| Disease | KEGG Disease: ISYNA1 |
| MedGen: ISYNA1 (Human Medical Genetics with Condition) | |
| ClinVar: ISYNA1 | |
| Phenotype | MGI: ISYNA1 (International Mouse Phenotyping Consortium) |
| PhenomicDB: ISYNA1 | |
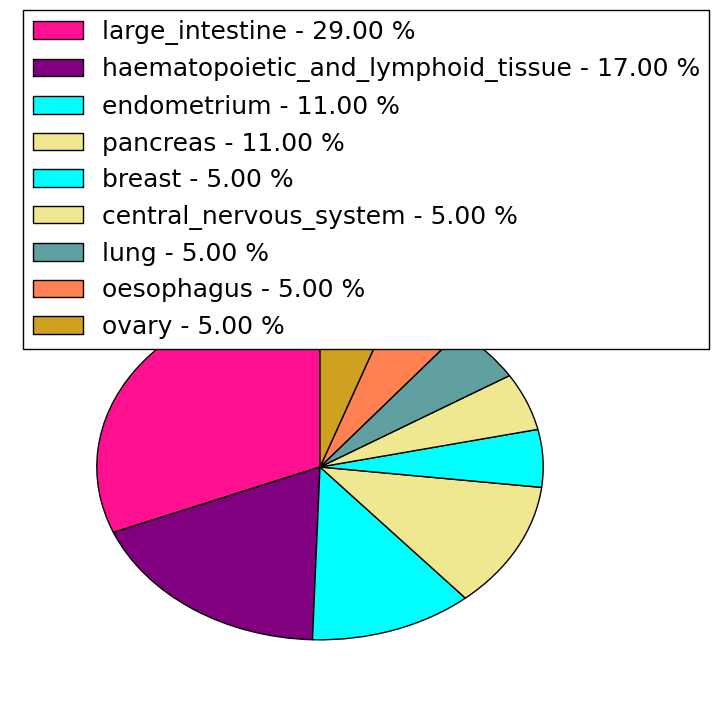
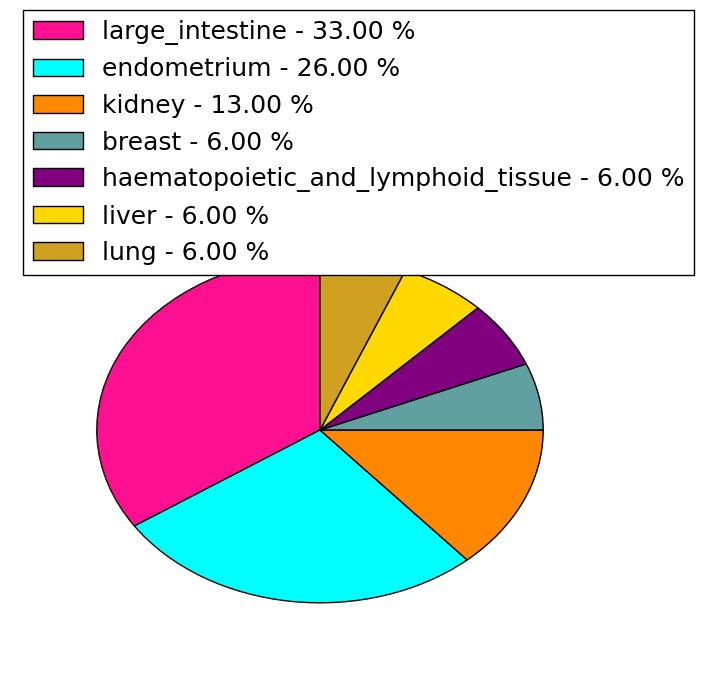
| Mutations for ISYNA1 |
| * Under tables are showing count per each tissue to give us broad intuition about tissue specific mutation patterns.You can go to the detailed page for each mutation database's web site. |
| - Statistics for Tissue and Mutation type | Top |
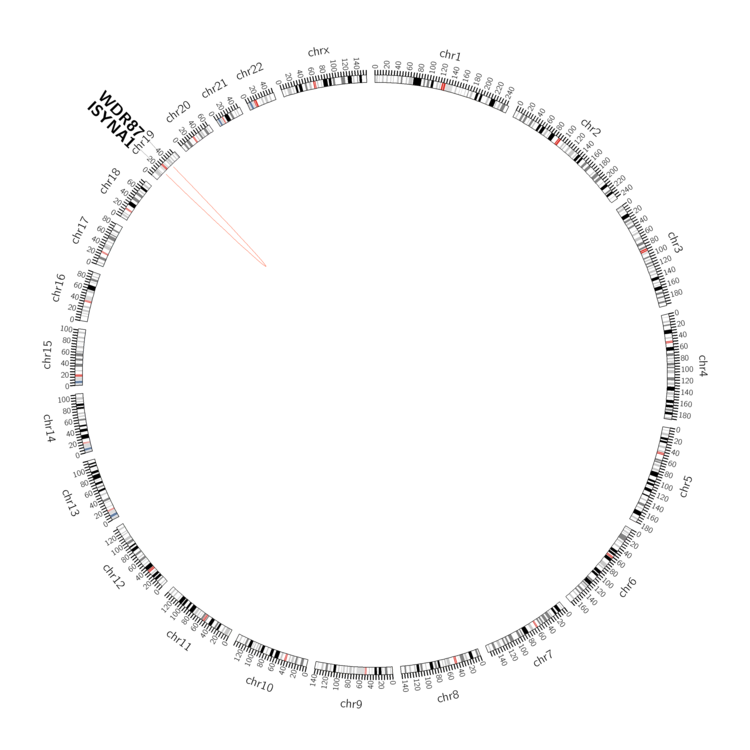 |
| - For Inter-chromosomal Variations |
| There's no inter-chromosomal structural variation. |
| - For Intra-chromosomal Variations |
| * Intra-chromosomal variantions includes 'intrachromosomal amplicon to amplicon', 'intrachromosomal amplicon to non-amplified dna', 'intrachromosomal deletion', 'intrachromosomal fold-back inversion', 'intrachromosomal inversion', 'intrachromosomal tandem duplication', 'Intrachromosomal unknown type', 'intrachromosomal with inverted orientation', 'intrachromosomal with non-inverted orientation'. |
 |
| Sample | Symbol_a | Chr_a | Start_a | End_a | Symbol_b | Chr_b | Start_b | End_b |
| ovary | ISYNA1 | chr19 | 18546210 | 18546230 | WDR87 | chr19 | 38390134 | 38390154 |
| cf) Tissue number; Tissue name (1;Breast, 2;Central_nervous_system, 3;Haematopoietic_and_lymphoid_tissue, 4;Large_intestine, 5;Liver, 6;Lung, 7;Ovary, 8;Pancreas, 9;Prostate, 10;Skin, 11;Soft_tissue, 12;Upper_aerodigestive_tract) |
| * From mRNA Sanger sequences, Chitars2.0 arranged chimeric transcripts. This table shows ISYNA1 related fusion information. |
| ID | Head Gene | Tail Gene | Accession | Gene_a | qStart_a | qEnd_a | Chromosome_a | tStart_a | tEnd_a | Gene_a | qStart_a | qEnd_a | Chromosome_a | tStart_a | tEnd_a |
| AA368753 | ISYNA1 | 1 | 160 | 19 | 18547190 | 18547553 | CSH2 | 158 | 317 | 17 | 61950608 | 61951036 | |
| AW962615 | ISYNA1 | 1 | 159 | 19 | 18547190 | 18547552 | CSH1 | 157 | 509 | 17 | 61973091 | 61973933 | |
| BF945926 | ISYNA1 | 8 | 153 | 19 | 18546212 | 18546438 | NCDN | 150 | 229 | 1 | 36032076 | 36032155 | |
| Top |
| There's no copy number variation information in COSMIC data for this gene. |
| Top |
|
 |
| Top |
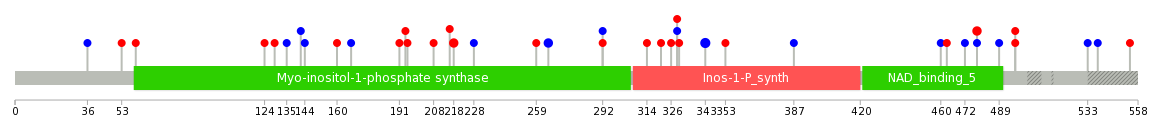
| Stat. for Non-Synonymous SNVs (# total SNVs=17) | (# total SNVs=15) |
 |  |
(# total SNVs=1) | (# total SNVs=0) |
 |
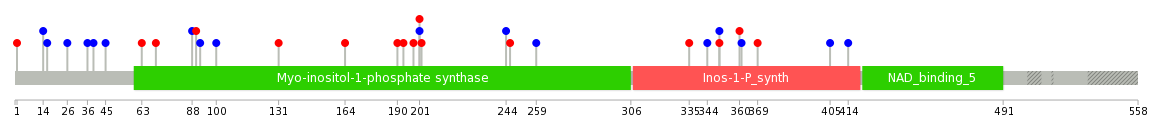
| Top |
| * When you move the cursor on each content, you can see more deailed mutation information on the Tooltip. Those are primary_site,primary_histology,mutation(aa),pubmedID. |
| GRCh37 position | Mutation(aa) | Unique sampleID count |
| chr19:18546678-18546678 | p.L343L | 3 |
| chr19:18547022-18547022 | p.A265A | 2 |
| chr19:18547246-18547246 | p.A218V | 2 |
| chr19:18546115-18546115 | p.A478V | 2 |
| chr19:18546877-18546877 | p.V314M | 1 |
| chr19:18547277-18547277 | p.R208C | 1 |
| chr19:18546168-18546168 | p.L460L | 1 |
| chr19:18547919-18547919 | p.? | 1 |
| chr19:18546941-18546941 | p.A292A | 1 |
| chr19:18545739-18545739 | p.P554R | 1 |
| Top |
|
 |
| Point Mutation/ Tissue ID | 1 | 2 | 3 | 4 | 5 | 6 | 7 | 8 | 9 | 10 | 11 | 12 | 13 | 14 | 15 | 16 | 17 | 18 | 19 | 20 |
| # sample | 2 | 6 | 4 | 3 | 1 | 1 | 3 | 4 | 6 | |||||||||||
| # mutation | 2 | 6 | 4 | 3 | 1 | 1 | 3 | 5 | 6 | |||||||||||
| nonsynonymous SNV | 1 | 4 | 2 | 2 | 1 | 2 | 2 | |||||||||||||
| synonymous SNV | 1 | 2 | 2 | 1 | 1 | 3 | 3 | 4 |
| cf) Tissue ID; Tissue type (1; BLCA[Bladder Urothelial Carcinoma], 2; BRCA[Breast invasive carcinoma], 3; CESC[Cervical squamous cell carcinoma and endocervical adenocarcinoma], 4; COAD[Colon adenocarcinoma], 5; GBM[Glioblastoma multiforme], 6; Glioma Low Grade, 7; HNSC[Head and Neck squamous cell carcinoma], 8; KICH[Kidney Chromophobe], 9; KIRC[Kidney renal clear cell carcinoma], 10; KIRP[Kidney renal papillary cell carcinoma], 11; LAML[Acute Myeloid Leukemia], 12; LUAD[Lung adenocarcinoma], 13; LUSC[Lung squamous cell carcinoma], 14; OV[Ovarian serous cystadenocarcinoma ], 15; PAAD[Pancreatic adenocarcinoma], 16; PRAD[Prostate adenocarcinoma], 17; SKCM[Skin Cutaneous Melanoma], 18:STAD[Stomach adenocarcinoma], 19:THCA[Thyroid carcinoma], 20:UCEC[Uterine Corpus Endometrial Carcinoma]) |
| Top |
| * We represented just top 10 SNVs. When you move the cursor on each content, you can see more deailed mutation information on the Tooltip. Those are primary_site, primary_histology, mutation(aa), pubmedID. |
| Genomic Position | Mutation(aa) | Unique sampleID count |
| chr19:18547215 | p.I201V,ISYNA1 | 1 |
| chr19:18548556 | p.S70G,ISYNA1 | 1 |
| chr19:18546587 | p.T198N,ISYNA1 | 1 |
| chr19:18547239 | p.S45S | 1 |
| chr19:18545774 | p.T414T,ISYNA1 | 1 |
| chr19:18548682 | p.G193D,ISYNA1 | 1 |
| chr19:18546591 | p.G36G,ISYNA1 | 1 |
| chr19:18547246 | p.P405P,ISYNA1 | 1 |
| chr19:18545801 | p.F190L,ISYNA1 | 1 |
| chr19:18546719 | p.P369S,ISYNA1 | 1 |
| * Copy number data were extracted from TCGA using R package TCGA-Assembler. The URLs of all public data files on TCGA DCC data server were gathered on Jan-05-2015. Function ProcessCNAData in TCGA-Assembler package was used to obtain gene-level copy number value which is calculated as the average copy number of the genomic region of a gene. |
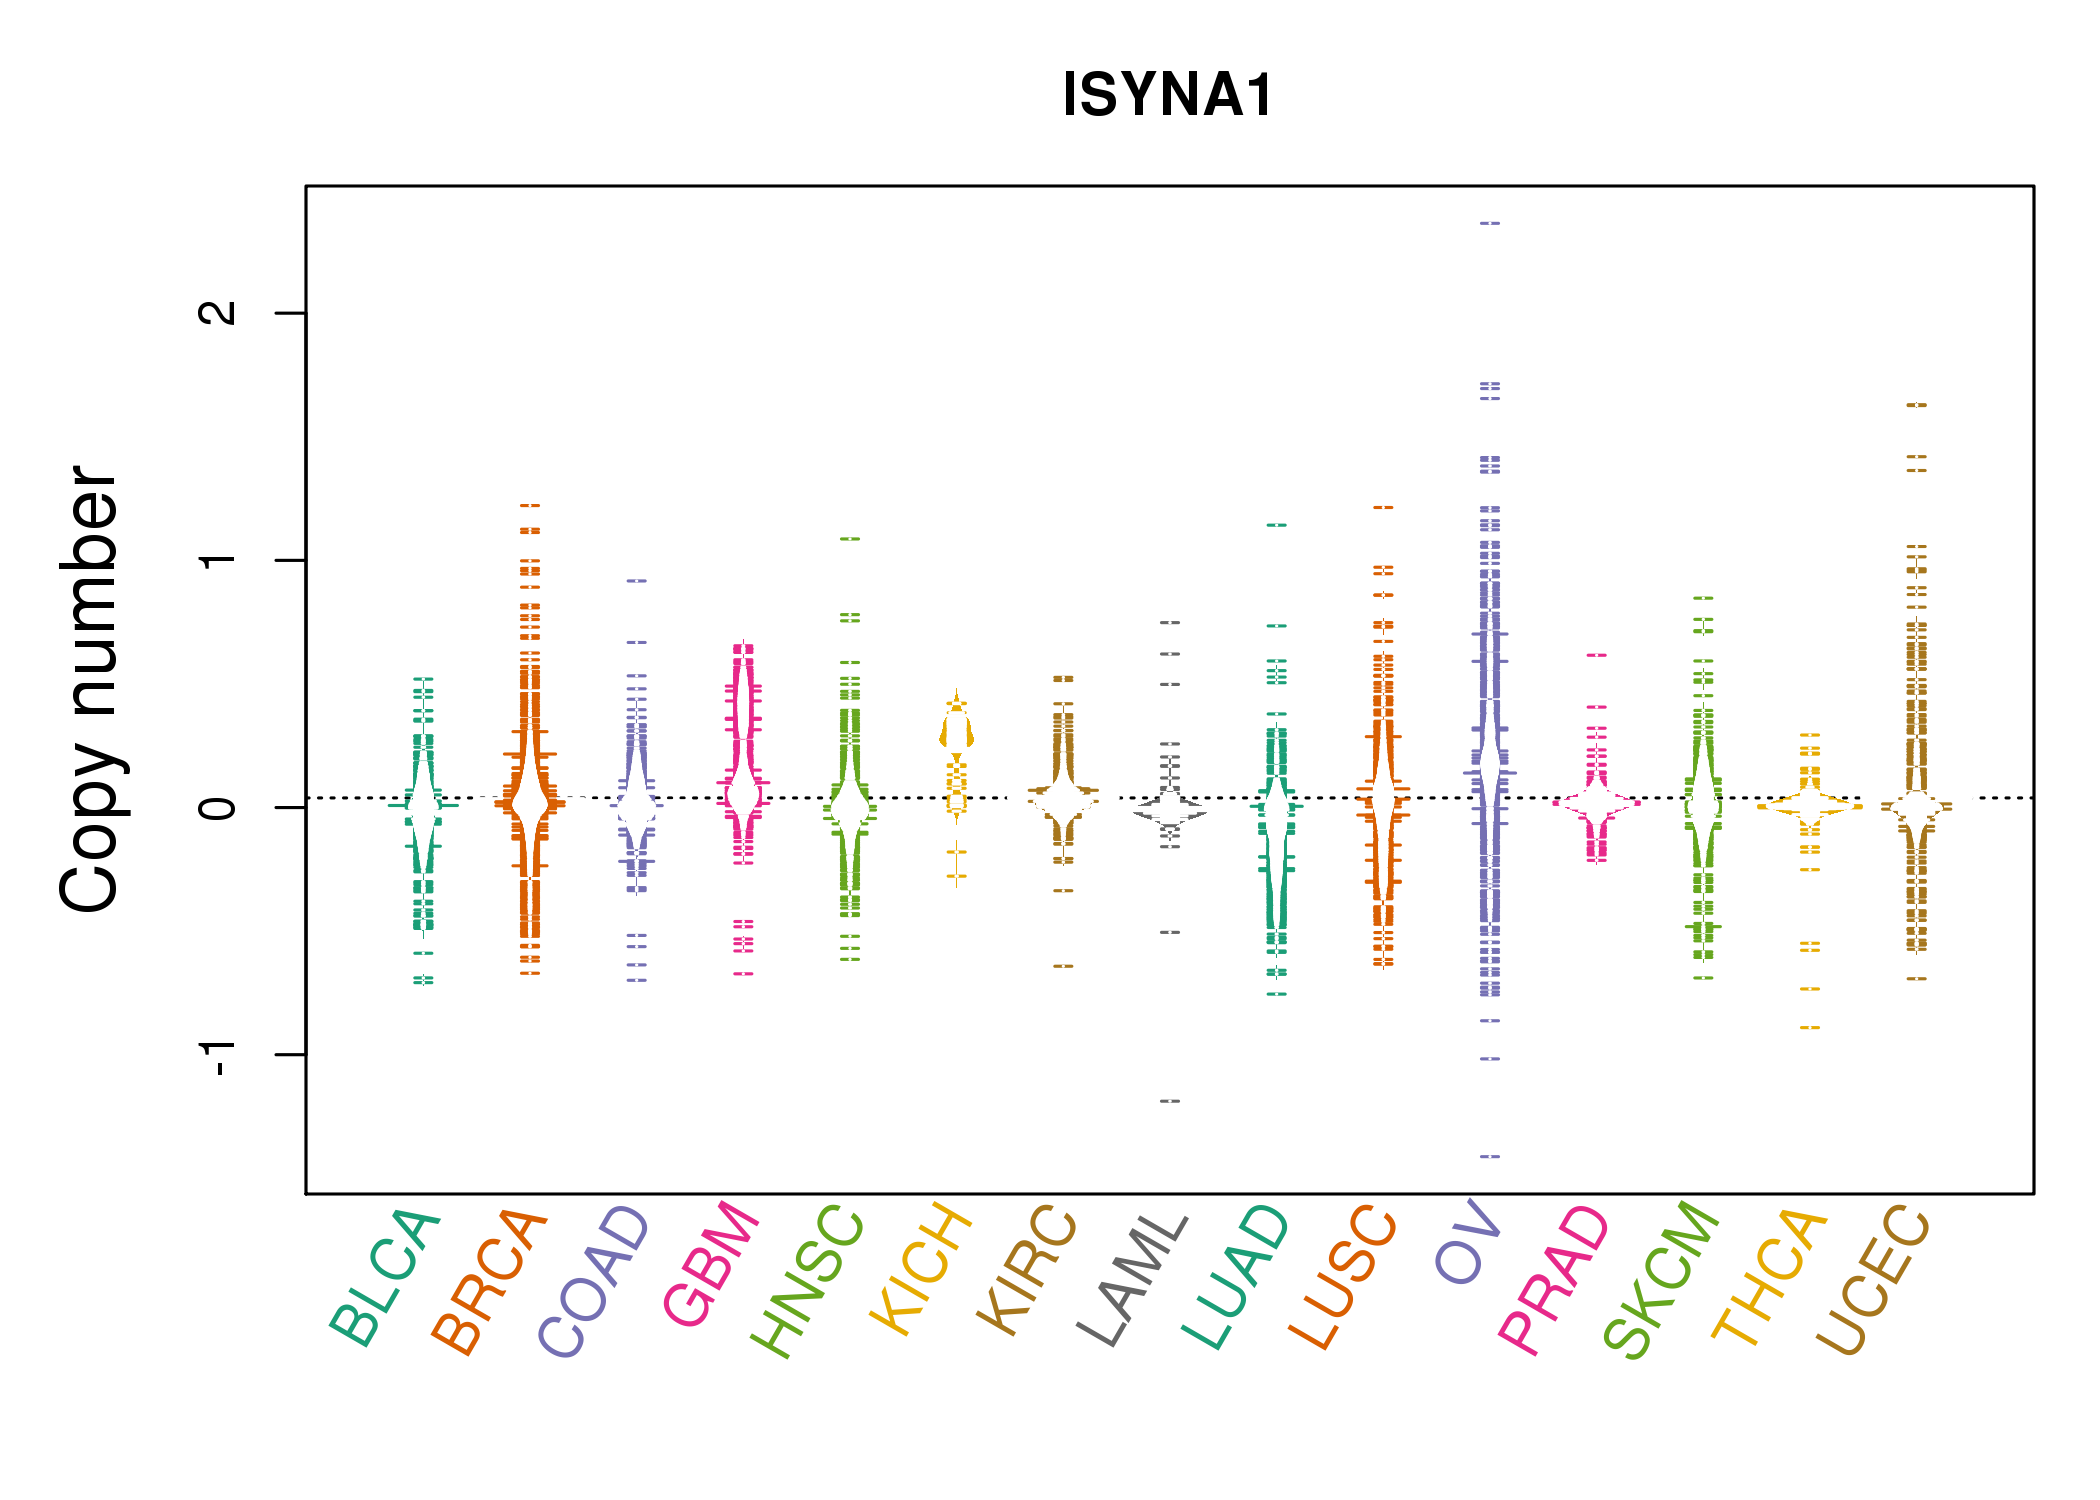 |
| cf) Tissue ID[Tissue type]: BLCA[Bladder Urothelial Carcinoma], BRCA[Breast invasive carcinoma], CESC[Cervical squamous cell carcinoma and endocervical adenocarcinoma], COAD[Colon adenocarcinoma], GBM[Glioblastoma multiforme], Glioma Low Grade, HNSC[Head and Neck squamous cell carcinoma], KICH[Kidney Chromophobe], KIRC[Kidney renal clear cell carcinoma], KIRP[Kidney renal papillary cell carcinoma], LAML[Acute Myeloid Leukemia], LUAD[Lung adenocarcinoma], LUSC[Lung squamous cell carcinoma], OV[Ovarian serous cystadenocarcinoma ], PAAD[Pancreatic adenocarcinoma], PRAD[Prostate adenocarcinoma], SKCM[Skin Cutaneous Melanoma], STAD[Stomach adenocarcinoma], THCA[Thyroid carcinoma], UCEC[Uterine Corpus Endometrial Carcinoma] |
| Top |
| Gene Expression for ISYNA1 |
| * CCLE gene expression data were extracted from CCLE_Expression_Entrez_2012-10-18.res: Gene-centric RMA-normalized mRNA expression data. |
 |
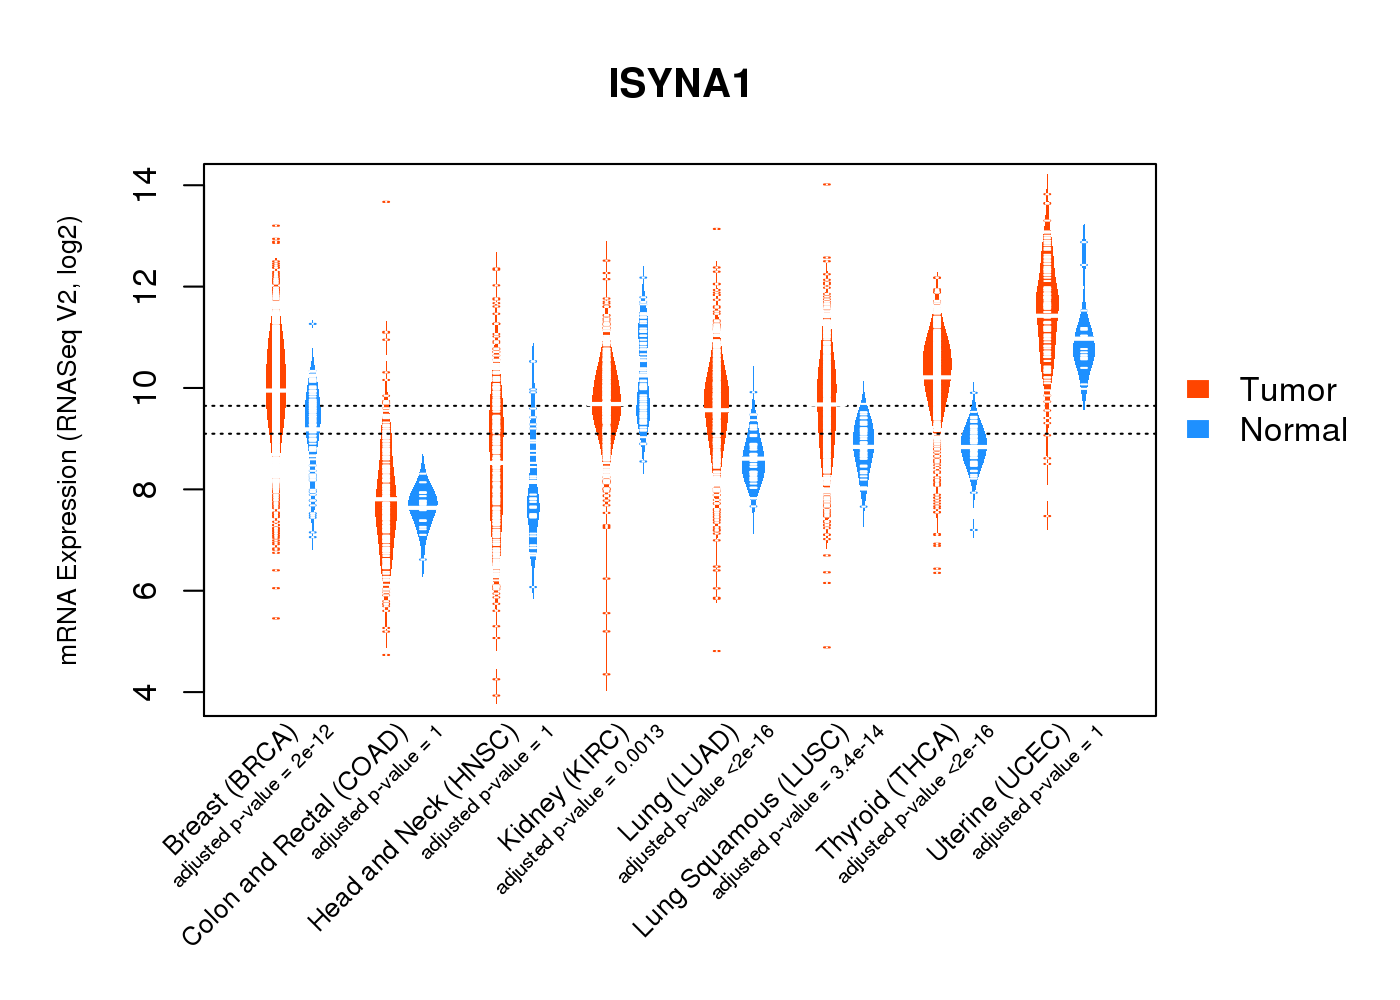
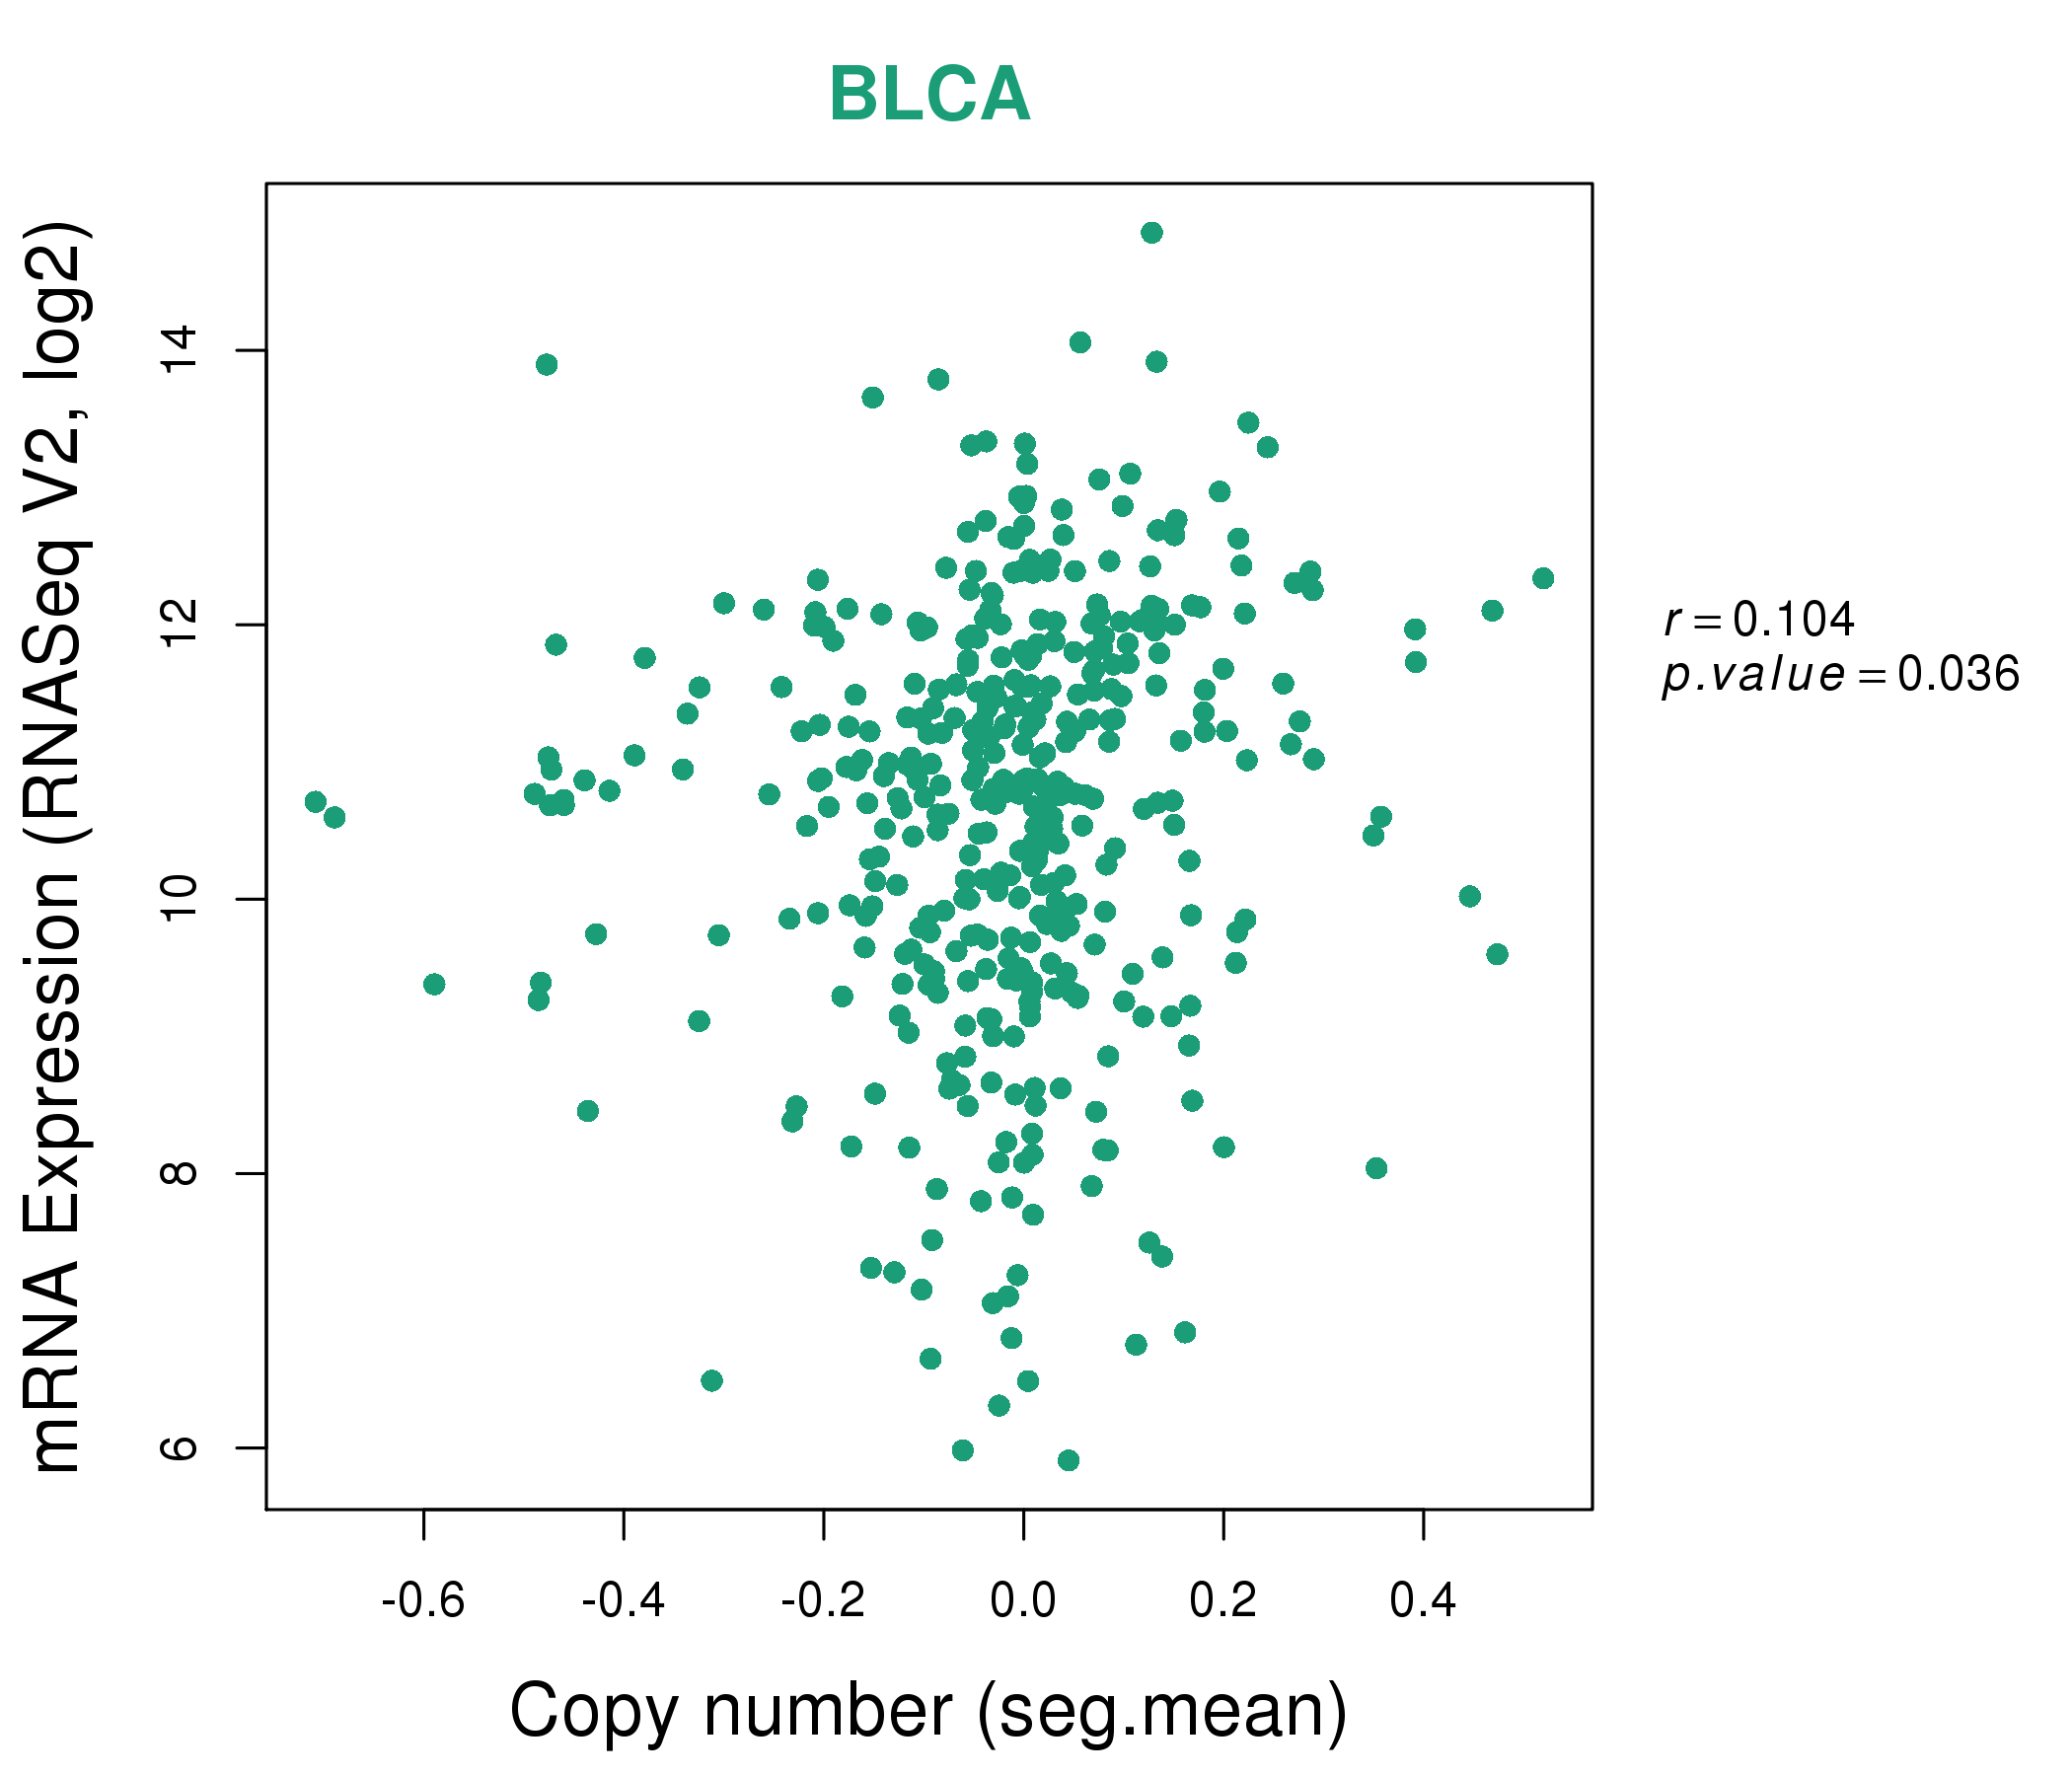
| * Normalized gene expression data of RNASeqV2 was extracted from TCGA using R package TCGA-Assembler. The URLs of all public data files on TCGA DCC data server were gathered at Jan-05-2015. Only eight cancer types have enough normal control samples for differential expression analysis. (t test, adjusted p<0.05 (using Benjamini-Hochberg FDR)) |
 |
| Top |
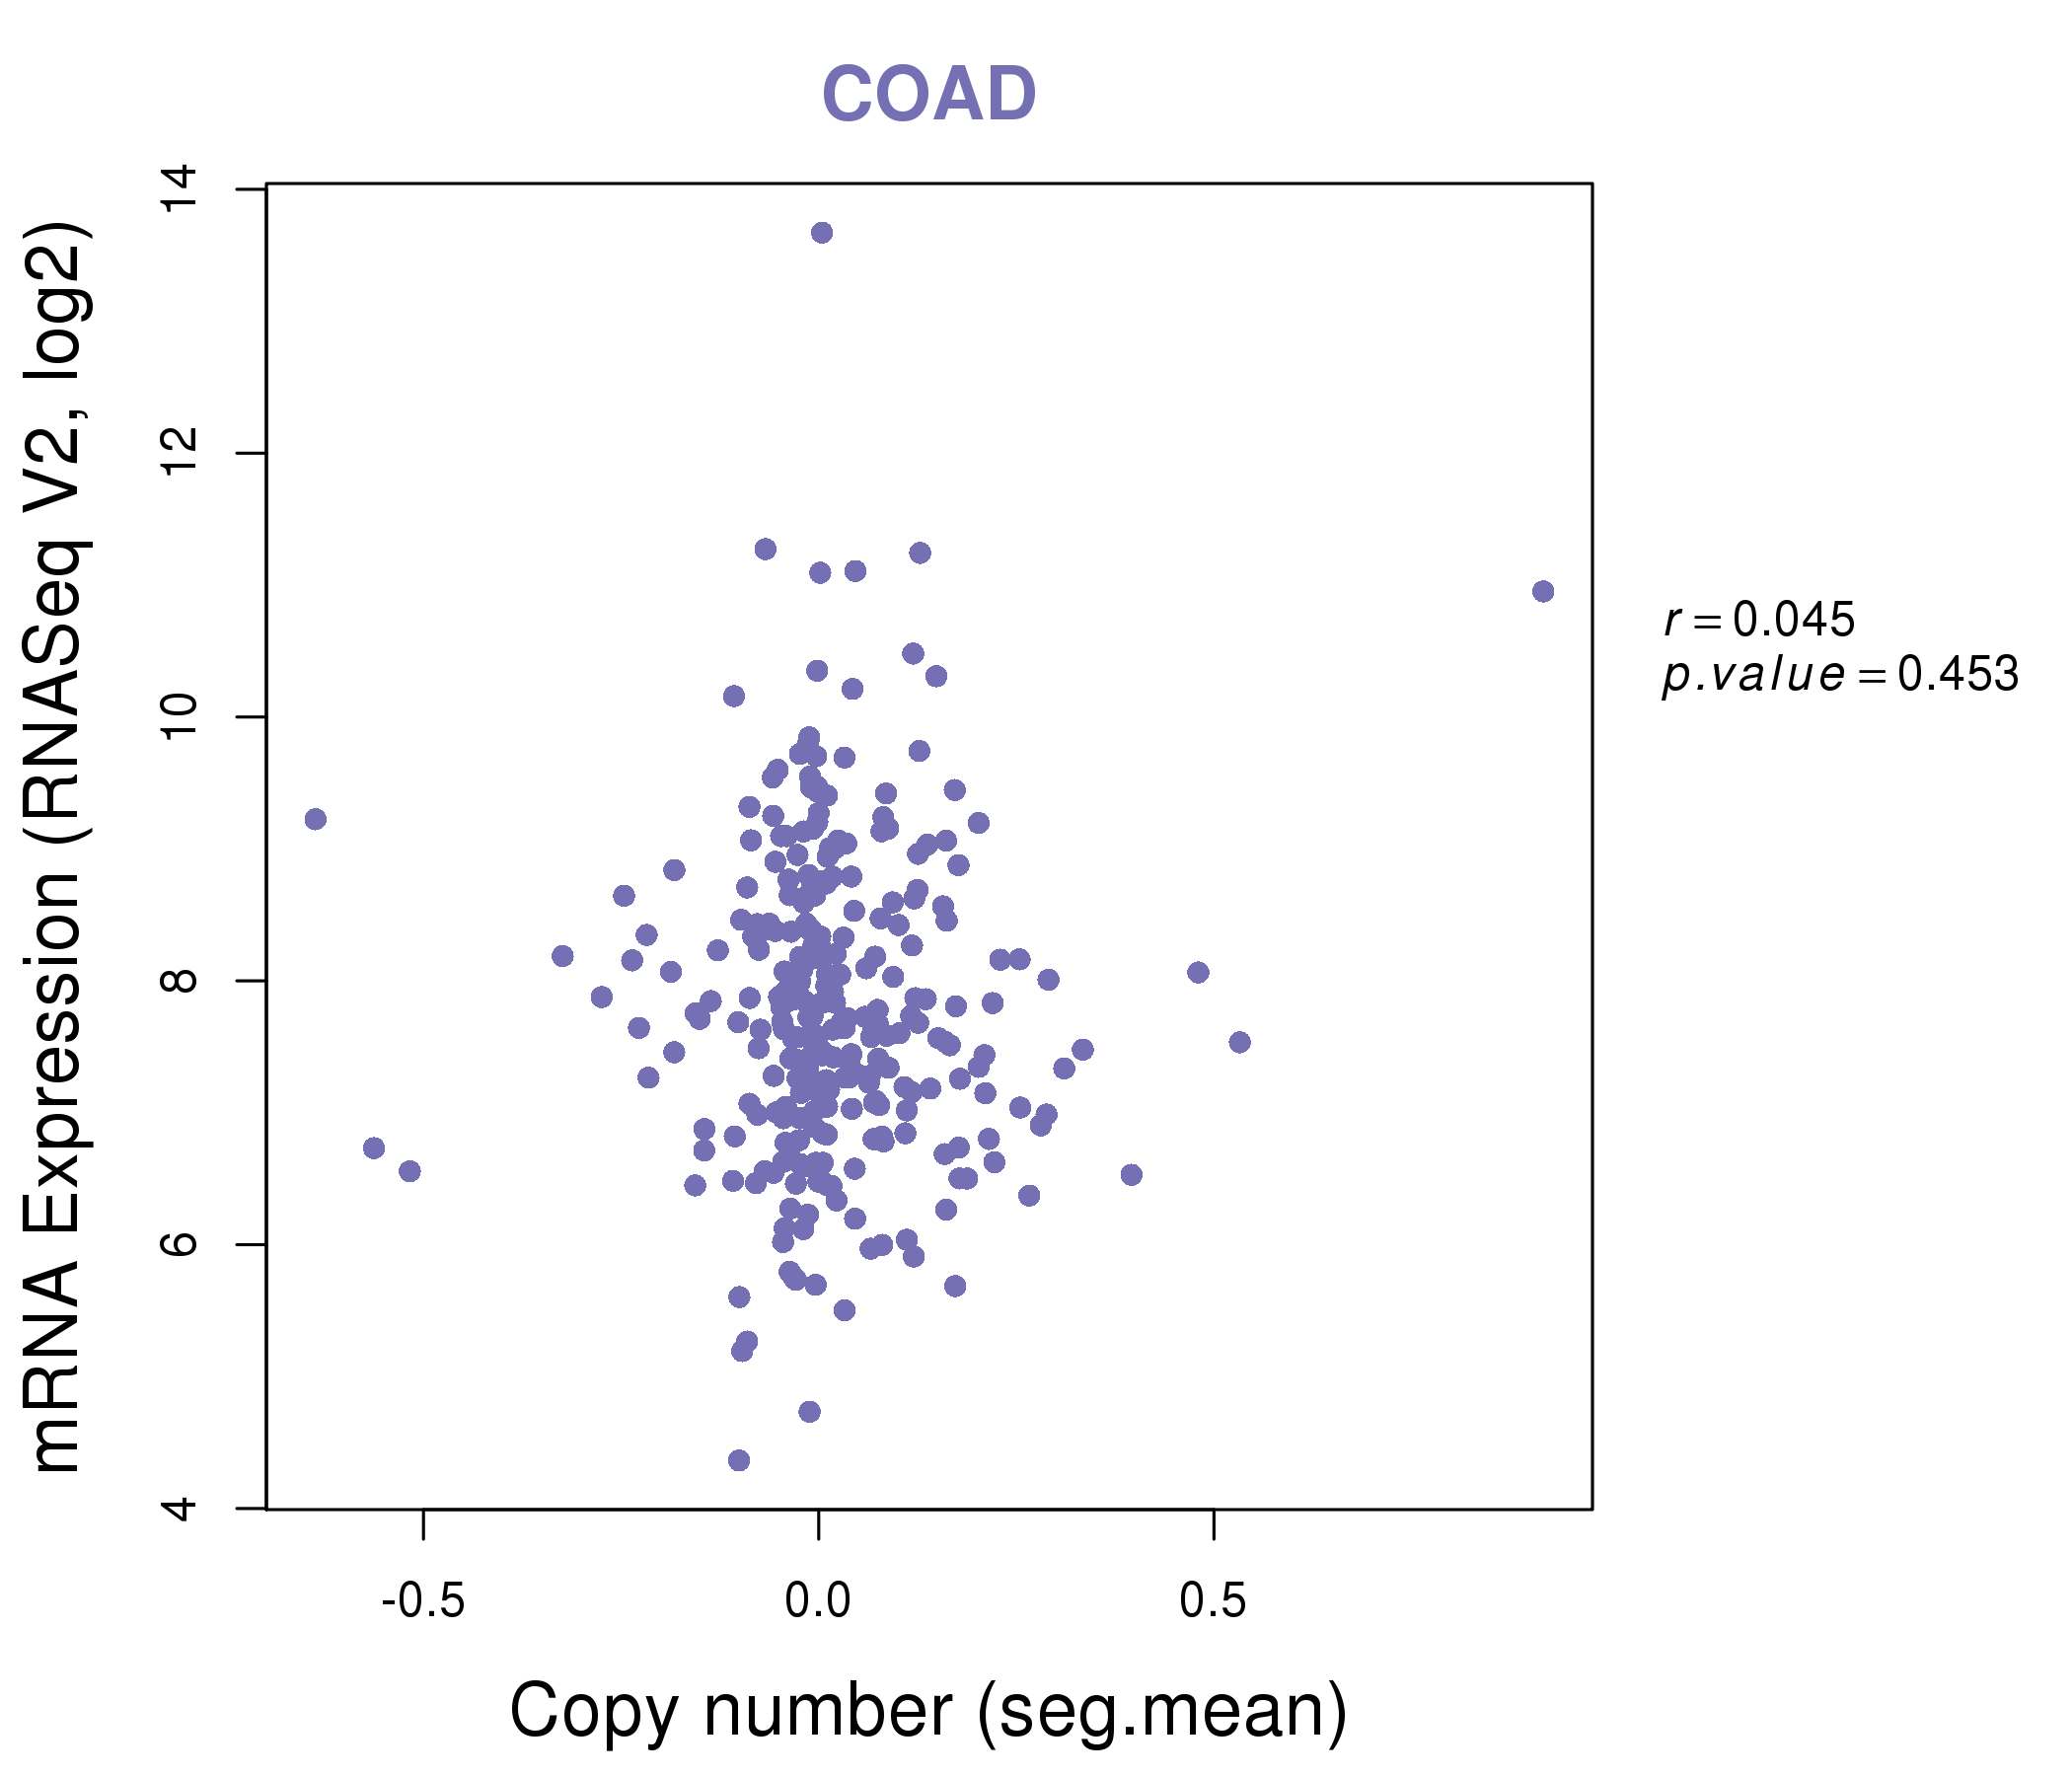
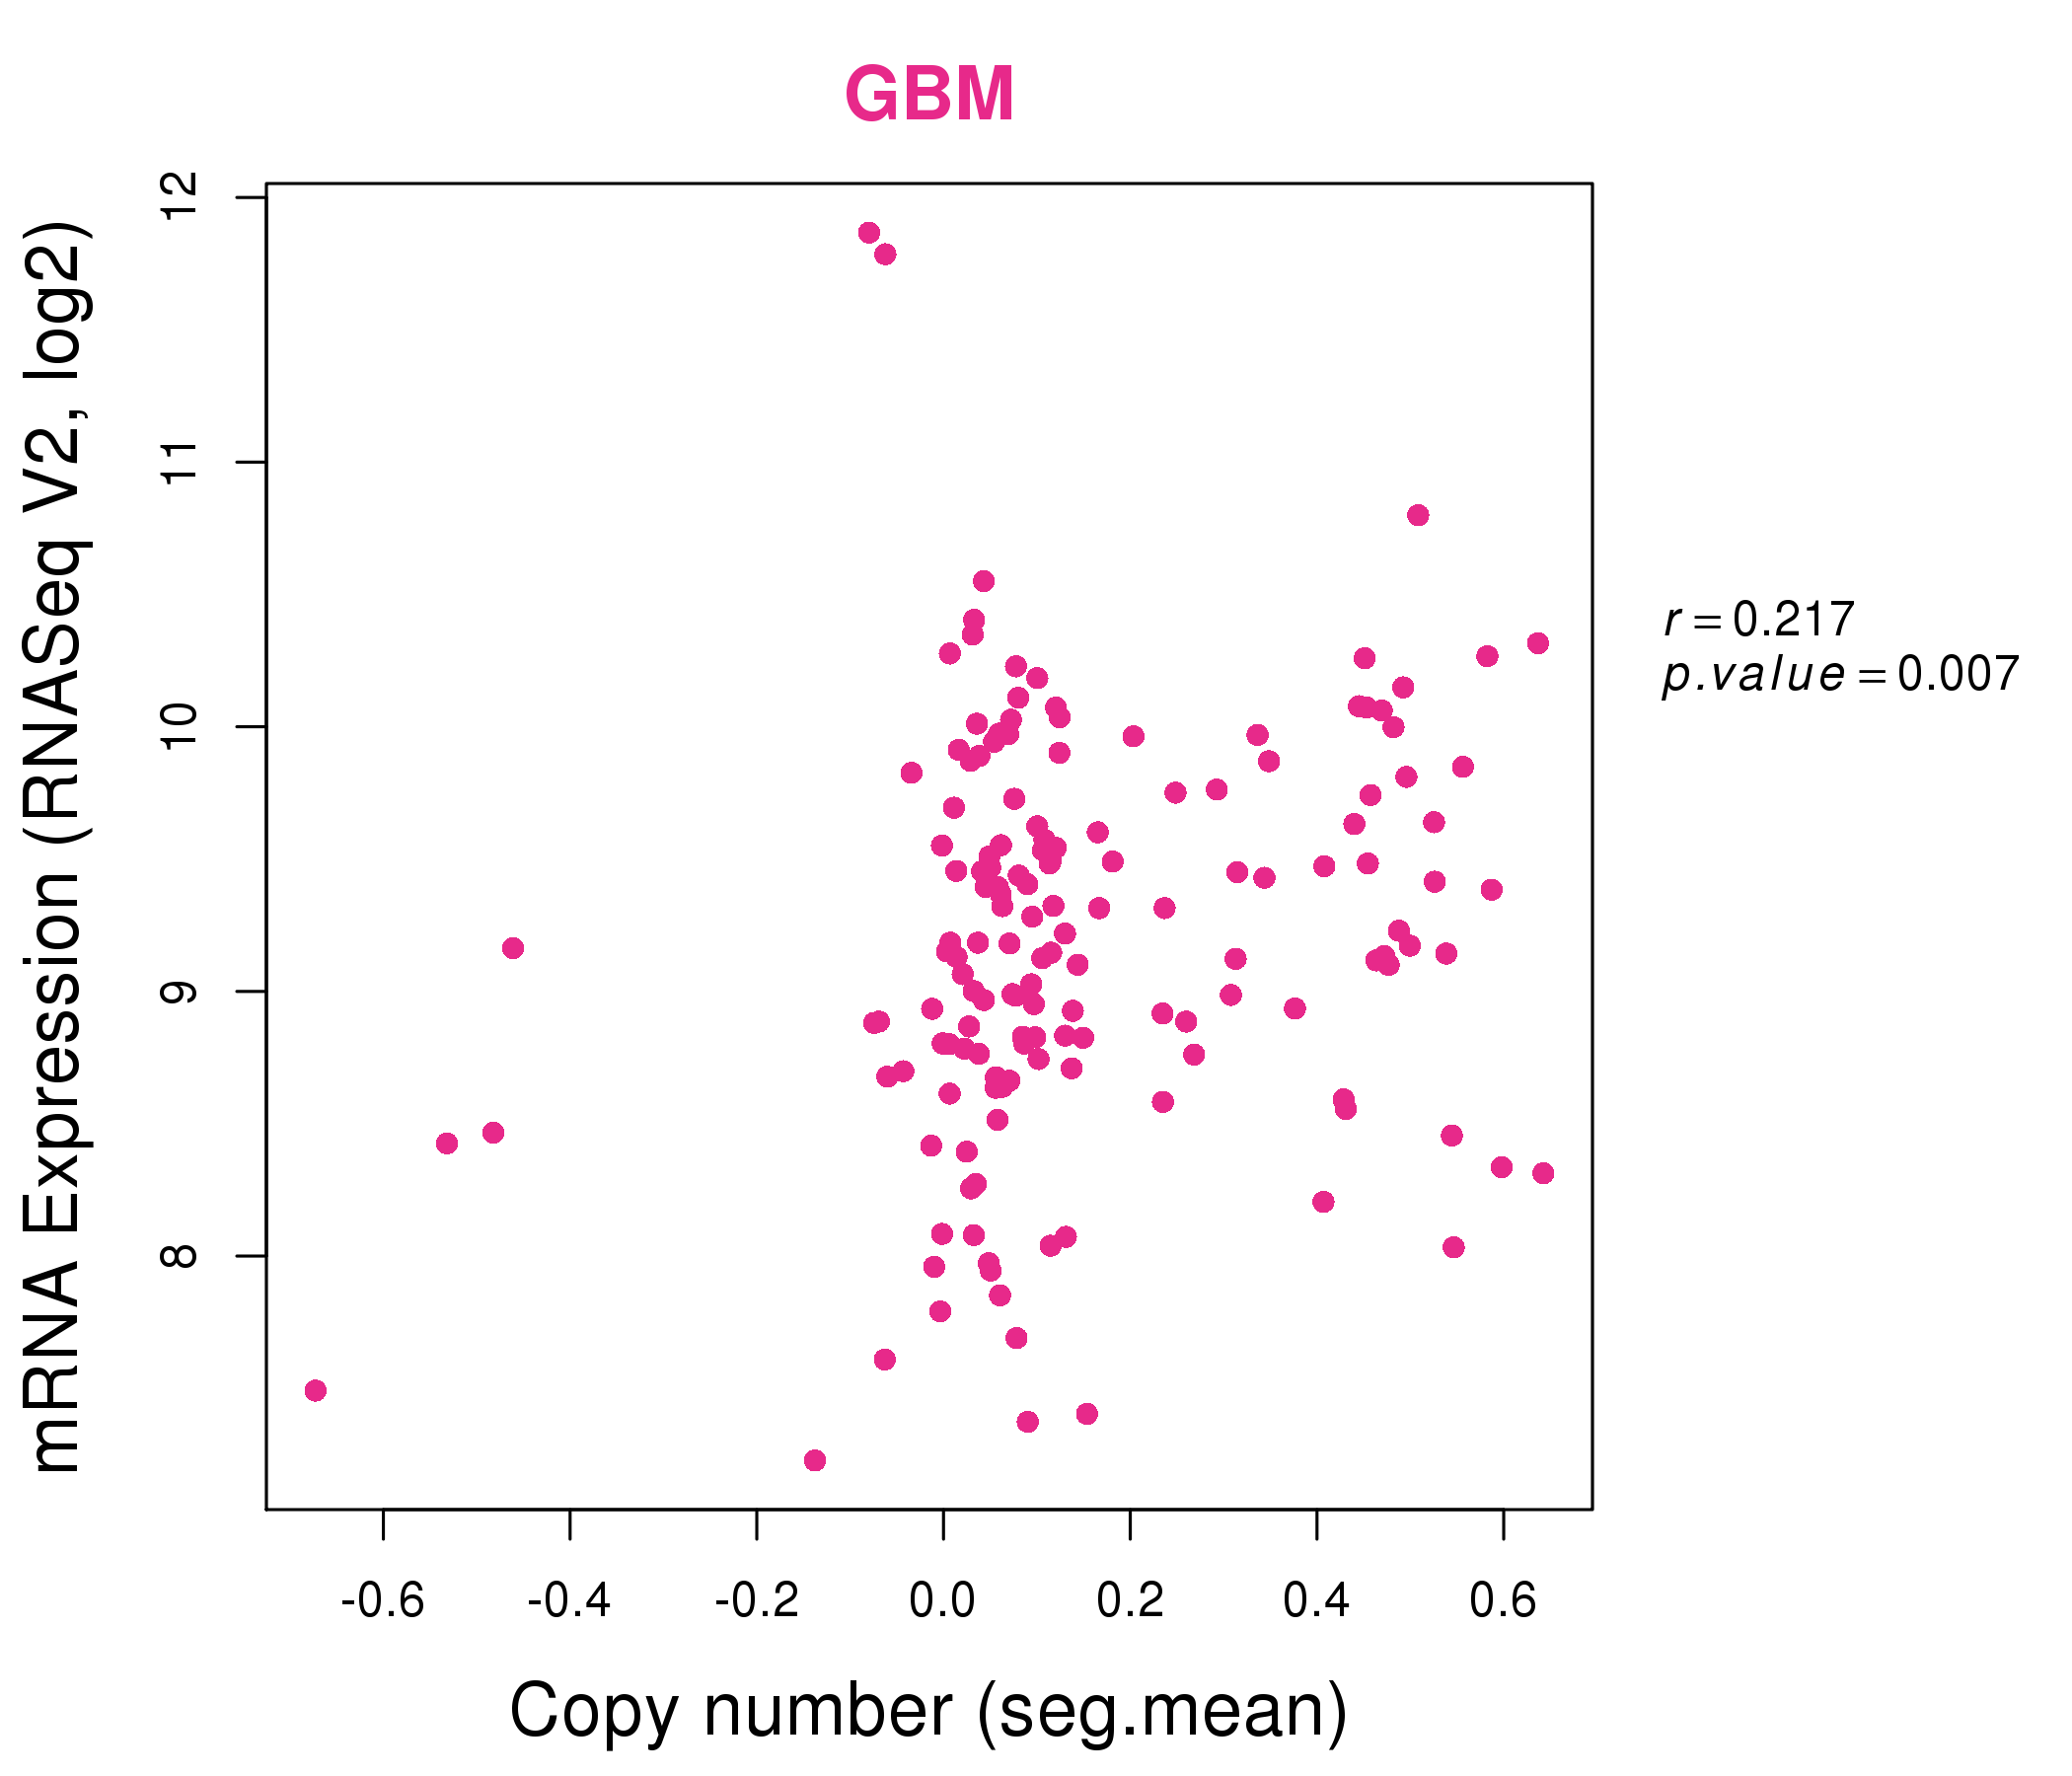
| * This plots show the correlation between CNV and gene expression. |
: Open all plots for all cancer types
 |
|
 |
|

| Top |
| Gene-Gene Network Information |
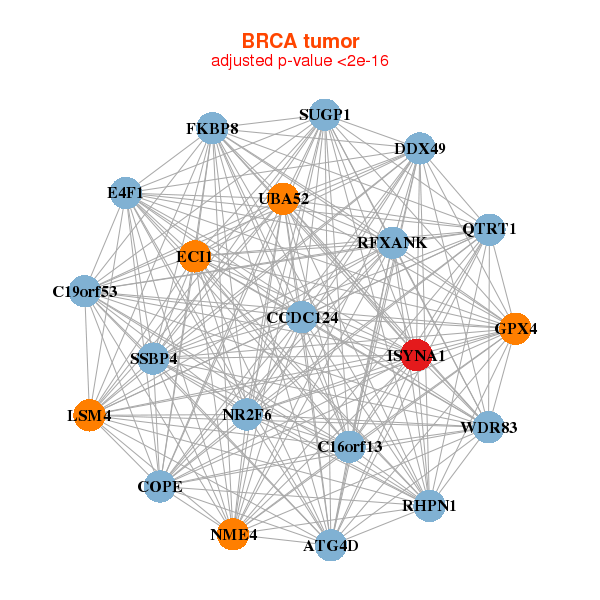
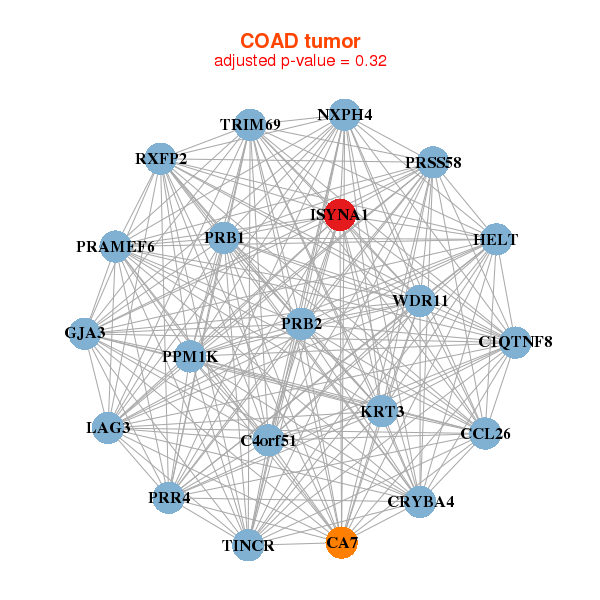
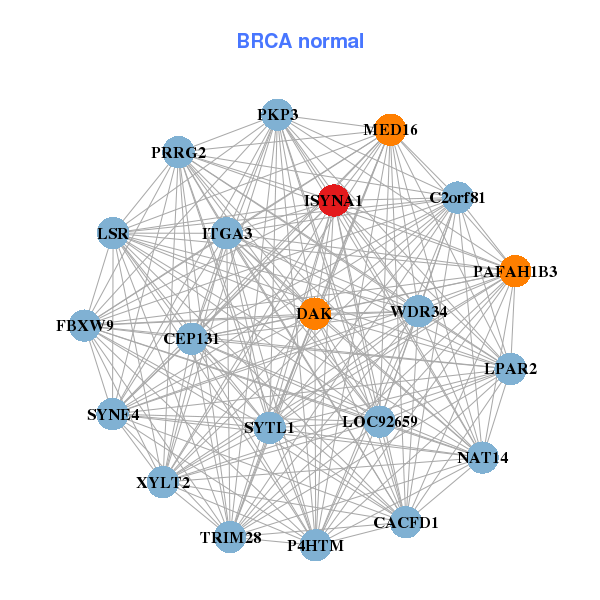
| * Co-Expression network figures were drawn using R package igraph. Only the top 20 genes with the highest correlations were shown. Red circle: input gene, orange circle: cell metabolism gene, sky circle: other gene |
: Open all plots for all cancer types
 |
| ||||
| ATG4D,C16orf13,C19orf53,CCDC124,COPE,ECI1,DDX49, E4F1,FKBP8,GPX4,ISYNA1,LSM4,NME4,NR2F6, QTRT1,RFXANK,RHPN1,SUGP1,SSBP4,UBA52,WDR83 | CEP131,SYNE4,C2orf81,CACFD1,DAK,FBXW9,ISYNA1, ITGA3,LOC92659,LPAR2,LSR,MED16,NAT14,P4HTM, PAFAH1B3,PKP3,PRRG2,SYTL1,TRIM28,WDR34,XYLT2 | ||||
 |
| ||||
| C1QTNF8,C4orf51,CA7,CCL26,CRYBA4,GJA3,HELT, ISYNA1,KRT3,LAG3,NXPH4,TINCR,PPM1K,PRAMEF6, PRB1,PRB2,PRR4,RXFP2,TRIM69,PRSS58,WDR11 | ACTBL2,CCL18,CHIT1,DEFB4A,DUOX1,FAM74A1,FAM92A1P2, FLJ25758,HS3ST2,HTRA4,ISYNA1,KRT6B,KRTAP13-1,LY6D, MMP10,PRAMEF12,RBMXL3,SLC13A4,TM4SF19,TRIM42,XKRY2 |

| * Co-Expression network figures were drawn using R package igraph. Only the top 20 genes with the highest correlations were shown. Red circle: input gene, orange circle: cell metabolism gene, sky circle: other gene |
: Open all plots for all cancer types
| Top |
: Open all interacting genes' information including KEGG pathway for all interacting genes from DAVID
| Top |
| Pharmacological Information for ISYNA1 |
| DB Category | DB Name | DB's ID and Url link |
| * Gene Centered Interaction Network. |
 |
| * Drug Centered Interaction Network. |
| DrugBank ID | Target Name | Drug Groups | Generic Name | Drug Centered Network | Drug Structure |
| DB01907 | inositol-3-phosphate synthase 1 | experimental | Nicotinamide-Adenine-Dinucleotide | 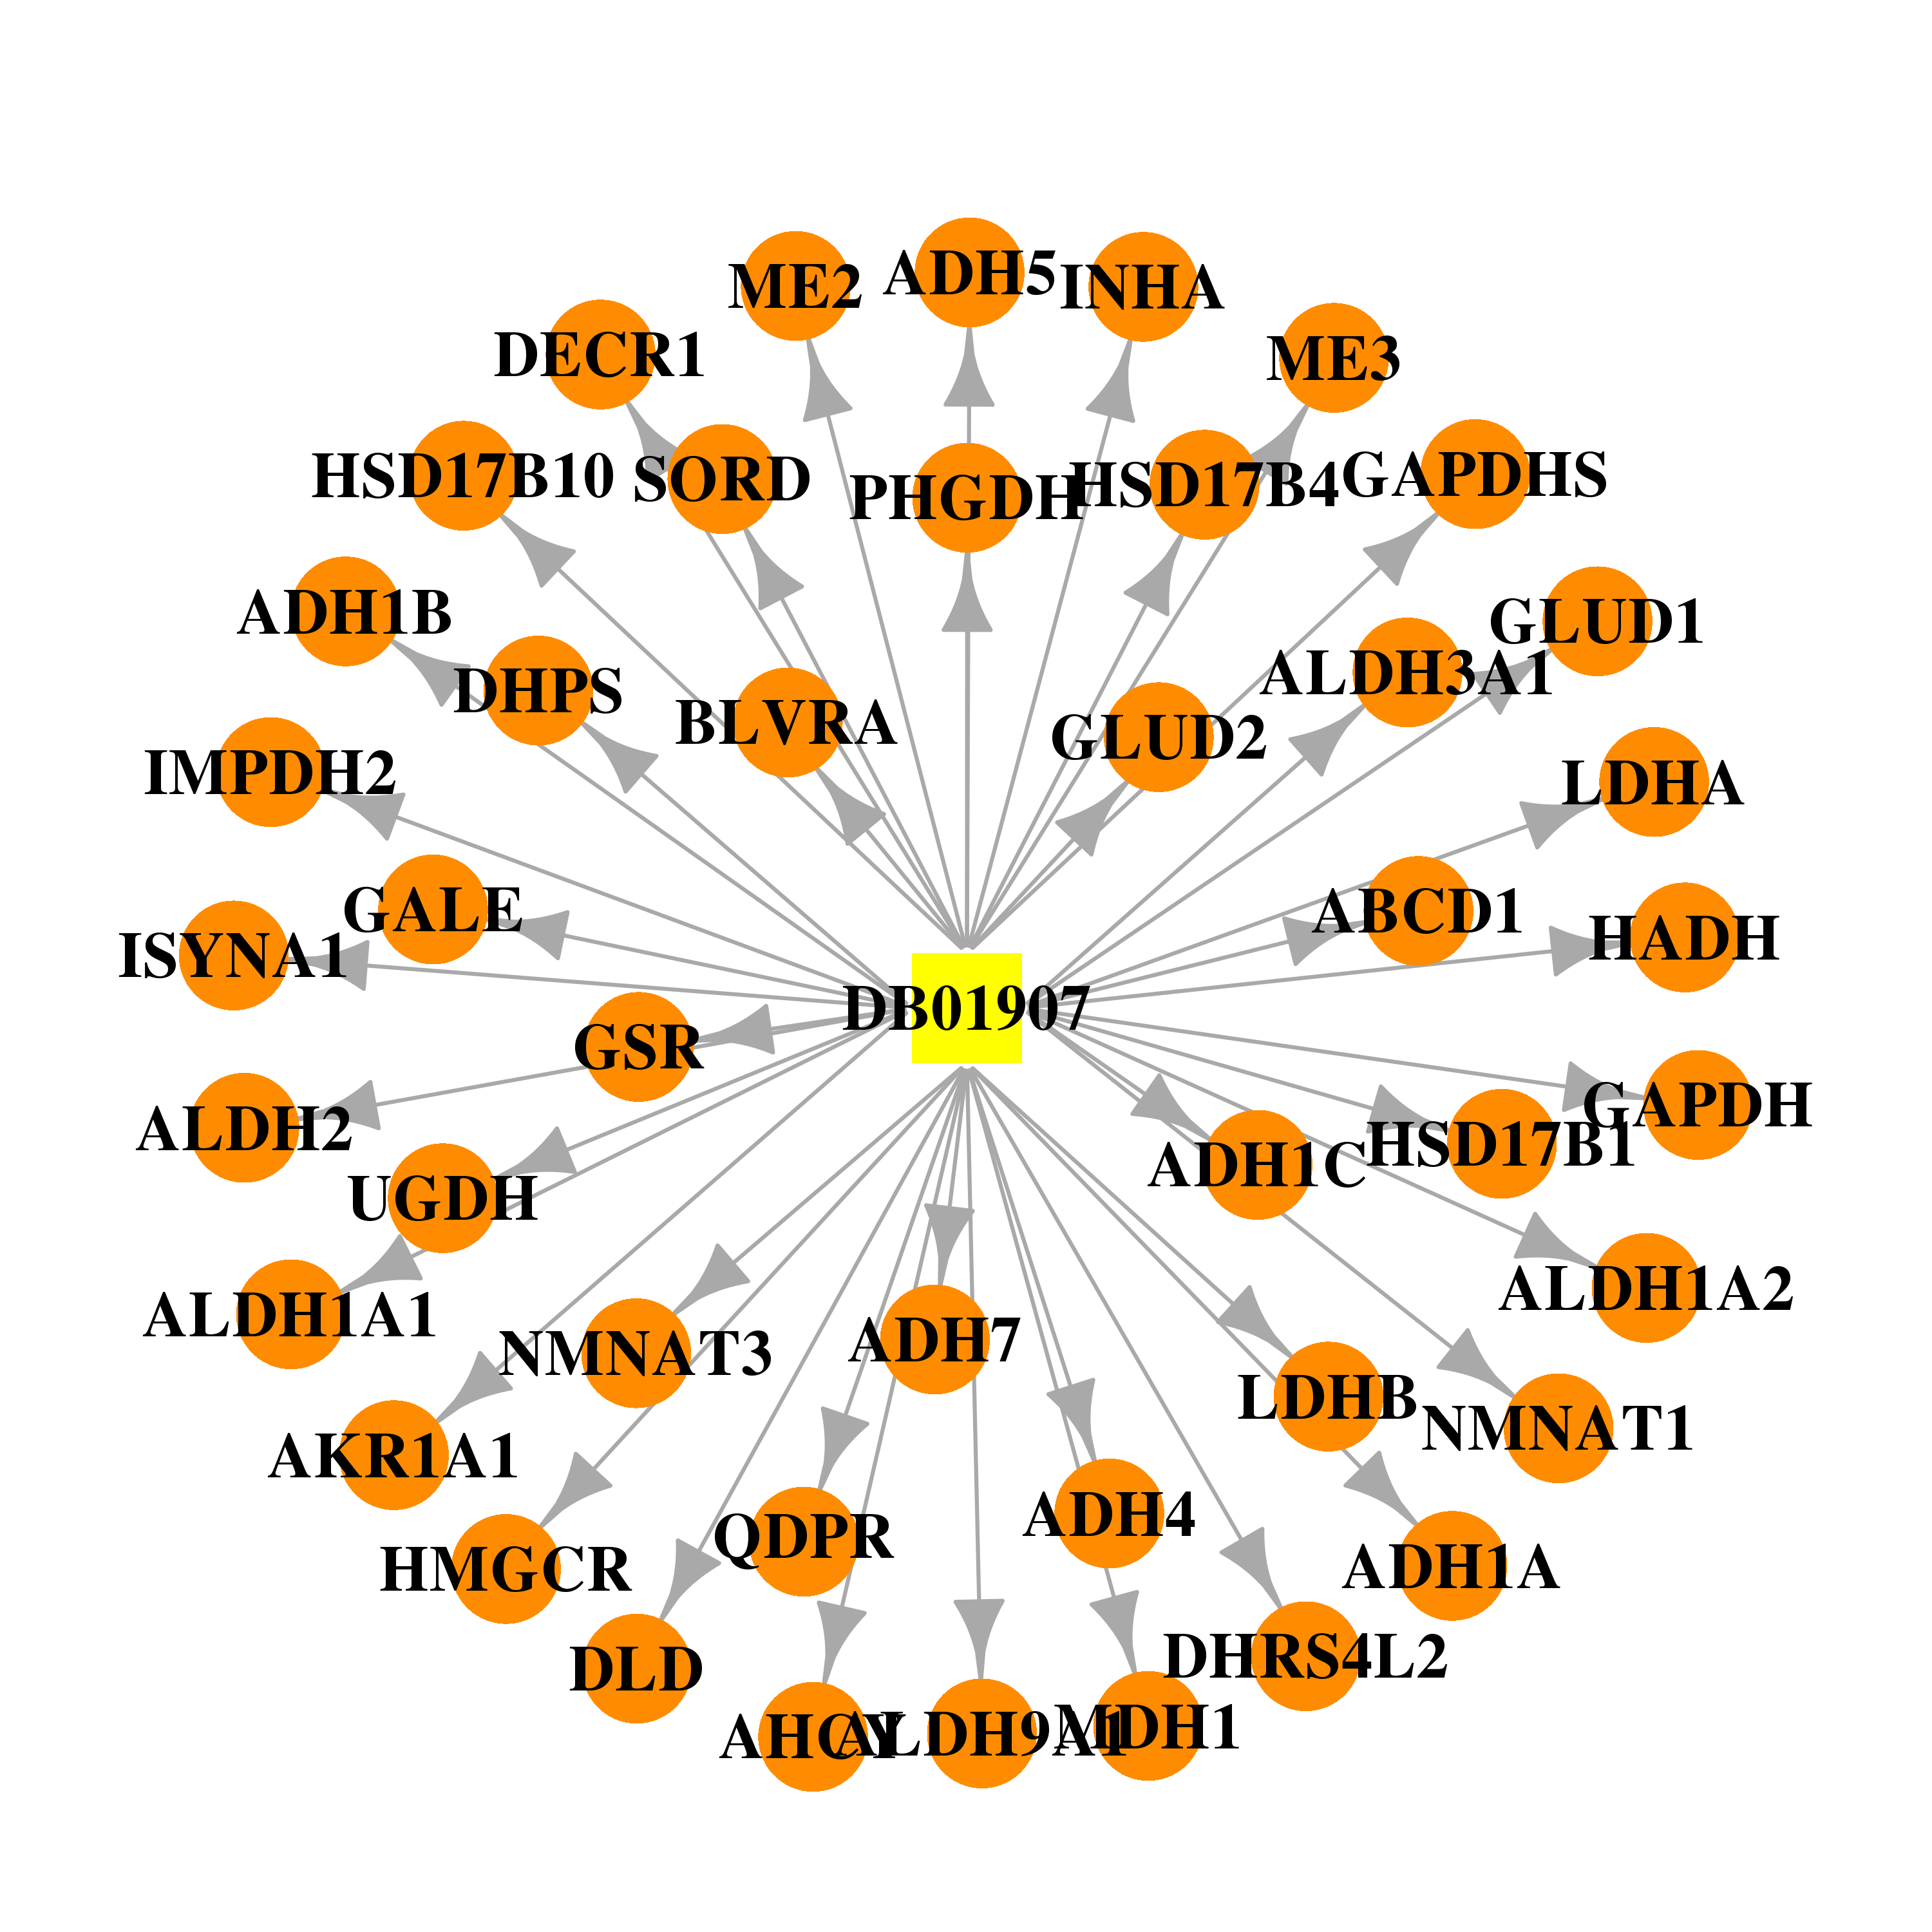 | 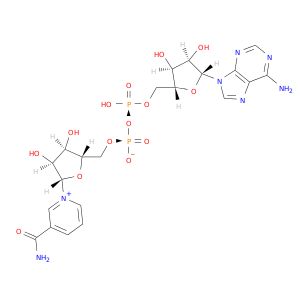 |
| Top |
| Cross referenced IDs for ISYNA1 |
| * We obtained these cross-references from Uniprot database. It covers 150 different DBs, 18 categories. http://www.uniprot.org/help/cross_references_section |
: Open all cross reference information
|
Copyright © 2016-Present - The Univsersity of Texas Health Science Center at Houston @ |