|
|||||||||||||||||||||||||||||||||||||||||||||||||||||||||||||||||||||||||||||||||||||||||||||||||||||||||||||||||||||||||||||||||||||||||||||||||||||||||||||||||||||||||||||||||||||||||||||||||||||||||||||||||||||||||||||||||||||||||||||||||||||||||||||||||||||||||||||||||||||||||||||||||||||||||||||||||||||||||||||||||||||||||||||
| |
| Phenotypic Information (metabolism pathway, cancer, disease, phenome) |
| |
| |
| Gene-Gene Network Information: Co-Expression Network, Interacting Genes & KEGG |
| |
|


| Gene Summary for HSD17B7 |
| Basic gene info. | Gene symbol | HSD17B7 |
| Gene name | hydroxysteroid (17-beta) dehydrogenase 7 | |
| Synonyms | PRAP|SDR37C1 | |
| Cytomap | UCSC genome browser: 1q23 | |
| Genomic location | chr1 :162760495-162782608 | |
| Type of gene | protein-coding | |
| RefGenes | NM_016371.2, | |
| Ensembl id | ENSG00000132196 | |
| Description | 17 beta-hydroxysteroid dehydrogenase type VII17-beta-HSD 717-beta-hydroxysteroid dehydrogenase 717beta hydroxysteroid dehydrogenase3-keto-steroid reductaseestradiol 17-beta-dehydrogenase 7short chain dehydrogenase/reductase family 37C, member 1 | |
| Modification date | 20141207 | |
| dbXrefs | MIM : 606756 | |
| HGNC : HGNC | ||
| HPRD : 05996 | ||
| Protein | UniProt: go to UniProt's Cross Reference DB Table | |
| Expression | CleanEX: HS_HSD17B7 | |
| BioGPS: 51478 | ||
| Gene Expression Atlas: ENSG00000132196 | ||
| The Human Protein Atlas: ENSG00000132196 | ||
| Pathway | NCI Pathway Interaction Database: HSD17B7 | |
| KEGG: HSD17B7 | ||
| REACTOME: HSD17B7 | ||
| ConsensusPathDB | ||
| Pathway Commons: HSD17B7 | ||
| Metabolism | MetaCyc: HSD17B7 | |
| HUMANCyc: HSD17B7 | ||
| Regulation | Ensembl's Regulation: ENSG00000132196 | |
| miRBase: chr1 :162,760,495-162,782,608 | ||
| TargetScan: NM_016371 | ||
| cisRED: ENSG00000132196 | ||
| Context | iHOP: HSD17B7 | |
| cancer metabolism search in PubMed: HSD17B7 | ||
| UCL Cancer Institute: HSD17B7 | ||
| Assigned class in ccmGDB | C | |
| Top |
| Phenotypic Information for HSD17B7(metabolism pathway, cancer, disease, phenome) |
| Cancer | CGAP: HSD17B7 |
| Familial Cancer Database: HSD17B7 | |
| * This gene is included in those cancer gene databases. |
|
|
|
|
|
| . | |||||||||||||||||||||||||||||||||||||||||||||||||||||||||||||||||||||||||||||||||||||||||||||||||||||||||||||||||||||||||||||||||||||||||||||||||||||||||||||||||||||||||||||||||||||||||||||||||||||||||||||||||||||||||||||||||||||||||||||||||||||||||||||||||||||||||||||||||||||||||||||||||||||||||||||||||||||||||||||||||||||||
Oncogene 1 | Significant driver gene in | ||||||||||||||||||||||||||||||||||||||||||||||||||||||||||||||||||||||||||||||||||||||||||||||||||||||||||||||||||||||||||||||||||||||||||||||||||||||||||||||||||||||||||||||||||||||||||||||||||||||||||||||||||||||||||||||||||||||||||||||||||||||||||||||||||||||||||||||||||||||||||||||||||||||||||||||||||||||||||||||||||||||||||||
| cf) number; DB name 1 Oncogene; http://nar.oxfordjournals.org/content/35/suppl_1/D721.long, 2 Tumor Suppressor gene; https://bioinfo.uth.edu/TSGene/, 3 Cancer Gene Census; http://www.nature.com/nrc/journal/v4/n3/abs/nrc1299.html, 4 CancerGenes; http://nar.oxfordjournals.org/content/35/suppl_1/D721.long, 5 Network of Cancer Gene; http://ncg.kcl.ac.uk/index.php, 1Therapeutic Vulnerabilities in Cancer; http://cbio.mskcc.org/cancergenomics/statius/ |
| REACTOME_METABOLISM_OF_LIPIDS_AND_LIPOPROTEINS | |
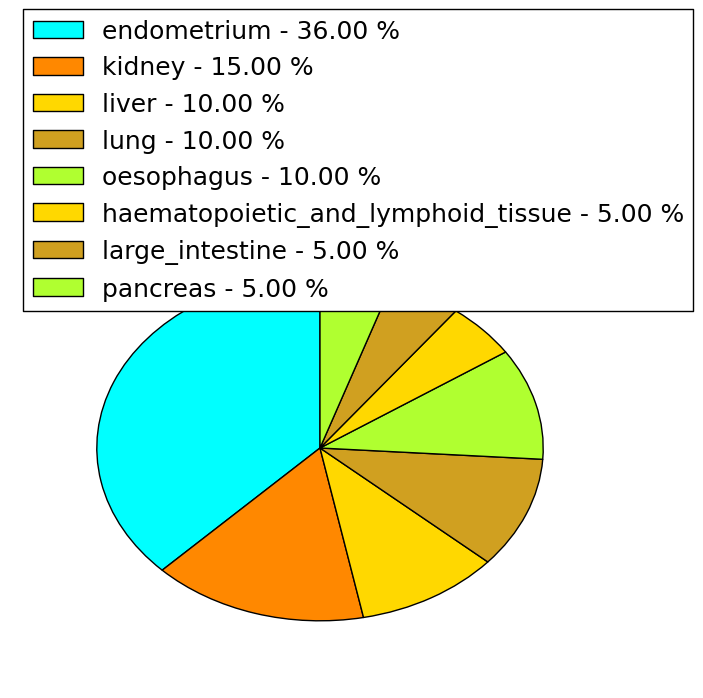
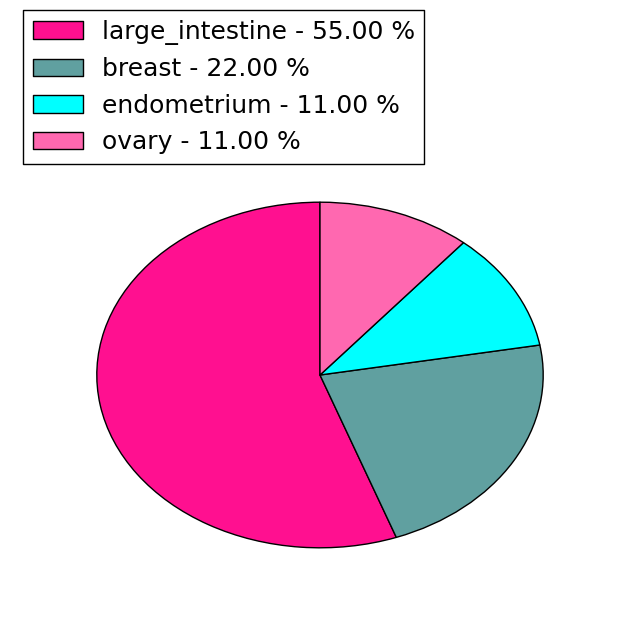
| Mutations for HSD17B7 |
| * Under tables are showing count per each tissue to give us broad intuition about tissue specific mutation patterns.You can go to the detailed page for each mutation database's web site. |
| - Statistics for Tissue and Mutation type | Top |
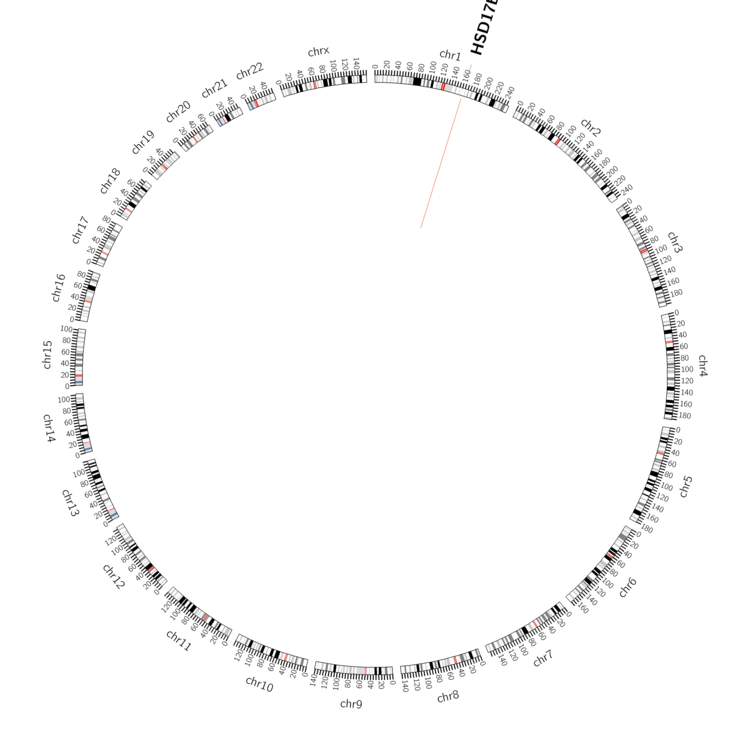 |
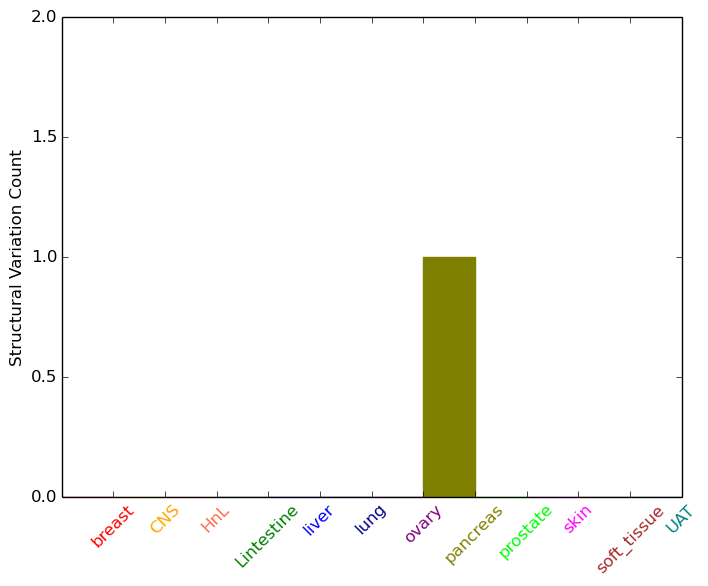
| - For Inter-chromosomal Variations |
| There's no inter-chromosomal structural variation. |
| - For Intra-chromosomal Variations |
| * Intra-chromosomal variantions includes 'intrachromosomal amplicon to amplicon', 'intrachromosomal amplicon to non-amplified dna', 'intrachromosomal deletion', 'intrachromosomal fold-back inversion', 'intrachromosomal inversion', 'intrachromosomal tandem duplication', 'Intrachromosomal unknown type', 'intrachromosomal with inverted orientation', 'intrachromosomal with non-inverted orientation'. |
 |
| Sample | Symbol_a | Chr_a | Start_a | End_a | Symbol_b | Chr_b | Start_b | End_b |
| pancreas | HSD17B7 | chr1 | 162773135 | 162773155 | HSD17B7 | chr1 | 162774054 | 162774074 |
| cf) Tissue number; Tissue name (1;Breast, 2;Central_nervous_system, 3;Haematopoietic_and_lymphoid_tissue, 4;Large_intestine, 5;Liver, 6;Lung, 7;Ovary, 8;Pancreas, 9;Prostate, 10;Skin, 11;Soft_tissue, 12;Upper_aerodigestive_tract) |
| * From mRNA Sanger sequences, Chitars2.0 arranged chimeric transcripts. This table shows HSD17B7 related fusion information. |
| ID | Head Gene | Tail Gene | Accession | Gene_a | qStart_a | qEnd_a | Chromosome_a | tStart_a | tEnd_a | Gene_a | qStart_a | qEnd_a | Chromosome_a | tStart_a | tEnd_a |
| Top |
| Mutation type/ Tissue ID | brca | cns | cerv | endome | haematopo | kidn | Lintest | liver | lung | ns | ovary | pancre | prost | skin | stoma | thyro | urina | |||
| Total # sample | 2 | 1 | ||||||||||||||||||
| GAIN (# sample) | 2 | 1 | ||||||||||||||||||
| LOSS (# sample) |
| cf) Tissue ID; Tissue type (1; Breast, 2; Central_nervous_system, 3; Cervix, 4; Endometrium, 5; Haematopoietic_and_lymphoid_tissue, 6; Kidney, 7; Large_intestine, 8; Liver, 9; Lung, 10; NS, 11; Ovary, 12; Pancreas, 13; Prostate, 14; Skin, 15; Stomach, 16; Thyroid, 17; Urinary_tract) |
| Top |
|
 |
| Top |
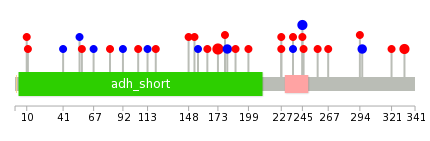
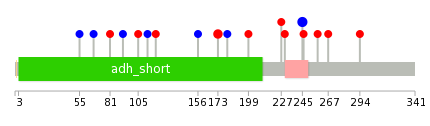
| Stat. for Non-Synonymous SNVs (# total SNVs=19) | (# total SNVs=9) |
 |  |
(# total SNVs=0) | (# total SNVs=0) |
| Top |
| * When you move the cursor on each content, you can see more deailed mutation information on the Tooltip. Those are primary_site,primary_histology,mutation(aa),pubmedID. |
| GRCh37 position | Mutation(aa) | Unique sampleID count |
| chr1:162769603-162769603 | p.S173N | 5 |
| chr1:162782178-162782178 | p.N332D | 3 |
| chr1:162773313-162773313 | p.P245P | 3 |
| chr1:162769628-162769628 | p.L181L | 2 |
| chr1:162775267-162775267 | p.Y296Y | 2 |
| chr1:162773314-162773314 | p.A246T | 1 |
| chr1:162766377-162766377 | p.F81C | 1 |
| chr1:162769622-162769622 | p.F179L | 1 |
| chr1:162773327-162773327 | p.? | 1 |
| chr1:162766411-162766411 | p.G92G | 1 |
| Top |
|
 |
| Point Mutation/ Tissue ID | 1 | 2 | 3 | 4 | 5 | 6 | 7 | 8 | 9 | 10 | 11 | 12 | 13 | 14 | 15 | 16 | 17 | 18 | 19 | 20 |
| # sample | 1 | 1 | 3 | 2 | 1 | 1 | 1 | 2 | 3 | 6 | ||||||||||
| # mutation | 1 | 1 | 2 | 1 | 1 | 1 | 1 | 2 | 3 | 6 | ||||||||||
| nonsynonymous SNV | 1 | 1 | 1 | 1 | 2 | 5 | ||||||||||||||
| synonymous SNV | 1 | 1 | 2 | 1 | 1 | 1 | 1 |
| cf) Tissue ID; Tissue type (1; BLCA[Bladder Urothelial Carcinoma], 2; BRCA[Breast invasive carcinoma], 3; CESC[Cervical squamous cell carcinoma and endocervical adenocarcinoma], 4; COAD[Colon adenocarcinoma], 5; GBM[Glioblastoma multiforme], 6; Glioma Low Grade, 7; HNSC[Head and Neck squamous cell carcinoma], 8; KICH[Kidney Chromophobe], 9; KIRC[Kidney renal clear cell carcinoma], 10; KIRP[Kidney renal papillary cell carcinoma], 11; LAML[Acute Myeloid Leukemia], 12; LUAD[Lung adenocarcinoma], 13; LUSC[Lung squamous cell carcinoma], 14; OV[Ovarian serous cystadenocarcinoma ], 15; PAAD[Pancreatic adenocarcinoma], 16; PRAD[Prostate adenocarcinoma], 17; SKCM[Skin Cutaneous Melanoma], 18:STAD[Stomach adenocarcinoma], 19:THCA[Thyroid carcinoma], 20:UCEC[Uterine Corpus Endometrial Carcinoma]) |
| Top |
| * We represented just top 10 SNVs. When you move the cursor on each content, you can see more deailed mutation information on the Tooltip. Those are primary_site, primary_histology, mutation(aa), pubmedID. |
| Genomic Position | Mutation(aa) | Unique sampleID count |
| chr1:162773313 | p.P245P | 3 |
| chr1:162769603 | p.S173N | 2 |
| chr1:162774108 | p.L156L | 1 |
| chr1:162767618 | p.L181L | 1 |
| chr1:162775260 | p.A199T | 1 |
| chr1:162769553 | p.L227F | 1 |
| chr1:162769628 | p.L230F | 1 |
| chr1:162769680 | p.A246T | 1 |
| chr1:162762578 | p.T258I | 1 |
| chr1:162773259 | p.A267T | 1 |
| * Copy number data were extracted from TCGA using R package TCGA-Assembler. The URLs of all public data files on TCGA DCC data server were gathered on Jan-05-2015. Function ProcessCNAData in TCGA-Assembler package was used to obtain gene-level copy number value which is calculated as the average copy number of the genomic region of a gene. |
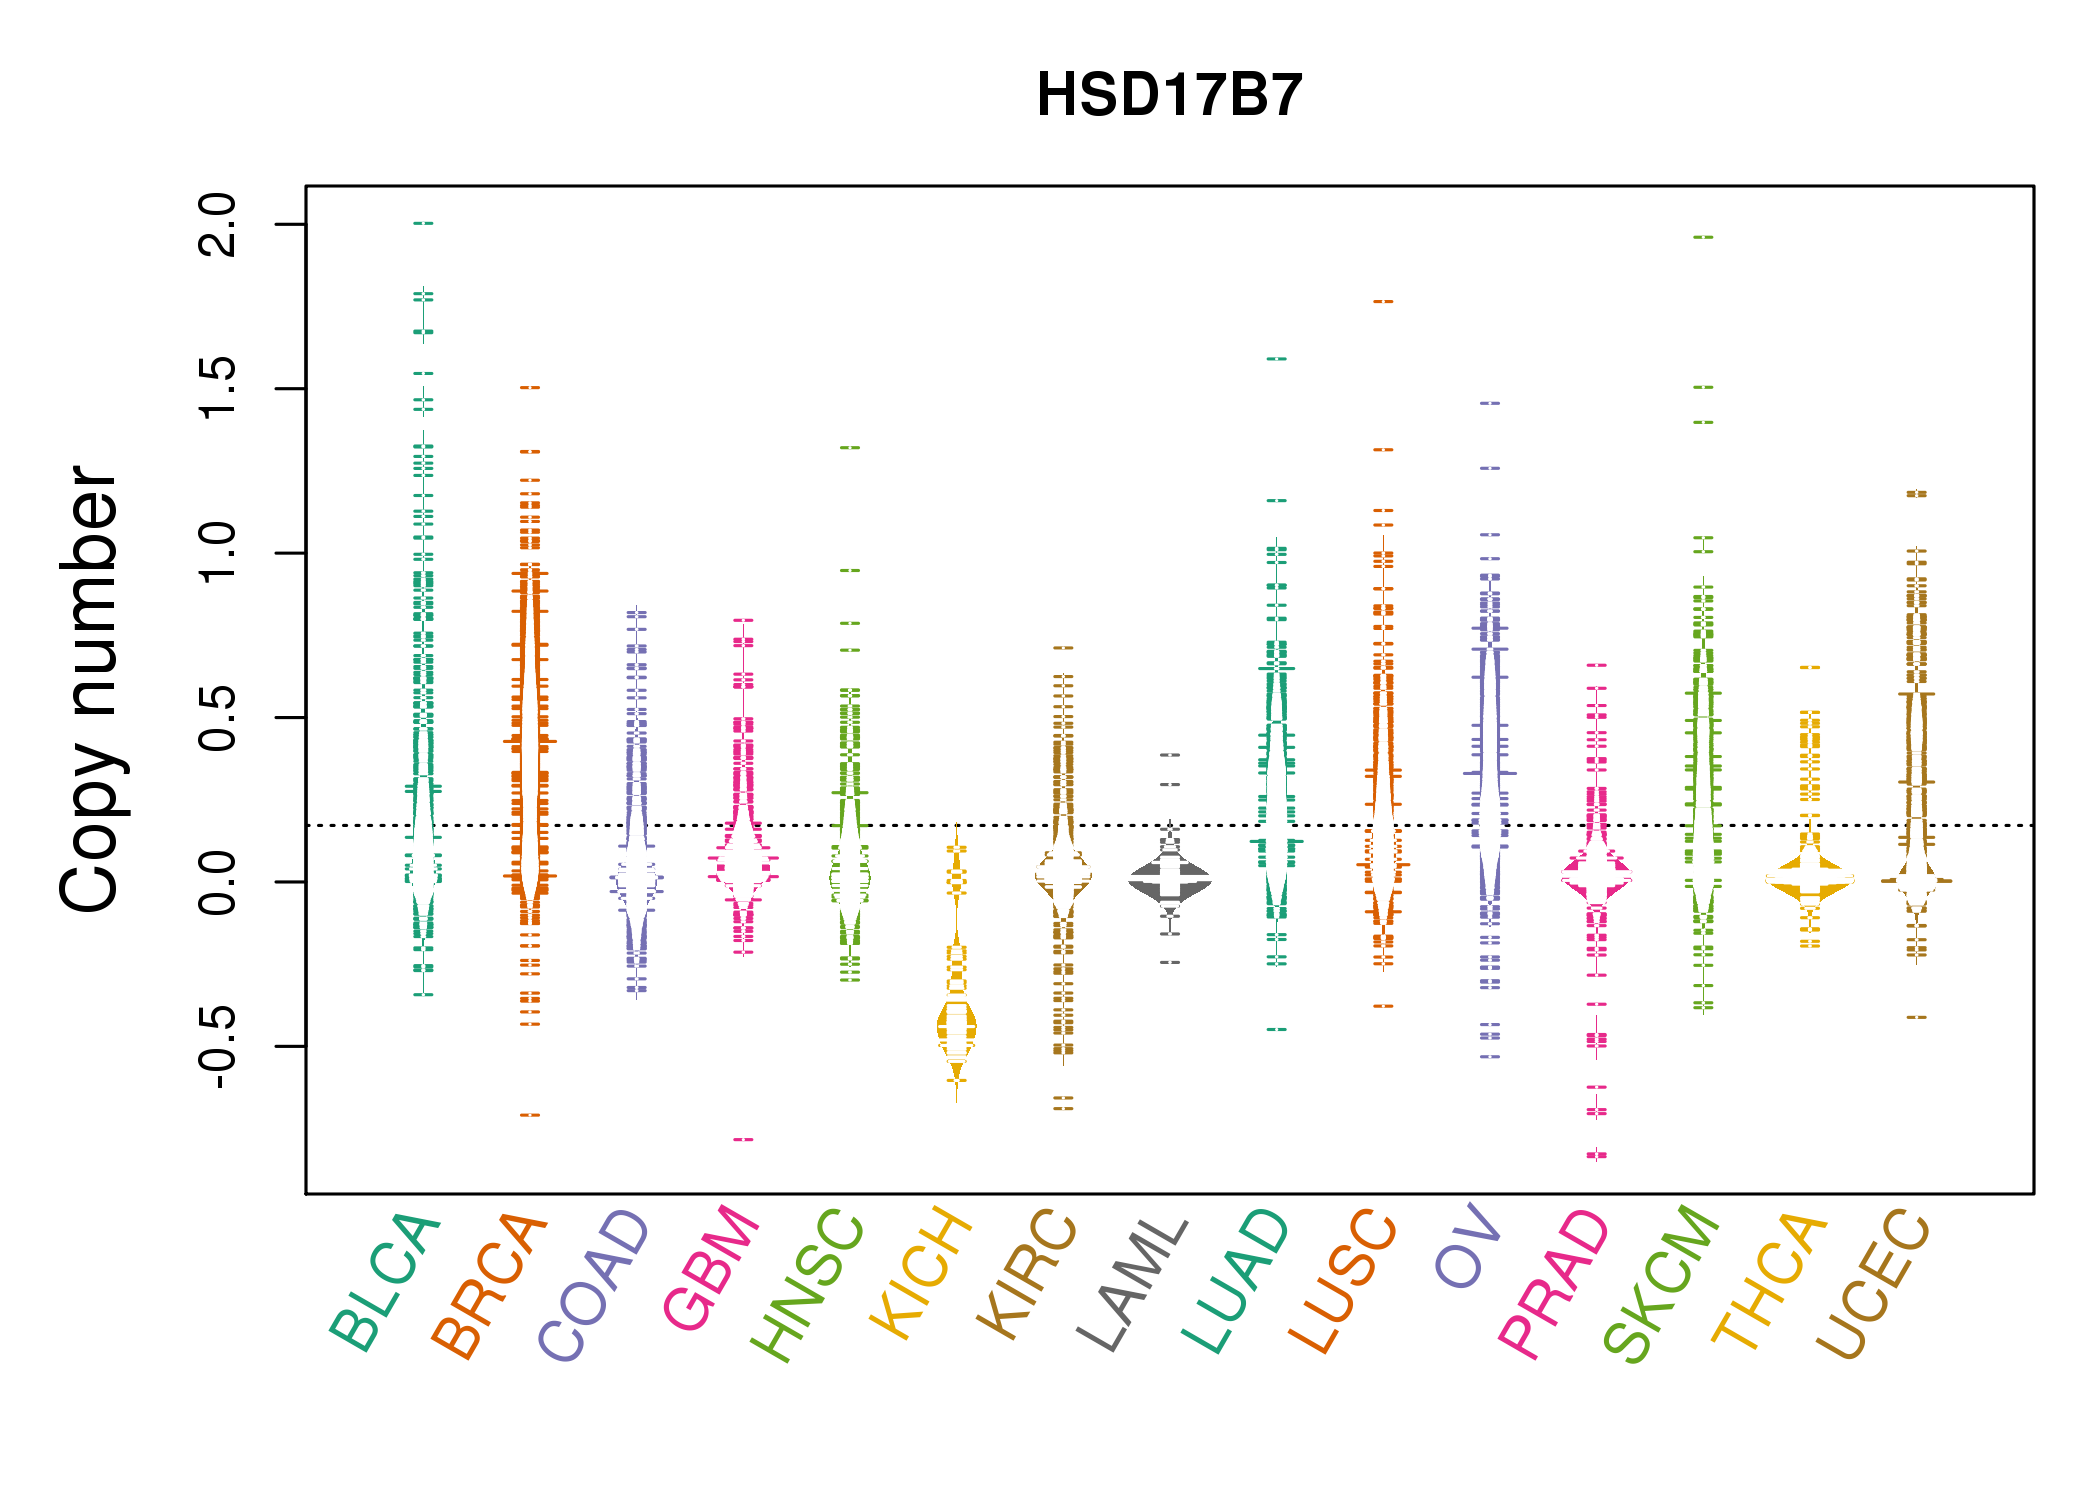 |
| cf) Tissue ID[Tissue type]: BLCA[Bladder Urothelial Carcinoma], BRCA[Breast invasive carcinoma], CESC[Cervical squamous cell carcinoma and endocervical adenocarcinoma], COAD[Colon adenocarcinoma], GBM[Glioblastoma multiforme], Glioma Low Grade, HNSC[Head and Neck squamous cell carcinoma], KICH[Kidney Chromophobe], KIRC[Kidney renal clear cell carcinoma], KIRP[Kidney renal papillary cell carcinoma], LAML[Acute Myeloid Leukemia], LUAD[Lung adenocarcinoma], LUSC[Lung squamous cell carcinoma], OV[Ovarian serous cystadenocarcinoma ], PAAD[Pancreatic adenocarcinoma], PRAD[Prostate adenocarcinoma], SKCM[Skin Cutaneous Melanoma], STAD[Stomach adenocarcinoma], THCA[Thyroid carcinoma], UCEC[Uterine Corpus Endometrial Carcinoma] |
| Top |
| Gene Expression for HSD17B7 |
| * CCLE gene expression data were extracted from CCLE_Expression_Entrez_2012-10-18.res: Gene-centric RMA-normalized mRNA expression data. |
 |
| * Normalized gene expression data of RNASeqV2 was extracted from TCGA using R package TCGA-Assembler. The URLs of all public data files on TCGA DCC data server were gathered at Jan-05-2015. Only eight cancer types have enough normal control samples for differential expression analysis. (t test, adjusted p<0.05 (using Benjamini-Hochberg FDR)) |
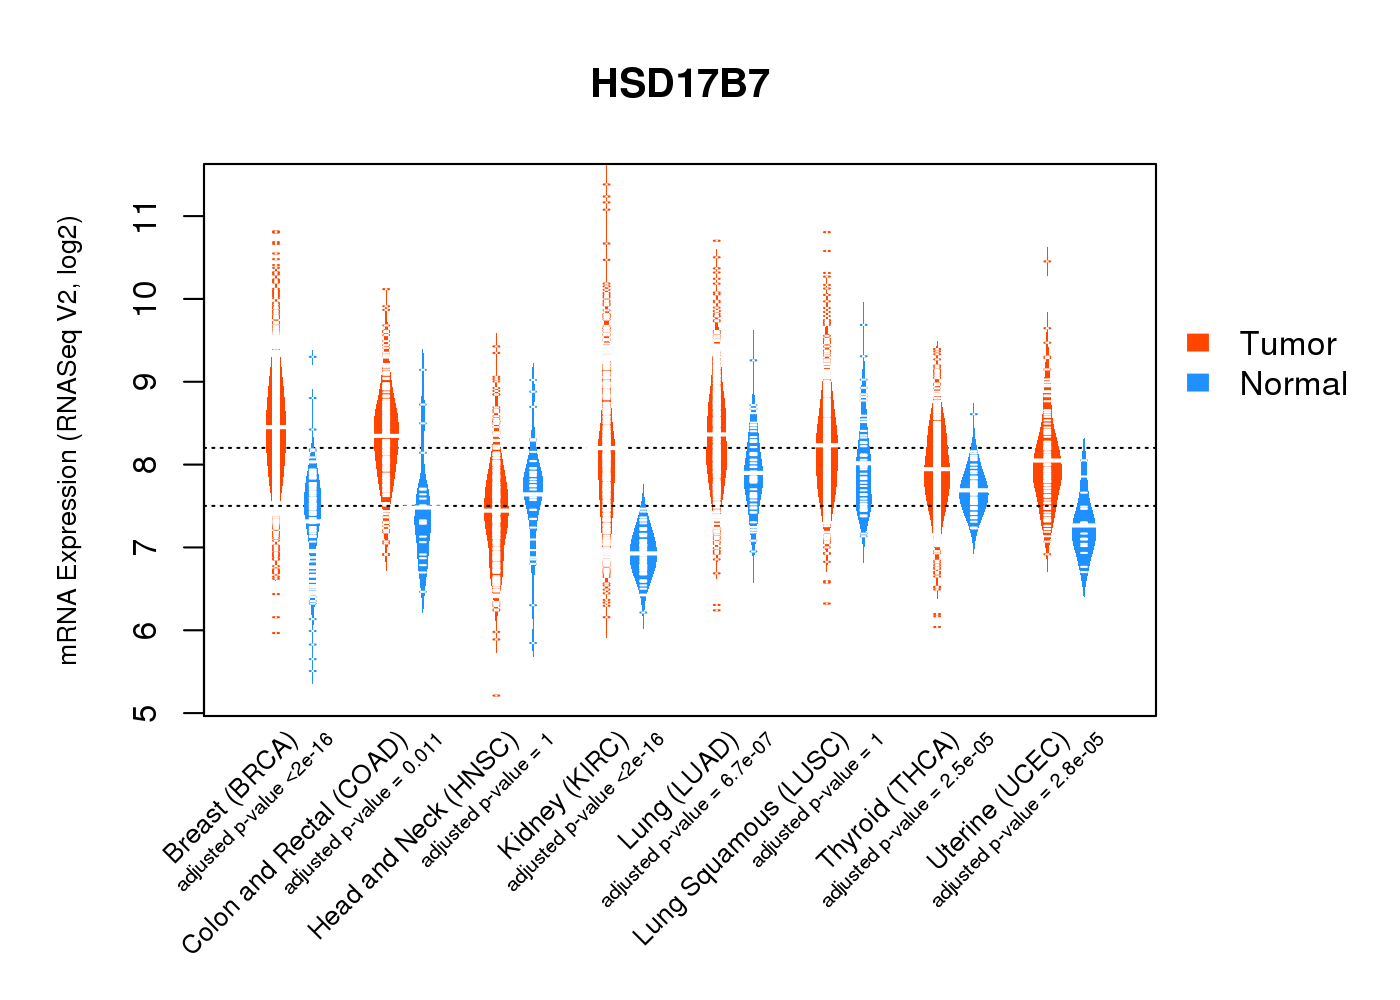 |
| Top |
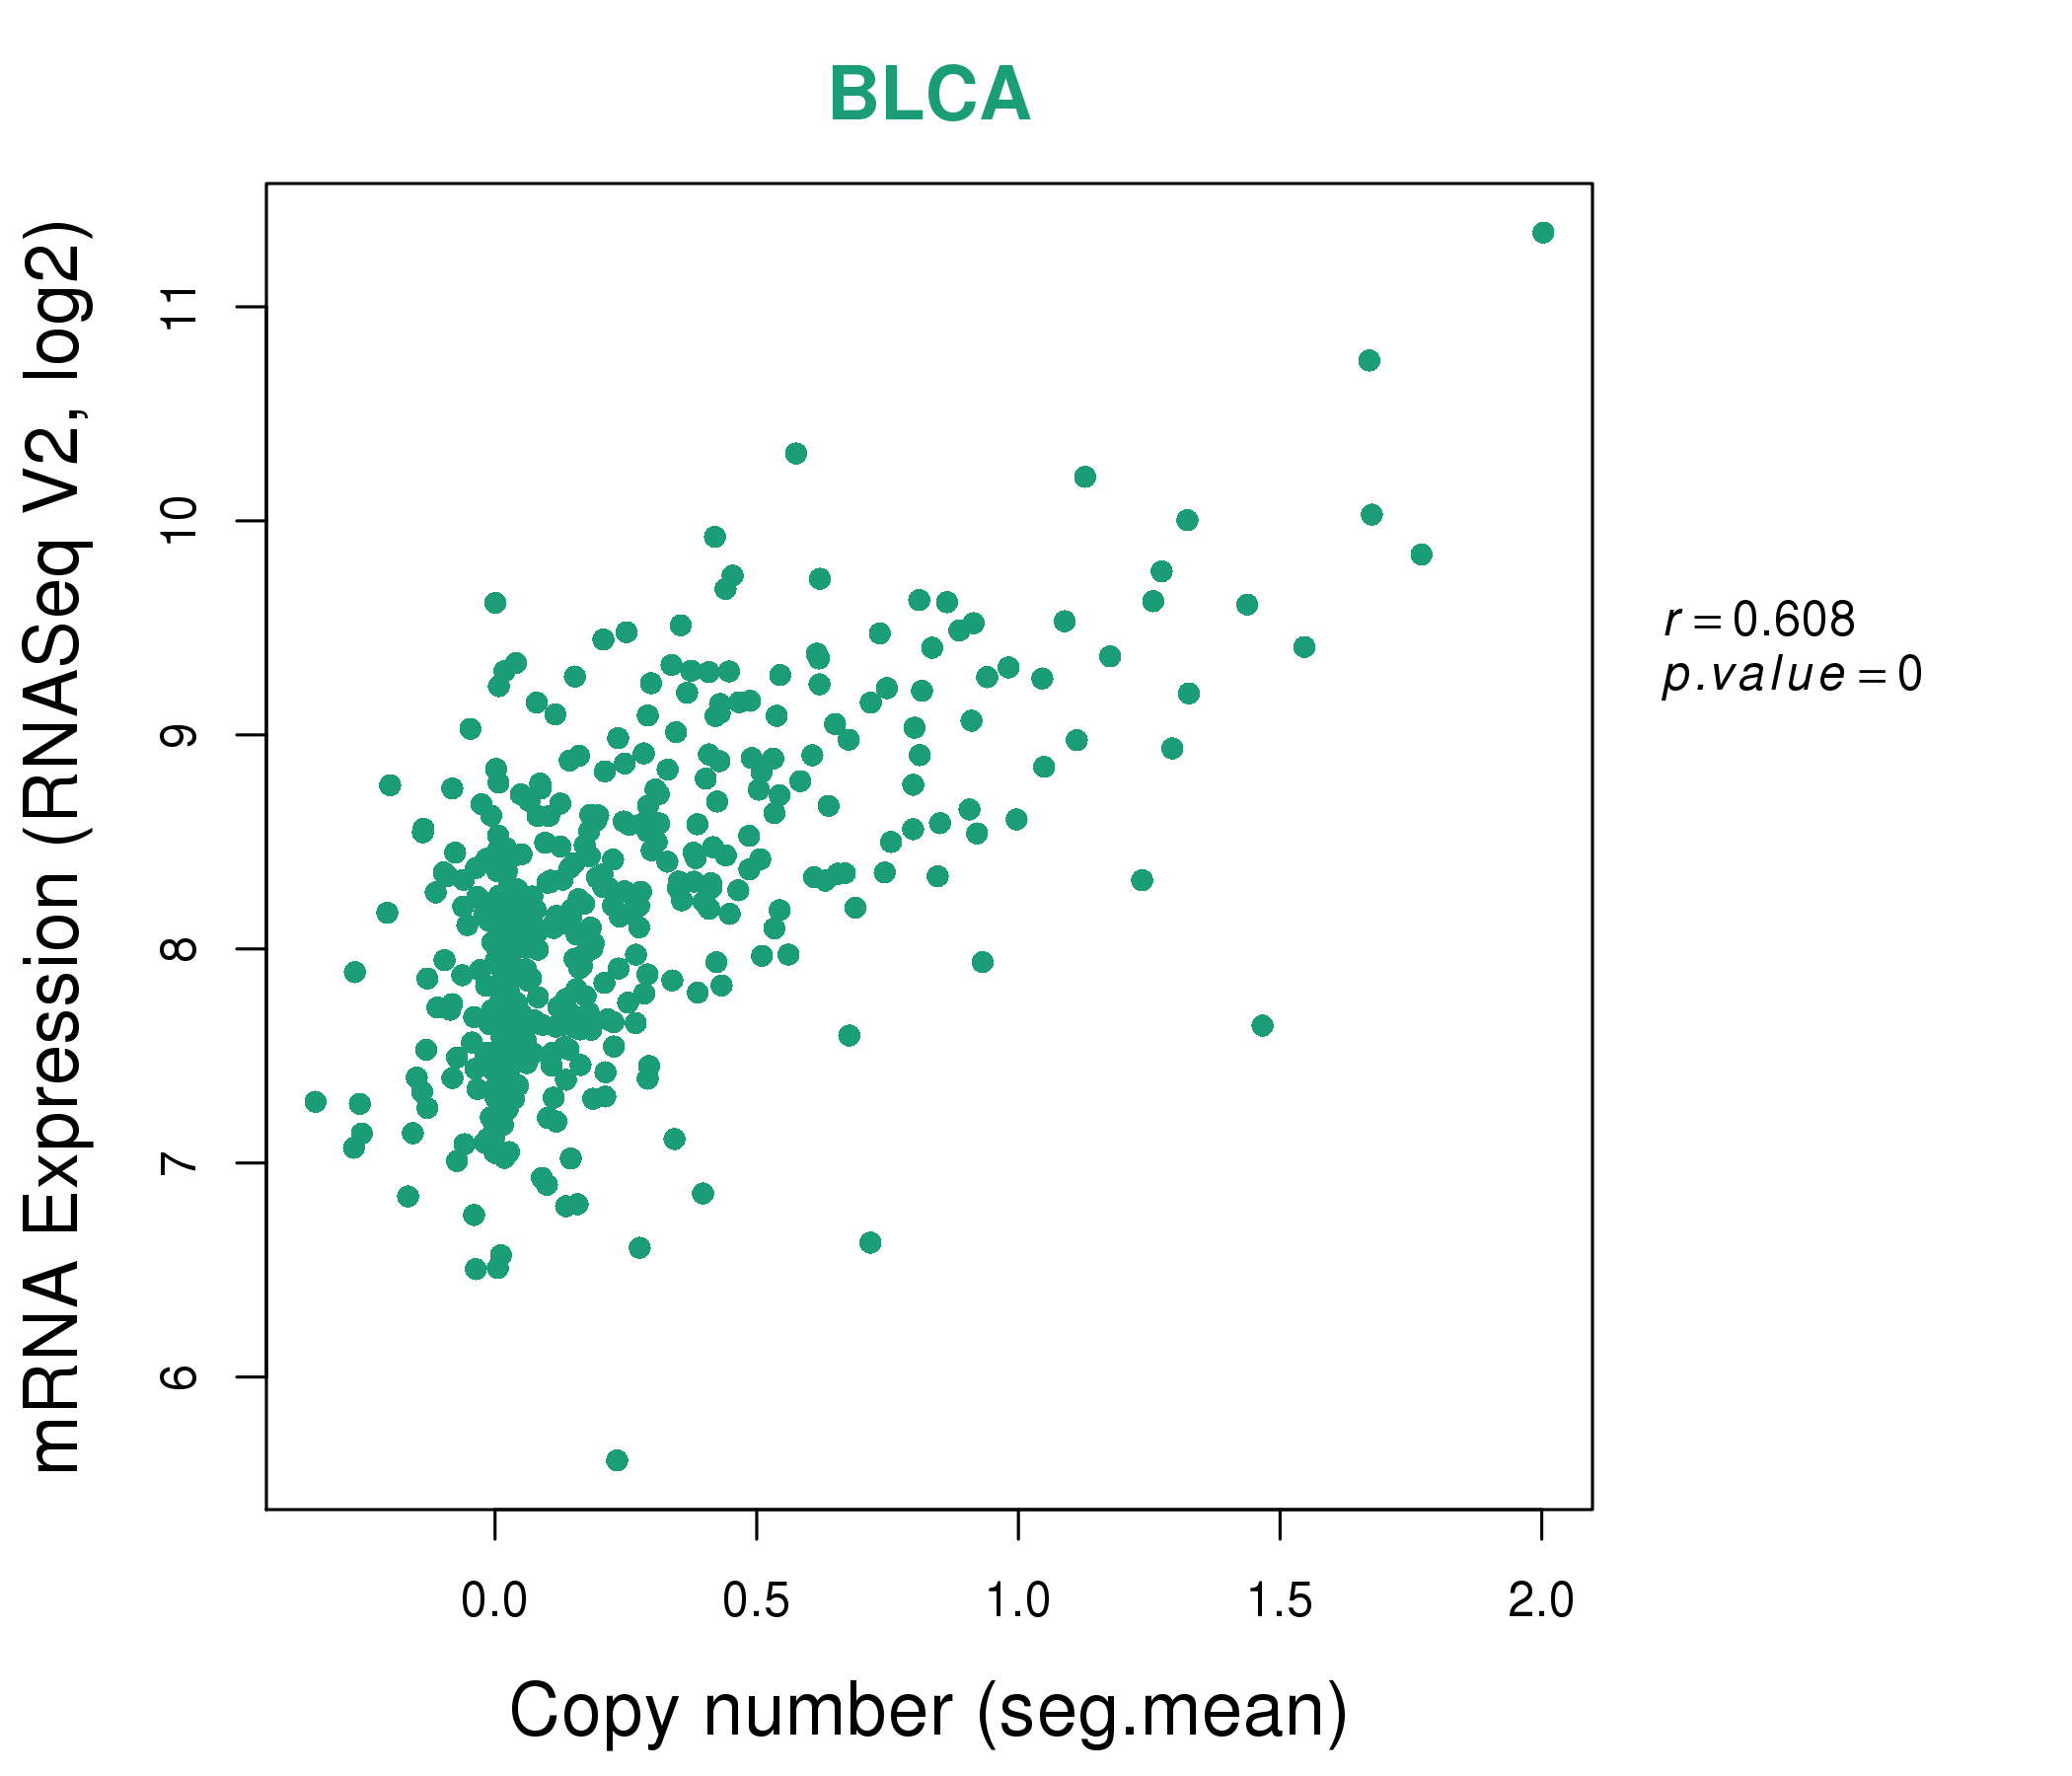
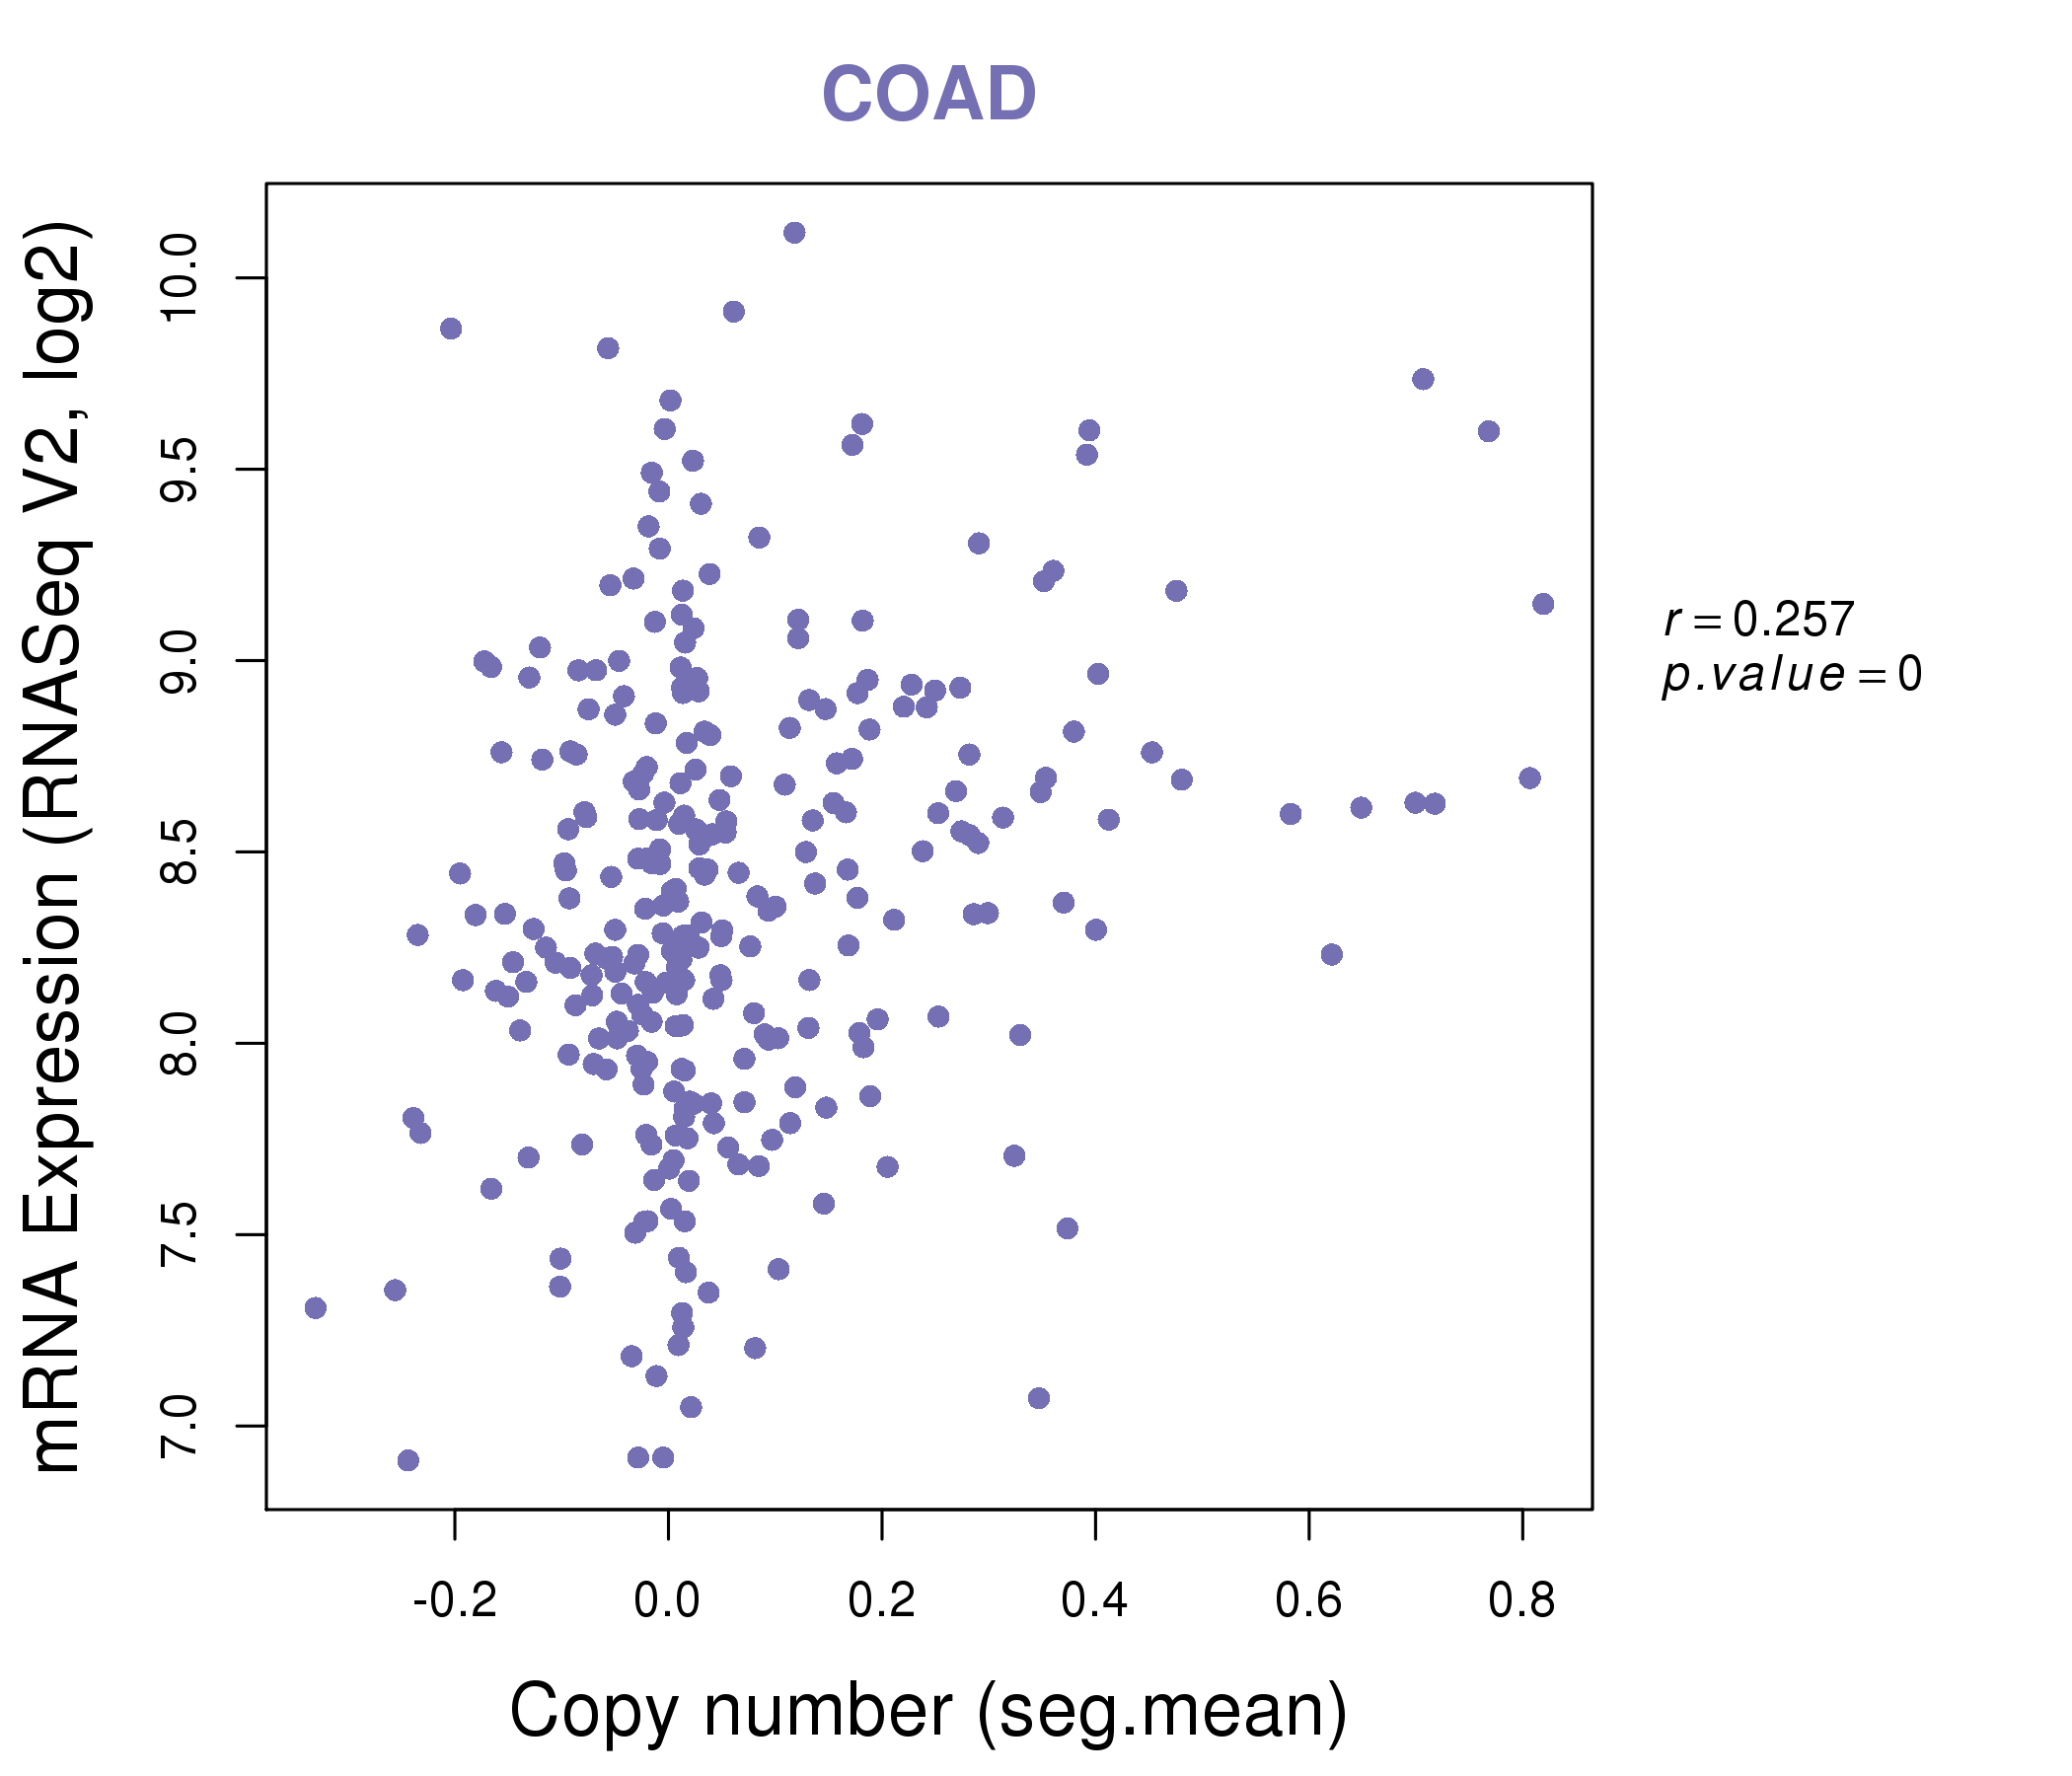
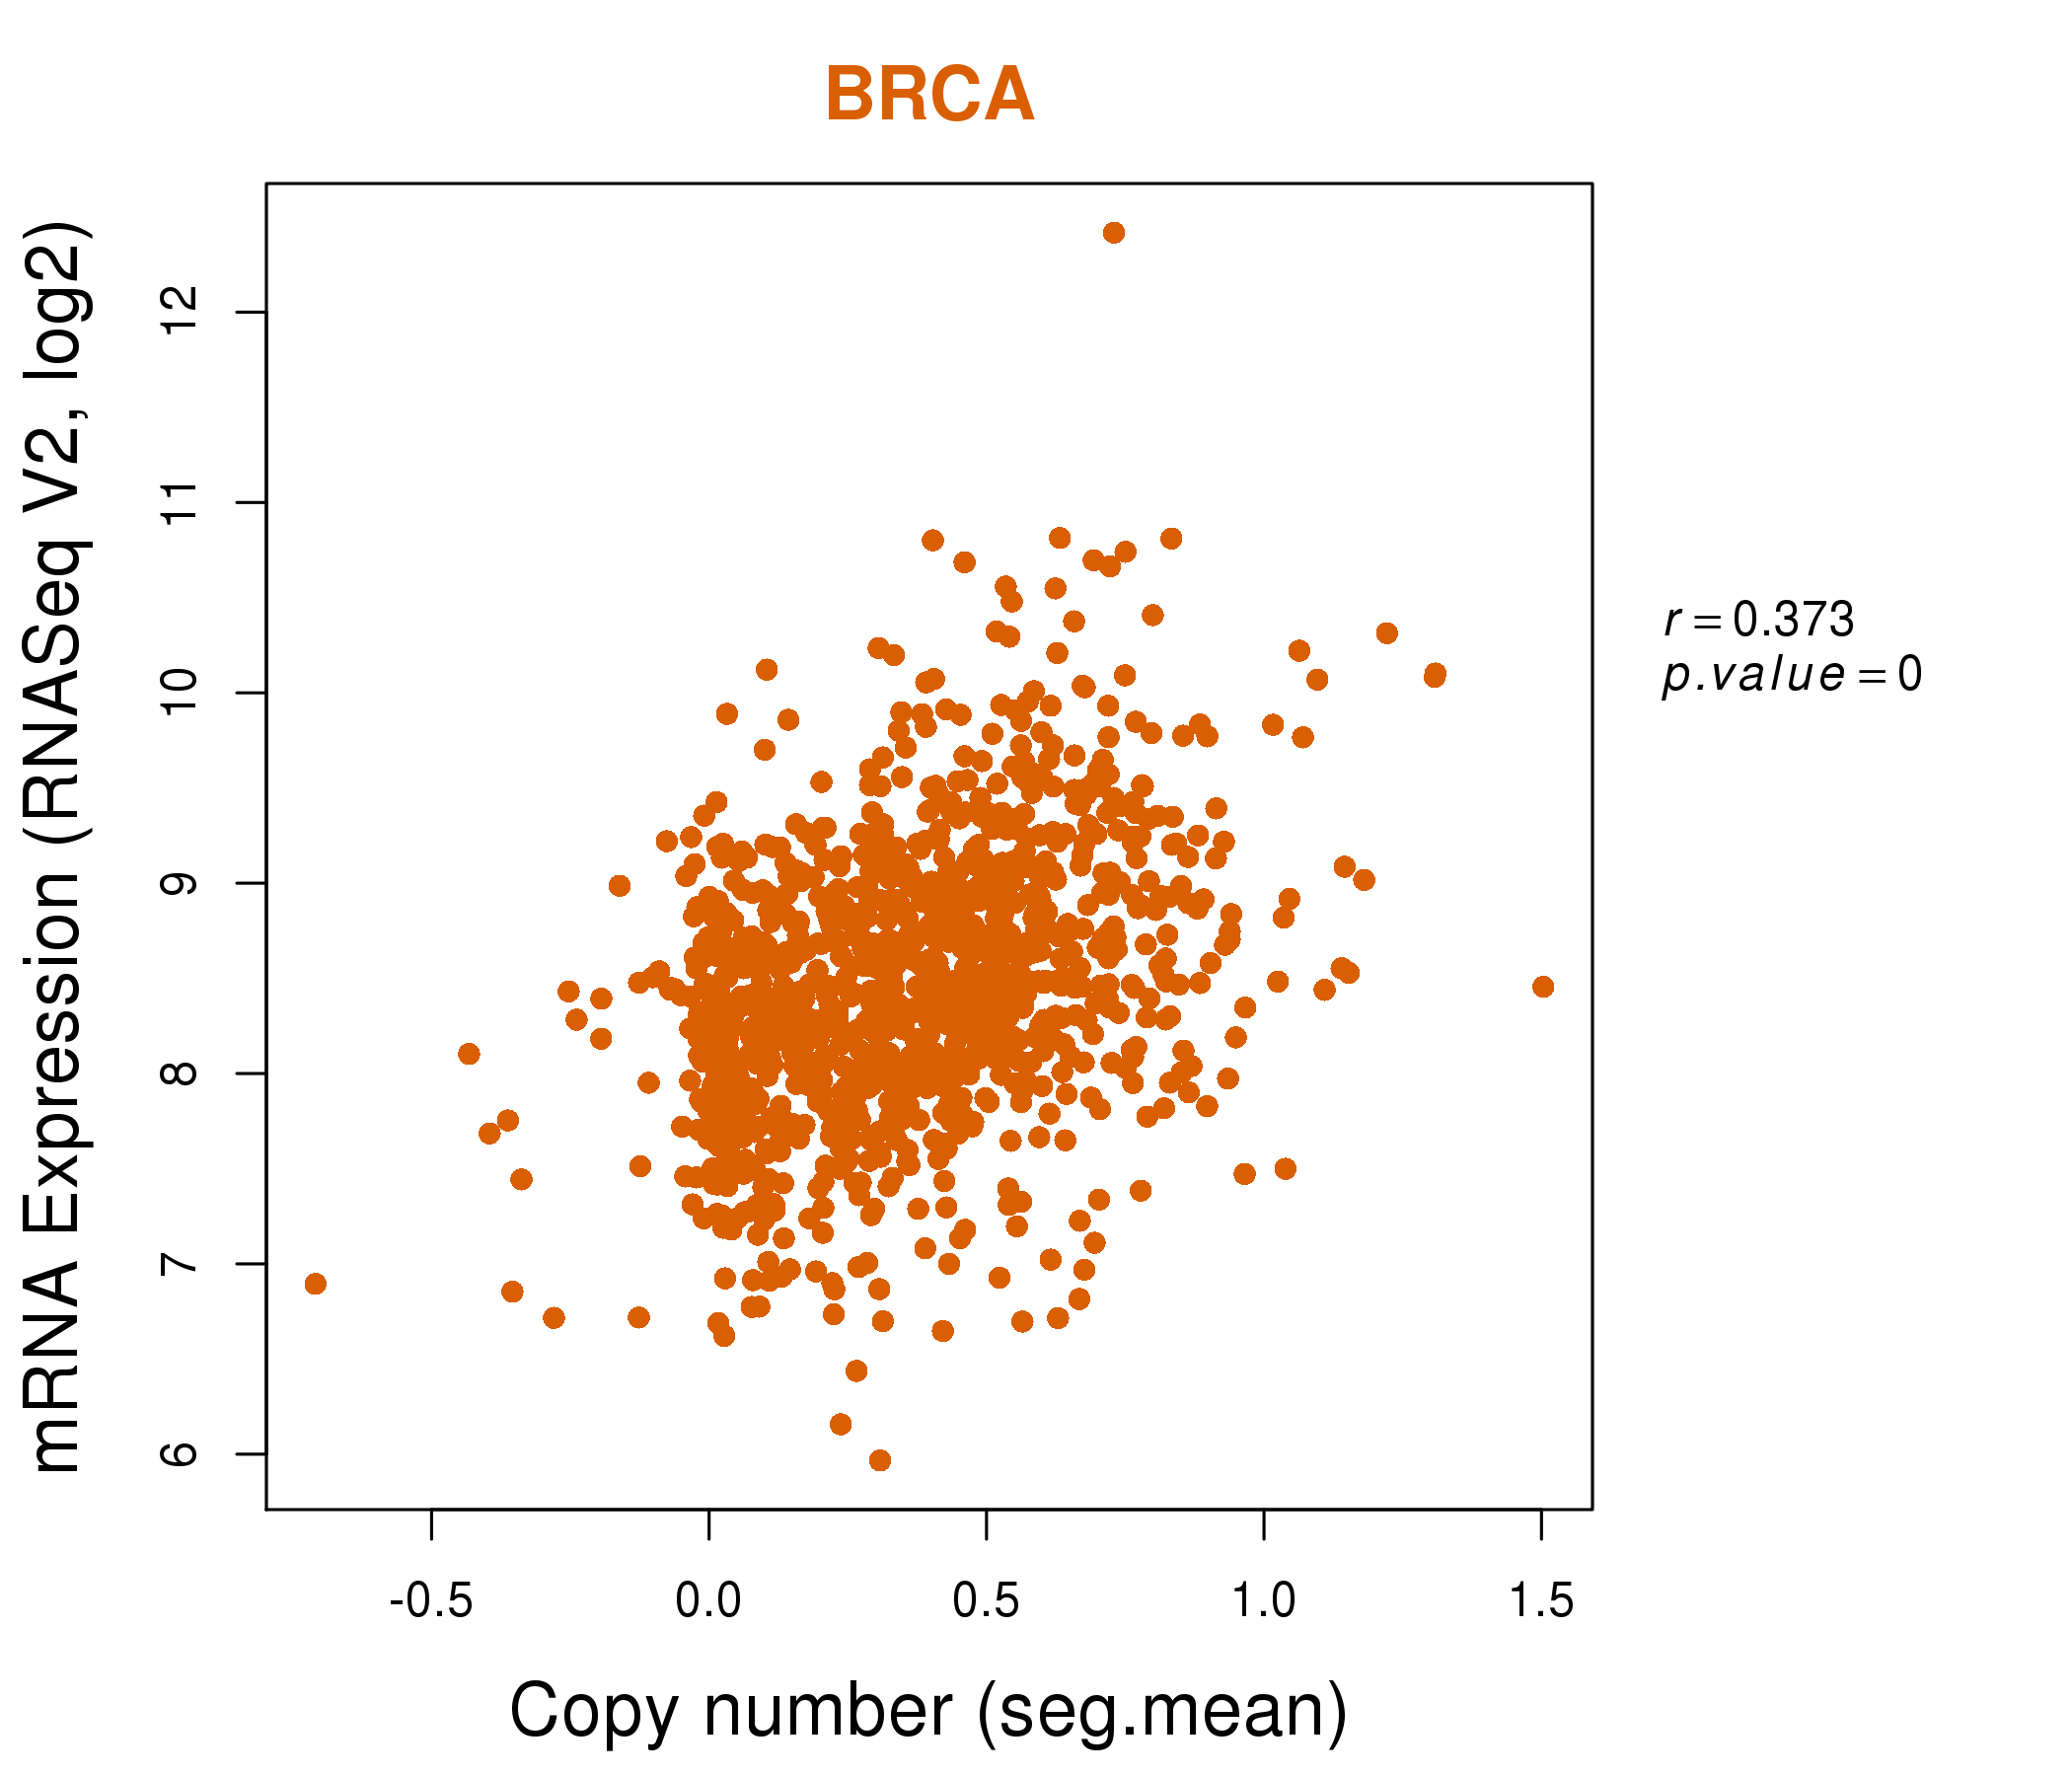
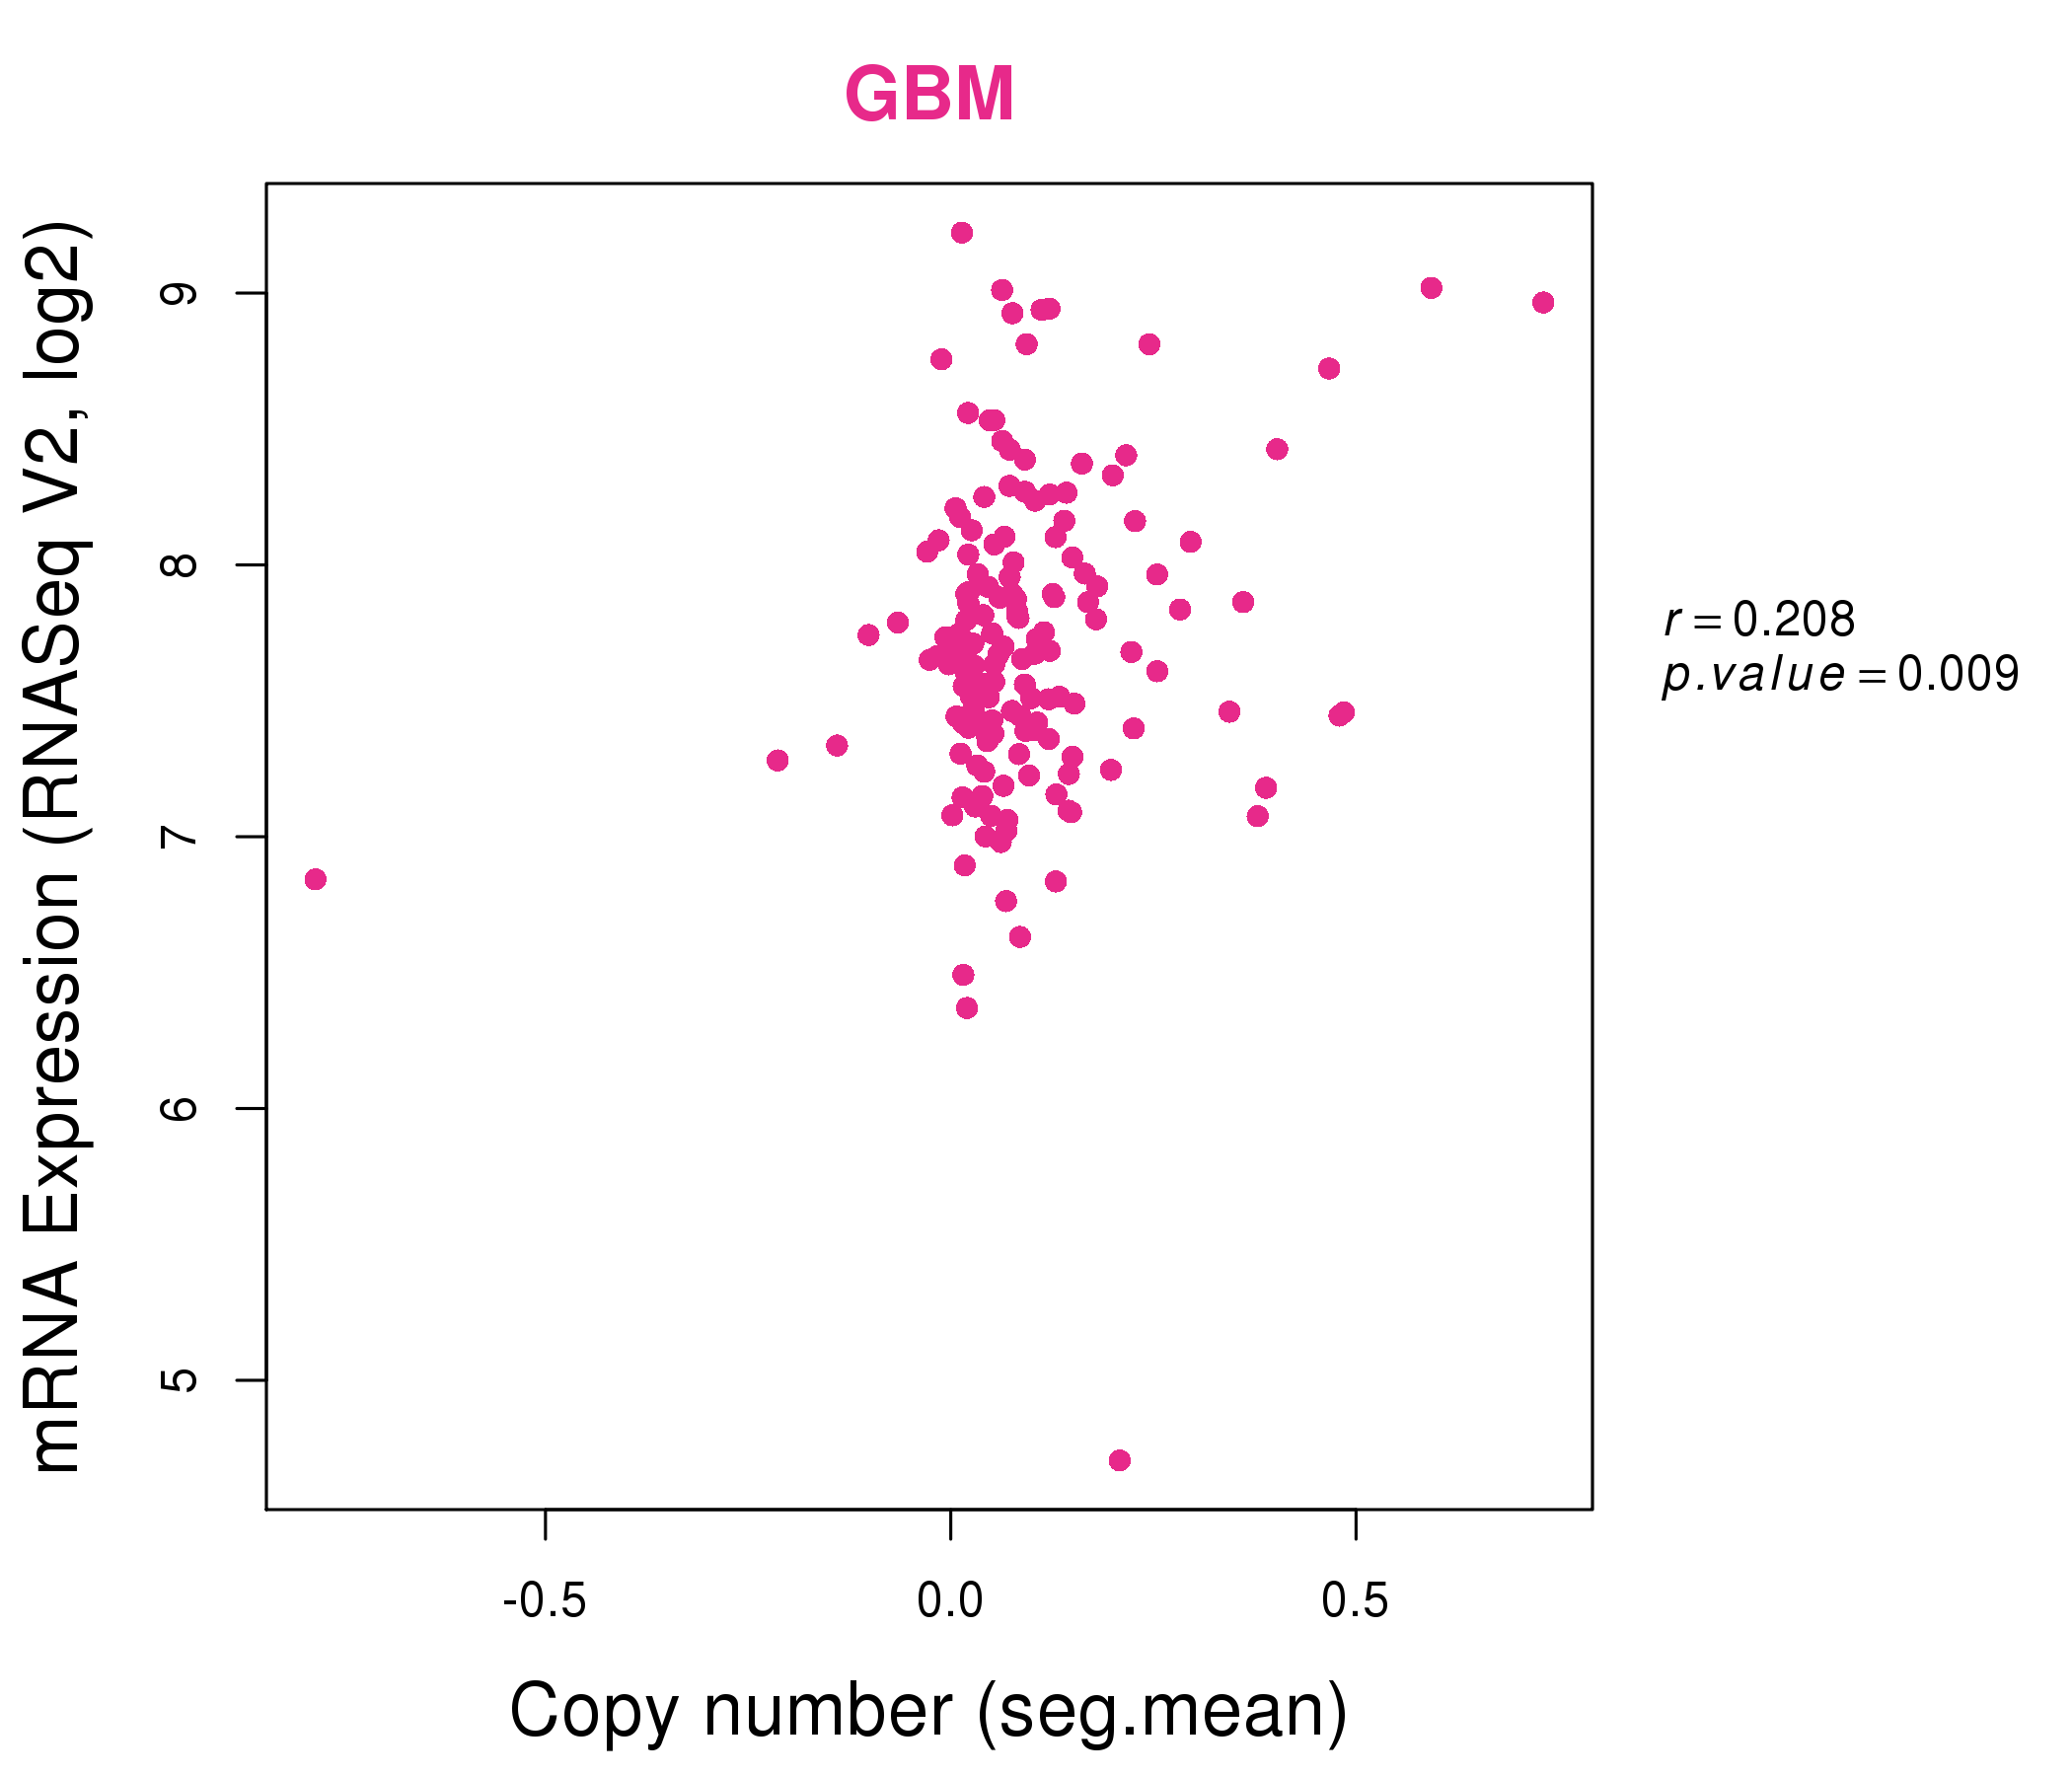
| * This plots show the correlation between CNV and gene expression. |
: Open all plots for all cancer types
 |
|
 |
|
| Top |
| Gene-Gene Network Information |
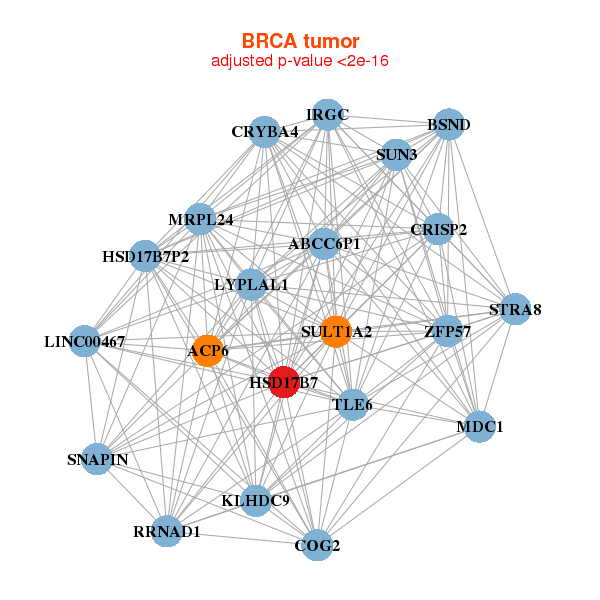
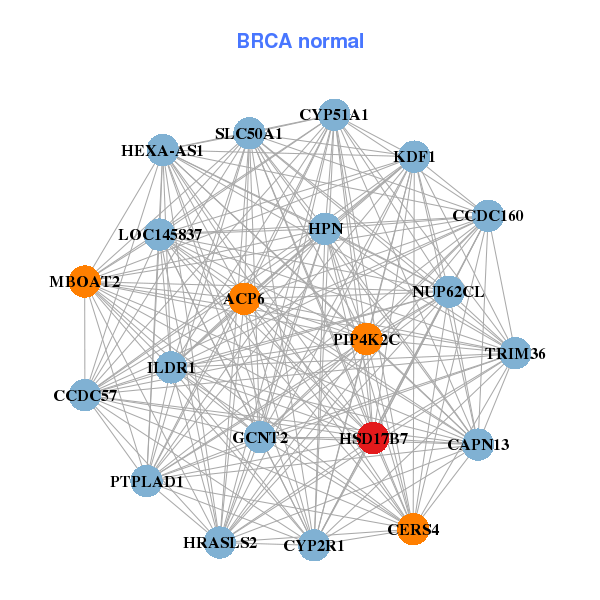
| * Co-Expression network figures were drawn using R package igraph. Only the top 20 genes with the highest correlations were shown. Red circle: input gene, orange circle: cell metabolism gene, sky circle: other gene |
: Open all plots for all cancer types
 |
| ||||
| ABCC6P1,ACP6,BSND,RRNAD1,LINC00467,COG2,CRISP2, CRYBA4,HSD17B7,HSD17B7P2,IRGC,KLHDC9,LYPLAL1,MDC1, MRPL24,SNAPIN,STRA8,SULT1A2,SUN3,TLE6,ZFP57 | ACP6,HEXA-AS1,KDF1,CAPN13,CCDC160,CCDC57,CYP2R1, CYP51A1,GCNT2,HPN,HRASLS2,HSD17B7,ILDR1,CERS4, LOC145837,MBOAT2,NUP62CL,PIP4K2C,PTPLAD1,SLC50A1,TRIM36 | ||||
 |
| ||||
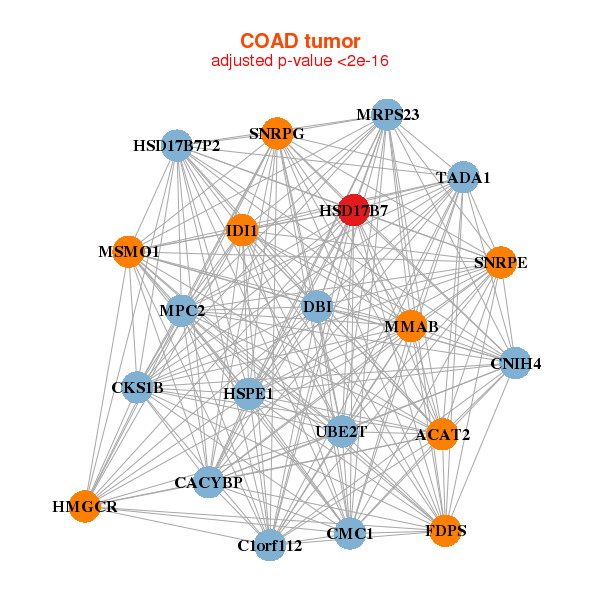
| ACAT2,MPC2,C1orf112,CACYBP,CKS1B,CMC1,CNIH4, DBI,FDPS,HMGCR,HSD17B7,HSD17B7P2,HSPE1,IDI1, MMAB,MRPS23,MSMO1,SNRPE,SNRPG,TADA1,UBE2T | HYPK,EIF5A,EIF5AL1,GOLT1B,HAT1,HSD17B7,MAGOHB, MMAB,MRPL17,MTHFD2,NME1,PPA1,PPIL1,PSMA3, PSMA4,PSMA7,PSMD14,RAN,SNRPD1,SNRPG,TOMM5 |
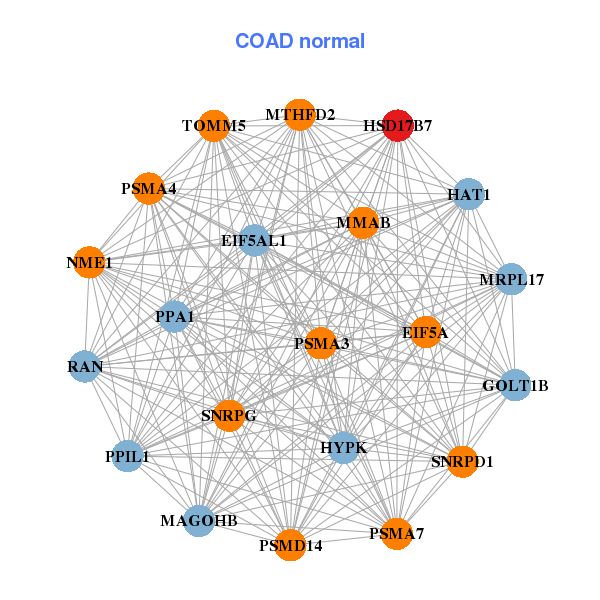
| * Co-Expression network figures were drawn using R package igraph. Only the top 20 genes with the highest correlations were shown. Red circle: input gene, orange circle: cell metabolism gene, sky circle: other gene |
: Open all plots for all cancer types
| Top |
: Open all interacting genes' information including KEGG pathway for all interacting genes from DAVID
| Top |
| Pharmacological Information for HSD17B7 |
| DB Category | DB Name | DB's ID and Url link |
| * Gene Centered Interaction Network. |
 |
| * Drug Centered Interaction Network. |
| DrugBank ID | Target Name | Drug Groups | Generic Name | Drug Centered Network | Drug Structure |
| DB00157 | hydroxysteroid (17-beta) dehydrogenase 7 | approved; nutraceutical | NADH |  |  |
| Top |
| Cross referenced IDs for HSD17B7 |
| * We obtained these cross-references from Uniprot database. It covers 150 different DBs, 18 categories. http://www.uniprot.org/help/cross_references_section |
: Open all cross reference information
|
Copyright © 2016-Present - The Univsersity of Texas Health Science Center at Houston @ |