|
|||||||||||||||||||||||||||||||||||||||||||||||||||||||||||||||||||||||||||||||||||||||||||||||||||||||||||||||||||||||||||||||||||||||||||||||||||||||||||||||||||||||||||||||||||||||||||||||||||||||||||||||||||||||||||||||||||||||||||||||||||||||||||||||||||||||||||||||||||||||||||||||||||||||||||||||||||||||||||||||||||||||||||||||||||||||||||||||
| |
| Phenotypic Information (metabolism pathway, cancer, disease, phenome) |
| |
| |
| Gene-Gene Network Information: Co-Expression Network, Interacting Genes & KEGG |
| |
|


| Gene Summary for PDE8A |
| Top |
| Phenotypic Information for PDE8A(metabolism pathway, cancer, disease, phenome) |
| Cancer | CGAP: PDE8A |
| Familial Cancer Database: PDE8A | |
| * This gene is included in those cancer gene databases. |
|
|
|
|
|
| . | |||||||||||||||||||||||||||||||||||||||||||||||||||||||||||||||||||||||||||||||||||||||||||||||||||||||||||||||||||||||||||||||||||||||||||||||||||||||||||||||||||||||||||||||||||||||||||||||||||||||||||||||||||||||||||||||||||||||||||||||||||||||||||||||||||||||||||||||||||||||||||||||||||||||||||||||||||||||||||||||||||||||||||||||||||||||||
Oncogene 1 | Significant driver gene in | ||||||||||||||||||||||||||||||||||||||||||||||||||||||||||||||||||||||||||||||||||||||||||||||||||||||||||||||||||||||||||||||||||||||||||||||||||||||||||||||||||||||||||||||||||||||||||||||||||||||||||||||||||||||||||||||||||||||||||||||||||||||||||||||||||||||||||||||||||||||||||||||||||||||||||||||||||||||||||||||||||||||||||||||||||||||||||||||
| cf) number; DB name 1 Oncogene; http://nar.oxfordjournals.org/content/35/suppl_1/D721.long, 2 Tumor Suppressor gene; https://bioinfo.uth.edu/TSGene/, 3 Cancer Gene Census; http://www.nature.com/nrc/journal/v4/n3/abs/nrc1299.html, 4 CancerGenes; http://nar.oxfordjournals.org/content/35/suppl_1/D721.long, 5 Network of Cancer Gene; http://ncg.kcl.ac.uk/index.php, 1Therapeutic Vulnerabilities in Cancer; http://cbio.mskcc.org/cancergenomics/statius/ |
| KEGG_PURINE_METABOLISM | |
| OMIM | |
| Orphanet | |
| Disease | KEGG Disease: PDE8A |
| MedGen: PDE8A (Human Medical Genetics with Condition) | |
| ClinVar: PDE8A | |
| Phenotype | MGI: PDE8A (International Mouse Phenotyping Consortium) |
| PhenomicDB: PDE8A | |
| Mutations for PDE8A |
| * Under tables are showing count per each tissue to give us broad intuition about tissue specific mutation patterns.You can go to the detailed page for each mutation database's web site. |
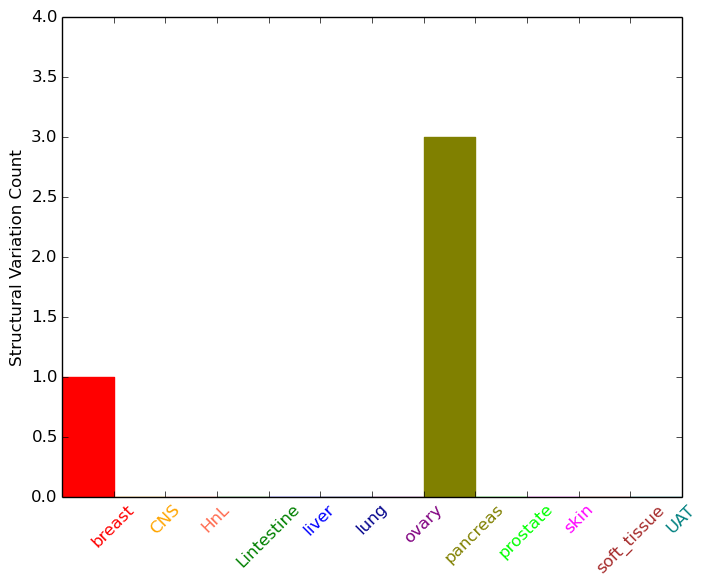
| - Statistics for Tissue and Mutation type | Top |
 |
| - For Inter-chromosomal Variations |
| There's no inter-chromosomal structural variation. |
| - For Intra-chromosomal Variations |
| * Intra-chromosomal variantions includes 'intrachromosomal amplicon to amplicon', 'intrachromosomal amplicon to non-amplified dna', 'intrachromosomal deletion', 'intrachromosomal fold-back inversion', 'intrachromosomal inversion', 'intrachromosomal tandem duplication', 'Intrachromosomal unknown type', 'intrachromosomal with inverted orientation', 'intrachromosomal with non-inverted orientation'. |
 |
| Sample | Symbol_a | Chr_a | Start_a | End_a | Symbol_b | Chr_b | Start_b | End_b |
| breast | PDE8A | chr15 | 85528232 | 85528232 | chr15 | 102064754 | 102064754 | |
| pancreas | PDE8A | chr15 | 85636627 | 85636647 | PDE8A | chr15 | 85619168 | 85619188 |
| pancreas | PDE8A | chr15 | 85638340 | 85638360 | chr15 | 32068312 | 32068332 | |
| pancreas | PDE8A | chr15 | 85639984 | 85640004 | chr15 | 97177916 | 97177936 |
| cf) Tissue number; Tissue name (1;Breast, 2;Central_nervous_system, 3;Haematopoietic_and_lymphoid_tissue, 4;Large_intestine, 5;Liver, 6;Lung, 7;Ovary, 8;Pancreas, 9;Prostate, 10;Skin, 11;Soft_tissue, 12;Upper_aerodigestive_tract) |
| * From mRNA Sanger sequences, Chitars2.0 arranged chimeric transcripts. This table shows PDE8A related fusion information. |
| ID | Head Gene | Tail Gene | Accession | Gene_a | qStart_a | qEnd_a | Chromosome_a | tStart_a | tEnd_a | Gene_a | qStart_a | qEnd_a | Chromosome_a | tStart_a | tEnd_a |
| BF770537 | PDE8A | 10 | 267 | 15 | 85645170 | 85645428 | IPO5 | 257 | 386 | 13 | 98662387 | 98662516 | |
| BF951597 | PDE8A | 1 | 73 | 15 | 85666328 | 85666402 | PDE8A | 62 | 441 | 15 | 85660947 | 85666329 | |
| W92044 | FAM20A | 1 | 89 | 17 | 66531258 | 66531346 | PDE8A | 78 | 533 | 15 | 85681730 | 85682185 | |
| W91923 | FAM20A | 1 | 89 | 17 | 66531258 | 66531346 | PDE8A | 78 | 536 | 15 | 85681733 | 85682185 | |
| Top |
| Mutation type/ Tissue ID | brca | cns | cerv | endome | haematopo | kidn | Lintest | liver | lung | ns | ovary | pancre | prost | skin | stoma | thyro | urina | |||
| Total # sample | 1 | 1 | 1 | 1 | ||||||||||||||||
| GAIN (# sample) | 1 | 1 | 1 | |||||||||||||||||
| LOSS (# sample) | 1 |
| cf) Tissue ID; Tissue type (1; Breast, 2; Central_nervous_system, 3; Cervix, 4; Endometrium, 5; Haematopoietic_and_lymphoid_tissue, 6; Kidney, 7; Large_intestine, 8; Liver, 9; Lung, 10; NS, 11; Ovary, 12; Pancreas, 13; Prostate, 14; Skin, 15; Stomach, 16; Thyroid, 17; Urinary_tract) |
| Top |
|
 |
| Top |
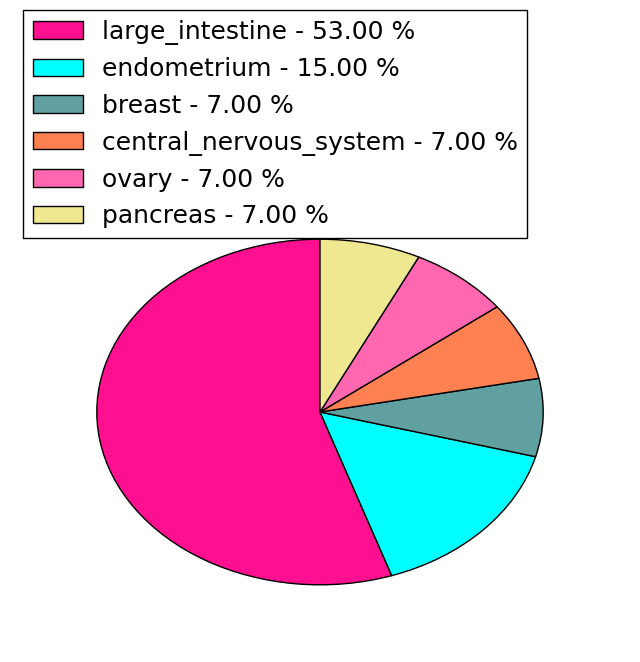
| Stat. for Non-Synonymous SNVs (# total SNVs=39) | (# total SNVs=13) |
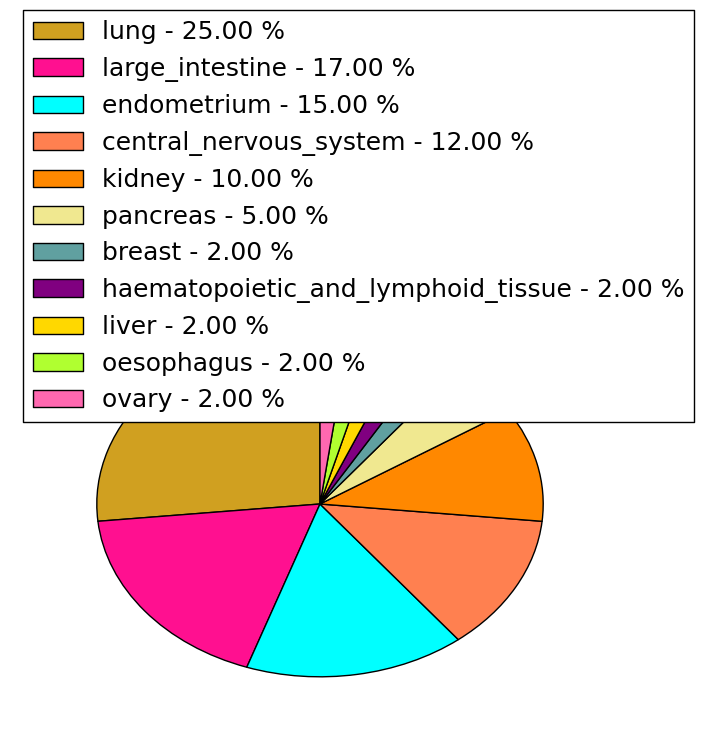 |  |
(# total SNVs=0) | (# total SNVs=0) |
| Top |
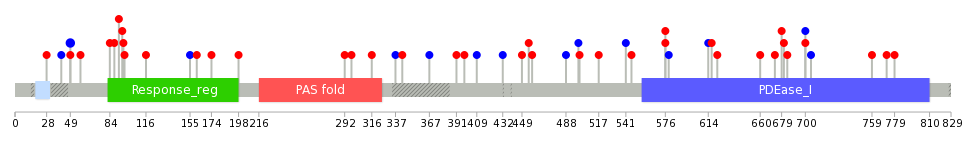
| * When you move the cursor on each content, you can see more deailed mutation information on the Tooltip. Those are primary_site,primary_histology,mutation(aa),pubmedID. |
| GRCh37 position | Mutation(aa) | Unique sampleID count |
| chr15:85664054-85664054 | p.V587V | 2 |
| chr15:85610364-85610364 | p.L121L | 2 |
| chr15:85669540-85669540 | p.P730S | 2 |
| chr15:85666344-85666344 | p.E669* | 1 |
| chr15:85656623-85656623 | p.R377L | 1 |
| chr15:85669573-85669573 | p.A741S | 1 |
| chr15:85610351-85610351 | p.L117H | 1 |
| chr15:85659275-85659275 | p.R487L | 1 |
| chr15:85632614-85632614 | p.A227A | 1 |
| chr15:85666364-85666364 | p.E675E | 1 |
| Top |
|
 |
| Point Mutation/ Tissue ID | 1 | 2 | 3 | 4 | 5 | 6 | 7 | 8 | 9 | 10 | 11 | 12 | 13 | 14 | 15 | 16 | 17 | 18 | 19 | 20 |
| # sample | 1 | 1 | 9 | 1 | 1 | 4 | 3 | 6 | 2 | 1 | 5 | 8 | 7 | |||||||
| # mutation | 1 | 1 | 9 | 1 | 1 | 4 | 3 | 6 | 2 | 1 | 5 | 8 | 7 | |||||||
| nonsynonymous SNV | 1 | 1 | 3 | 1 | 4 | 3 | 5 | 1 | 1 | 3 | 6 | 5 | ||||||||
| synonymous SNV | 6 | 1 | 1 | 1 | 2 | 2 | 2 |
| cf) Tissue ID; Tissue type (1; BLCA[Bladder Urothelial Carcinoma], 2; BRCA[Breast invasive carcinoma], 3; CESC[Cervical squamous cell carcinoma and endocervical adenocarcinoma], 4; COAD[Colon adenocarcinoma], 5; GBM[Glioblastoma multiforme], 6; Glioma Low Grade, 7; HNSC[Head and Neck squamous cell carcinoma], 8; KICH[Kidney Chromophobe], 9; KIRC[Kidney renal clear cell carcinoma], 10; KIRP[Kidney renal papillary cell carcinoma], 11; LAML[Acute Myeloid Leukemia], 12; LUAD[Lung adenocarcinoma], 13; LUSC[Lung squamous cell carcinoma], 14; OV[Ovarian serous cystadenocarcinoma ], 15; PAAD[Pancreatic adenocarcinoma], 16; PRAD[Prostate adenocarcinoma], 17; SKCM[Skin Cutaneous Melanoma], 18:STAD[Stomach adenocarcinoma], 19:THCA[Thyroid carcinoma], 20:UCEC[Uterine Corpus Endometrial Carcinoma]) |
| Top |
| * We represented just top 10 SNVs. When you move the cursor on each content, you can see more deailed mutation information on the Tooltip. Those are primary_site, primary_histology, mutation(aa), pubmedID. |
| Genomic Position | Mutation(aa) | Unique sampleID count |
| chr15:85610364 | p.L49L,PDE8A | 2 |
| chr15:85659299 | p.A41A,PDE8A | 1 |
| chr15:85619125 | p.H298N,PDE8A | 1 |
| chr15:85664166 | p.V541V,PDE8A | 1 |
| chr15:85669605 | p.H759R,PDE8A | 1 |
| chr15:85643406 | p.L49M,PDE8A | 1 |
| chr15:85659316 | p.V316I,PDE8A | 1 |
| chr15:85619136 | p.A546T,PDE8A | 1 |
| chr15:85666319 | p.E772K,PDE8A | 1 |
| chr15:85681058 | p.R337R,PDE8A | 1 |
| * Copy number data were extracted from TCGA using R package TCGA-Assembler. The URLs of all public data files on TCGA DCC data server were gathered on Jan-05-2015. Function ProcessCNAData in TCGA-Assembler package was used to obtain gene-level copy number value which is calculated as the average copy number of the genomic region of a gene. |
 |
| cf) Tissue ID[Tissue type]: BLCA[Bladder Urothelial Carcinoma], BRCA[Breast invasive carcinoma], CESC[Cervical squamous cell carcinoma and endocervical adenocarcinoma], COAD[Colon adenocarcinoma], GBM[Glioblastoma multiforme], Glioma Low Grade, HNSC[Head and Neck squamous cell carcinoma], KICH[Kidney Chromophobe], KIRC[Kidney renal clear cell carcinoma], KIRP[Kidney renal papillary cell carcinoma], LAML[Acute Myeloid Leukemia], LUAD[Lung adenocarcinoma], LUSC[Lung squamous cell carcinoma], OV[Ovarian serous cystadenocarcinoma ], PAAD[Pancreatic adenocarcinoma], PRAD[Prostate adenocarcinoma], SKCM[Skin Cutaneous Melanoma], STAD[Stomach adenocarcinoma], THCA[Thyroid carcinoma], UCEC[Uterine Corpus Endometrial Carcinoma] |
| Top |
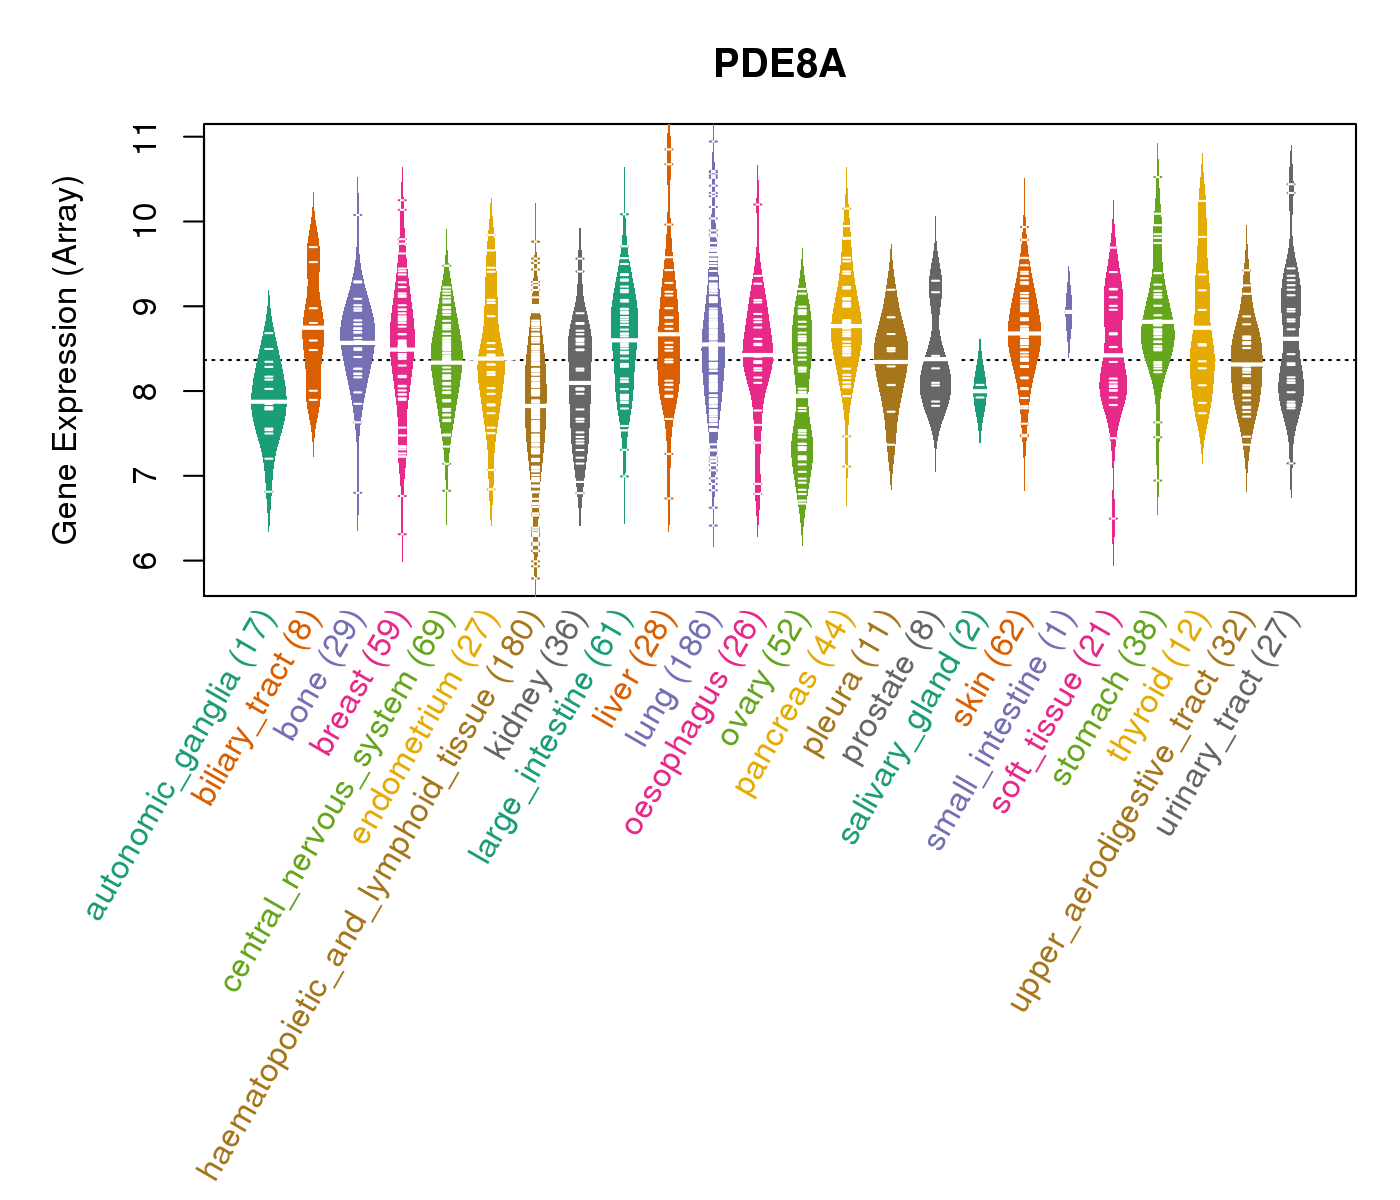
| Gene Expression for PDE8A |
| * CCLE gene expression data were extracted from CCLE_Expression_Entrez_2012-10-18.res: Gene-centric RMA-normalized mRNA expression data. |
 |
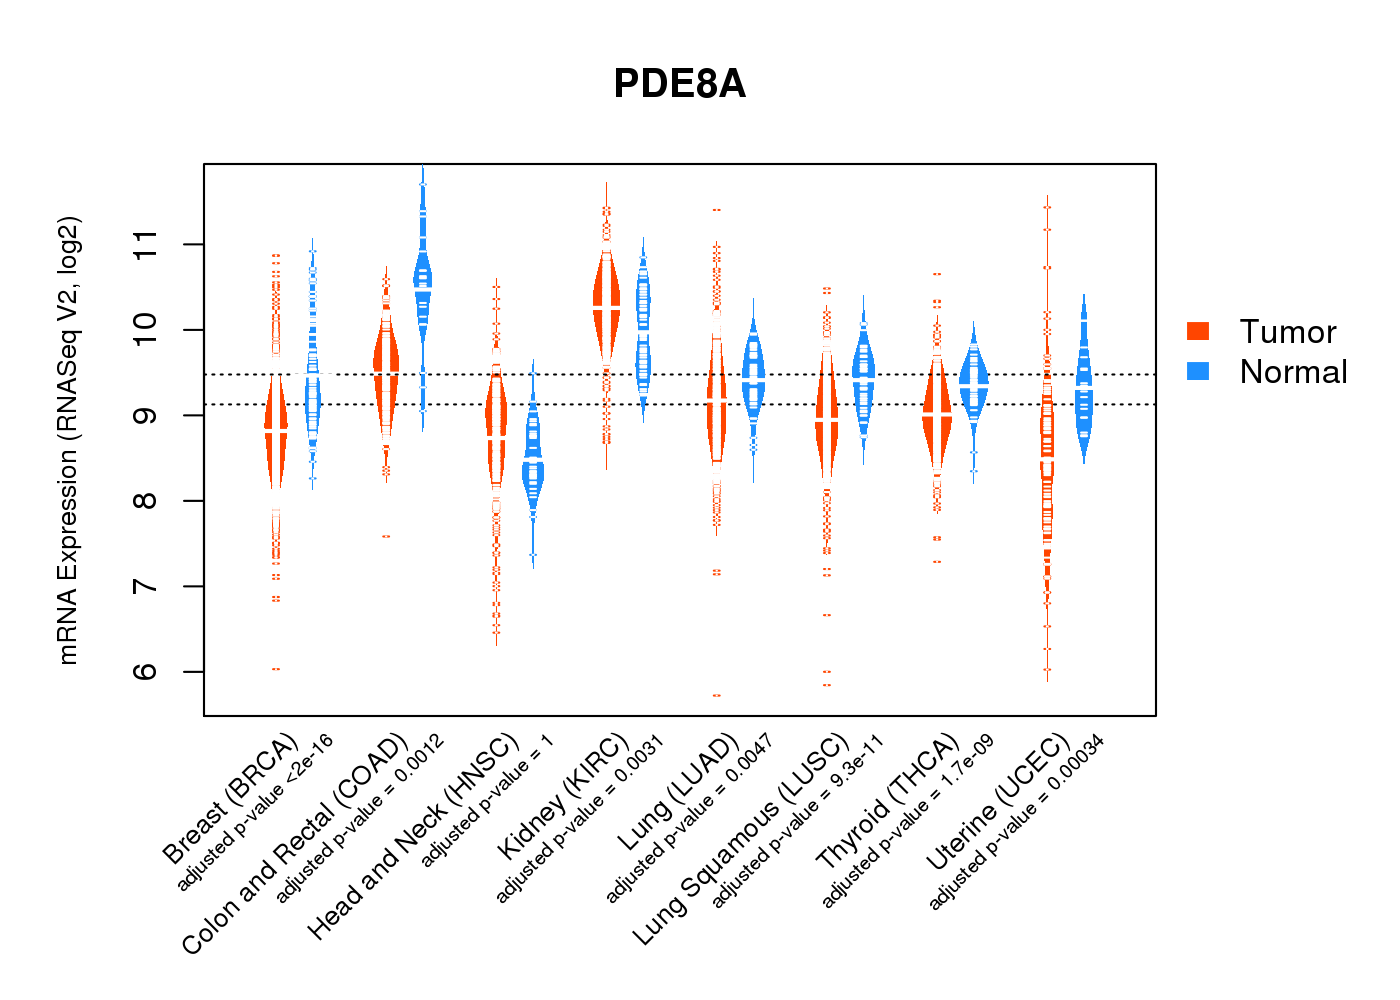
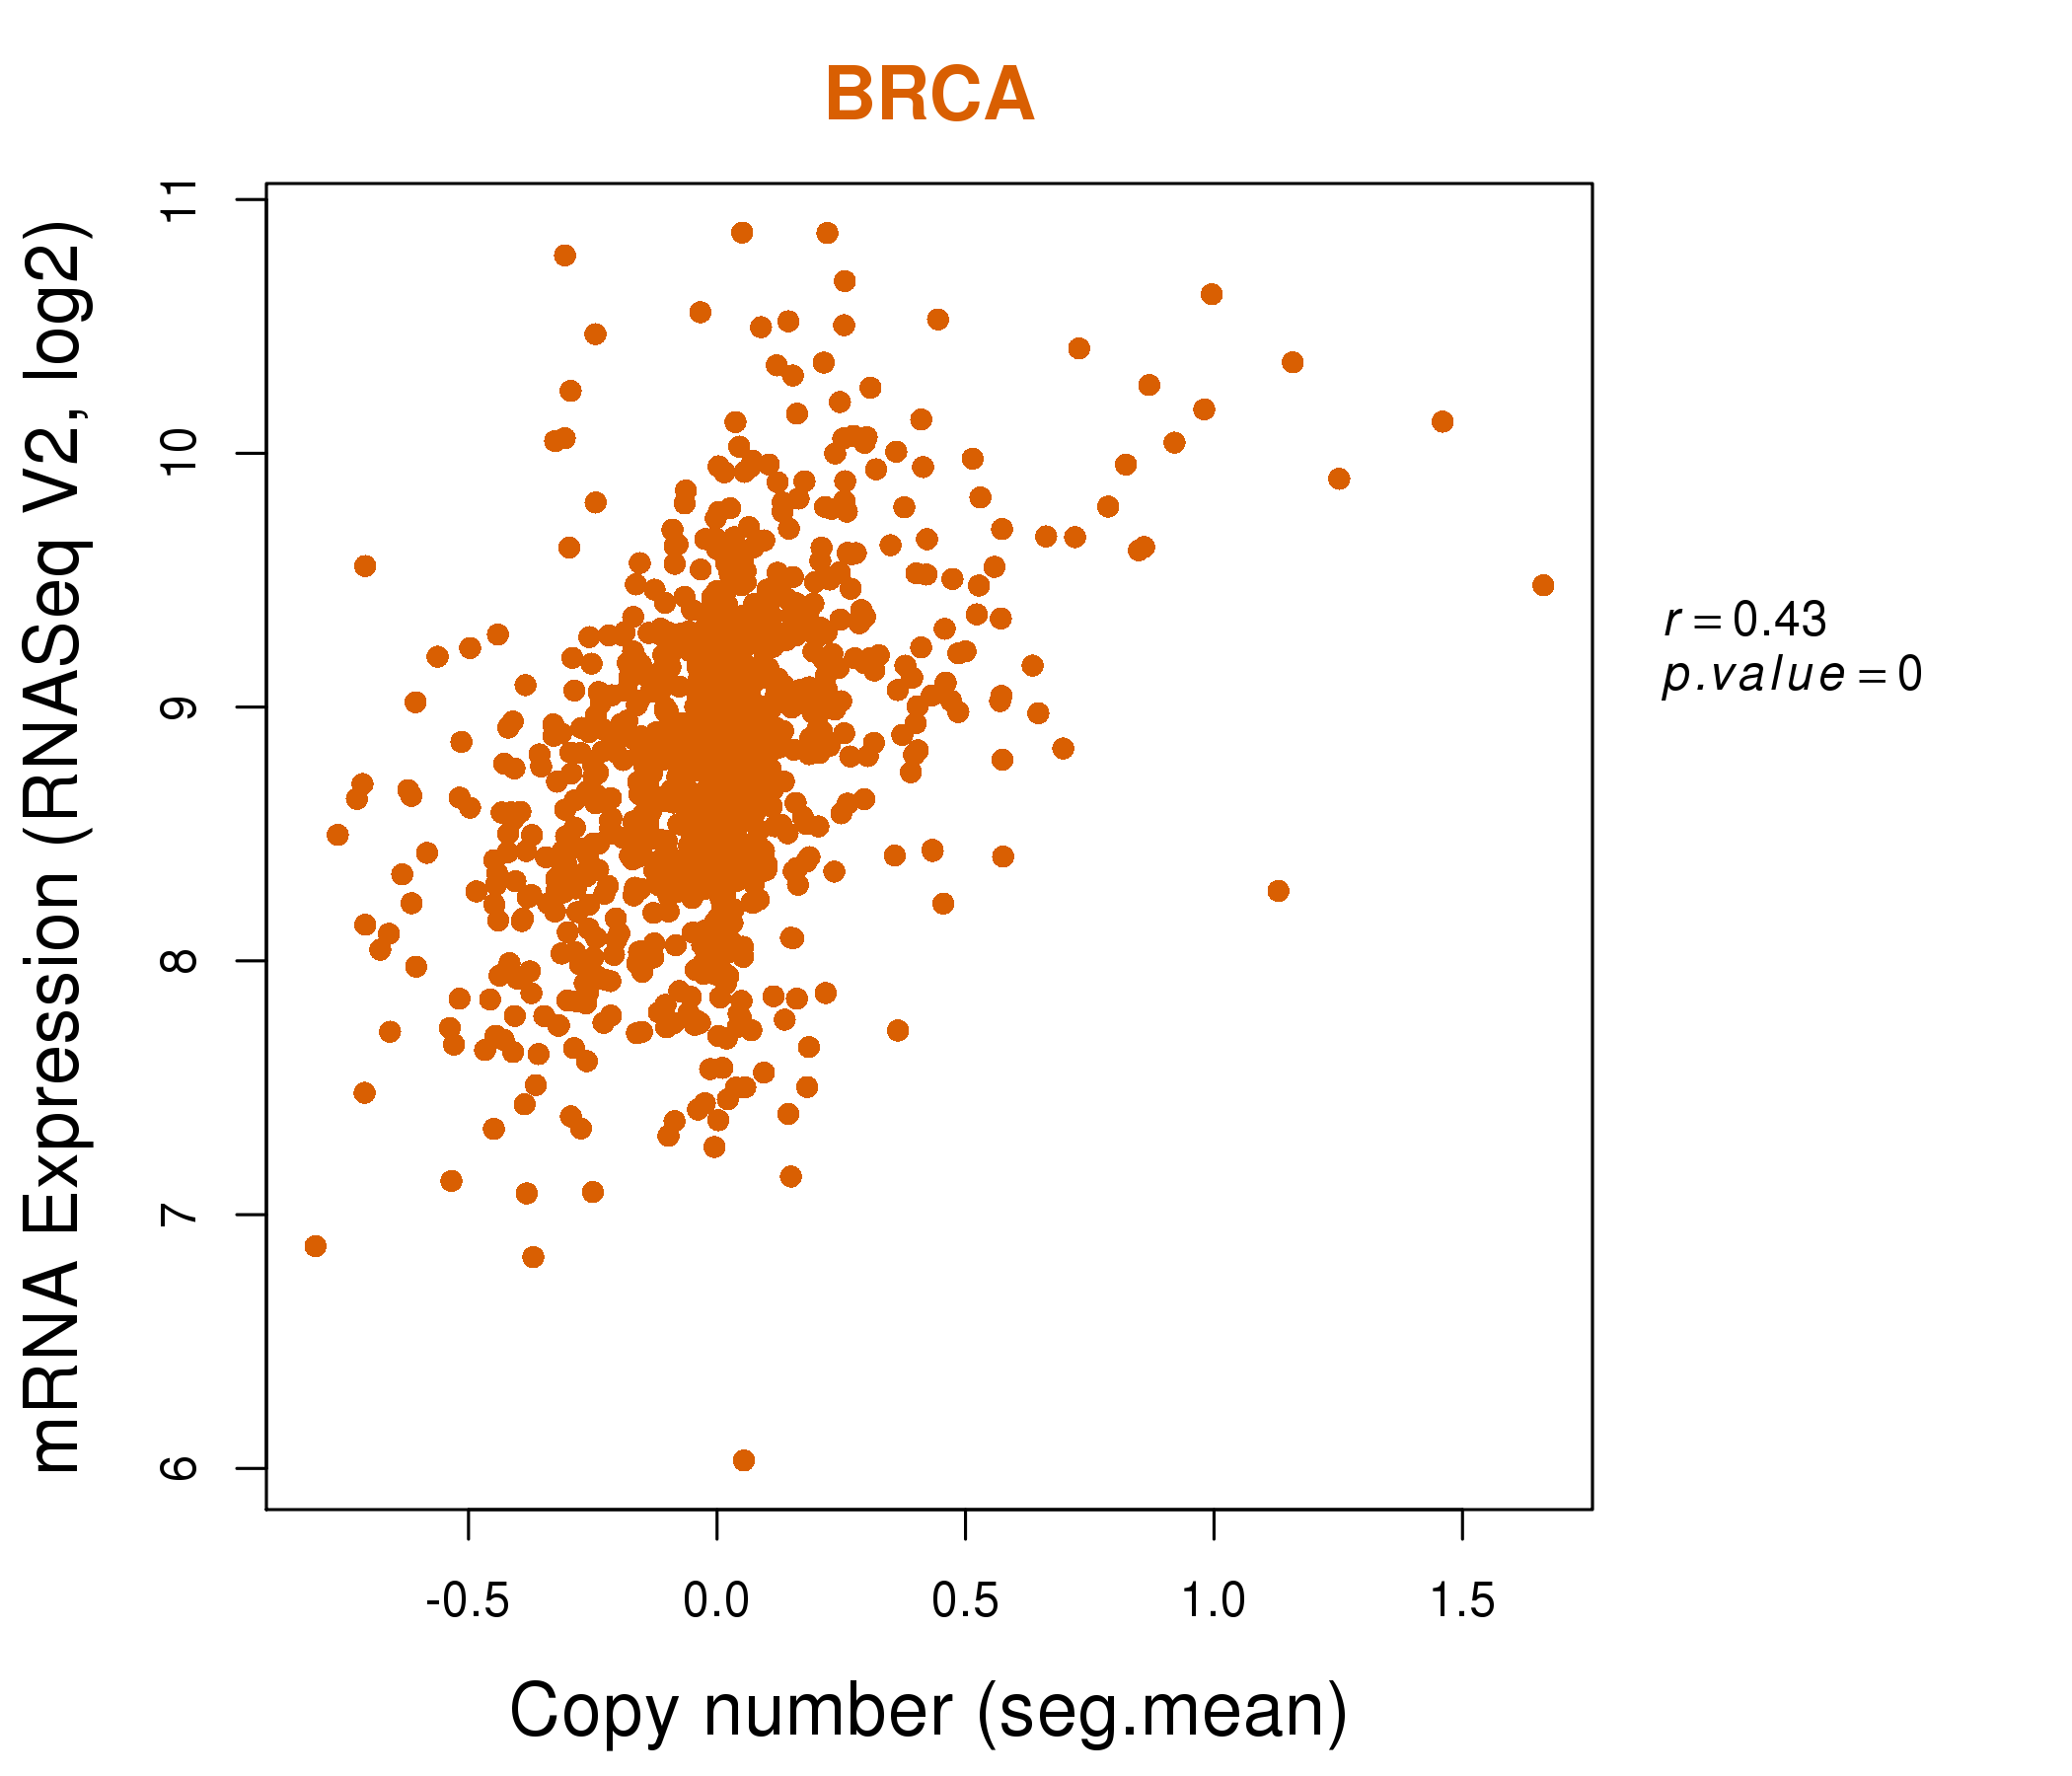
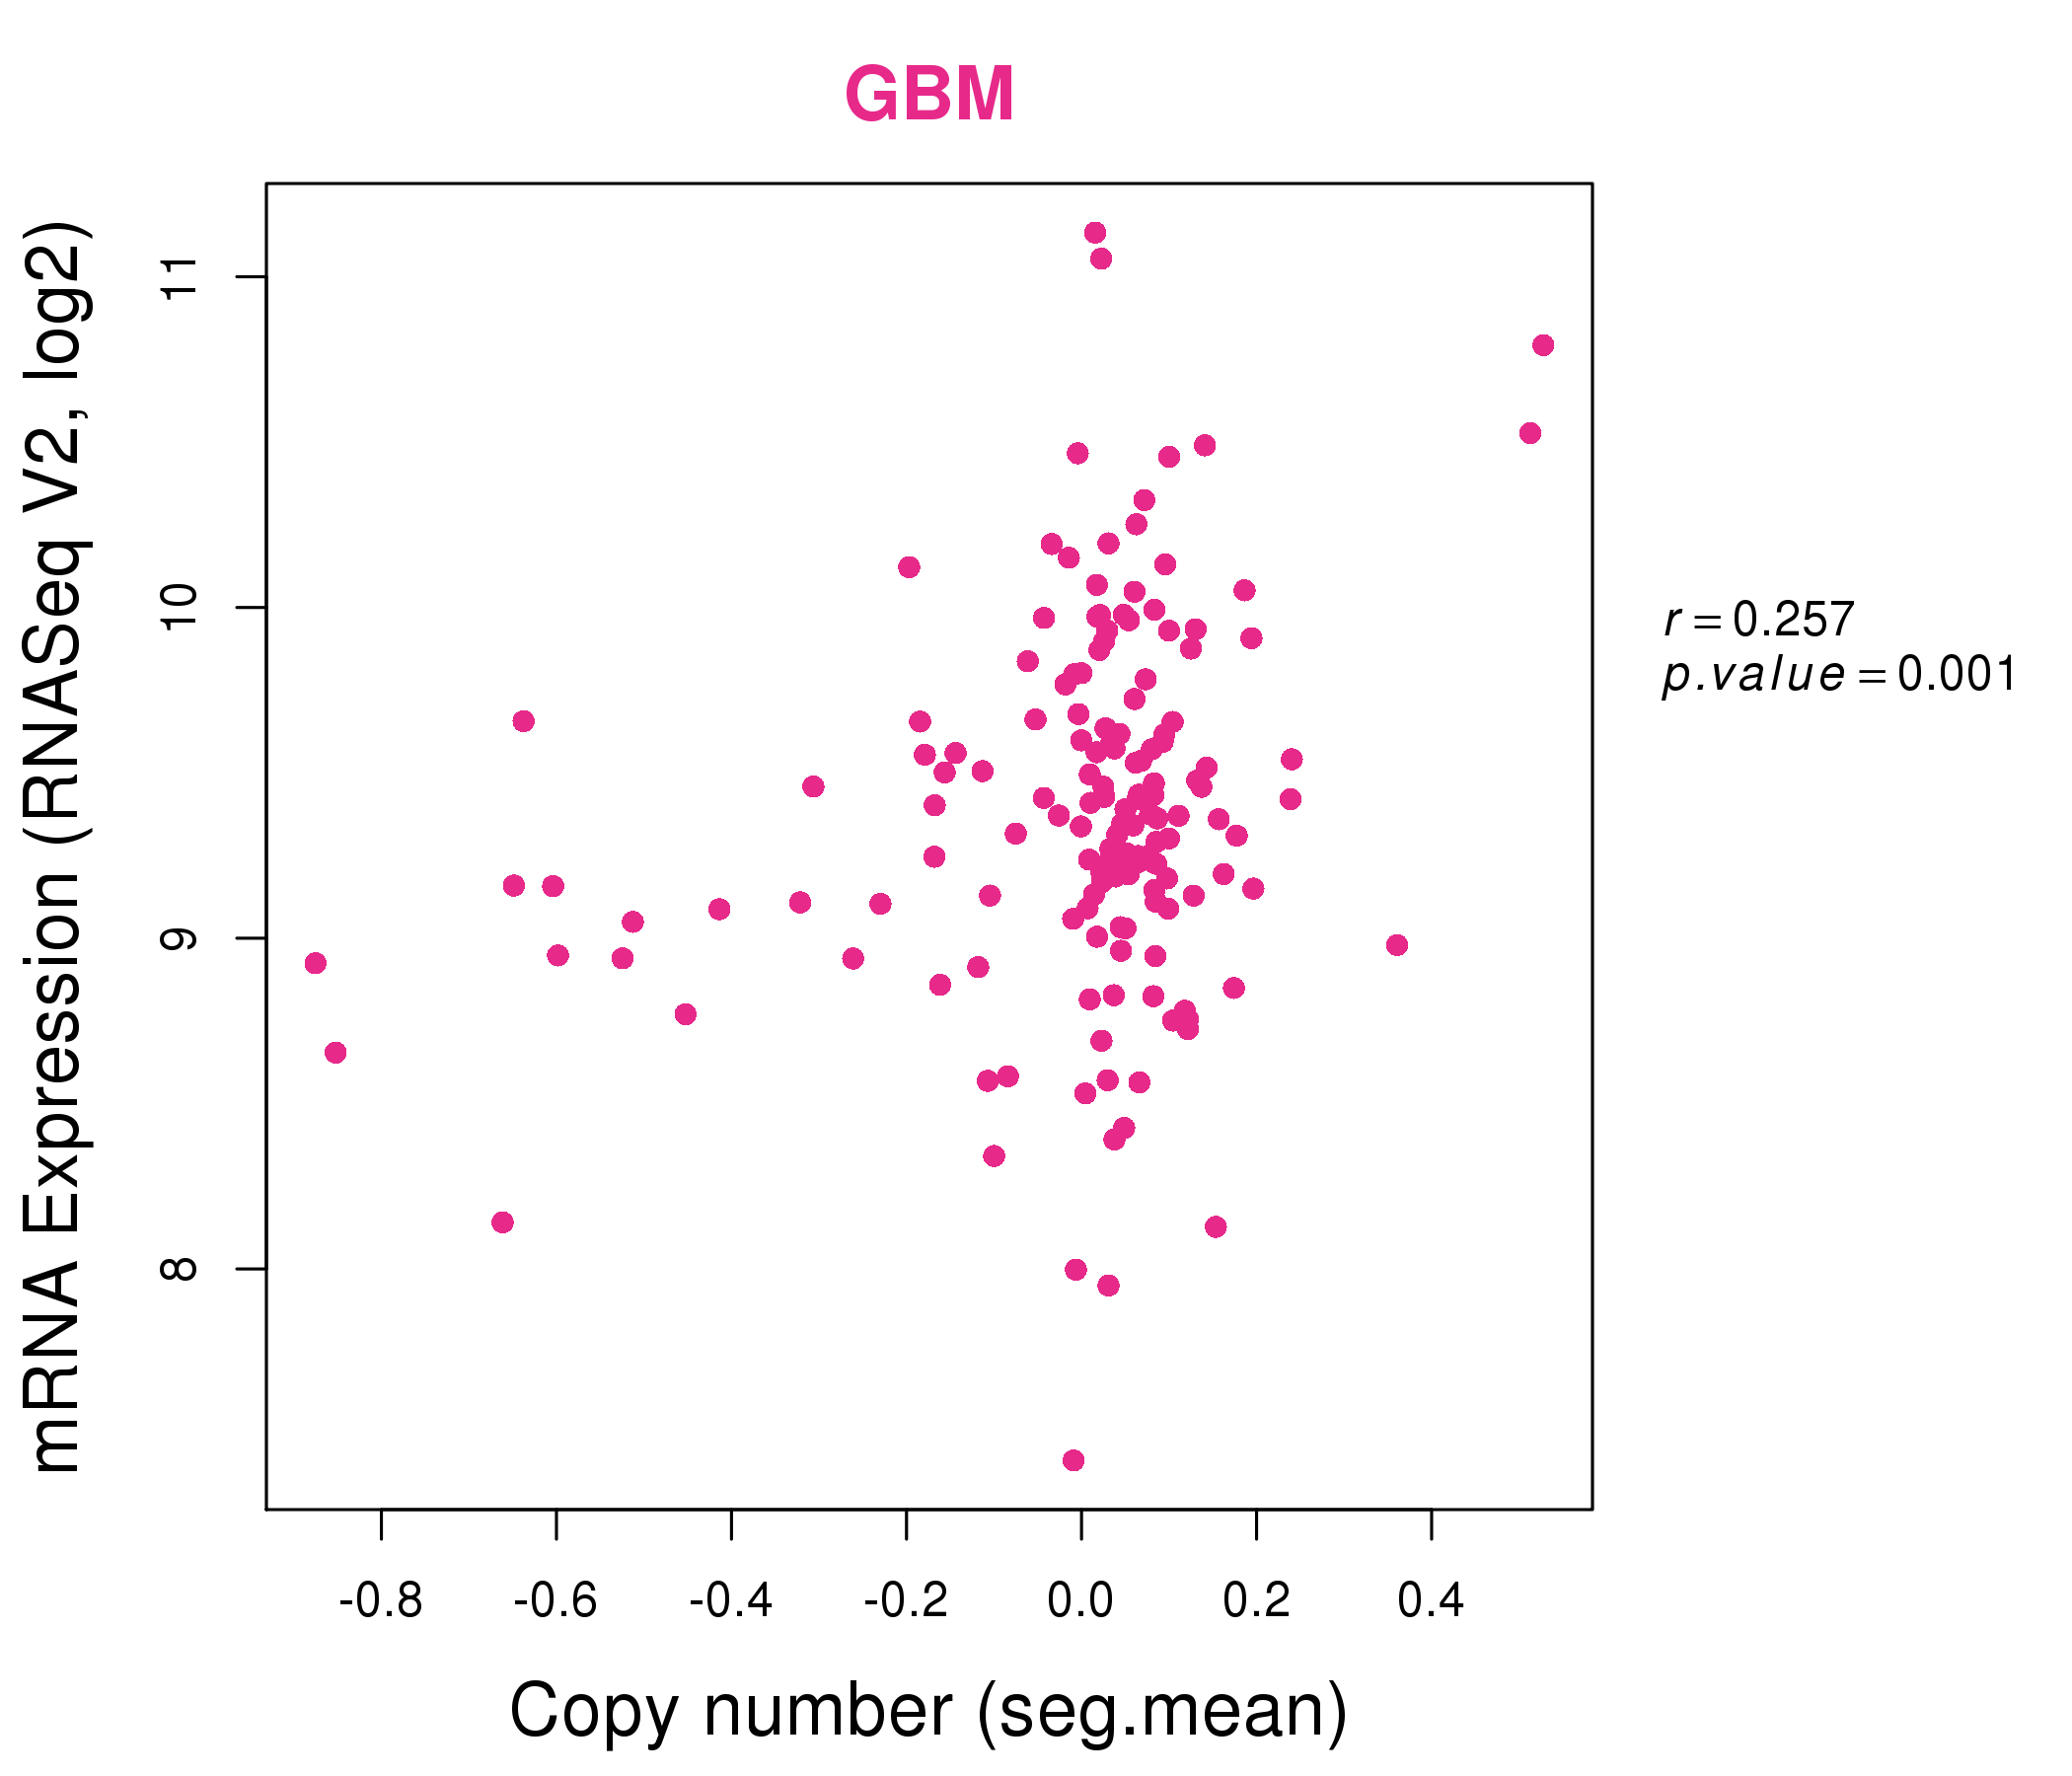
| * Normalized gene expression data of RNASeqV2 was extracted from TCGA using R package TCGA-Assembler. The URLs of all public data files on TCGA DCC data server were gathered at Jan-05-2015. Only eight cancer types have enough normal control samples for differential expression analysis. (t test, adjusted p<0.05 (using Benjamini-Hochberg FDR)) |
 |
| Top |
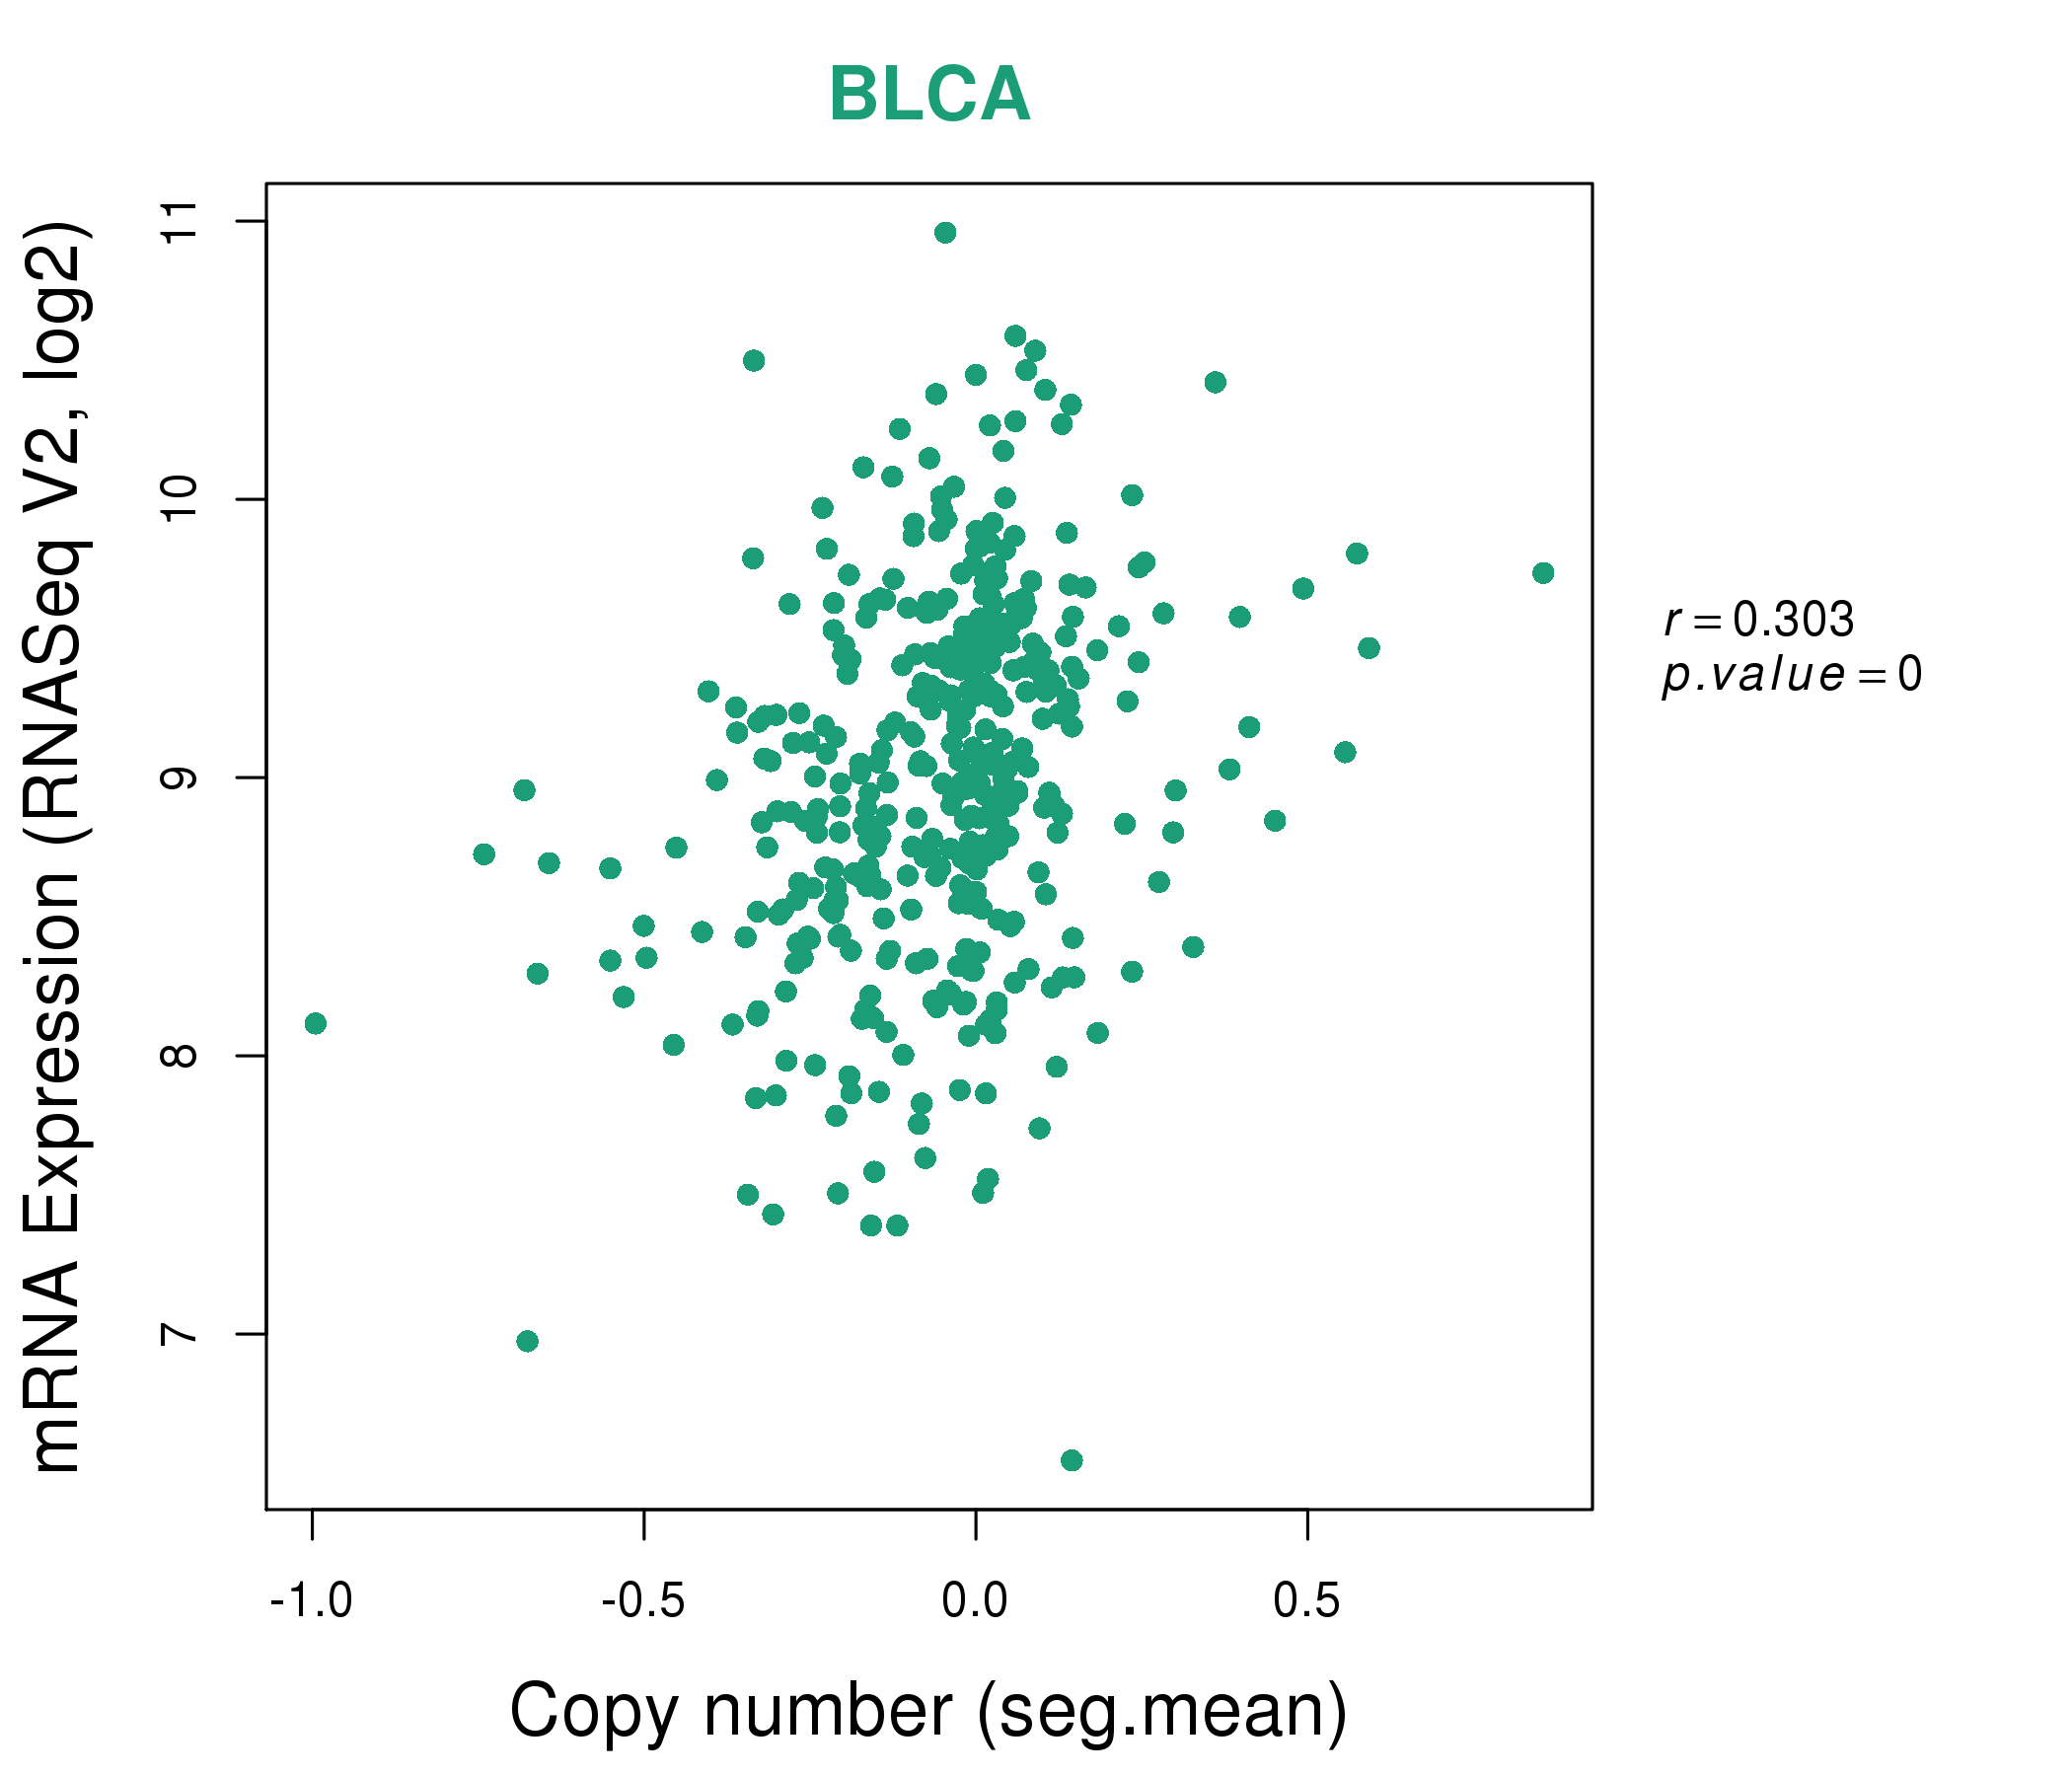
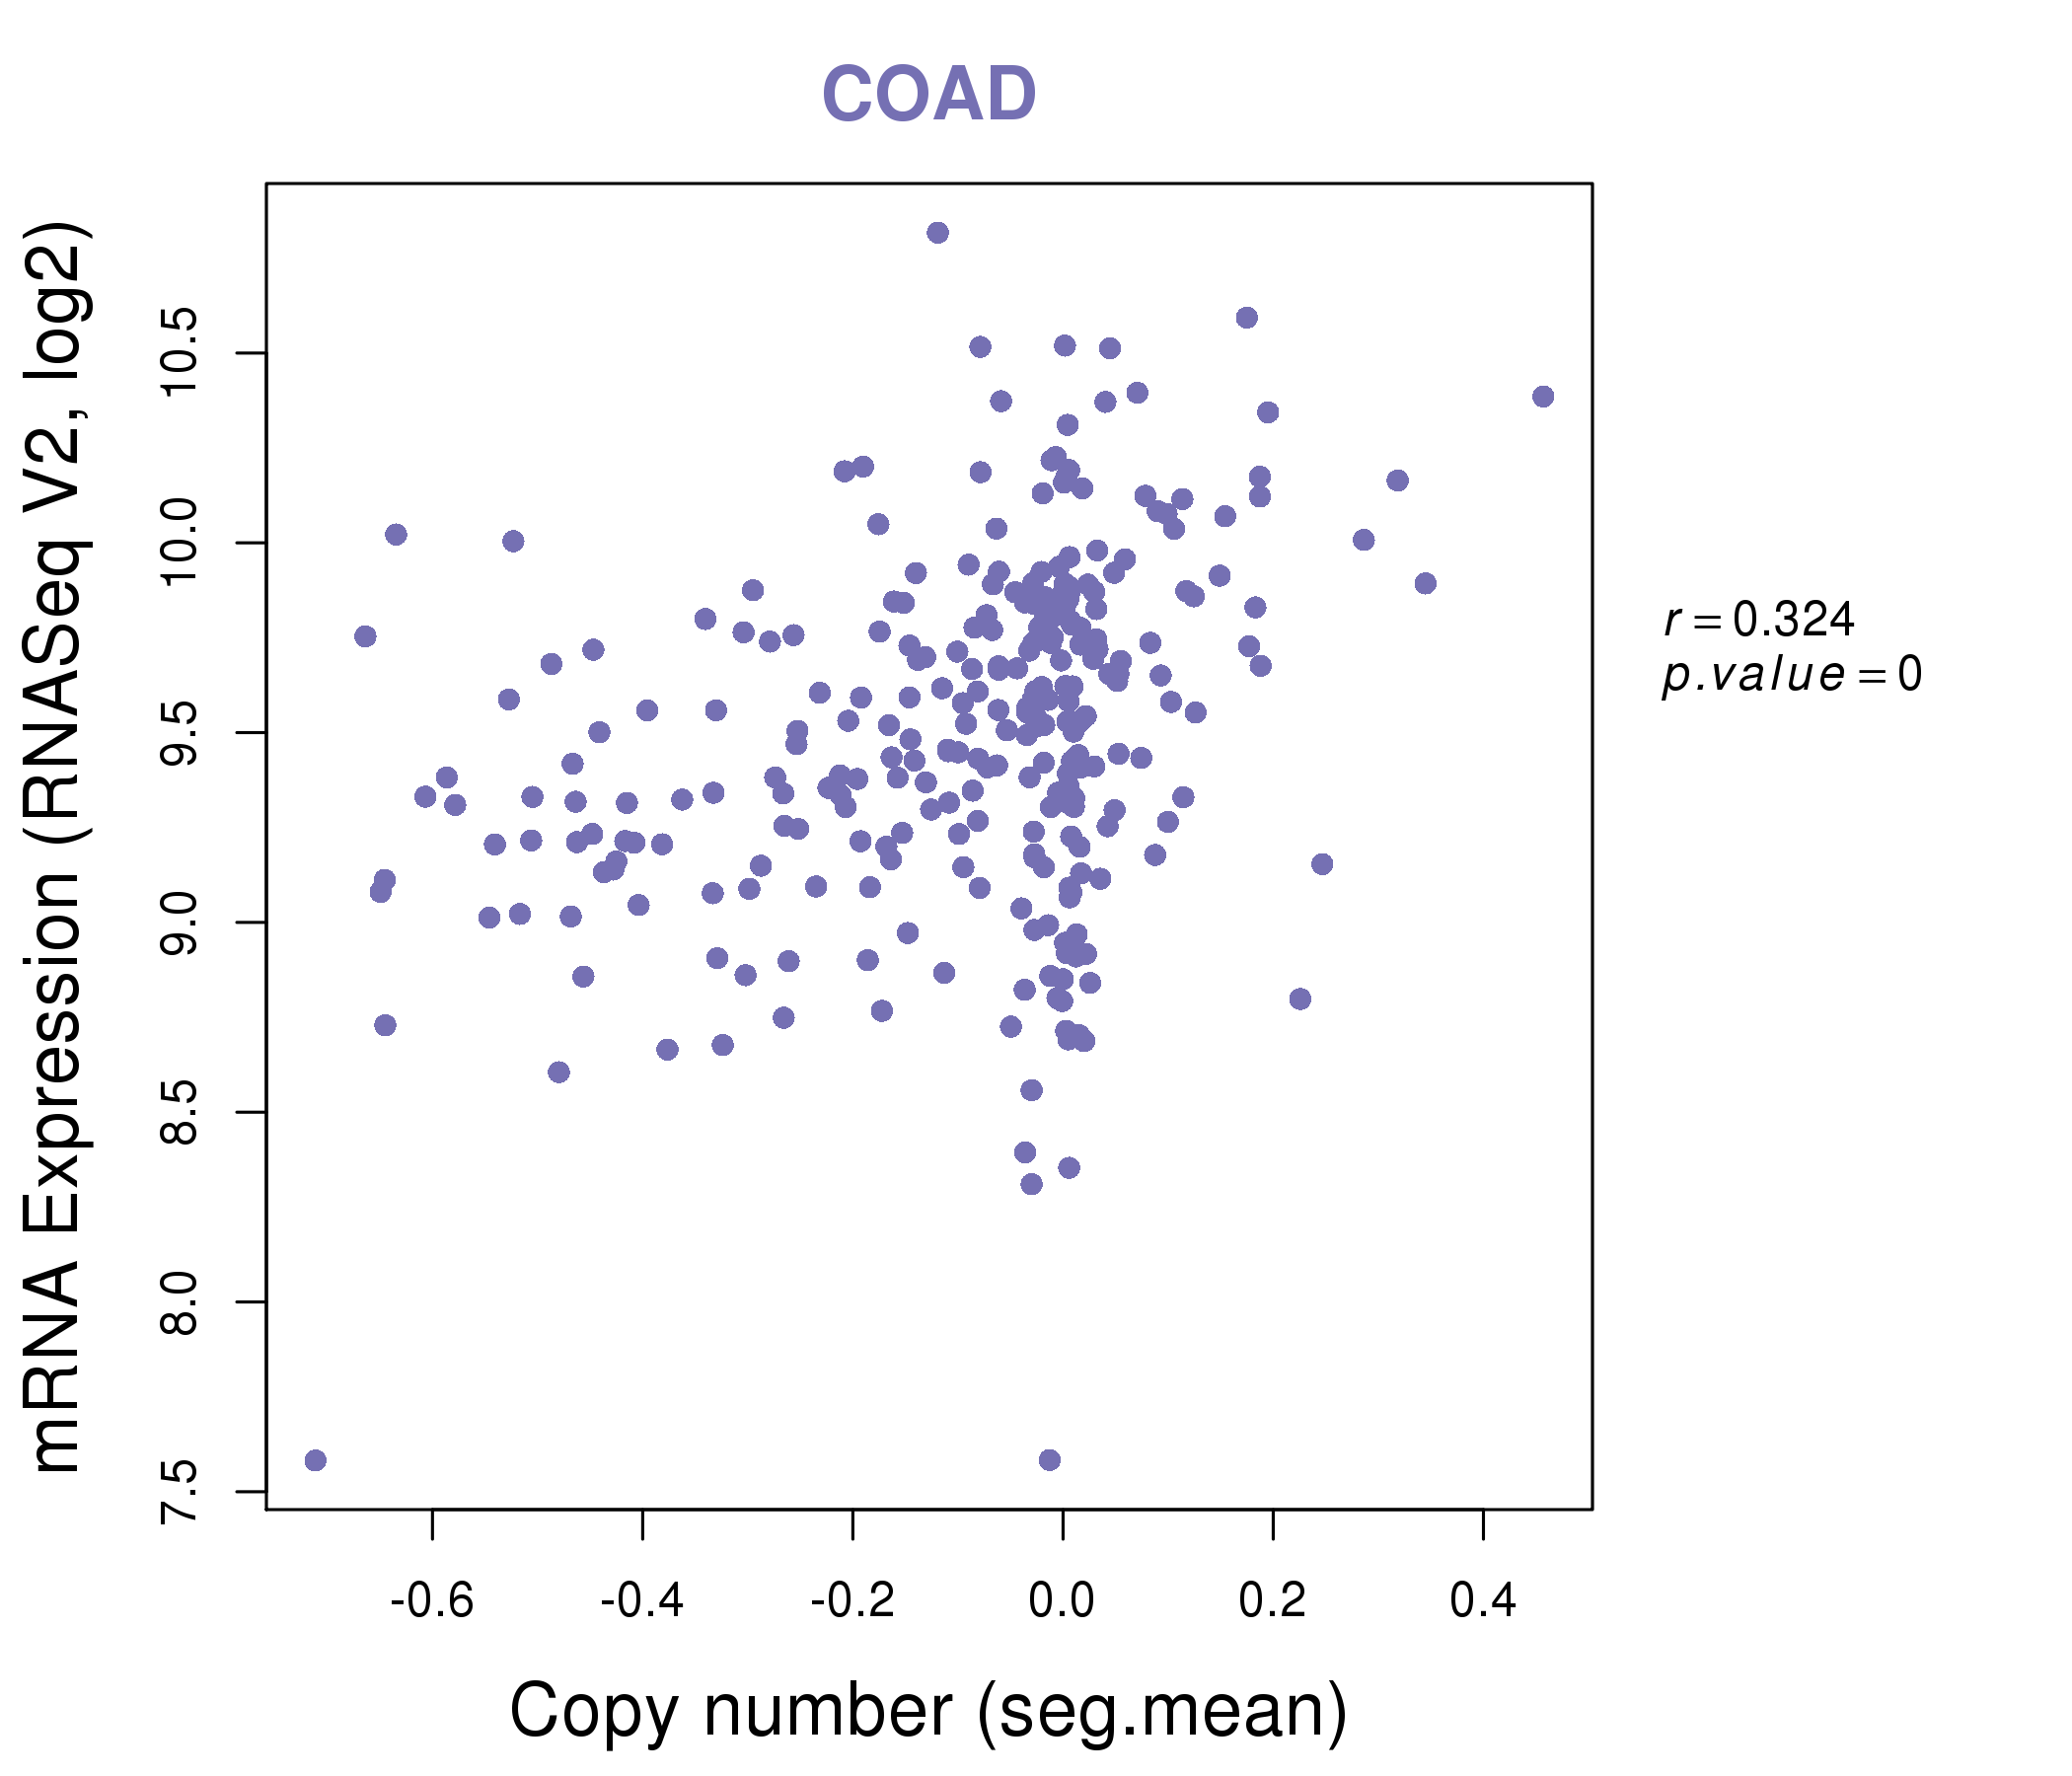
| * This plots show the correlation between CNV and gene expression. |
: Open all plots for all cancer types
 |
|
 |
|
| Top |
| Gene-Gene Network Information |
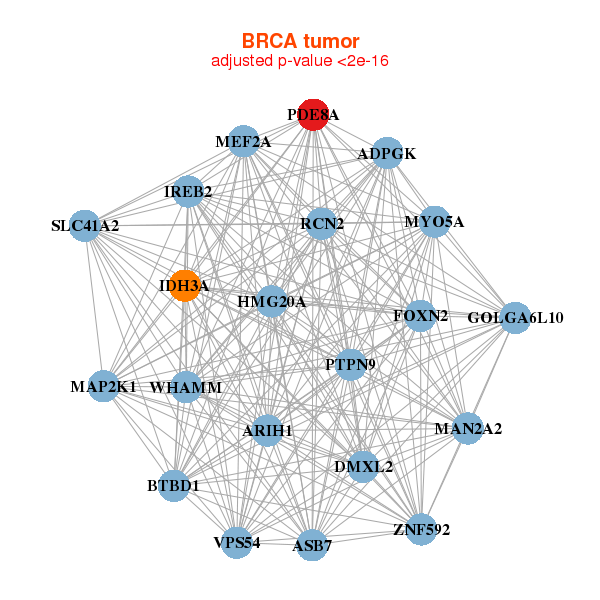
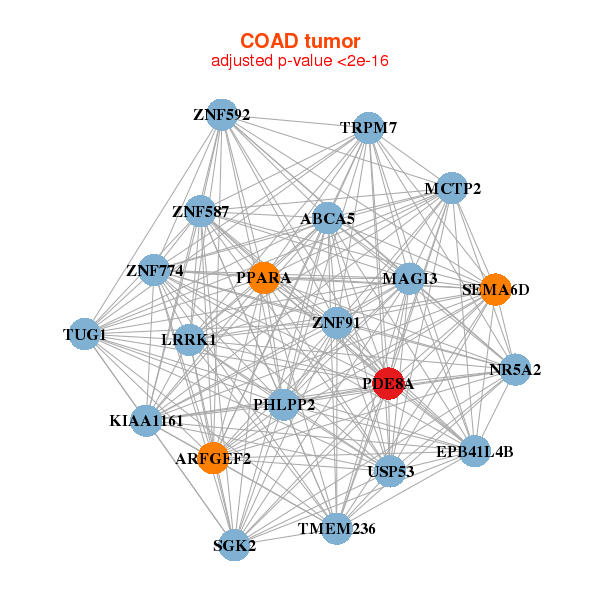
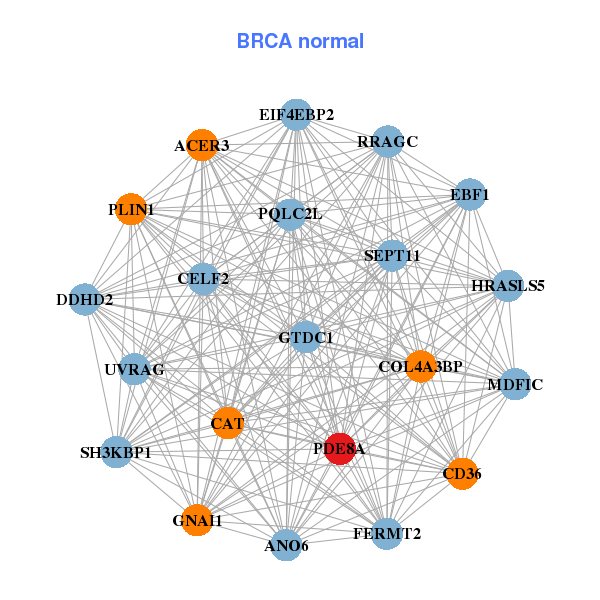
| * Co-Expression network figures were drawn using R package igraph. Only the top 20 genes with the highest correlations were shown. Red circle: input gene, orange circle: cell metabolism gene, sky circle: other gene |
: Open all plots for all cancer types
 |
| ||||
| ADPGK,ARIH1,ASB7,BTBD1,DMXL2,FOXN2,GOLGA6L10, HMG20A,IDH3A,IREB2,MAN2A2,MAP2K1,MEF2A,MYO5A, PDE8A,PTPN9,RCN2,SLC41A2,VPS54,WHAMM,ZNF592 | ACER3,ANO6,PQLC2L,CAT,CD36,CELF2,COL4A3BP, DDHD2,EBF1,EIF4EBP2,FERMT2,GNAI1,GTDC1,HRASLS5, MDFIC,PDE8A,PLIN1,RRAGC,SEPT11,SH3KBP1,UVRAG | ||||
 |
| ||||
| ABCA5,ARFGEF2,EPB41L4B,TMEM236,KIAA1161,LRRK1,MAGI3, MCTP2,NR5A2,PDE8A,PHLPP2,PPARA,SEMA6D,SGK2, TRPM7,TUG1,USP53,ZNF587,ZNF592,ZNF774,ZNF91 | AGFG2,AHCYL2,RHOV___CHP1,CPT1A,DTX4,EPB41L4B,FZD5, KIAA1522,LRRFIP2,MTMR11,MYO1D,NCEH1,PDE8A,PPM1B, RAPGEFL1,RAVER2,SGK2,SH3BGRL2,SLC26A2,SNX30,TMEM63B |
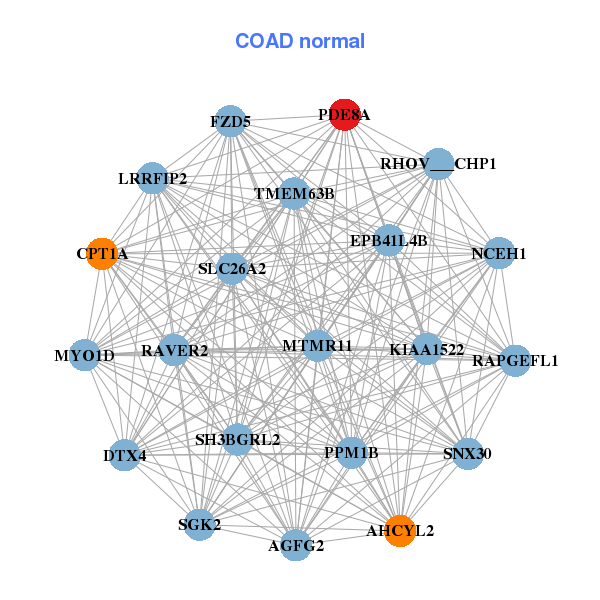
| * Co-Expression network figures were drawn using R package igraph. Only the top 20 genes with the highest correlations were shown. Red circle: input gene, orange circle: cell metabolism gene, sky circle: other gene |
: Open all plots for all cancer types
| Top |
: Open all interacting genes' information including KEGG pathway for all interacting genes from DAVID
| Top |
| Pharmacological Information for PDE8A |
| DB Category | DB Name | DB's ID and Url link |
| * Gene Centered Interaction Network. |
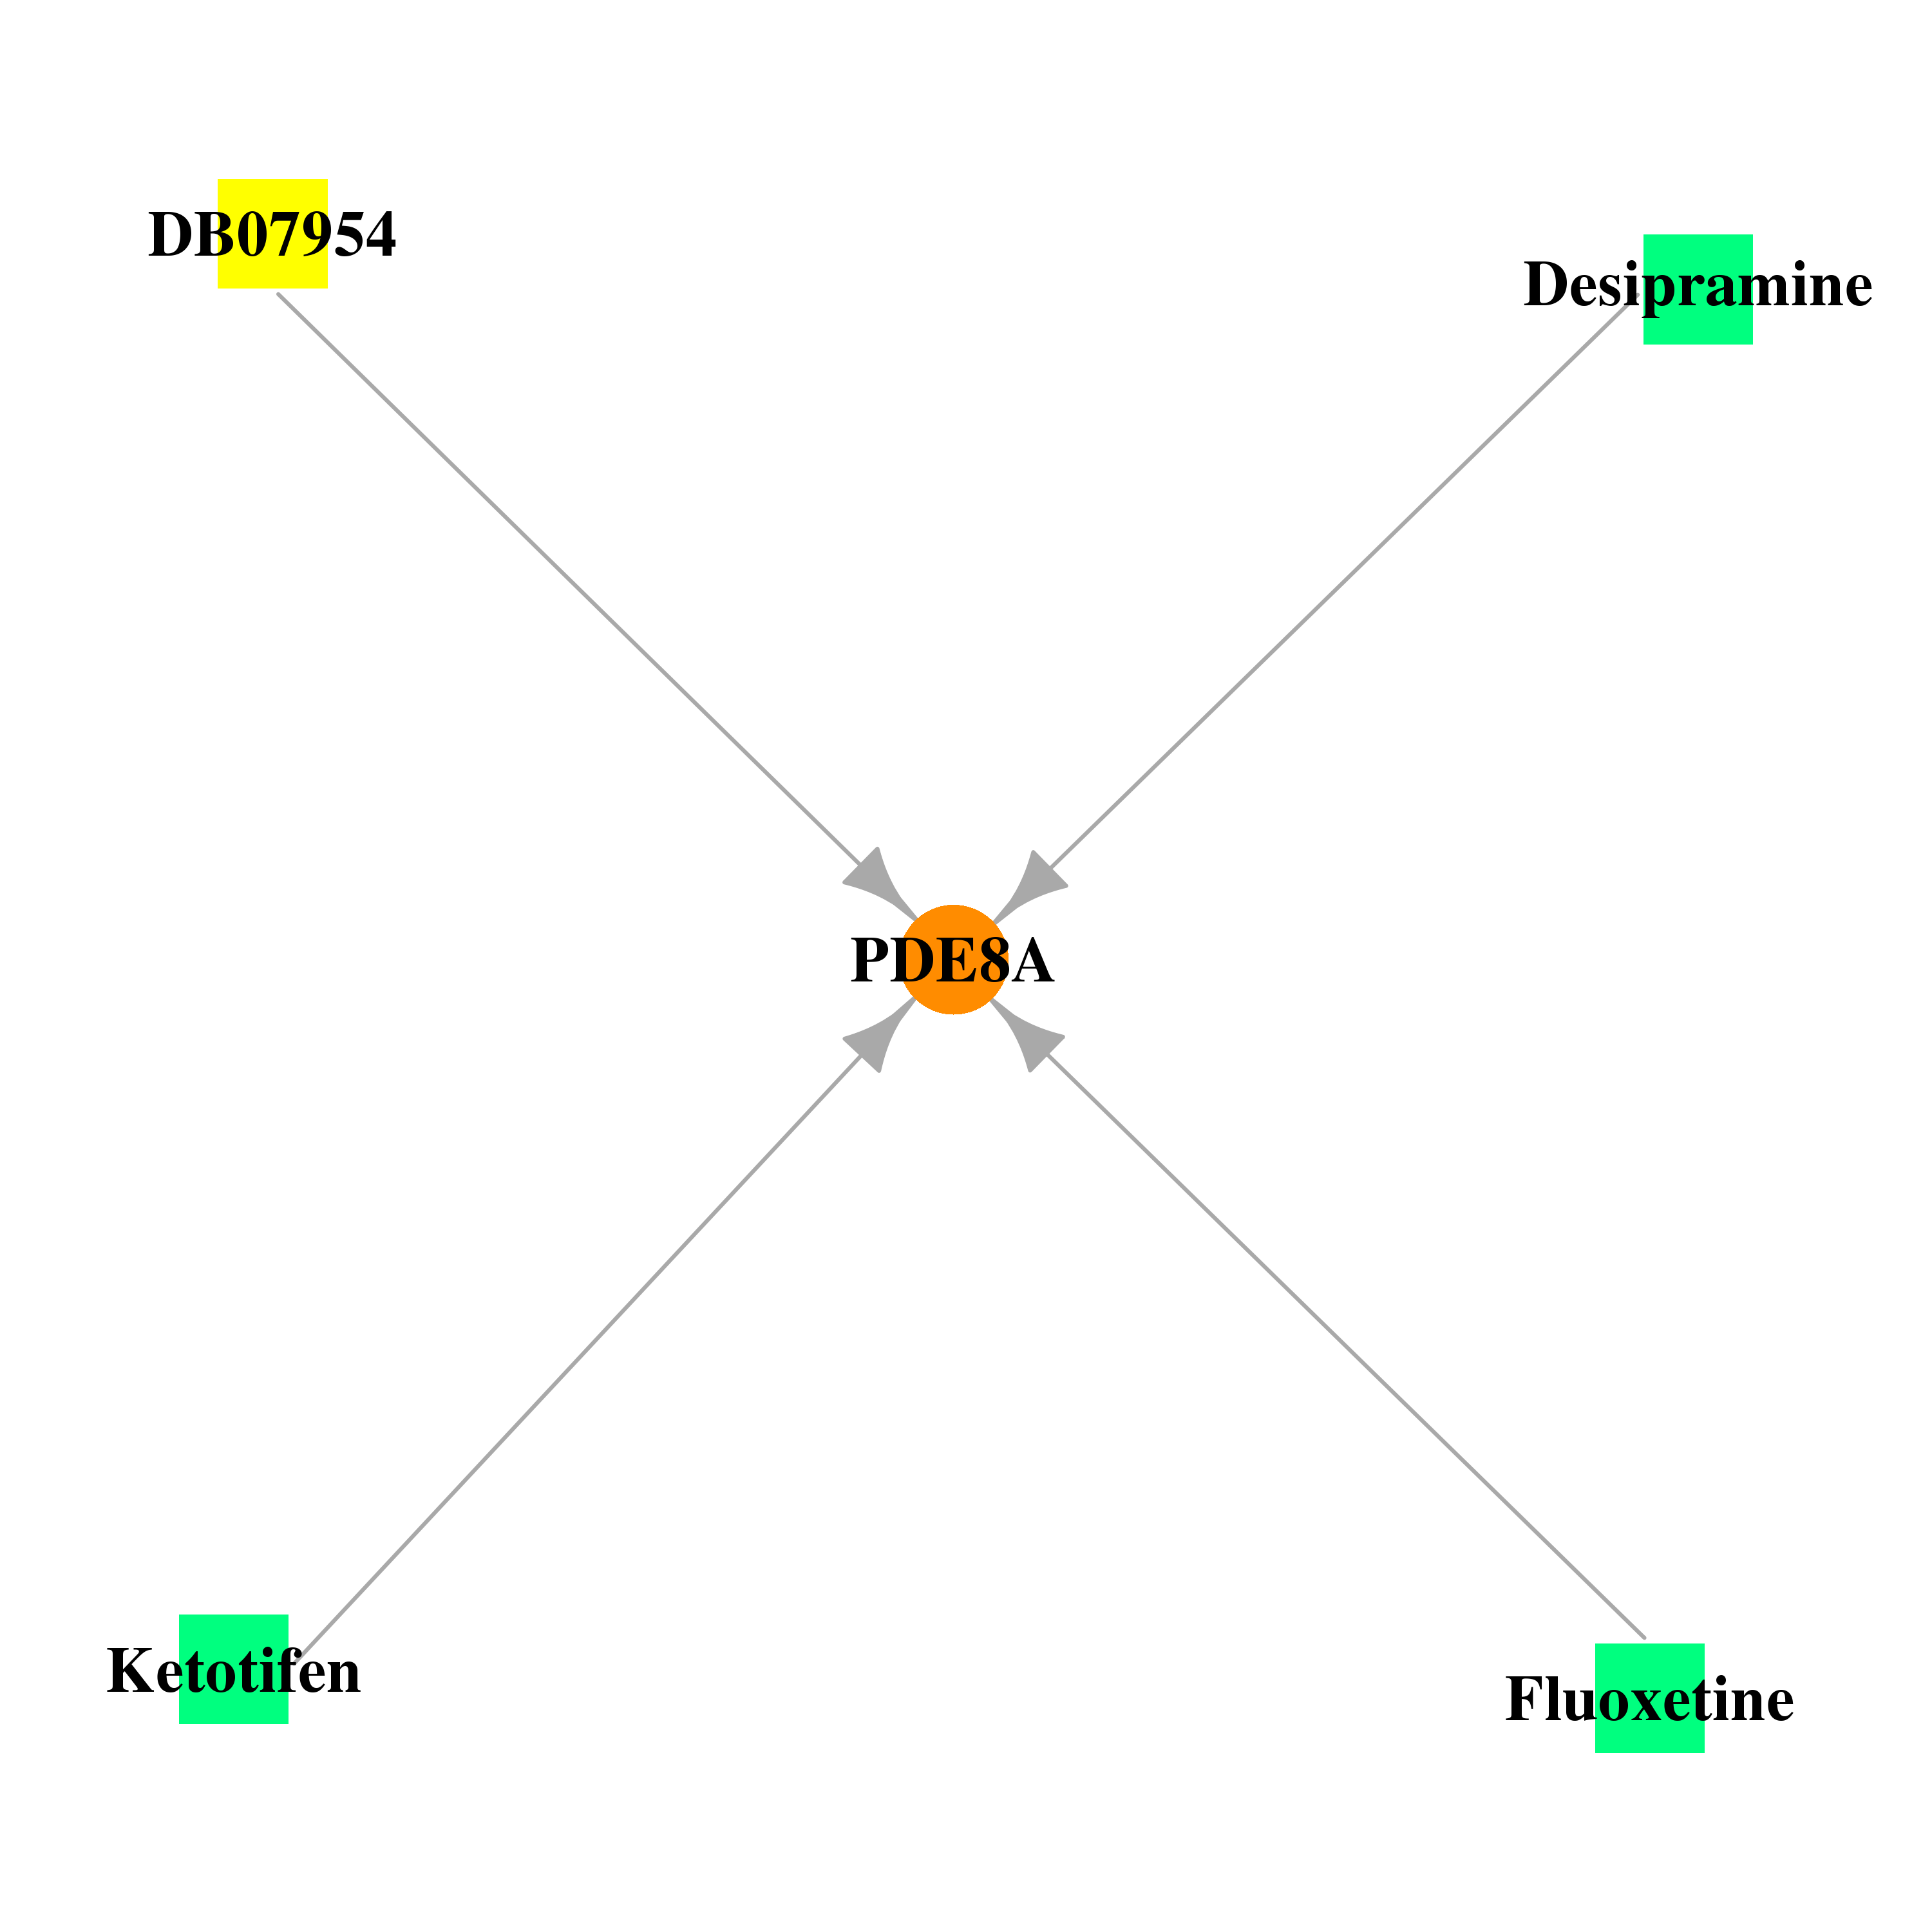 |
| * Drug Centered Interaction Network. |
| DrugBank ID | Target Name | Drug Groups | Generic Name | Drug Centered Network | Drug Structure |
| DB00920 | phosphodiesterase 8A | approved | Ketotifen | 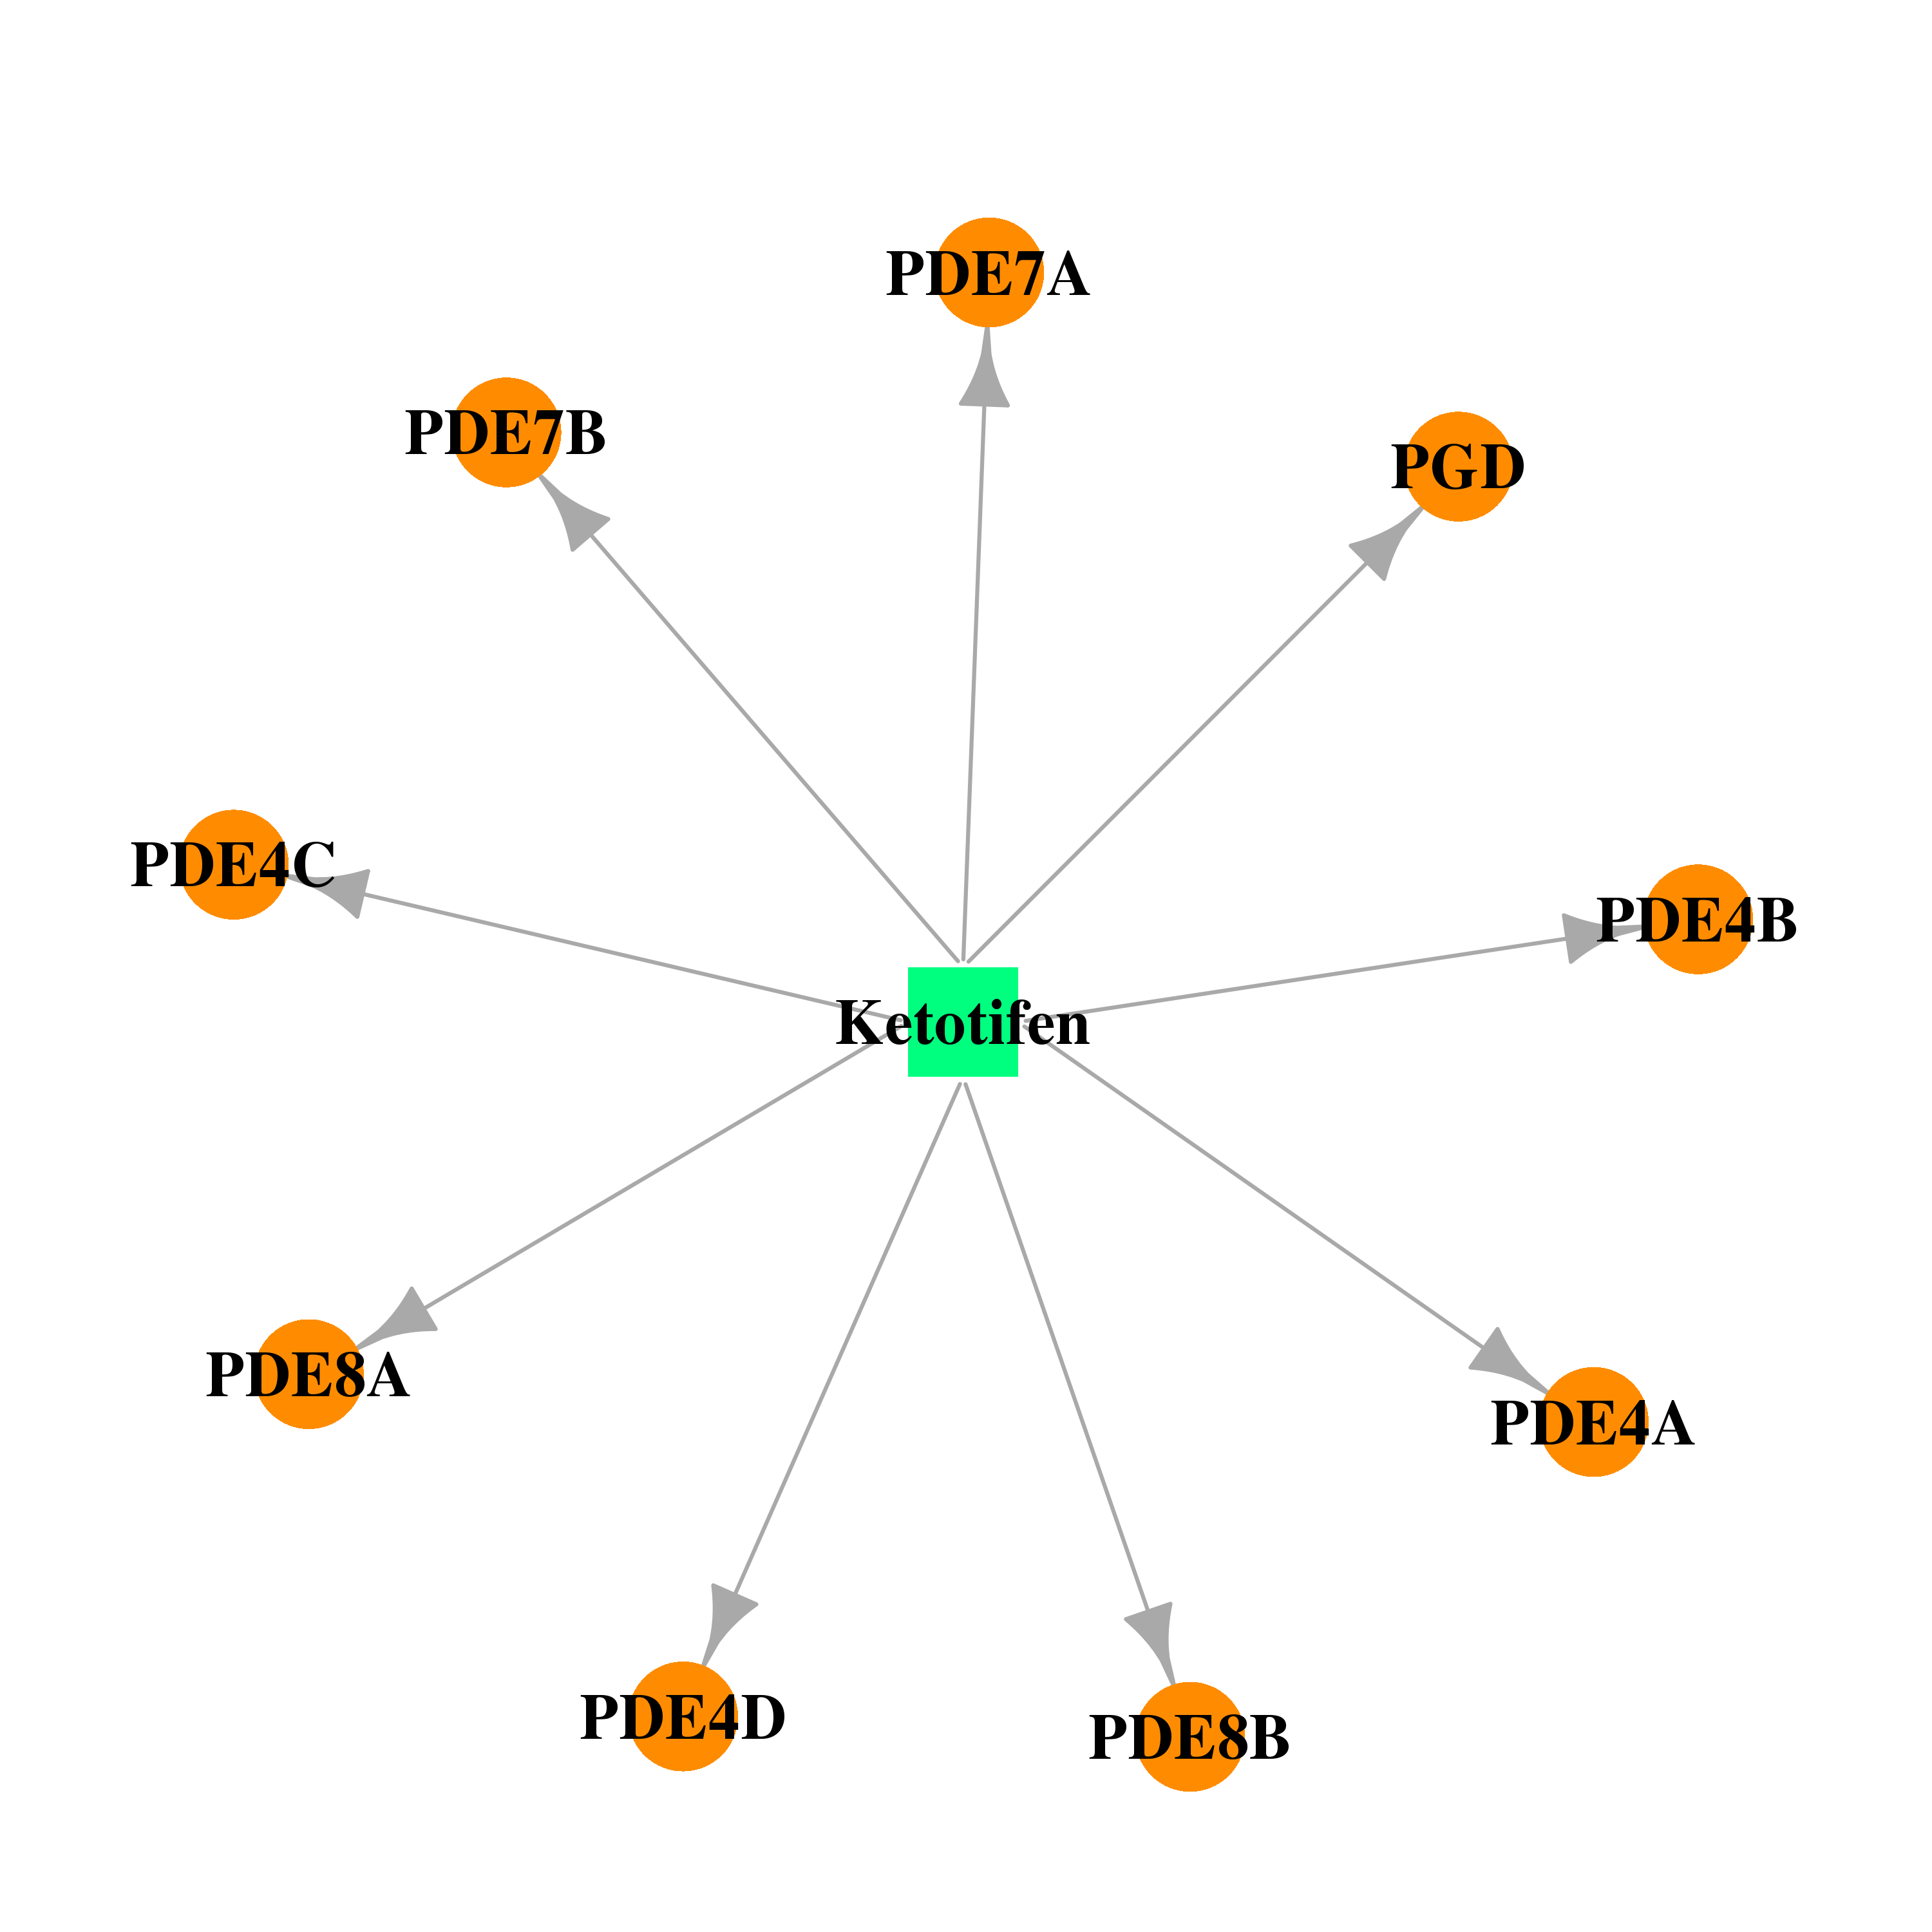 |  |
| DB07954 | phosphodiesterase 8A | experimental | 3-ISOBUTYL-1-METHYLXANTHINE | 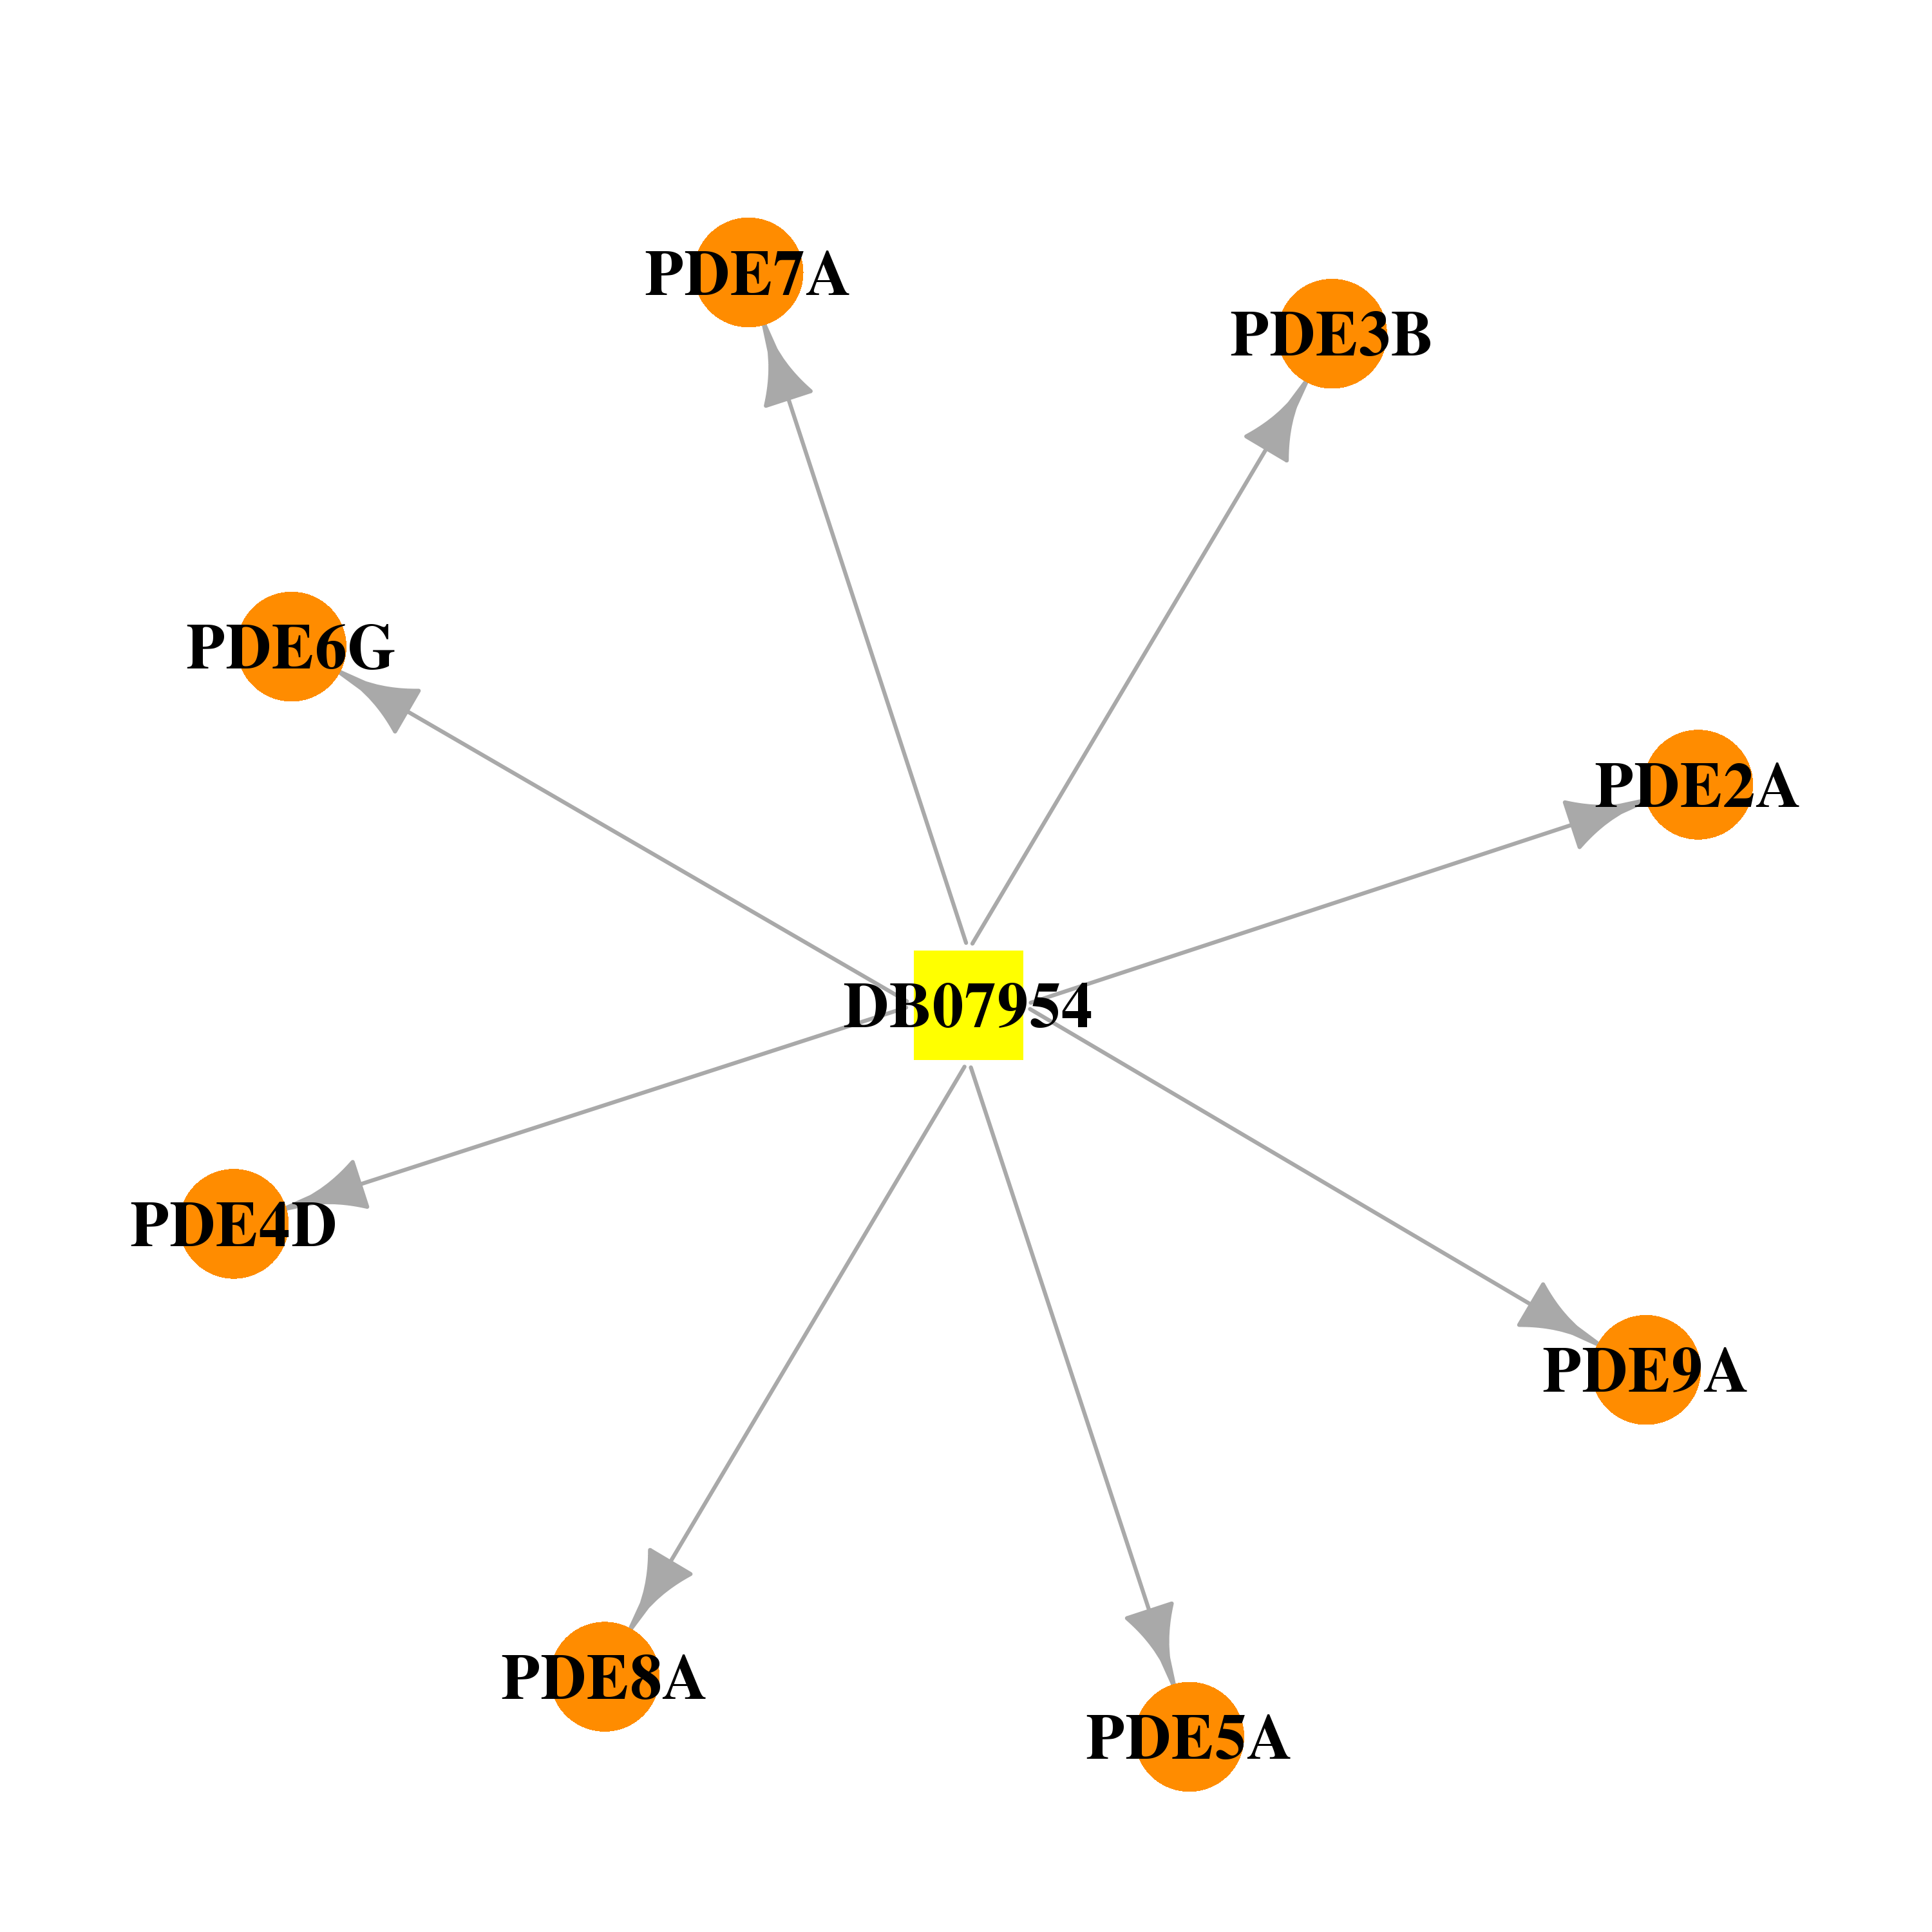 | 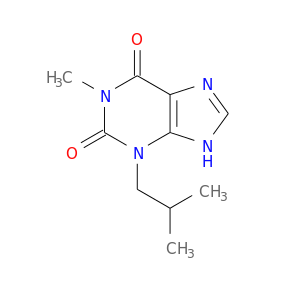 |
| DB01151 | phosphodiesterase 8A | approved | Desipramine | 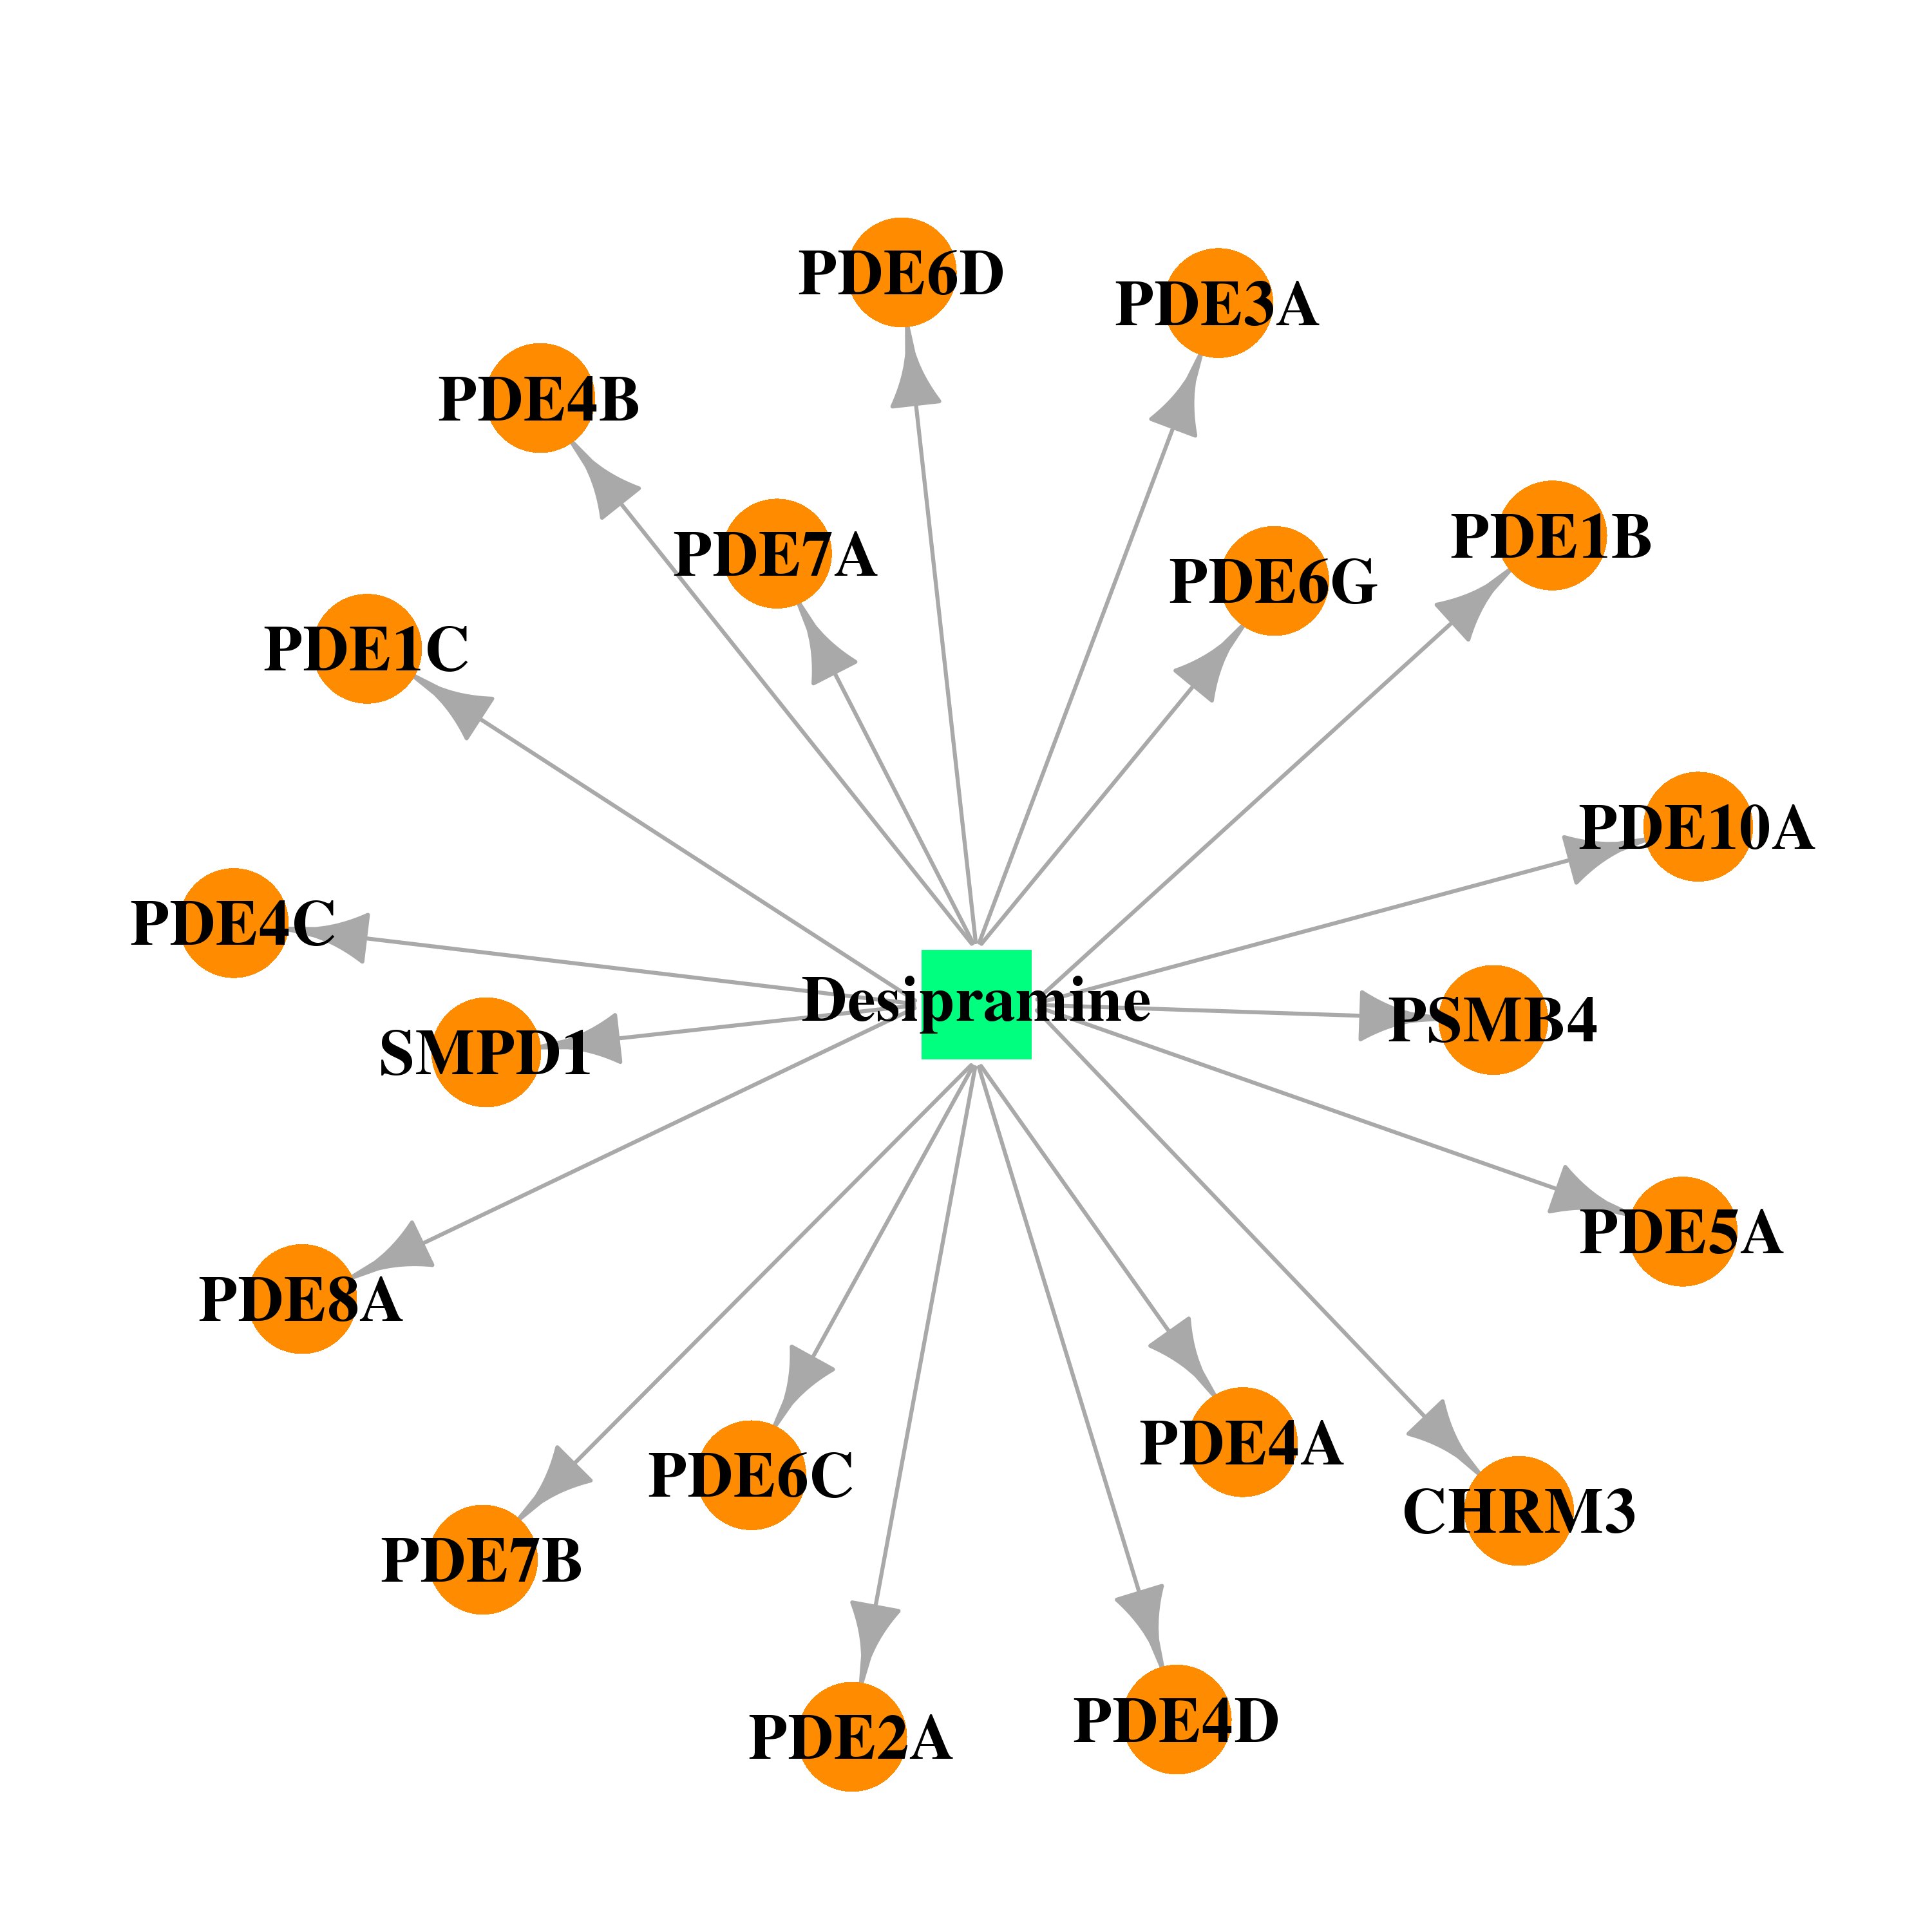 | 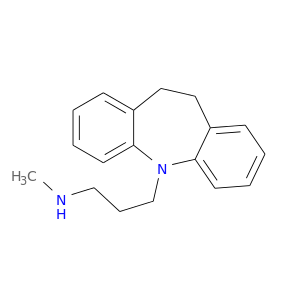 |
| DB00472 | phosphodiesterase 8A | approved | Fluoxetine | 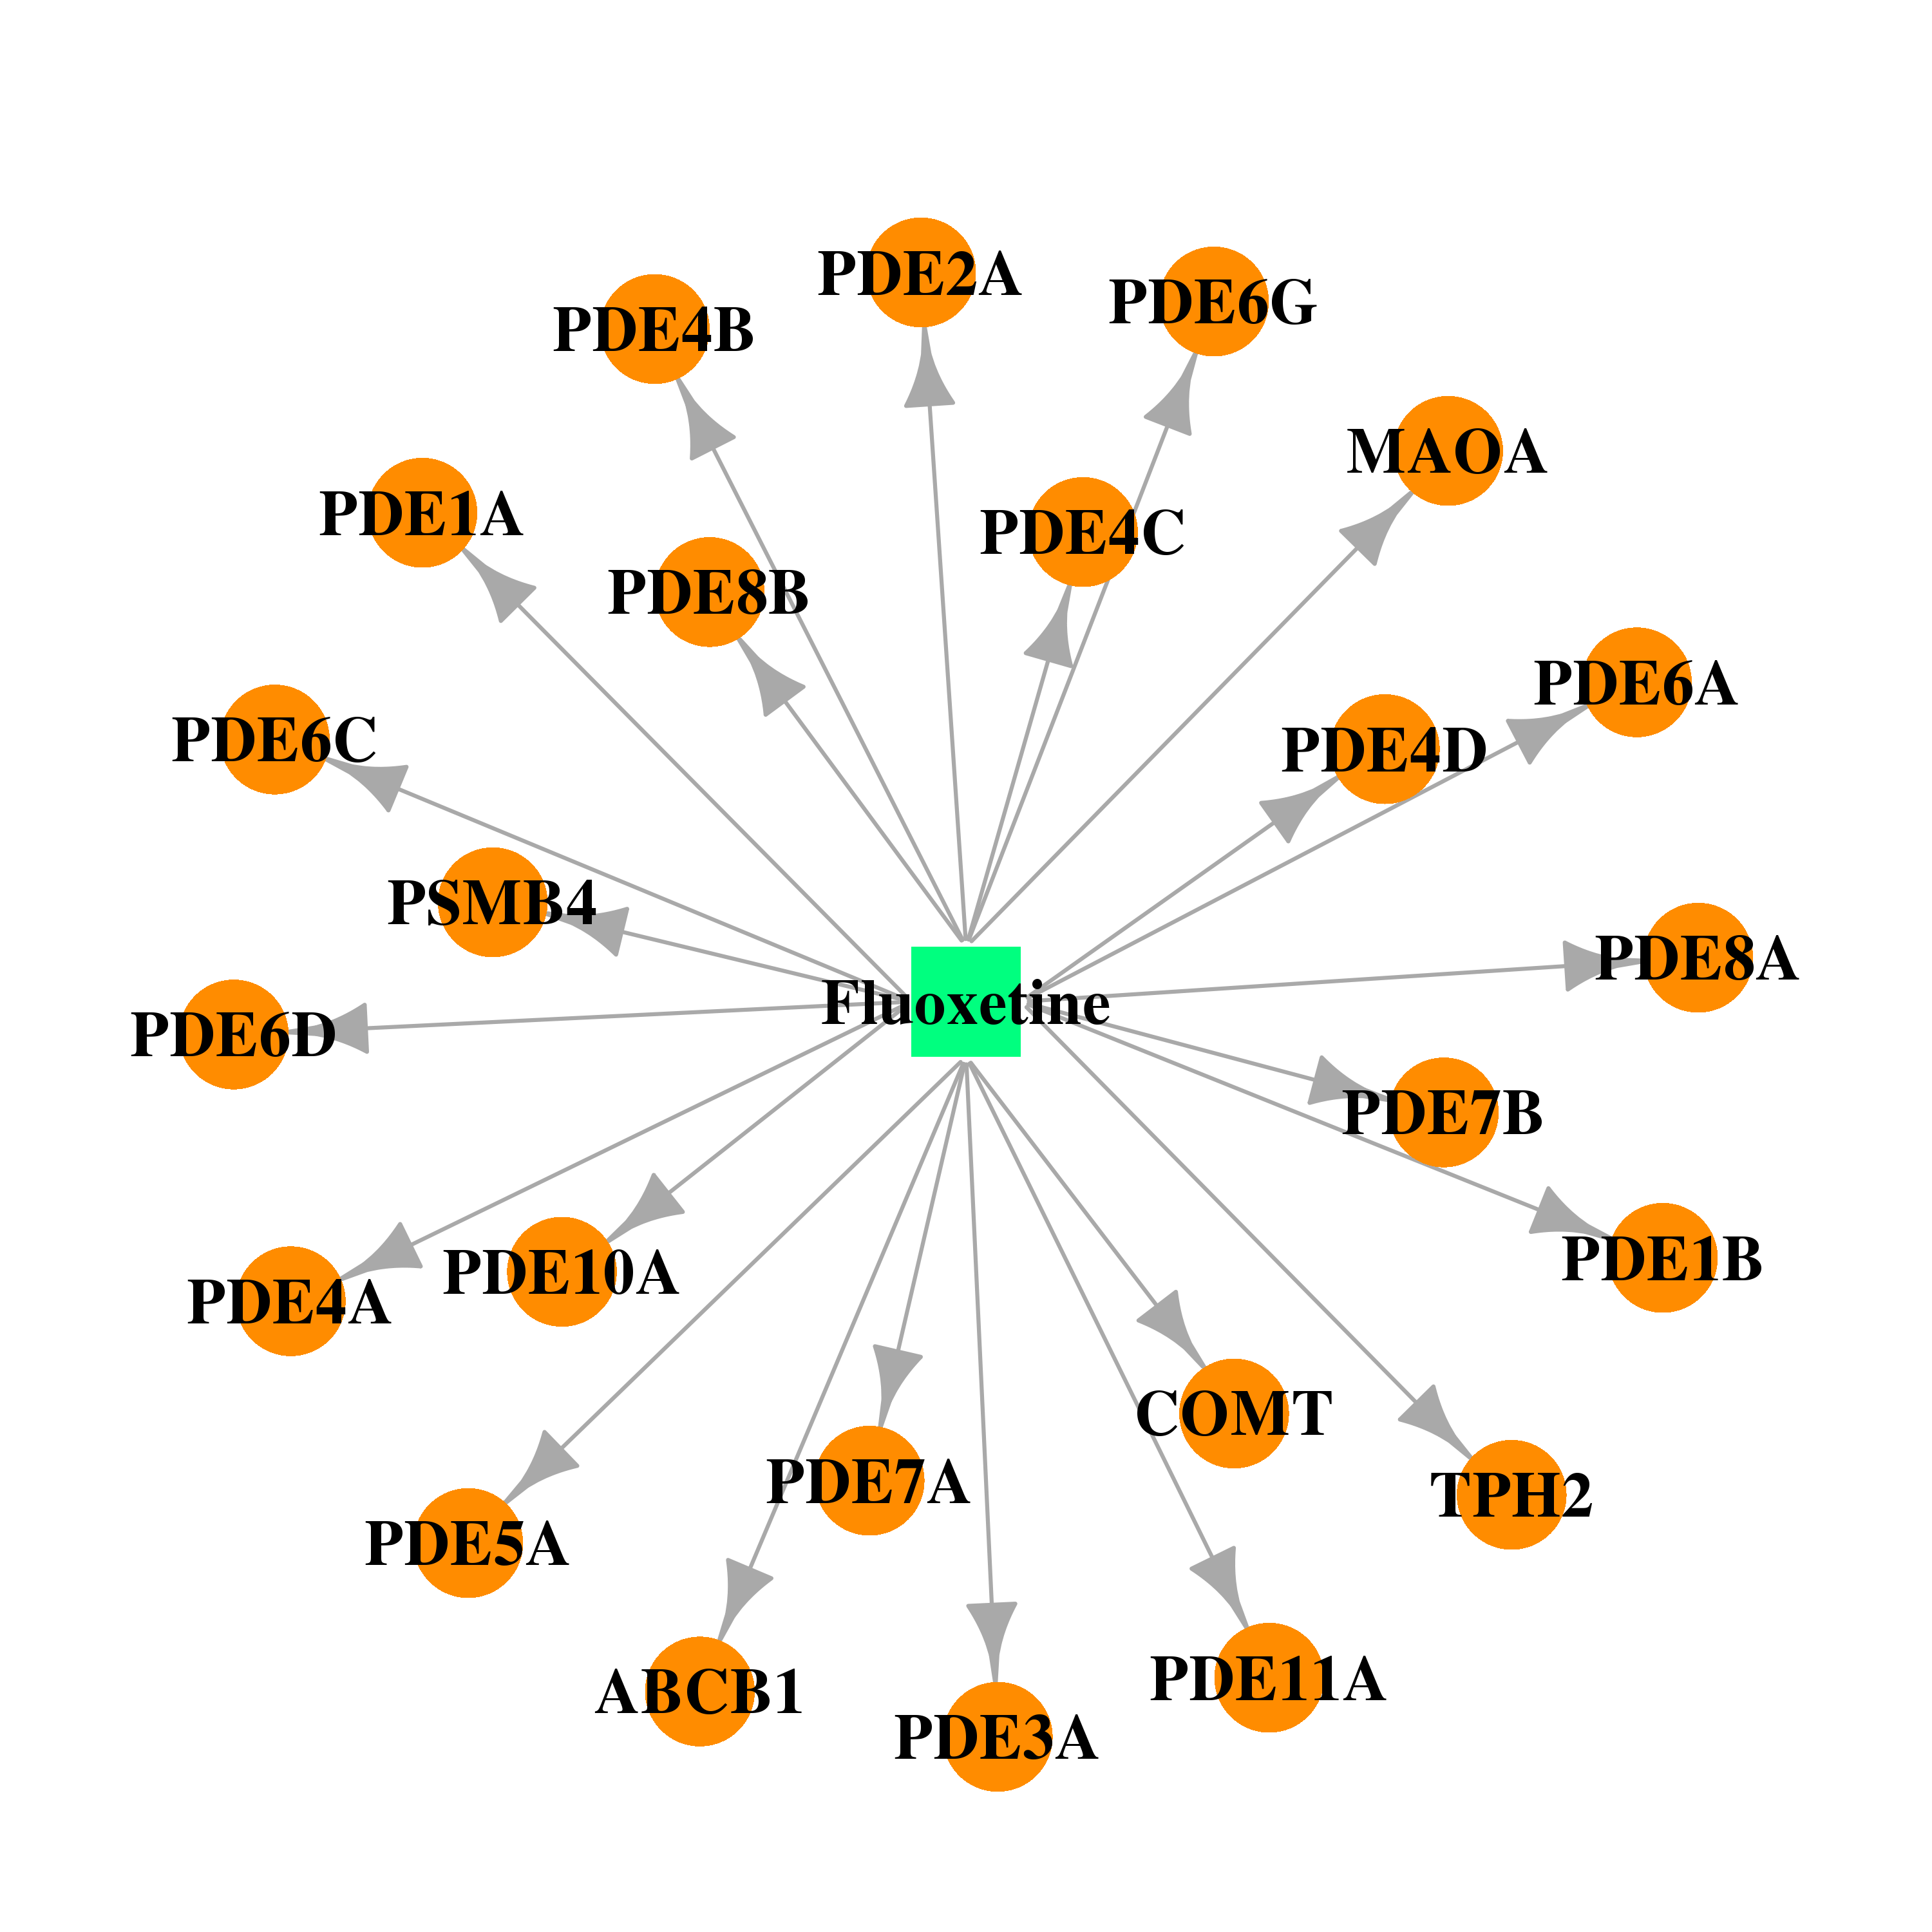 | 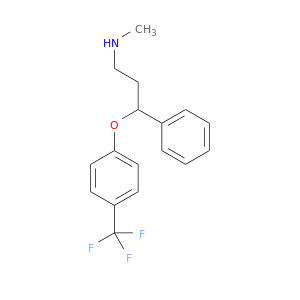 |
| Top |
| Cross referenced IDs for PDE8A |
| * We obtained these cross-references from Uniprot database. It covers 150 different DBs, 18 categories. http://www.uniprot.org/help/cross_references_section |
: Open all cross reference information
|
Copyright © 2016-Present - The Univsersity of Texas Health Science Center at Houston @ |