|
||||||||||||||||||||||||||||||||||||||||||||||||||||||||||||||||||||||||||||||||||||||||||||||||||||||||||||||||||||||||||||||||||||||||||||||||||||||||||||||||||||||||||||||||||||||||||||||||||||||||||||||||||||||||||||||||||||||||||||||||||||||||||||||||||||||||||||||||||||||||||||||||||||||||||||||||||||||||||
| |
| Phenotypic Information (metabolism pathway, cancer, disease, phenome) |
| |
| |
| Gene-Gene Network Information: Co-Expression Network, Interacting Genes & KEGG |
| |
|


| Gene Summary for SCLY |
| Basic gene info. | Gene symbol | SCLY |
| Gene name | selenocysteine lyase | |
| Synonyms | SCL|hSCL | |
| Cytomap | UCSC genome browser: 2q37.3 | |
| Genomic location | chr2 :238969564-239008054 | |
| Type of gene | protein-coding | |
| RefGenes | NM_016510.5, | |
| Ensembl id | ENSG00000132330 | |
| Description | - | |
| Modification date | 20141207 | |
| dbXrefs | MIM : 611056 | |
| HGNC : HGNC | ||
| Ensembl : ENSG00000132330 | ||
| HPRD : 15303 | ||
| Vega : OTTHUMG00000133336 | ||
| Protein | UniProt: go to UniProt's Cross Reference DB Table | |
| Expression | CleanEX: HS_SCLY | |
| BioGPS: 51540 | ||
| Gene Expression Atlas: ENSG00000132330 | ||
| The Human Protein Atlas: ENSG00000132330 | ||
| Pathway | NCI Pathway Interaction Database: SCLY | |
| KEGG: SCLY | ||
| REACTOME: SCLY | ||
| ConsensusPathDB | ||
| Pathway Commons: SCLY | ||
| Metabolism | MetaCyc: SCLY | |
| HUMANCyc: SCLY | ||
| Regulation | Ensembl's Regulation: ENSG00000132330 | |
| miRBase: chr2 :238,969,564-239,008,054 | ||
| TargetScan: NM_016510 | ||
| cisRED: ENSG00000132330 | ||
| Context | iHOP: SCLY | |
| cancer metabolism search in PubMed: SCLY | ||
| UCL Cancer Institute: SCLY | ||
| Assigned class in ccmGDB | C | |
| Top |
| Phenotypic Information for SCLY(metabolism pathway, cancer, disease, phenome) |
| Cancer | CGAP: SCLY |
| Familial Cancer Database: SCLY | |
| * This gene is included in those cancer gene databases. |
|
|
|
|
|
| . | ||||||||||||||||||||||||||||||||||||||||||||||||||||||||||||||||||||||||||||||||||||||||||||||||||||||||||||||||||||||||||||||||||||||||||||||||||||||||||||||||||||||||||||||||||||||||||||||||||||||||||||||||||||||||||||||||||||||||||||||||||||||||||||||||||||||||||||||||||||||||||||||||||||||||||||||||||||
Oncogene 1 | Significant driver gene in | |||||||||||||||||||||||||||||||||||||||||||||||||||||||||||||||||||||||||||||||||||||||||||||||||||||||||||||||||||||||||||||||||||||||||||||||||||||||||||||||||||||||||||||||||||||||||||||||||||||||||||||||||||||||||||||||||||||||||||||||||||||||||||||||||||||||||||||||||||||||||||||||||||||||||||||||||||||||||
| cf) number; DB name 1 Oncogene; http://nar.oxfordjournals.org/content/35/suppl_1/D721.long, 2 Tumor Suppressor gene; https://bioinfo.uth.edu/TSGene/, 3 Cancer Gene Census; http://www.nature.com/nrc/journal/v4/n3/abs/nrc1299.html, 4 CancerGenes; http://nar.oxfordjournals.org/content/35/suppl_1/D721.long, 5 Network of Cancer Gene; http://ncg.kcl.ac.uk/index.php, 1Therapeutic Vulnerabilities in Cancer; http://cbio.mskcc.org/cancergenomics/statius/ |
| KEGG_SELENOAMINO_ACID_METABOLISM | |
| OMIM | |
| Orphanet | |
| Disease | KEGG Disease: SCLY |
| MedGen: SCLY (Human Medical Genetics with Condition) | |
| ClinVar: SCLY | |
| Phenotype | MGI: SCLY (International Mouse Phenotyping Consortium) |
| PhenomicDB: SCLY | |
| Mutations for SCLY |
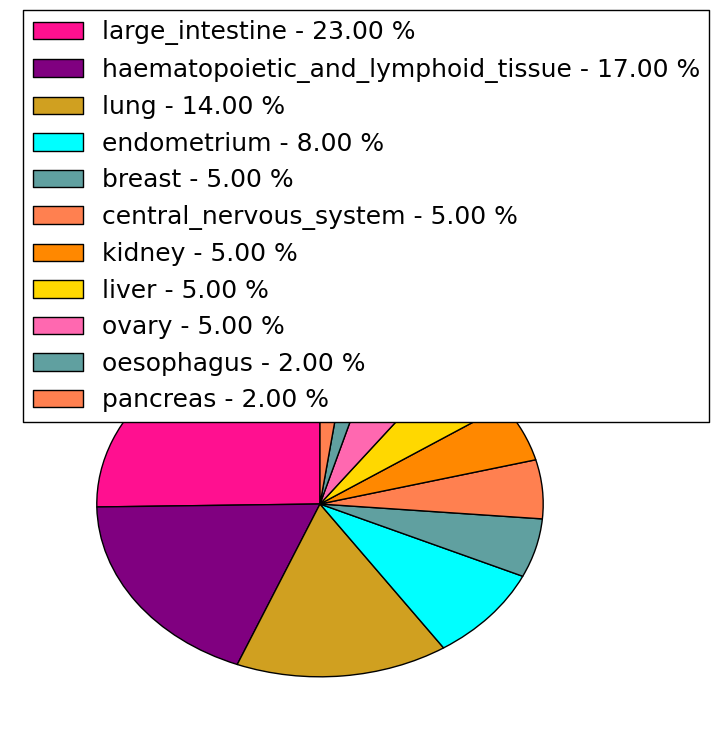
| * Under tables are showing count per each tissue to give us broad intuition about tissue specific mutation patterns.You can go to the detailed page for each mutation database's web site. |
| There's no structural variation information in COSMIC data for this gene. |
| * From mRNA Sanger sequences, Chitars2.0 arranged chimeric transcripts. This table shows SCLY related fusion information. |
| ID | Head Gene | Tail Gene | Accession | Gene_a | qStart_a | qEnd_a | Chromosome_a | tStart_a | tEnd_a | Gene_a | qStart_a | qEnd_a | Chromosome_a | tStart_a | tEnd_a |
| AA775419 | SCLY | 1 | 414 | 2 | 239007637 | 239008053 | CHURC1-FNTB | 410 | 686 | 14 | 65418105 | 65418383 | |
| AA813916 | RPL10 | 55 | 107 | X | 153629200 | 153629254 | SCLY | 92 | 241 | 2 | 239007418 | 239007567 | |
| BQ339693 | SV2A | 2 | 101 | 1 | 149878219 | 149878321 | SCLY | 89 | 583 | 2 | 238991969 | 239007008 | |
| Top |
| Mutation type/ Tissue ID | brca | cns | cerv | endome | haematopo | kidn | Lintest | liver | lung | ns | ovary | pancre | prost | skin | stoma | thyro | urina | |||
| Total # sample | 1 | 1 | ||||||||||||||||||
| GAIN (# sample) | 1 | |||||||||||||||||||
| LOSS (# sample) | 1 |
| cf) Tissue ID; Tissue type (1; Breast, 2; Central_nervous_system, 3; Cervix, 4; Endometrium, 5; Haematopoietic_and_lymphoid_tissue, 6; Kidney, 7; Large_intestine, 8; Liver, 9; Lung, 10; NS, 11; Ovary, 12; Pancreas, 13; Prostate, 14; Skin, 15; Stomach, 16; Thyroid, 17; Urinary_tract) |
| Top |
|
 |
| Top |
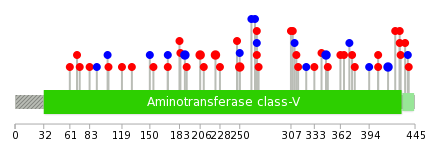
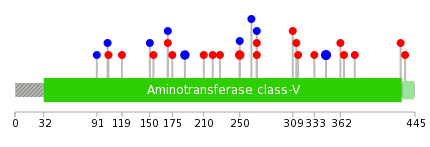
| Stat. for Non-Synonymous SNVs (# total SNVs=34) | (# total SNVs=15) |
 |  |
(# total SNVs=3) | (# total SNVs=0) |
 |
| Top |
| * When you move the cursor on each content, you can see more deailed mutation information on the Tooltip. Those are primary_site,primary_histology,mutation(aa),pubmedID. |
| GRCh37 position | Mutation(aa) | Unique sampleID count |
| chr2:239003059-239003059 | p.? | 3 |
| chr2:238976762-238976762 | p.K97fs*5 | 3 |
| chr2:239003069-239003069 | p.F346F | 2 |
| chr2:238990716-238990716 | p.A223T | 2 |
| chr2:239006879-239006879 | p.F415F | 2 |
| chr2:238990797-238990797 | p.R250C | 2 |
| chr2:238990408-238990408 | p.L189L | 2 |
| chr2:239003172-239003172 | p.? | 2 |
| chr2:238991893-238991893 | p.Y269F | 2 |
| chr2:238990458-238990458 | p.N206S | 2 |
| Top |
|
 |
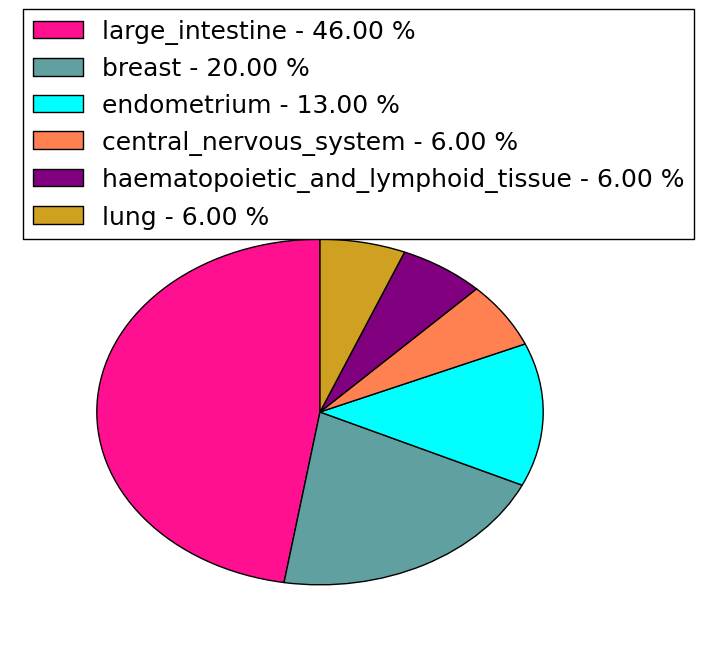
| Point Mutation/ Tissue ID | 1 | 2 | 3 | 4 | 5 | 6 | 7 | 8 | 9 | 10 | 11 | 12 | 13 | 14 | 15 | 16 | 17 | 18 | 19 | 20 |
| # sample | 1 | 12 | 1 | 1 | 1 | 1 | 3 | 1 | 1 | 2 | 2 | 3 | ||||||||
| # mutation | 1 | 12 | 1 | 1 | 1 | 1 | 3 | 1 | 1 | 2 | 2 | 4 | ||||||||
| nonsynonymous SNV | 1 | 6 | 1 | 1 | 1 | 3 | 1 | 1 | 1 | 3 | ||||||||||
| synonymous SNV | 6 | 1 | 1 | 1 | 1 | 1 |
| cf) Tissue ID; Tissue type (1; BLCA[Bladder Urothelial Carcinoma], 2; BRCA[Breast invasive carcinoma], 3; CESC[Cervical squamous cell carcinoma and endocervical adenocarcinoma], 4; COAD[Colon adenocarcinoma], 5; GBM[Glioblastoma multiforme], 6; Glioma Low Grade, 7; HNSC[Head and Neck squamous cell carcinoma], 8; KICH[Kidney Chromophobe], 9; KIRC[Kidney renal clear cell carcinoma], 10; KIRP[Kidney renal papillary cell carcinoma], 11; LAML[Acute Myeloid Leukemia], 12; LUAD[Lung adenocarcinoma], 13; LUSC[Lung squamous cell carcinoma], 14; OV[Ovarian serous cystadenocarcinoma ], 15; PAAD[Pancreatic adenocarcinoma], 16; PRAD[Prostate adenocarcinoma], 17; SKCM[Skin Cutaneous Melanoma], 18:STAD[Stomach adenocarcinoma], 19:THCA[Thyroid carcinoma], 20:UCEC[Uterine Corpus Endometrial Carcinoma]) |
| Top |
| * We represented just top 10 SNVs. When you move the cursor on each content, you can see more deailed mutation information on the Tooltip. Those are primary_site, primary_histology, mutation(aa), pubmedID. |
| Genomic Position | Mutation(aa) | Unique sampleID count |
| chr2:239003069 | p.F346F | 3 |
| chr2:238990408 | p.R250C | 2 |
| chr2:238990797 | p.Y269C | 2 |
| chr2:238991893 | p.L189L | 2 |
| chr2:238999895 | p.R250R | 1 |
| chr2:238990470 | p.I263I | 1 |
| chr2:239002554 | p.A91A | 1 |
| chr2:238976752 | p.Y269Y | 1 |
| chr2:238990708 | p.F103F | 1 |
| chr2:238976788 | p.M309I | 1 |
| * Copy number data were extracted from TCGA using R package TCGA-Assembler. The URLs of all public data files on TCGA DCC data server were gathered on Jan-05-2015. Function ProcessCNAData in TCGA-Assembler package was used to obtain gene-level copy number value which is calculated as the average copy number of the genomic region of a gene. |
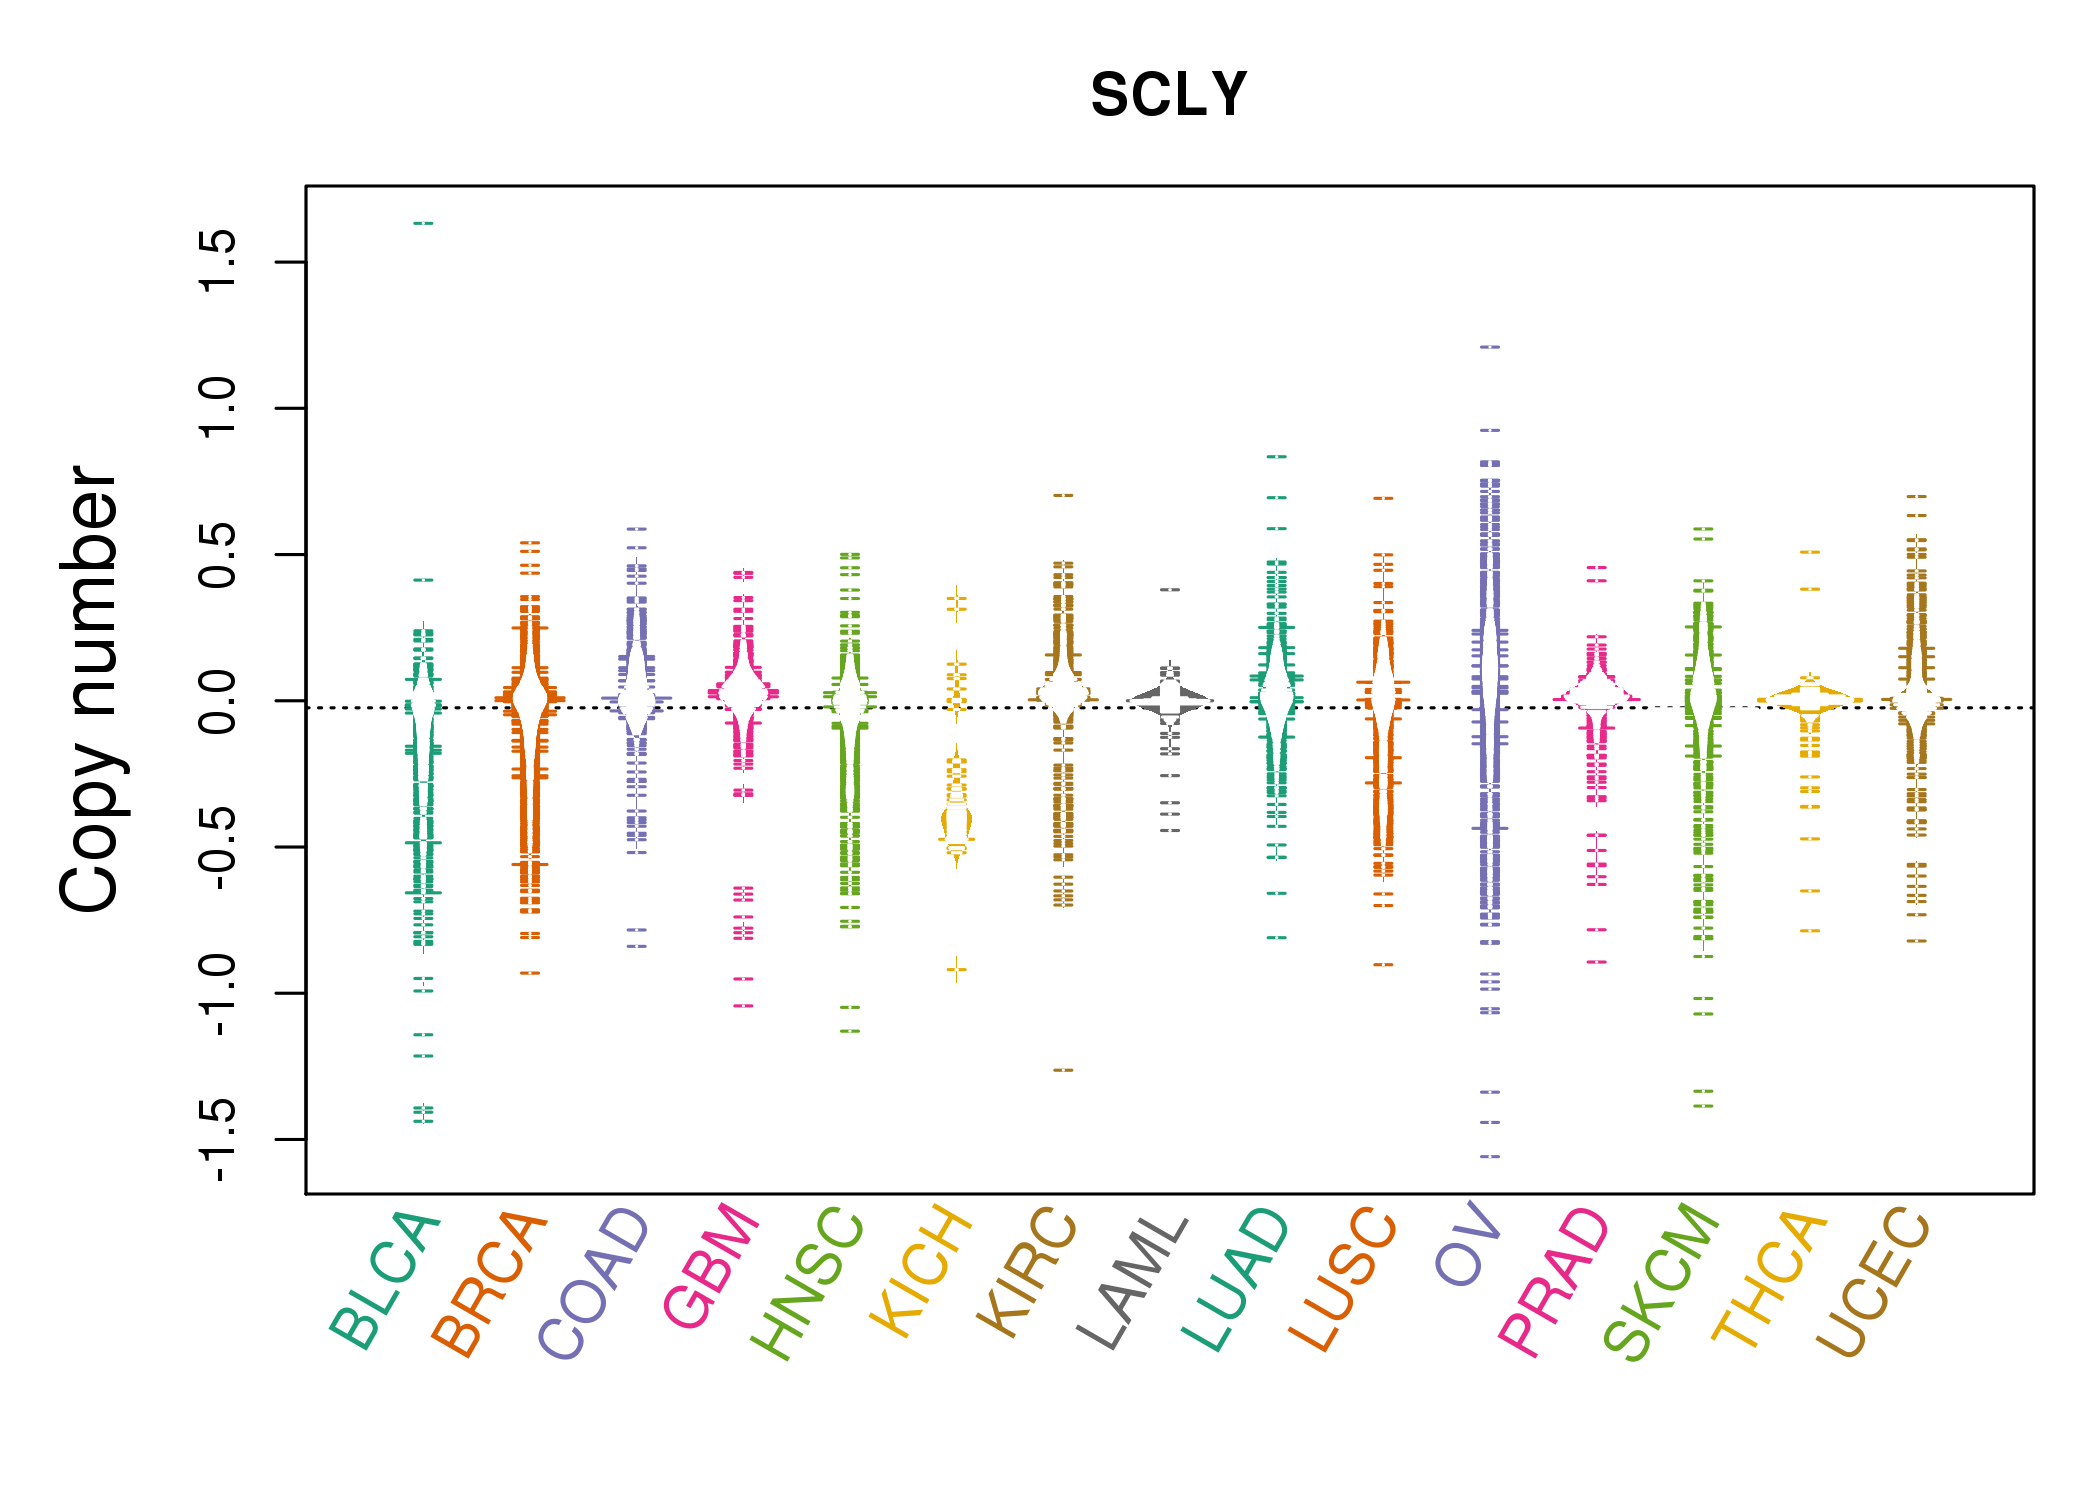 |
| cf) Tissue ID[Tissue type]: BLCA[Bladder Urothelial Carcinoma], BRCA[Breast invasive carcinoma], CESC[Cervical squamous cell carcinoma and endocervical adenocarcinoma], COAD[Colon adenocarcinoma], GBM[Glioblastoma multiforme], Glioma Low Grade, HNSC[Head and Neck squamous cell carcinoma], KICH[Kidney Chromophobe], KIRC[Kidney renal clear cell carcinoma], KIRP[Kidney renal papillary cell carcinoma], LAML[Acute Myeloid Leukemia], LUAD[Lung adenocarcinoma], LUSC[Lung squamous cell carcinoma], OV[Ovarian serous cystadenocarcinoma ], PAAD[Pancreatic adenocarcinoma], PRAD[Prostate adenocarcinoma], SKCM[Skin Cutaneous Melanoma], STAD[Stomach adenocarcinoma], THCA[Thyroid carcinoma], UCEC[Uterine Corpus Endometrial Carcinoma] |
| Top |
| Gene Expression for SCLY |
| * CCLE gene expression data were extracted from CCLE_Expression_Entrez_2012-10-18.res: Gene-centric RMA-normalized mRNA expression data. |
 |
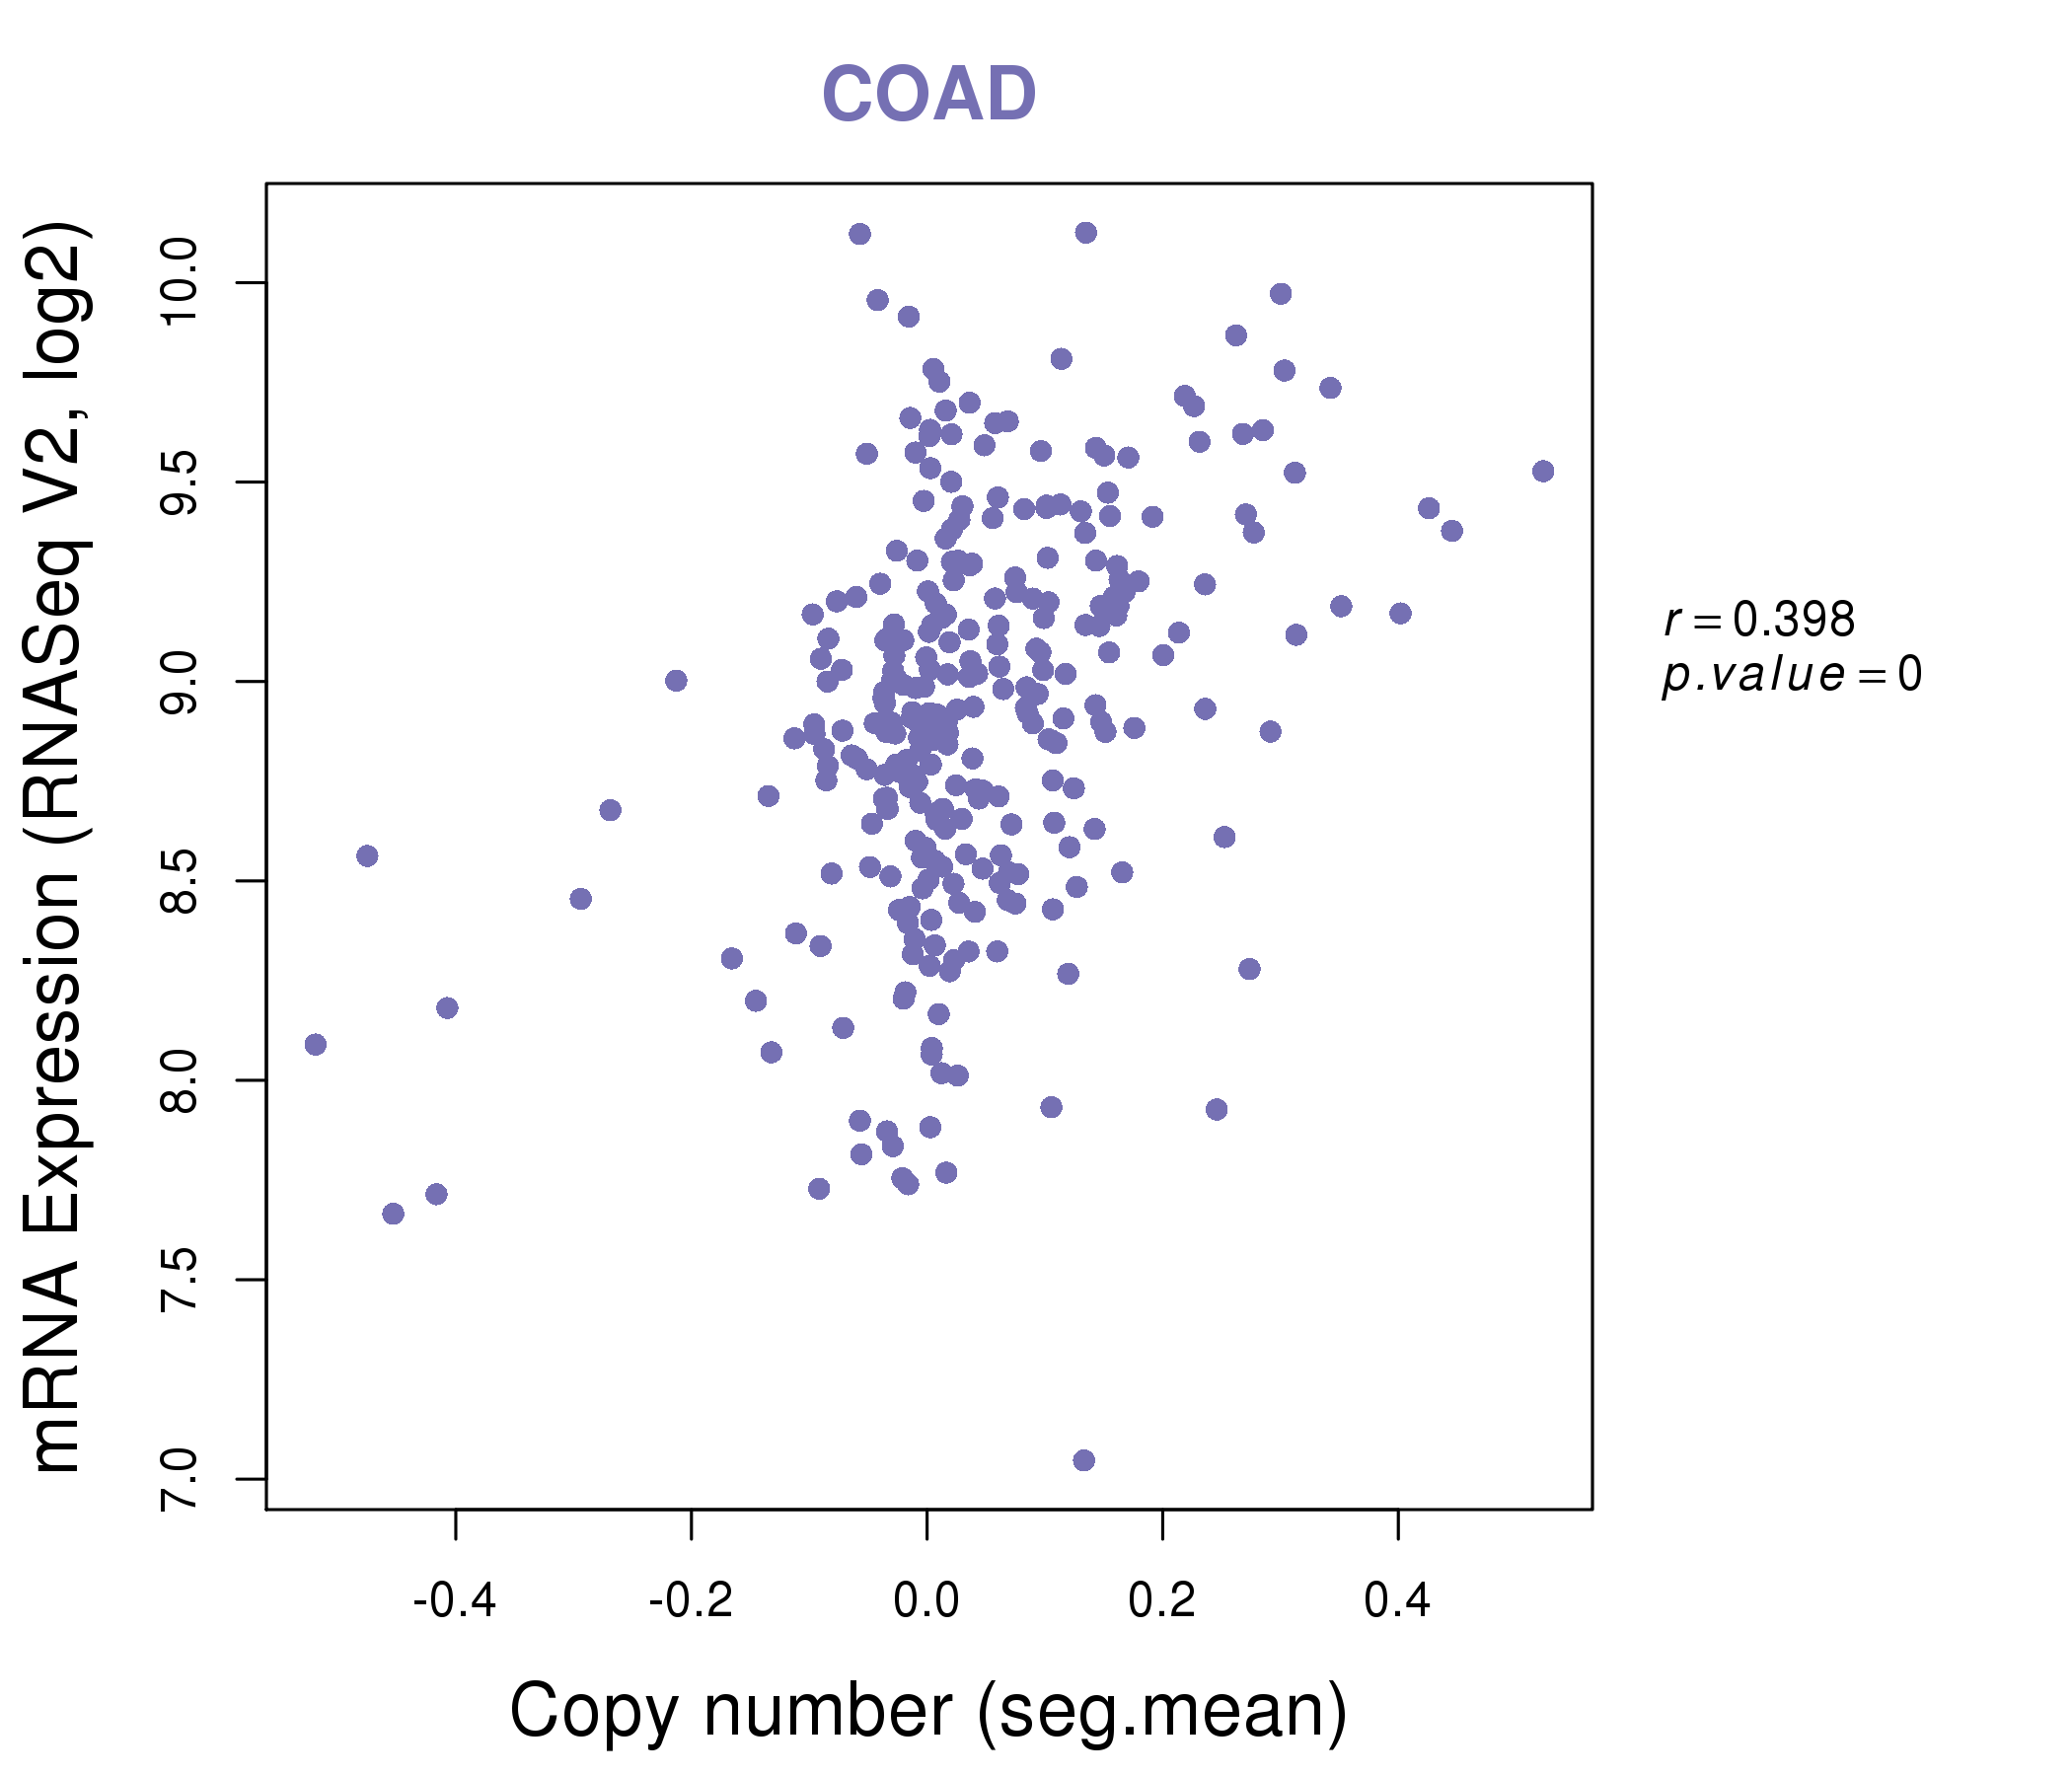
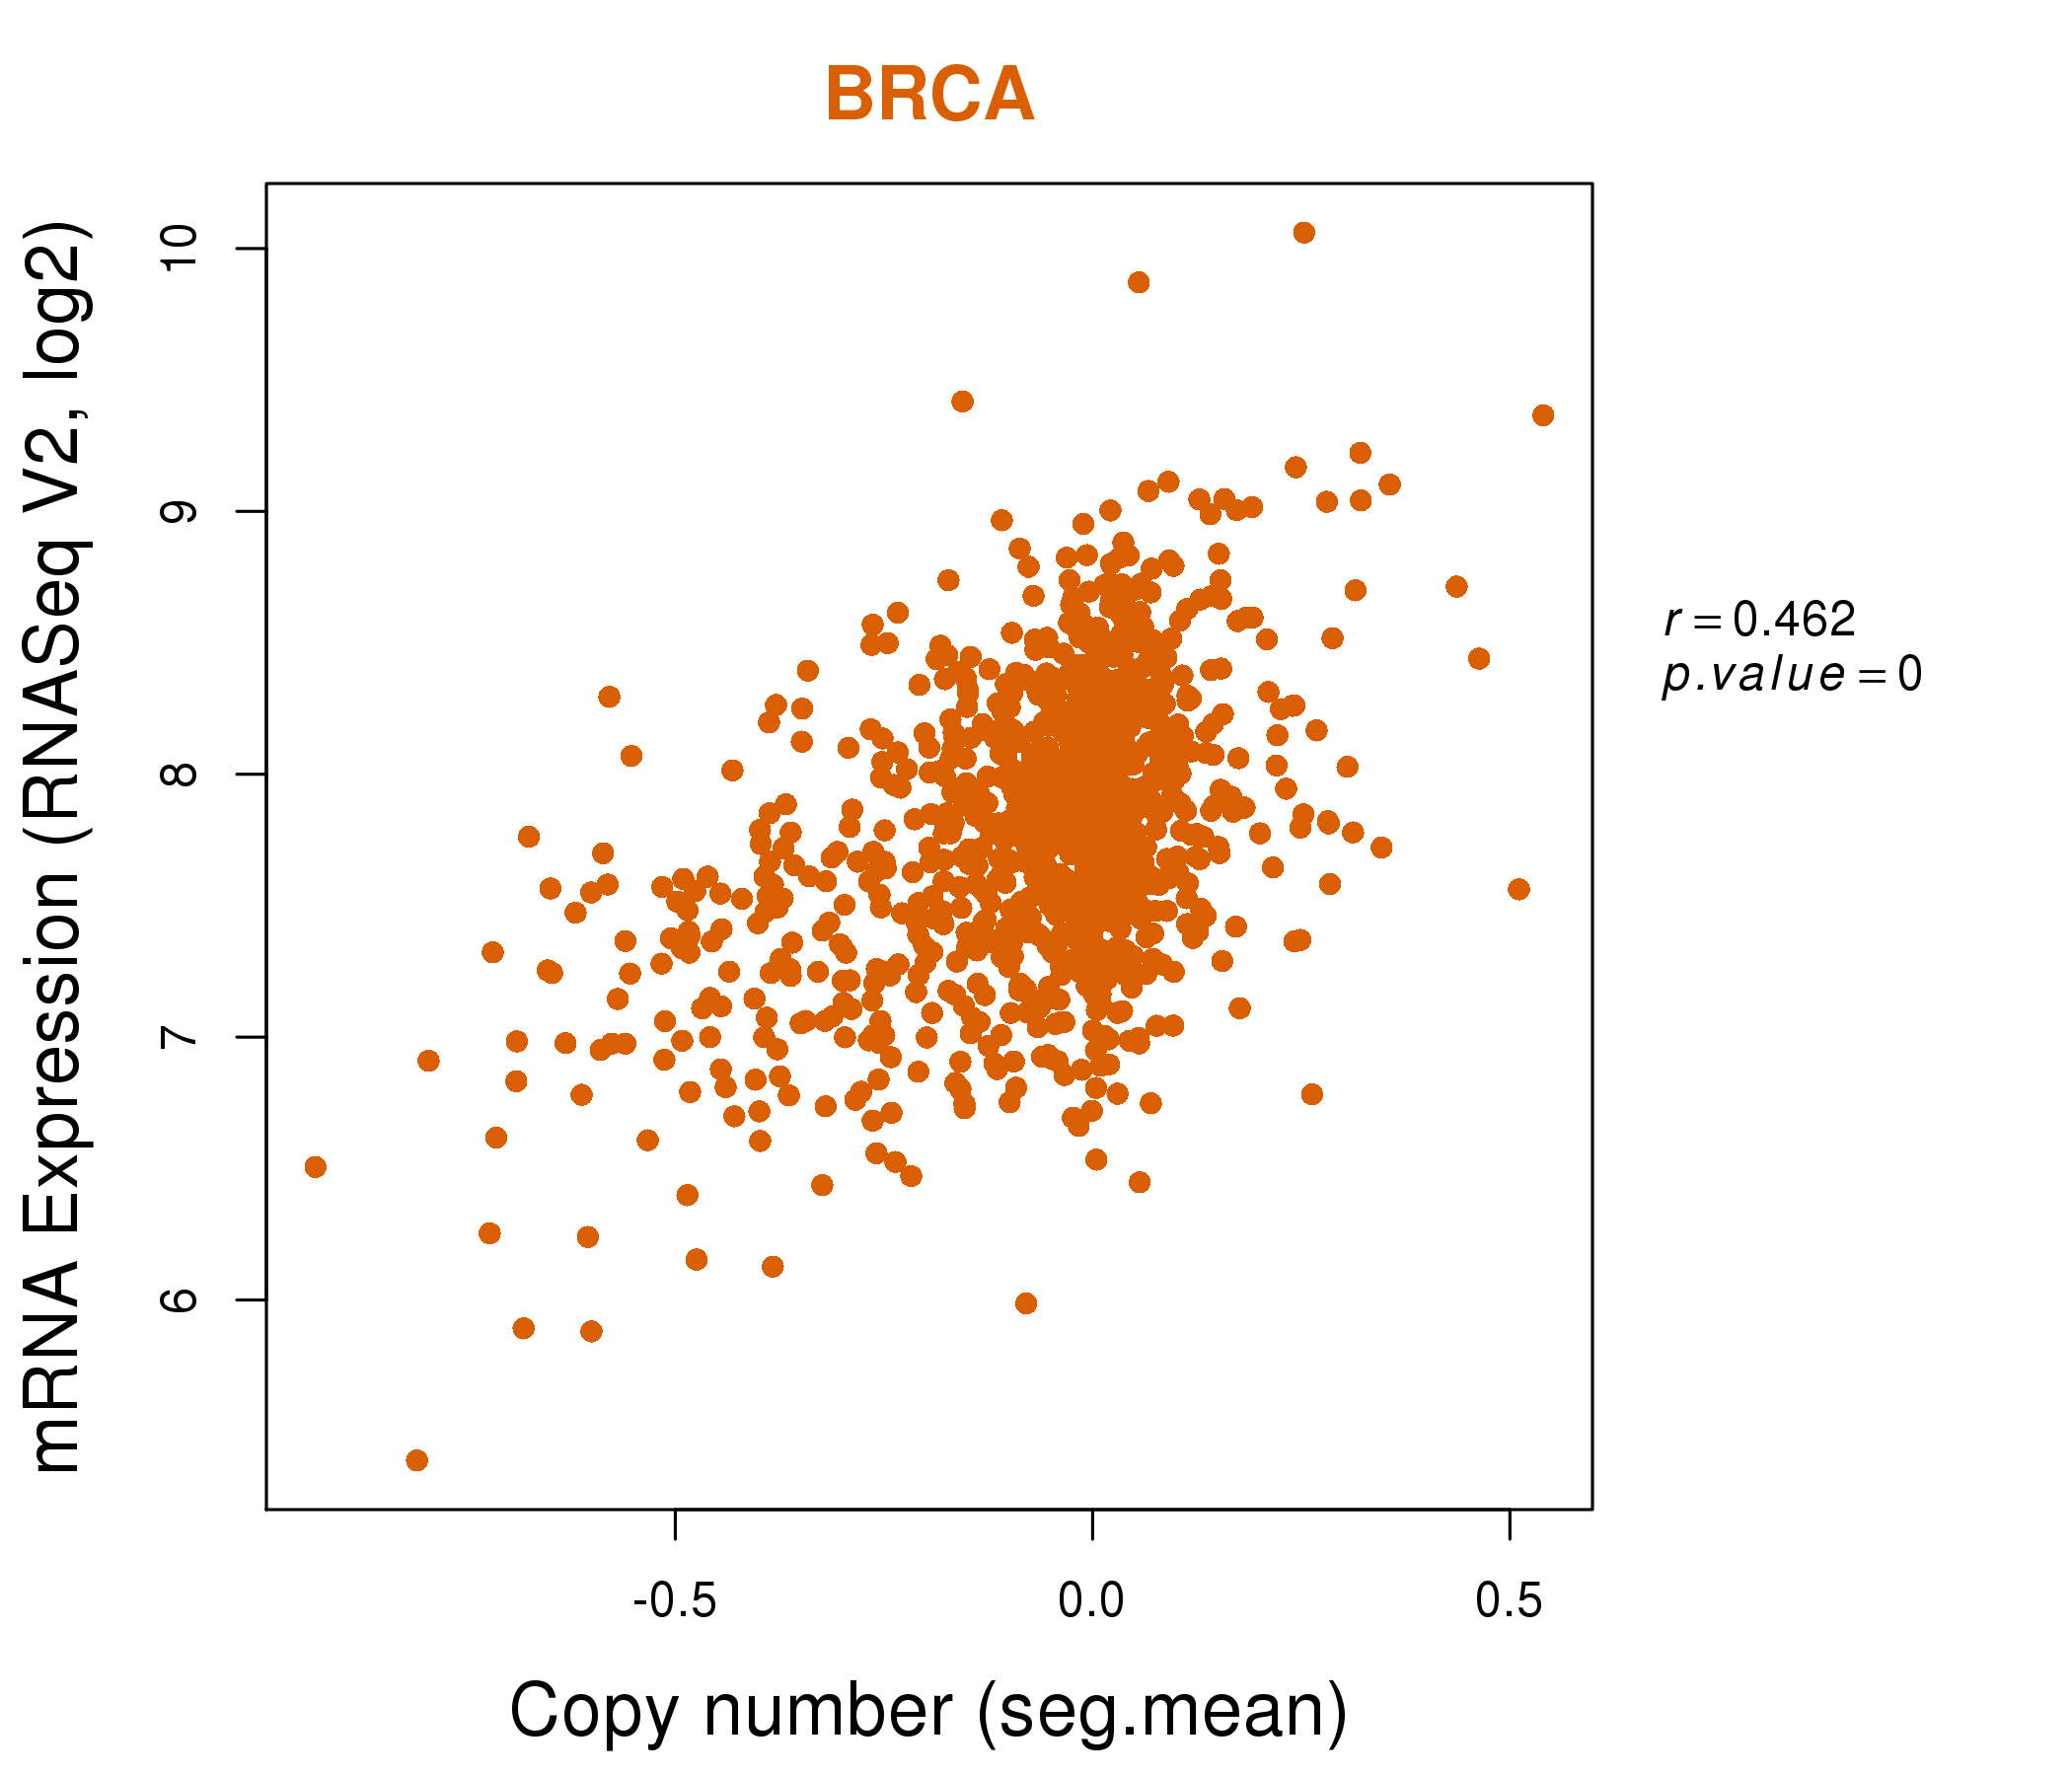
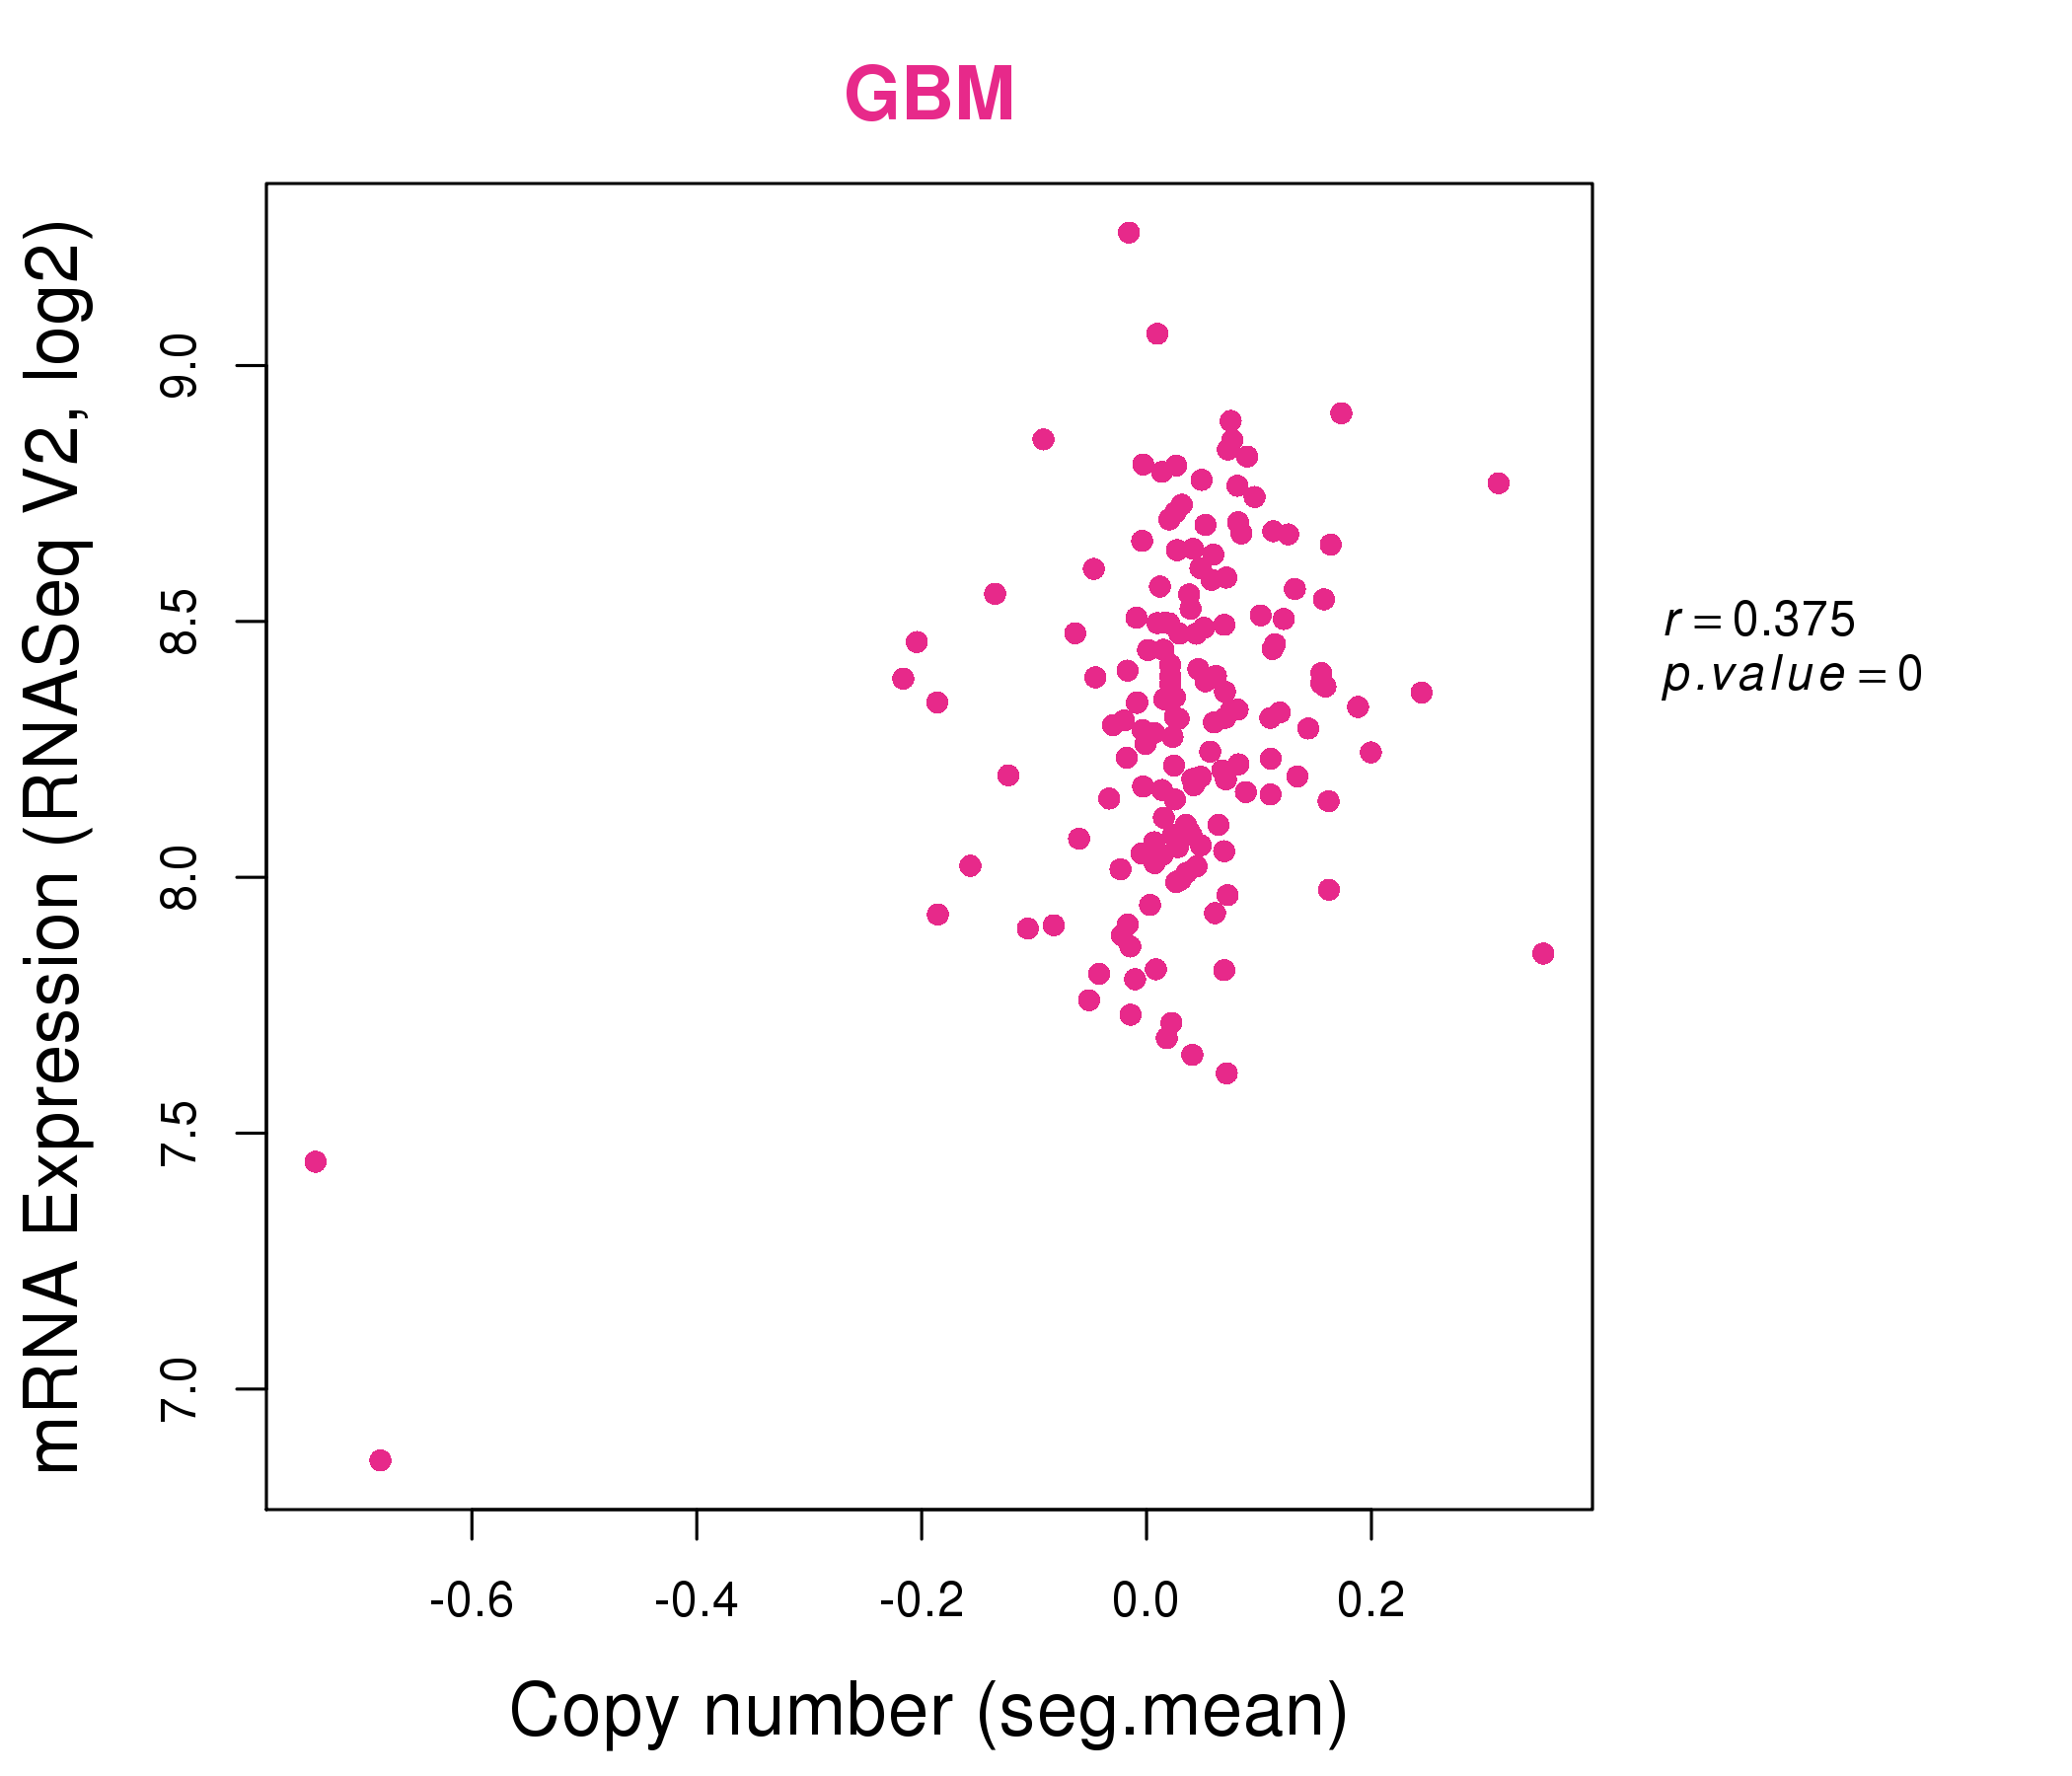
| * Normalized gene expression data of RNASeqV2 was extracted from TCGA using R package TCGA-Assembler. The URLs of all public data files on TCGA DCC data server were gathered at Jan-05-2015. Only eight cancer types have enough normal control samples for differential expression analysis. (t test, adjusted p<0.05 (using Benjamini-Hochberg FDR)) |
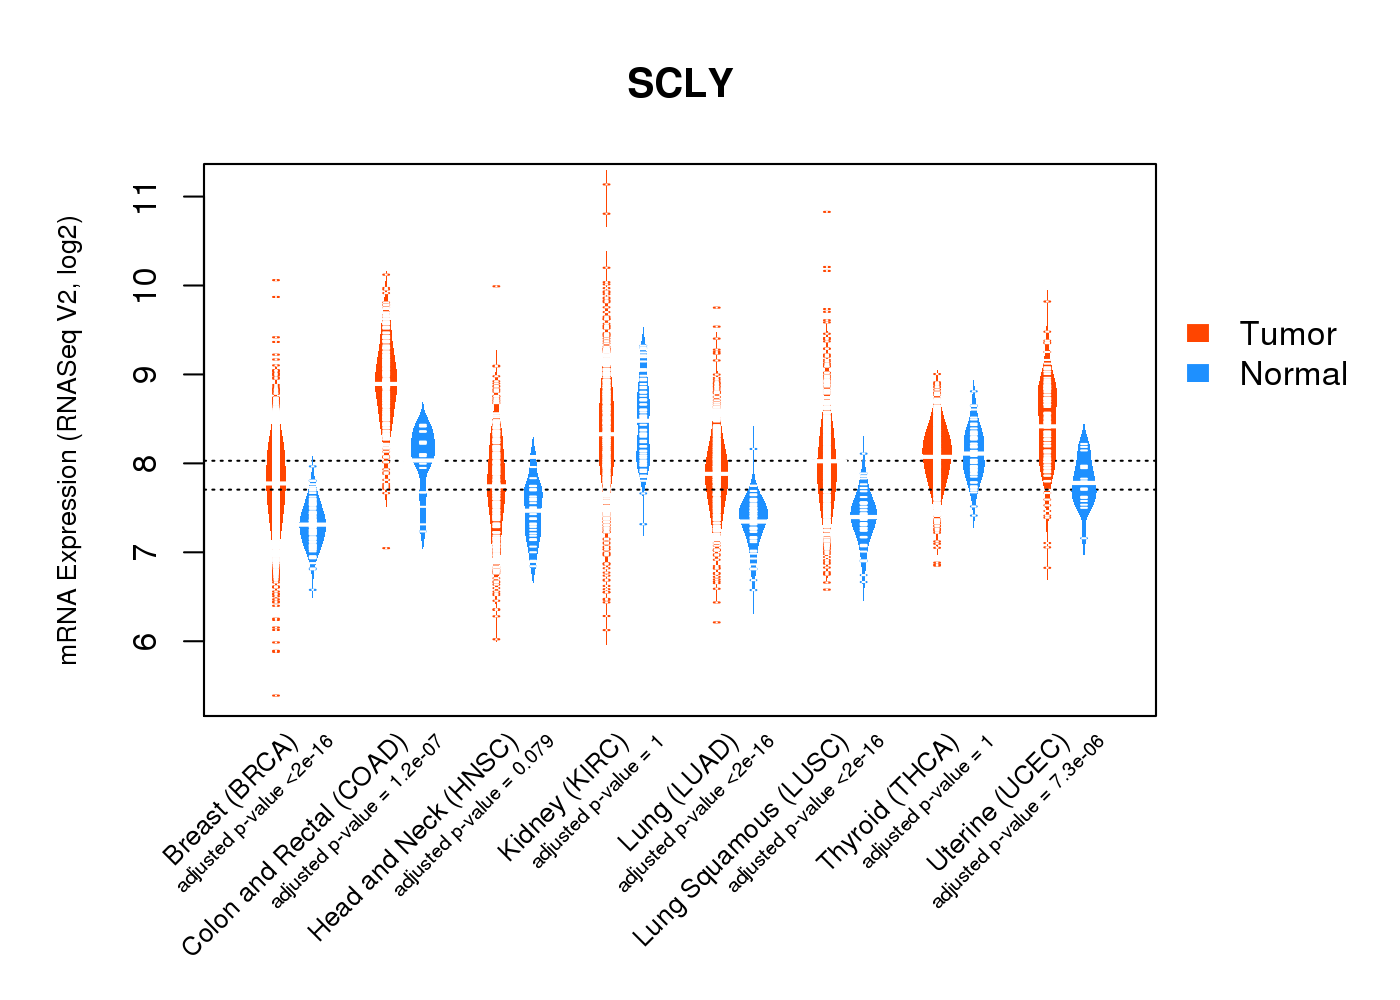 |
| Top |
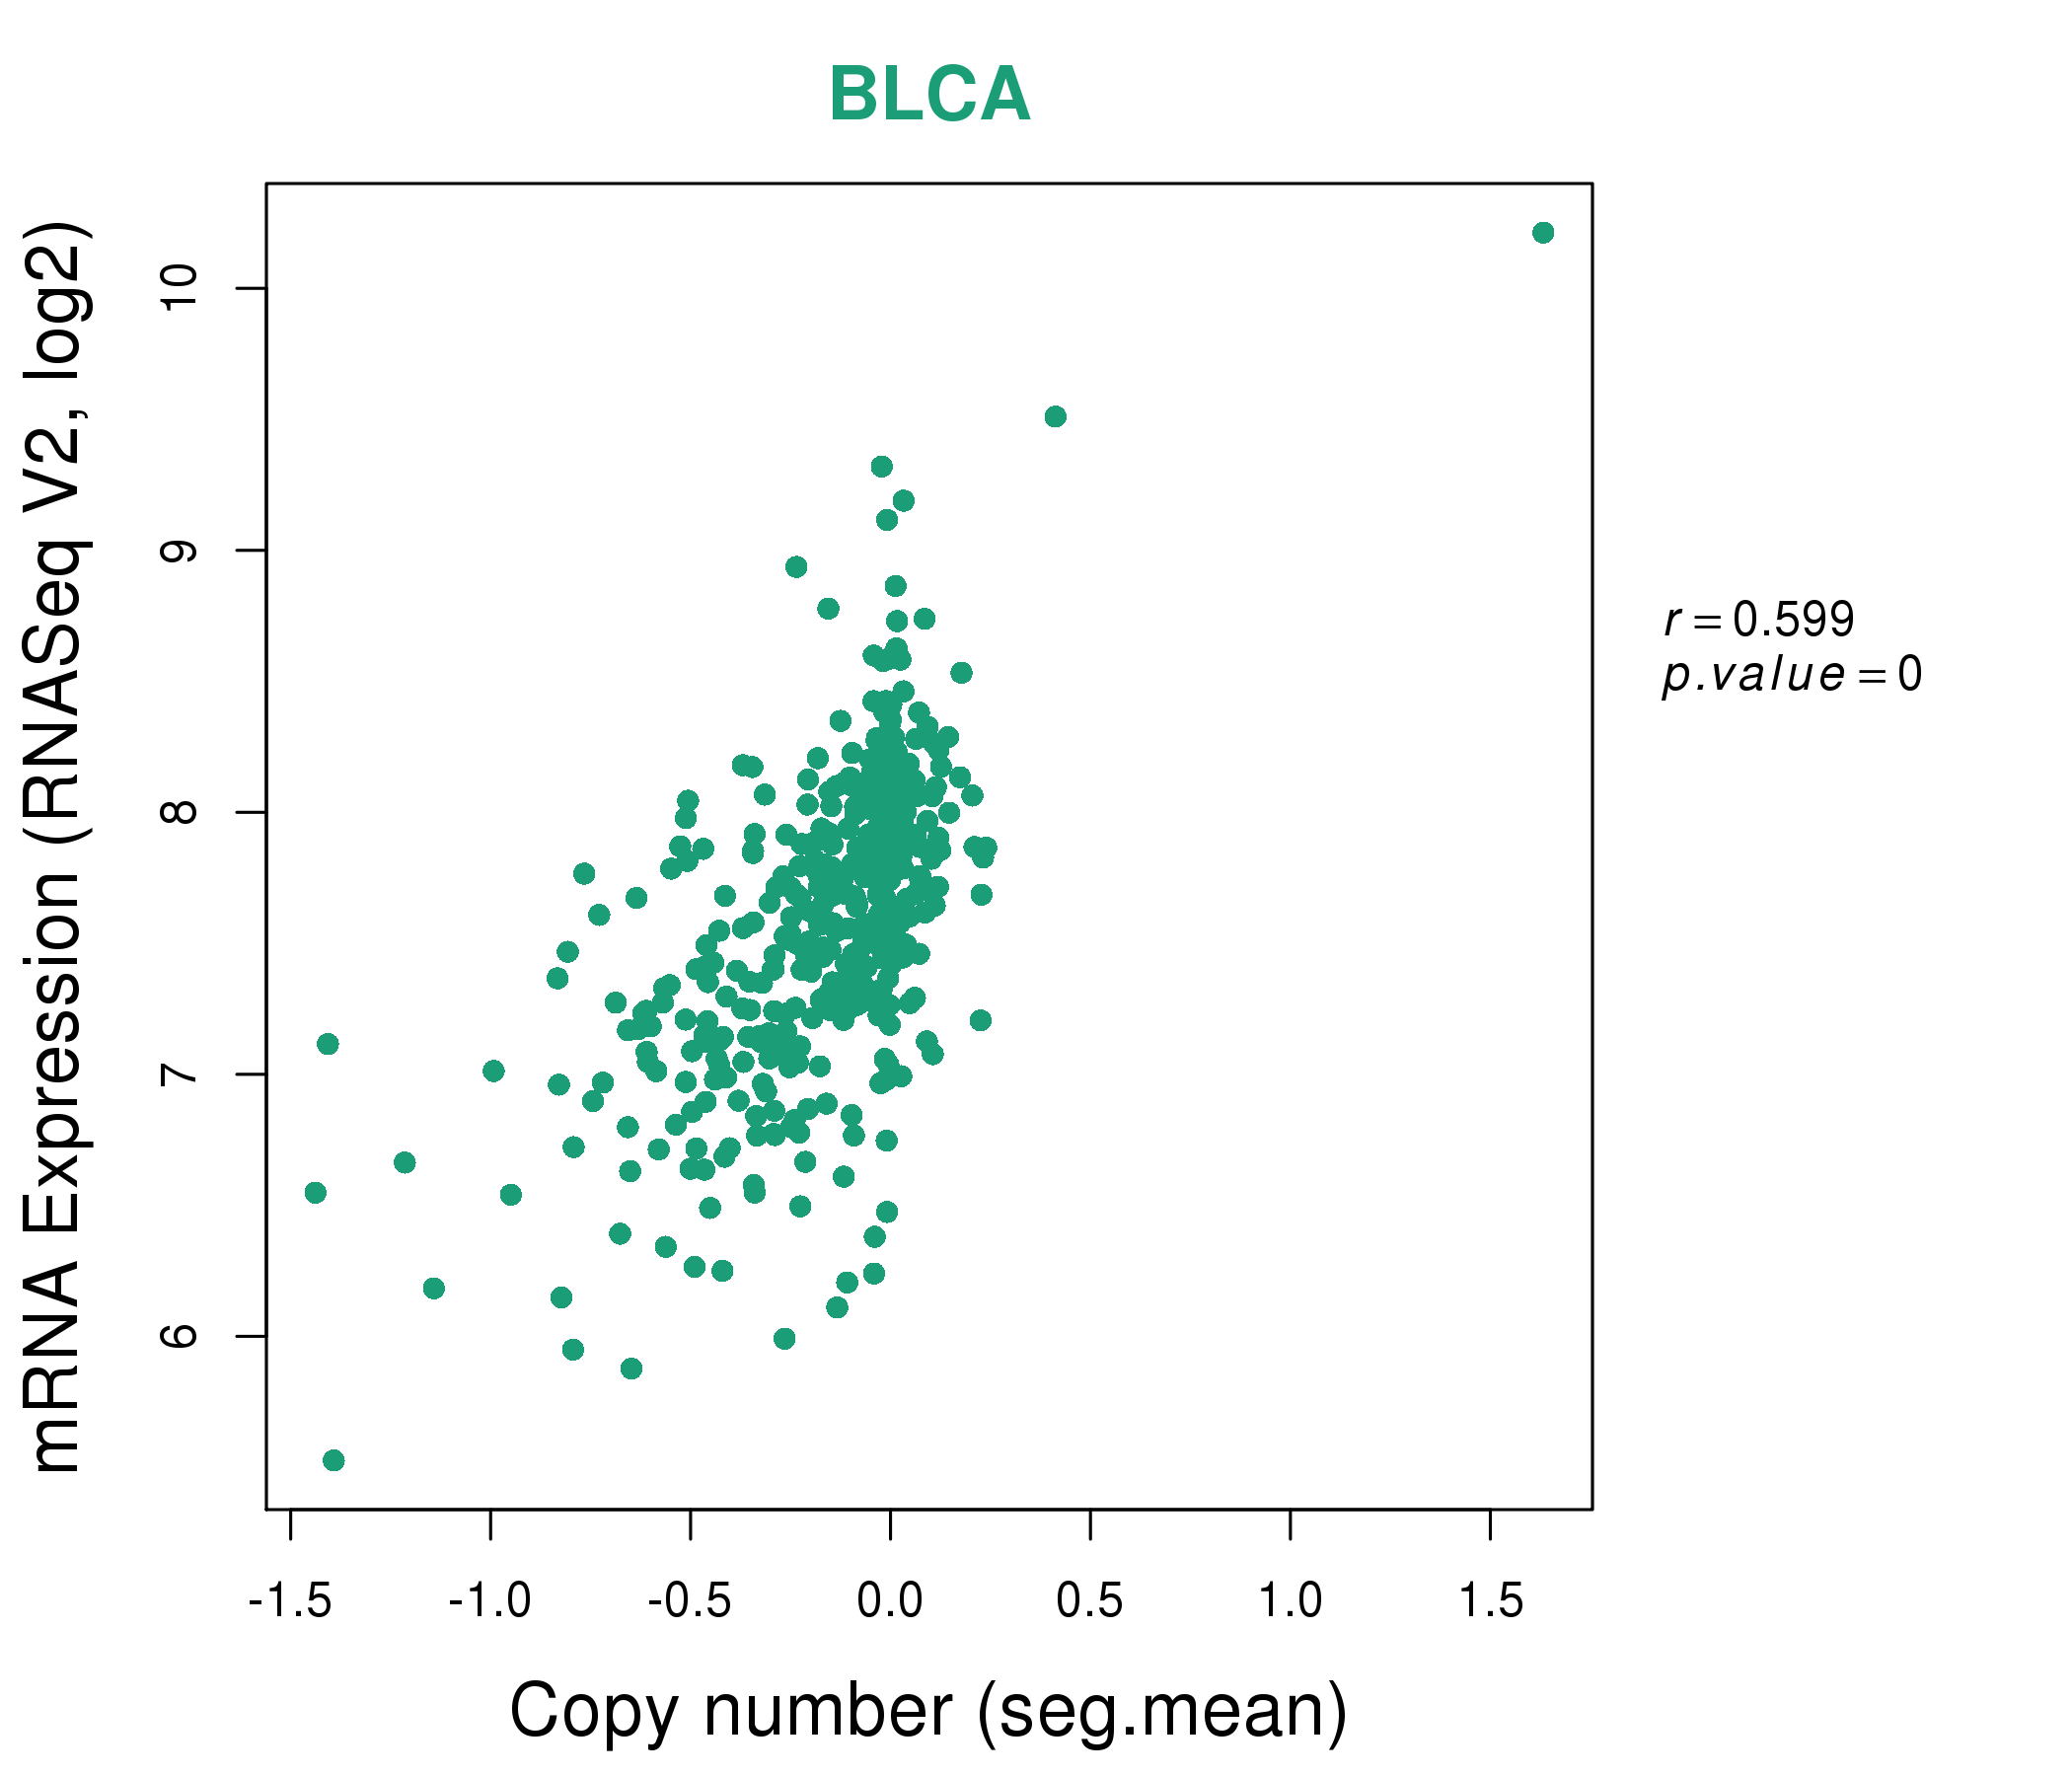
| * This plots show the correlation between CNV and gene expression. |
: Open all plots for all cancer types
 |
|
 |
|
| Top |
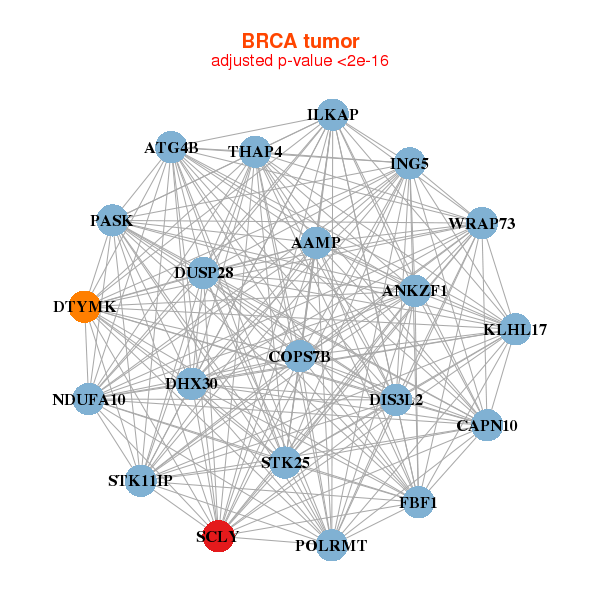
| Gene-Gene Network Information |
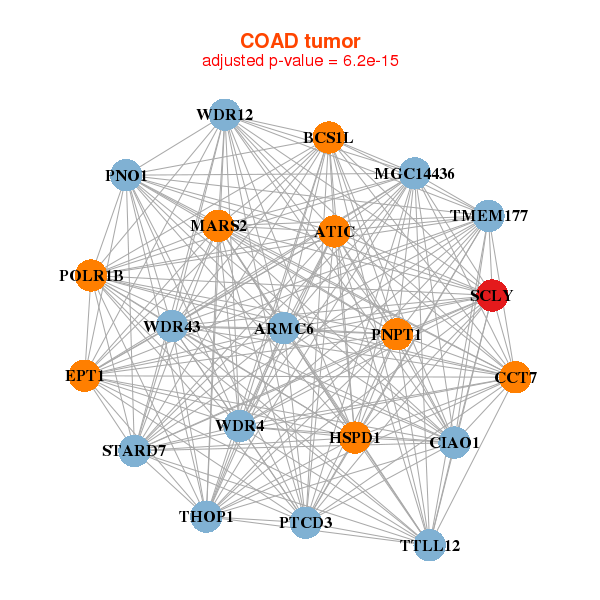
| * Co-Expression network figures were drawn using R package igraph. Only the top 20 genes with the highest correlations were shown. Red circle: input gene, orange circle: cell metabolism gene, sky circle: other gene |
: Open all plots for all cancer types
 |
|
| AAMP,ANKZF1,ATG4B,CAPN10,COPS7B,DHX30,DIS3L2, DTYMK,DUSP28,FBF1,ILKAP,ING5,KLHL17,NDUFA10, PASK,POLRMT,SCLY,STK11IP,STK25,THAP4,WRAP73 | EMC10,CAPN1,CCDC22,DDX41,ERCC2,FARSA,FIZ1, GRWD1,HMG20B,LMAN2,MAEA,PPP1CA,PRPF19,RANGAP1, RNASEH2A,RUVBL2,SCLY,SDF2L1,TRIM28,WRAP53,YIPF2 |
 |
|
| ARMC6,ATIC,BCS1L,CCT7,CIAO1,EPT1,HSPD1, MARS2,MGC14436,PNO1,PNPT1,POLR1B,PTCD3,SCLY, STARD7,THOP1,TMEM177,TTLL12,WDR12,WDR4,WDR43 | ACOT7,APITD1,ASAH2B,RIIAD1,CARS2,CDCA3,GALK1, GREB1L,HSD3B7,IDH2,MON1A,NMT1,P4HB,SCLY, SEC13,SEC24D,SH3GL1,SIGMAR1,SLC25A22,TEAD4,WDR34 |
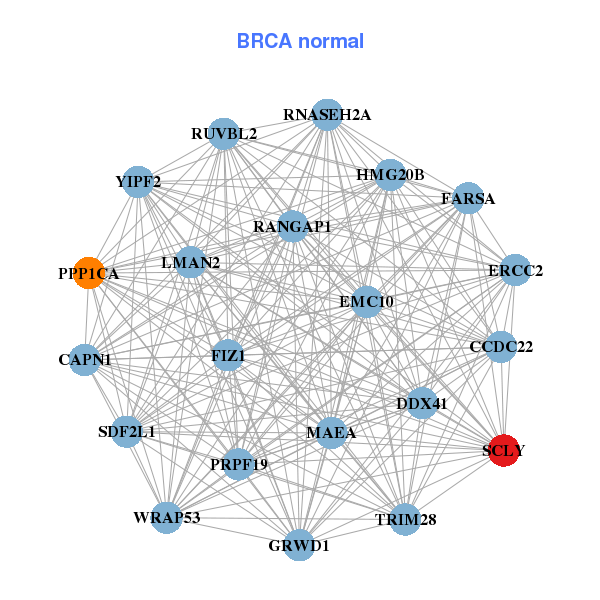
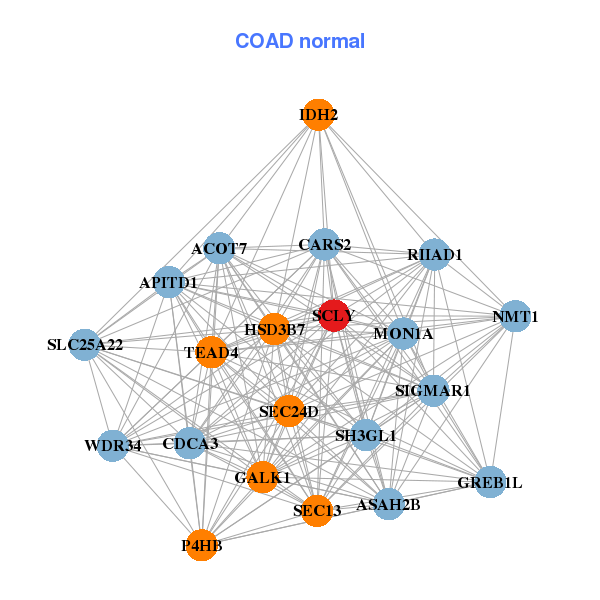
| * Co-Expression network figures were drawn using R package igraph. Only the top 20 genes with the highest correlations were shown. Red circle: input gene, orange circle: cell metabolism gene, sky circle: other gene |
: Open all plots for all cancer types
| Top |
: Open all interacting genes' information including KEGG pathway for all interacting genes from DAVID
| Top |
| Pharmacological Information for SCLY |
| There's no related Drug. |
| Top |
| Cross referenced IDs for SCLY |
| * We obtained these cross-references from Uniprot database. It covers 150 different DBs, 18 categories. http://www.uniprot.org/help/cross_references_section |
: Open all cross reference information
|
Copyright © 2016-Present - The Univsersity of Texas Health Science Center at Houston @ |