|
||||||||||||||||||||||||||||||||||||||||||||||||||||||||||||||||||||||||||||||||||||||||||||||||||||||||||||||||||||||||||||||||||||||||||||||||||||||||||||||||||||||||||||||||||||||||||||||||||||||||||||||||||||||||||||||||||||||||||||||||||||||||||||||||||||||||||||||||||||||||||||||||||||||||||||||||||||||||||
| |
| Phenotypic Information (metabolism pathway, cancer, disease, phenome) |
| |
| |
| Gene-Gene Network Information: Co-Expression Network, Interacting Genes & KEGG |
| |
|


| Gene Summary for PDE6B |
| Top |
| Phenotypic Information for PDE6B(metabolism pathway, cancer, disease, phenome) |
| Cancer | CGAP: PDE6B |
| Familial Cancer Database: PDE6B | |
| * This gene is included in those cancer gene databases. |
|
|
|
|
|
| . | ||||||||||||||||||||||||||||||||||||||||||||||||||||||||||||||||||||||||||||||||||||||||||||||||||||||||||||||||||||||||||||||||||||||||||||||||||||||||||||||||||||||||||||||||||||||||||||||||||||||||||||||||||||||||||||||||||||||||||||||||||||||||||||||||||||||||||||||||||||||||||||||||||||||||||||||||||||
Oncogene 1 | Significant driver gene in | |||||||||||||||||||||||||||||||||||||||||||||||||||||||||||||||||||||||||||||||||||||||||||||||||||||||||||||||||||||||||||||||||||||||||||||||||||||||||||||||||||||||||||||||||||||||||||||||||||||||||||||||||||||||||||||||||||||||||||||||||||||||||||||||||||||||||||||||||||||||||||||||||||||||||||||||||||||||||
| cf) number; DB name 1 Oncogene; http://nar.oxfordjournals.org/content/35/suppl_1/D721.long, 2 Tumor Suppressor gene; https://bioinfo.uth.edu/TSGene/, 3 Cancer Gene Census; http://www.nature.com/nrc/journal/v4/n3/abs/nrc1299.html, 4 CancerGenes; http://nar.oxfordjournals.org/content/35/suppl_1/D721.long, 5 Network of Cancer Gene; http://ncg.kcl.ac.uk/index.php, 1Therapeutic Vulnerabilities in Cancer; http://cbio.mskcc.org/cancergenomics/statius/ |
| KEGG_PURINE_METABOLISM | |
| OMIM | |
| Orphanet | |
| Disease | KEGG Disease: PDE6B |
| MedGen: PDE6B (Human Medical Genetics with Condition) | |
| ClinVar: PDE6B | |
| Phenotype | MGI: PDE6B (International Mouse Phenotyping Consortium) |
| PhenomicDB: PDE6B | |
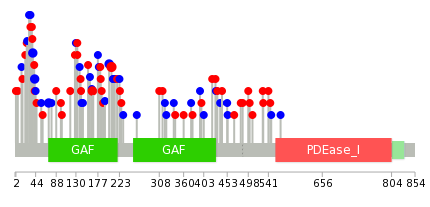
| Mutations for PDE6B |
| * Under tables are showing count per each tissue to give us broad intuition about tissue specific mutation patterns.You can go to the detailed page for each mutation database's web site. |
| - Statistics for Tissue and Mutation type | Top |
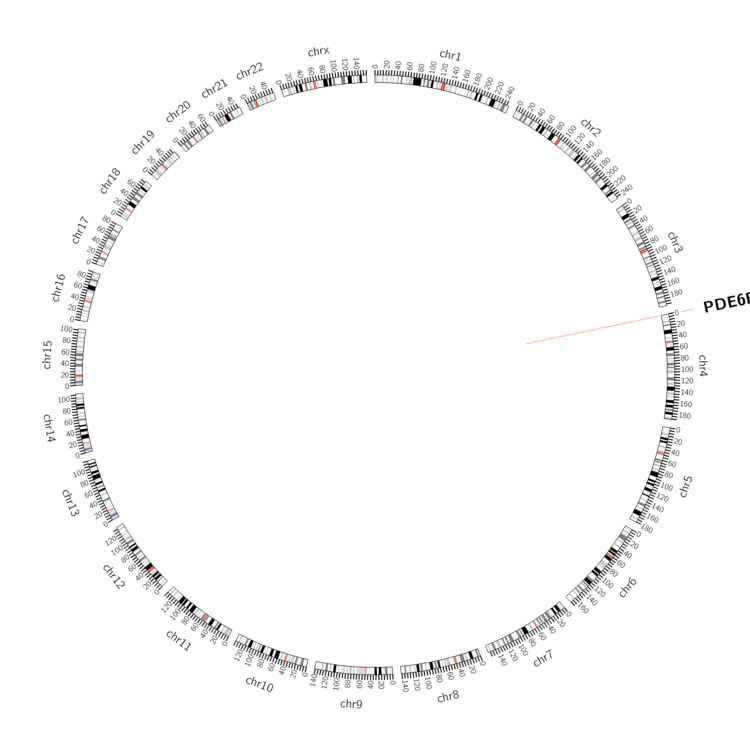 |
| - For Inter-chromosomal Variations |
| There's no inter-chromosomal structural variation. |
| - For Intra-chromosomal Variations |
| * Intra-chromosomal variantions includes 'intrachromosomal amplicon to amplicon', 'intrachromosomal amplicon to non-amplified dna', 'intrachromosomal deletion', 'intrachromosomal fold-back inversion', 'intrachromosomal inversion', 'intrachromosomal tandem duplication', 'Intrachromosomal unknown type', 'intrachromosomal with inverted orientation', 'intrachromosomal with non-inverted orientation'. |
 |
| Sample | Symbol_a | Chr_a | Start_a | End_a | Symbol_b | Chr_b | Start_b | End_b |
| NS | PDE6B | chr4 | 662370 | 662370 | PDE6B | chr4 | 663658 | 663658 |
| NS | PDE6B | chr4 | 663161 | 663161 | PDE6B | chr4 | 663588 | 663588 |
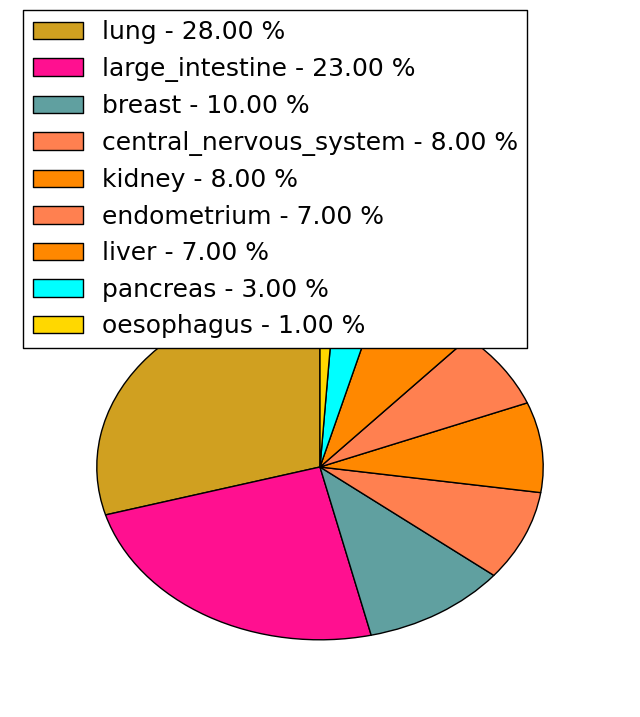
| cf) Tissue number; Tissue name (1;Breast, 2;Central_nervous_system, 3;Haematopoietic_and_lymphoid_tissue, 4;Large_intestine, 5;Liver, 6;Lung, 7;Ovary, 8;Pancreas, 9;Prostate, 10;Skin, 11;Soft_tissue, 12;Upper_aerodigestive_tract) |
| * From mRNA Sanger sequences, Chitars2.0 arranged chimeric transcripts. This table shows PDE6B related fusion information. |
| ID | Head Gene | Tail Gene | Accession | Gene_a | qStart_a | qEnd_a | Chromosome_a | tStart_a | tEnd_a | Gene_a | qStart_a | qEnd_a | Chromosome_a | tStart_a | tEnd_a |
| BM725061 | INO80 | 49 | 311 | 15 | 41291127 | 41291389 | PDE6B | 308 | 582 | 4 | 664297 | 664571 | |
| BU741962 | PDE6B | 12 | 286 | 4 | 664297 | 664571 | INO80 | 283 | 545 | 15 | 41291127 | 41291389 | |
| Top |
| Mutation type/ Tissue ID | brca | cns | cerv | endome | haematopo | kidn | Lintest | liver | lung | ns | ovary | pancre | prost | skin | stoma | thyro | urina | |||
| Total # sample | 1 | 1 | ||||||||||||||||||
| GAIN (# sample) | 1 | |||||||||||||||||||
| LOSS (# sample) | 1 |
| cf) Tissue ID; Tissue type (1; Breast, 2; Central_nervous_system, 3; Cervix, 4; Endometrium, 5; Haematopoietic_and_lymphoid_tissue, 6; Kidney, 7; Large_intestine, 8; Liver, 9; Lung, 10; NS, 11; Ovary, 12; Pancreas, 13; Prostate, 14; Skin, 15; Stomach, 16; Thyroid, 17; Urinary_tract) |
| Top |
|
 |
| Top |
| Stat. for Non-Synonymous SNVs (# total SNVs=56) | (# total SNVs=31) |
 | 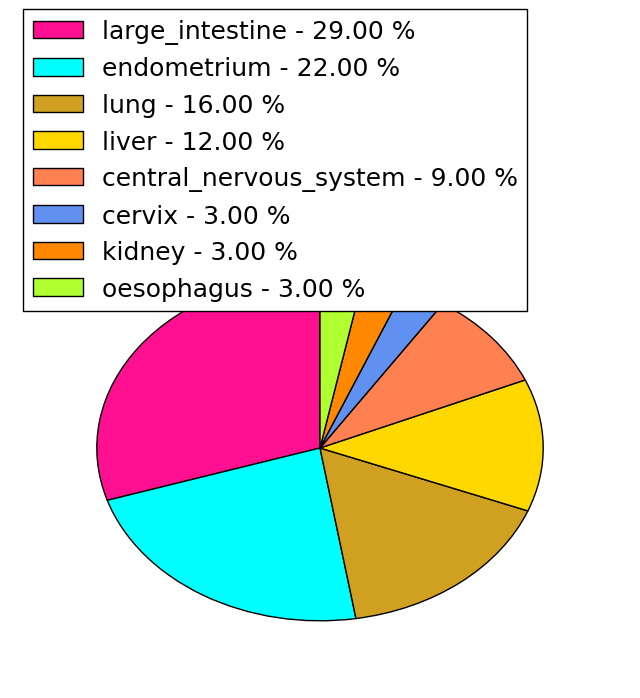 |
(# total SNVs=1) | (# total SNVs=1) |
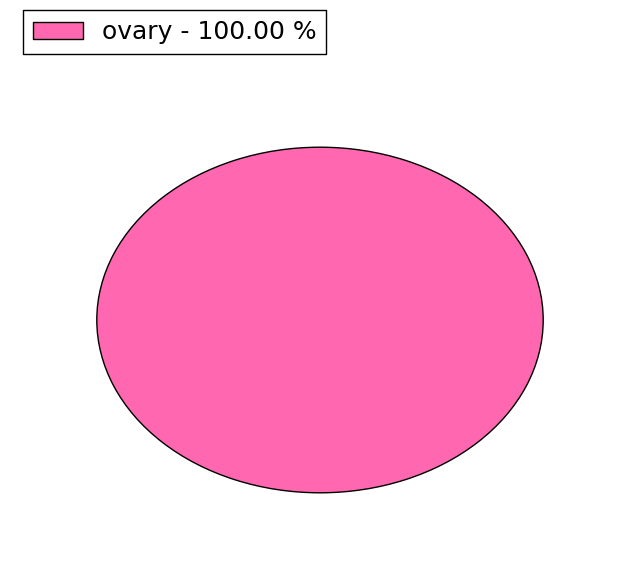 | 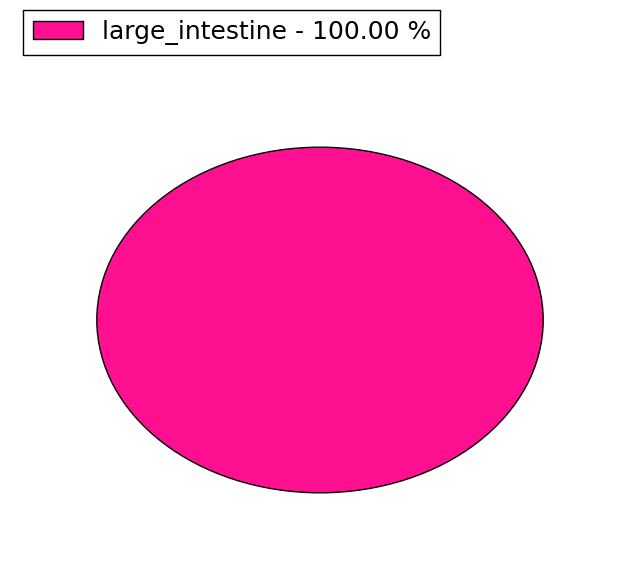 |
| Top |
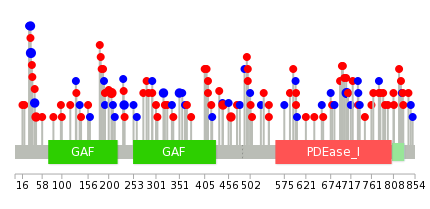
| * When you move the cursor on each content, you can see more deailed mutation information on the Tooltip. Those are primary_site,primary_histology,mutation(aa),pubmedID. |
| GRCh37 position | Mutation(aa) | Unique sampleID count |
| chr4:628613-628613 | p.E206K | 3 |
| chr4:658005-658005 | p.I708I | 3 |
| chr4:619517-619517 | p.A34A | 3 |
| chr4:648636-648636 | p.I317I | 2 |
| chr4:651263-651263 | p.D461N | 2 |
| chr4:619541-619541 | p.P42P | 2 |
| chr4:619549-619549 | p.D45G | 2 |
| chr4:649789-649789 | p.S351S | 2 |
| chr4:654278-654278 | p.T497S | 2 |
| chr4:629746-629746 | p.T233T | 2 |
| Top |
|
 |
| Point Mutation/ Tissue ID | 1 | 2 | 3 | 4 | 5 | 6 | 7 | 8 | 9 | 10 | 11 | 12 | 13 | 14 | 15 | 16 | 17 | 18 | 19 | 20 |
| # sample | 2 | 2 | 1 | 11 | 2 | 1 | 3 | 2 | 9 | 3 | 1 | 22 | 11 | 9 | ||||||
| # mutation | 2 | 2 | 1 | 12 | 2 | 1 | 3 | 2 | 9 | 3 | 1 | 25 | 13 | 10 | ||||||
| nonsynonymous SNV | 1 | 2 | 8 | 2 | 2 | 2 | 6 | 2 | 11 | 10 | 4 | |||||||||
| synonymous SNV | 1 | 1 | 4 | 1 | 1 | 3 | 1 | 1 | 14 | 3 | 6 |
| cf) Tissue ID; Tissue type (1; BLCA[Bladder Urothelial Carcinoma], 2; BRCA[Breast invasive carcinoma], 3; CESC[Cervical squamous cell carcinoma and endocervical adenocarcinoma], 4; COAD[Colon adenocarcinoma], 5; GBM[Glioblastoma multiforme], 6; Glioma Low Grade, 7; HNSC[Head and Neck squamous cell carcinoma], 8; KICH[Kidney Chromophobe], 9; KIRC[Kidney renal clear cell carcinoma], 10; KIRP[Kidney renal papillary cell carcinoma], 11; LAML[Acute Myeloid Leukemia], 12; LUAD[Lung adenocarcinoma], 13; LUSC[Lung squamous cell carcinoma], 14; OV[Ovarian serous cystadenocarcinoma ], 15; PAAD[Pancreatic adenocarcinoma], 16; PRAD[Prostate adenocarcinoma], 17; SKCM[Skin Cutaneous Melanoma], 18:STAD[Stomach adenocarcinoma], 19:THCA[Thyroid carcinoma], 20:UCEC[Uterine Corpus Endometrial Carcinoma]) |
| Top |
| * We represented just top 10 SNVs. When you move the cursor on each content, you can see more deailed mutation information on the Tooltip. Those are primary_site, primary_histology, mutation(aa), pubmedID. |
| Genomic Position | Mutation(aa) | Unique sampleID count |
| chr4:628613 | p.E206K,PDE6B | 3 |
| chr4:619541 | p.R165H,PDE6B | 2 |
| chr4:652779 | p.I38I,PDE6B | 2 |
| chr4:648636 | p.C201C,PDE6B | 2 |
| chr4:651213 | p.S72S,PDE6B | 2 |
| chr4:649789 | p.P42P,PDE6B | 2 |
| chr4:650045 | p.C231C,PDE6B | 1 |
| chr4:657980 | p.E133K,PDE6B | 1 |
| chr4:619536 | p.F227L,PDE6B | 1 |
| chr4:651250 | p.A432V,PDE6B | 1 |
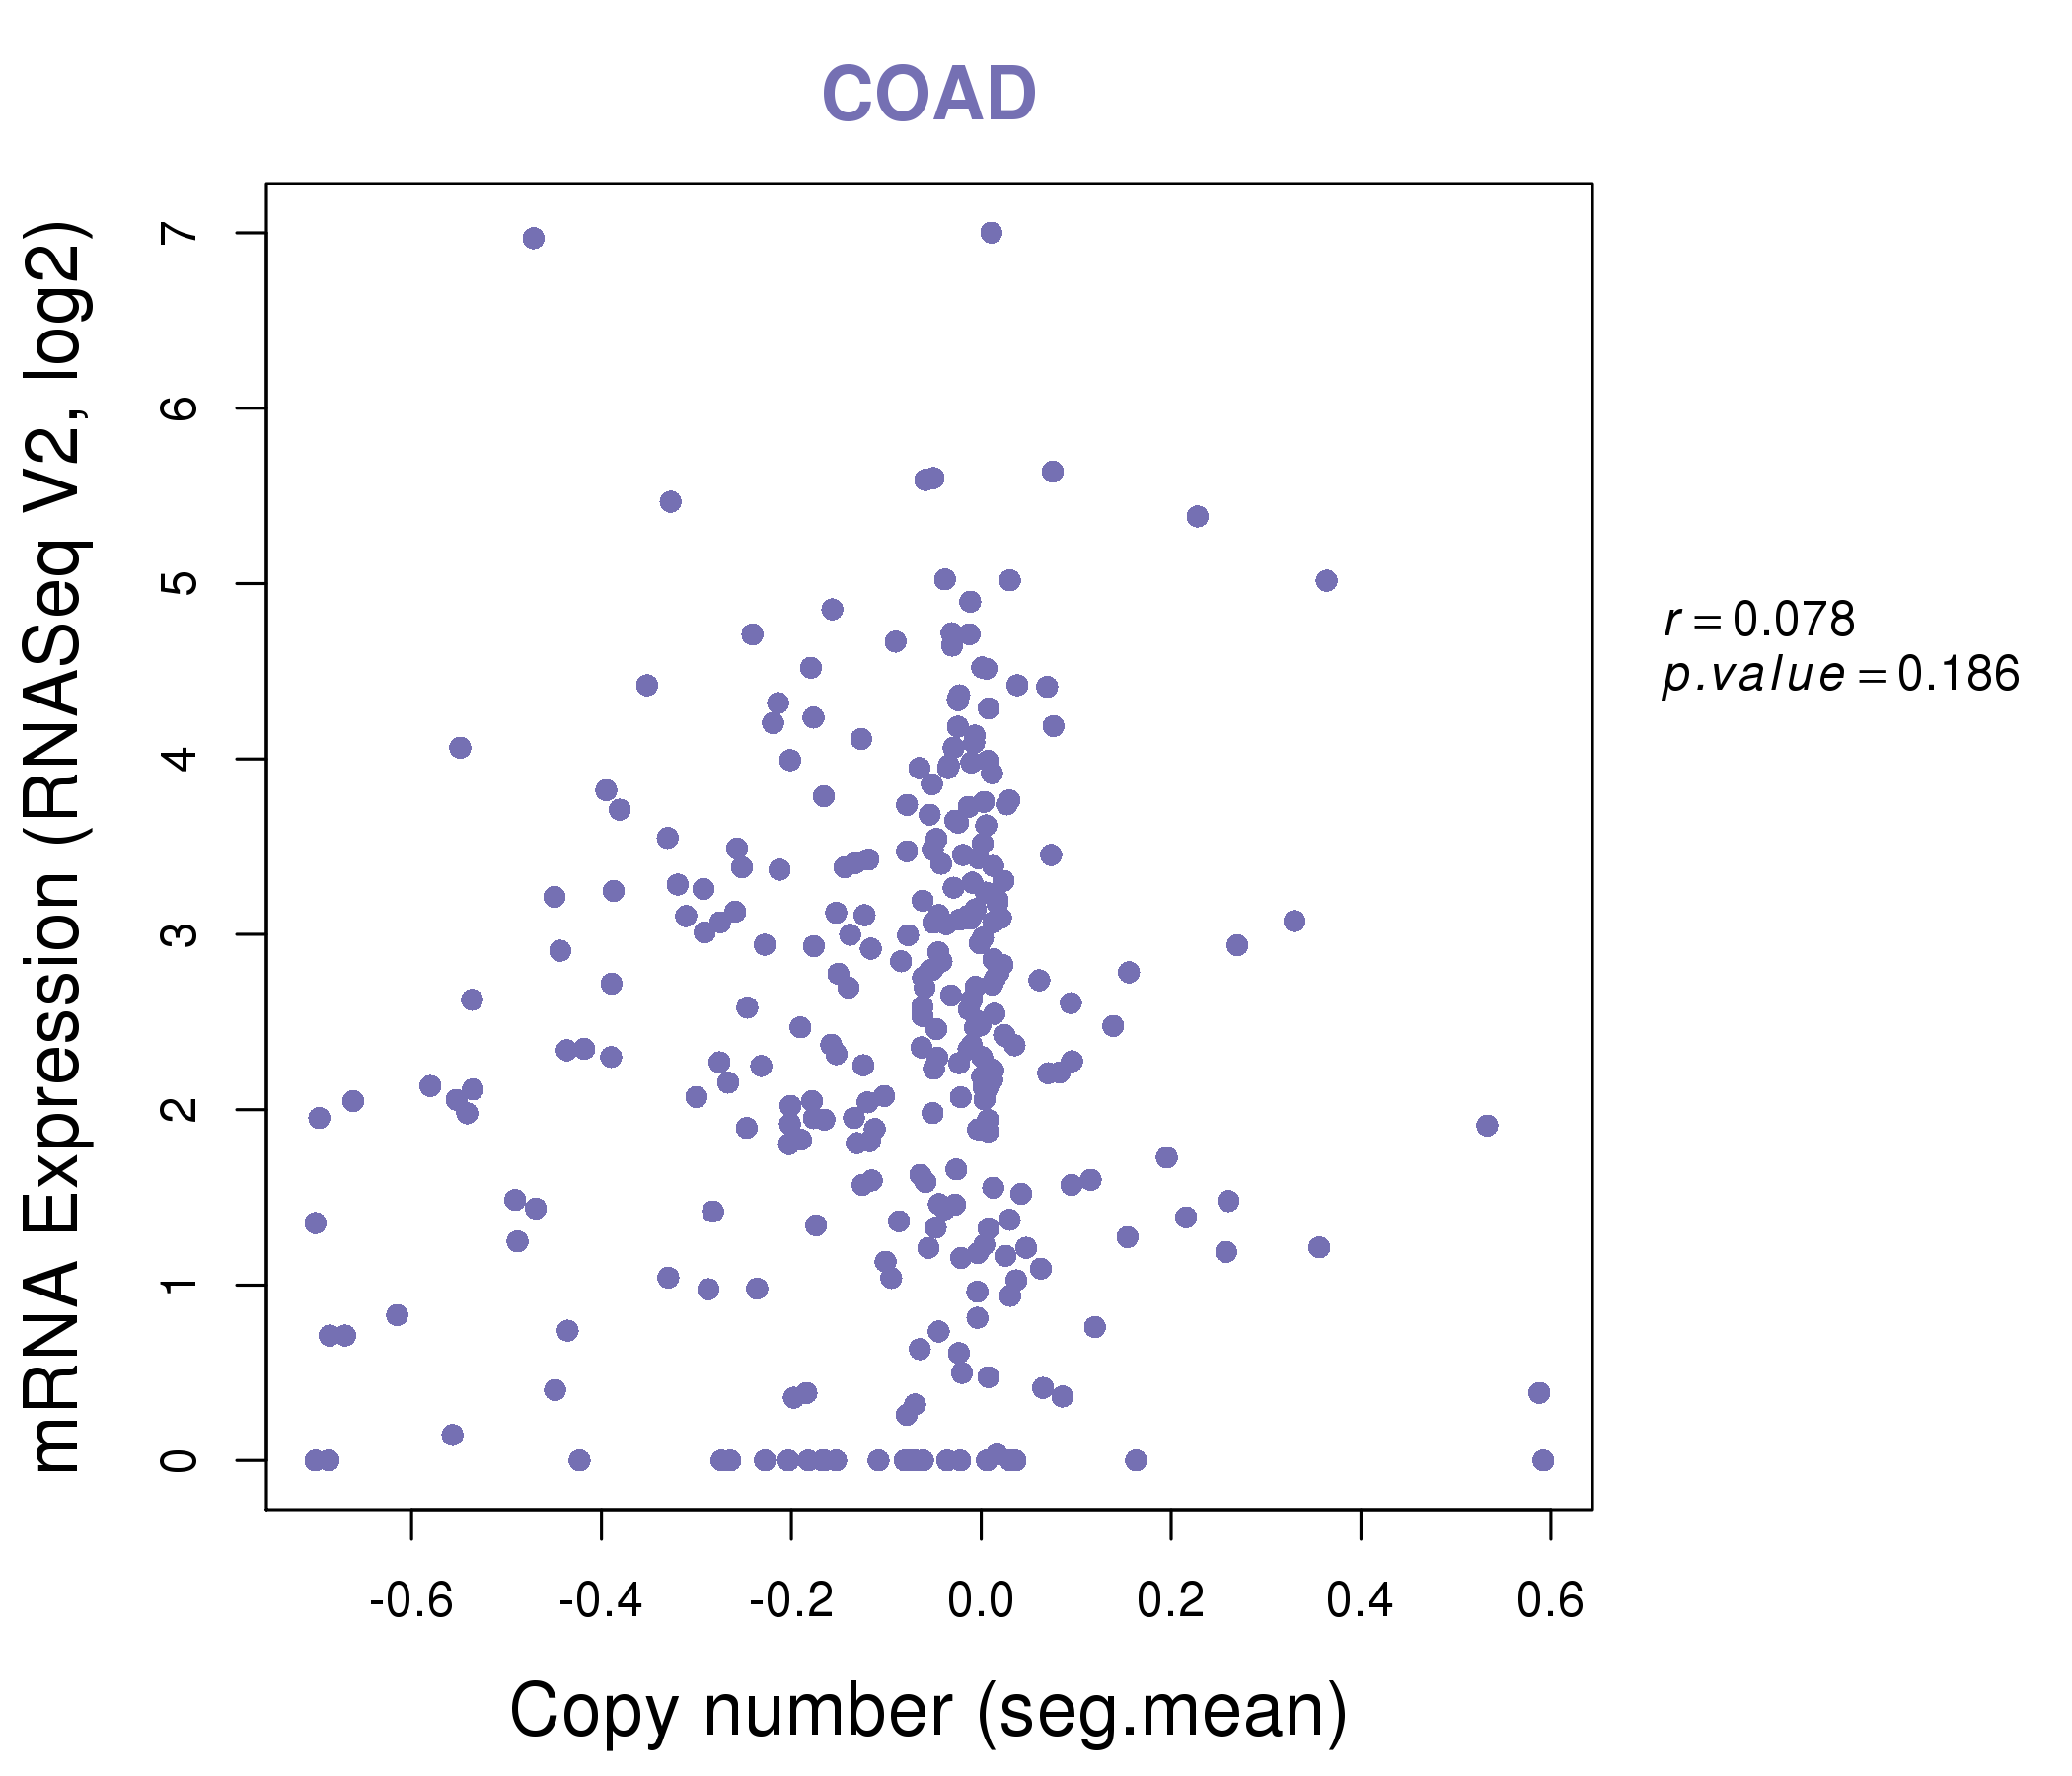
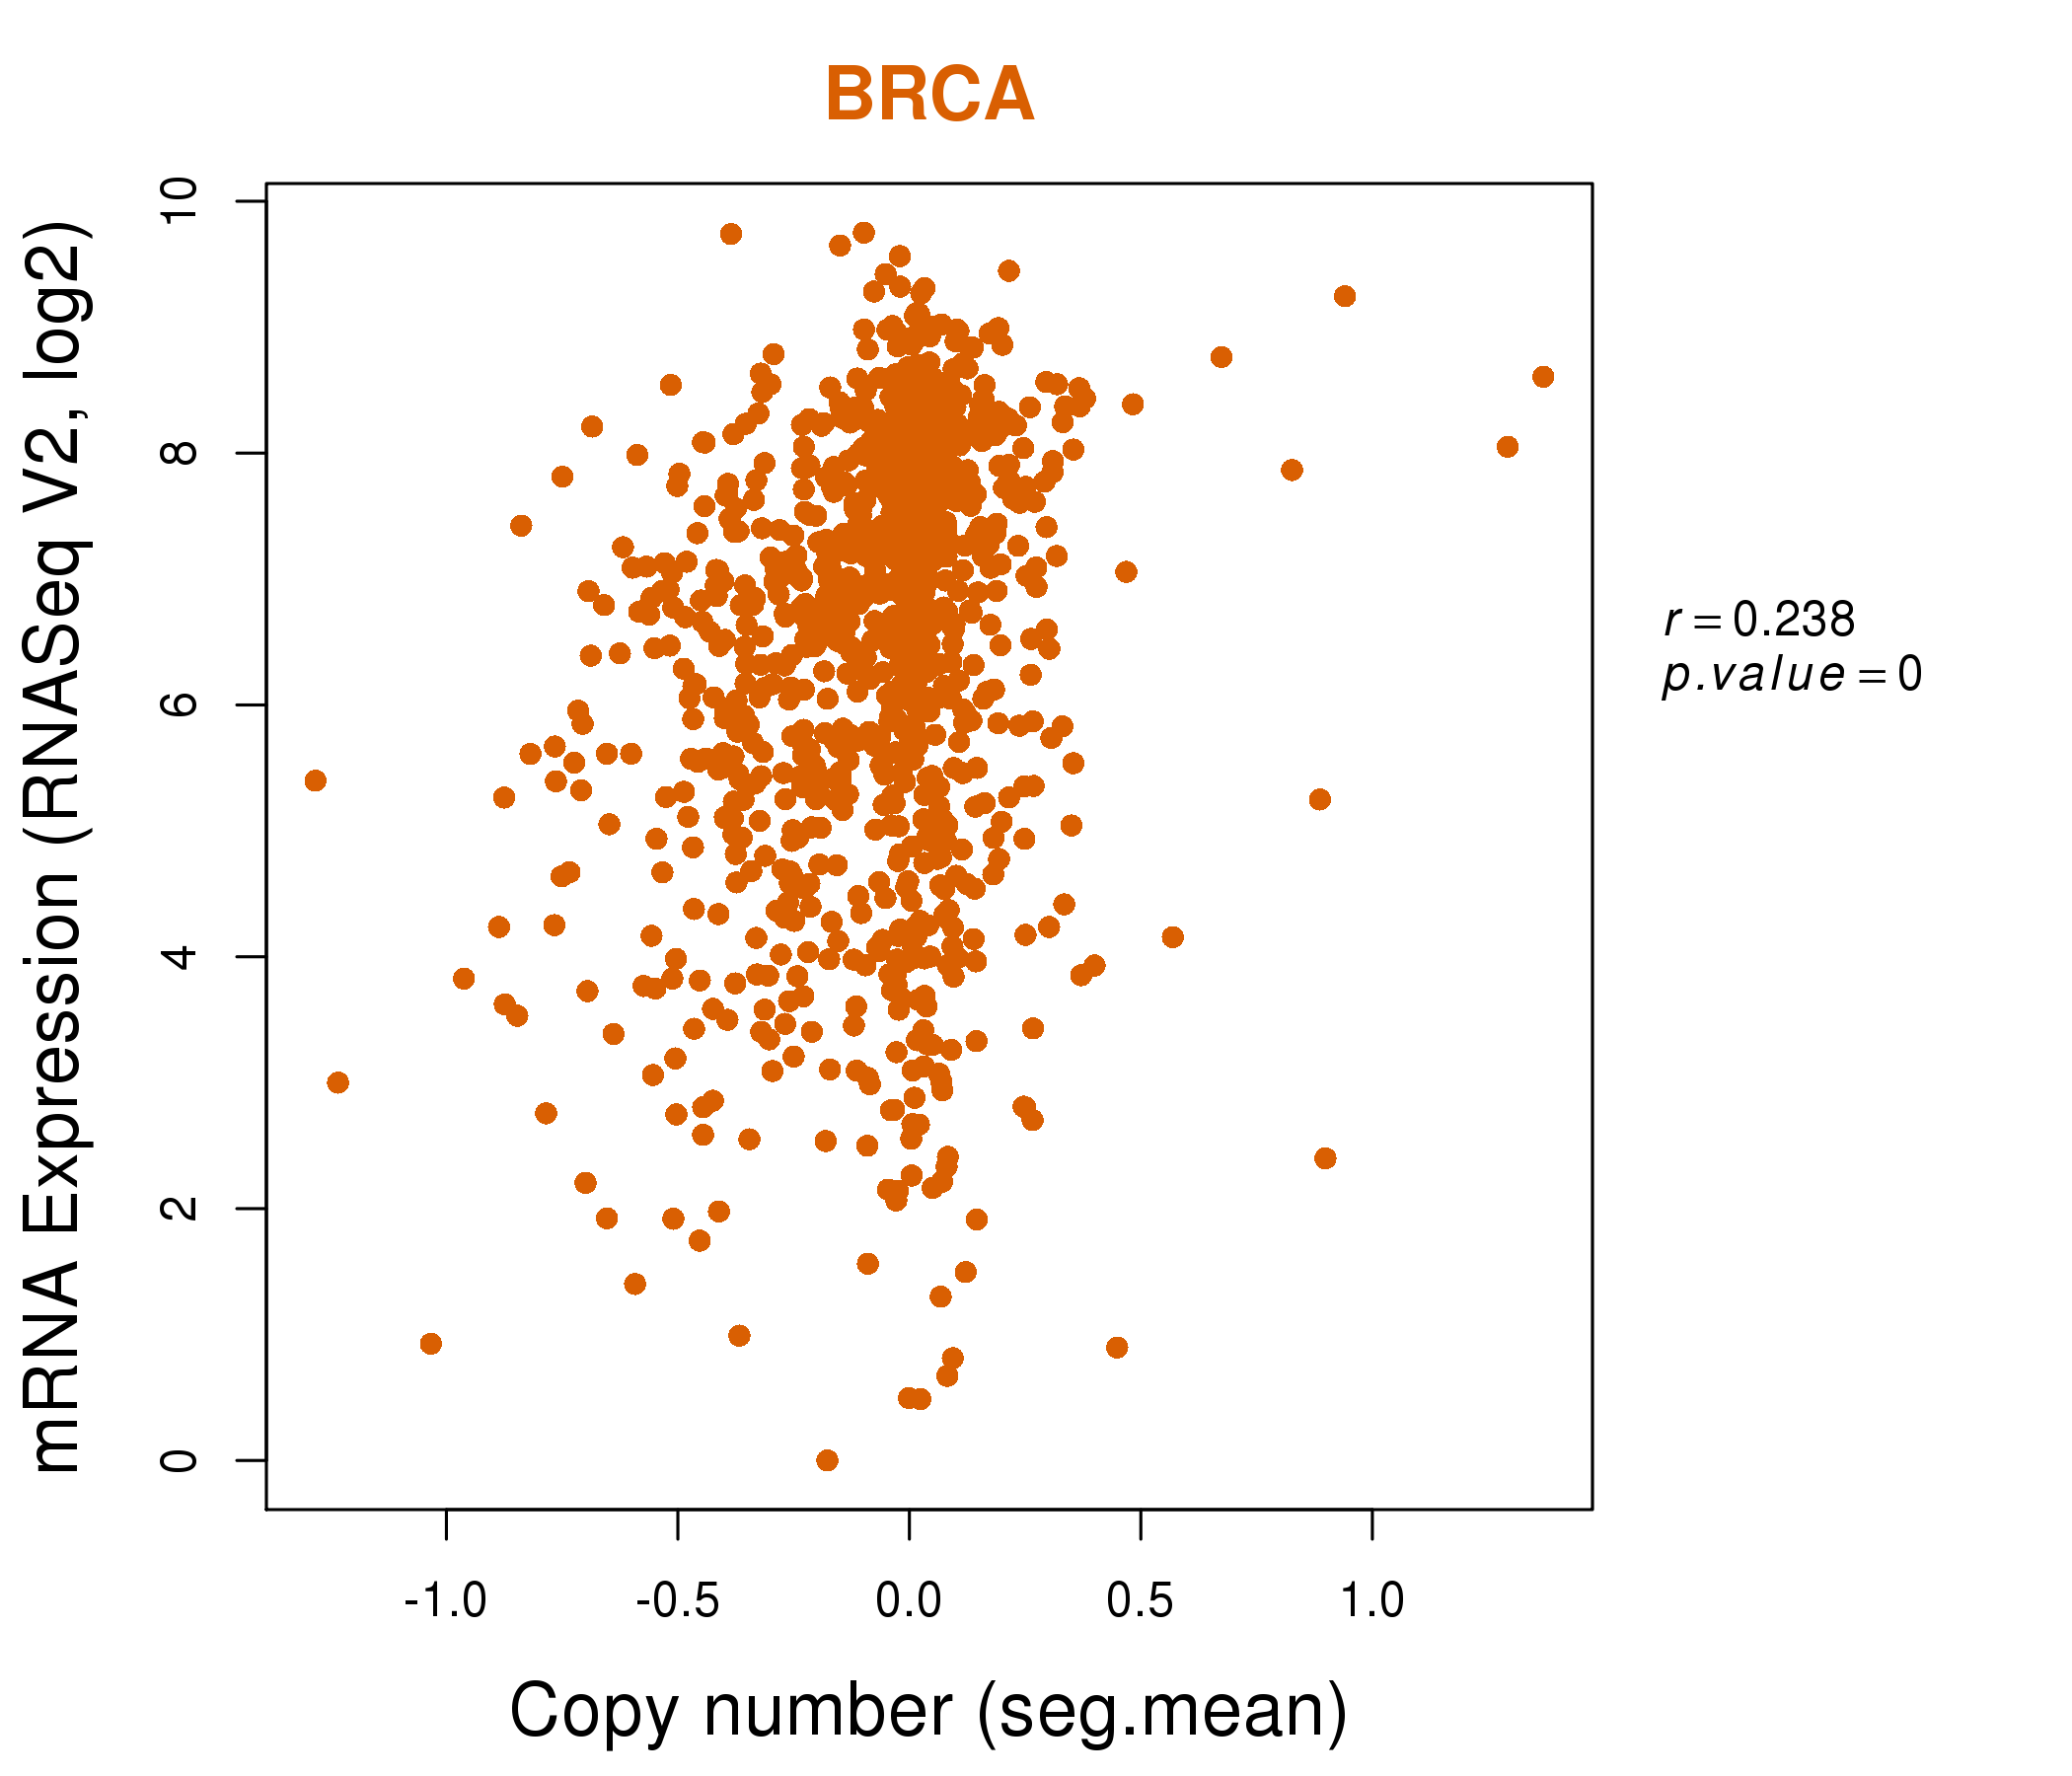
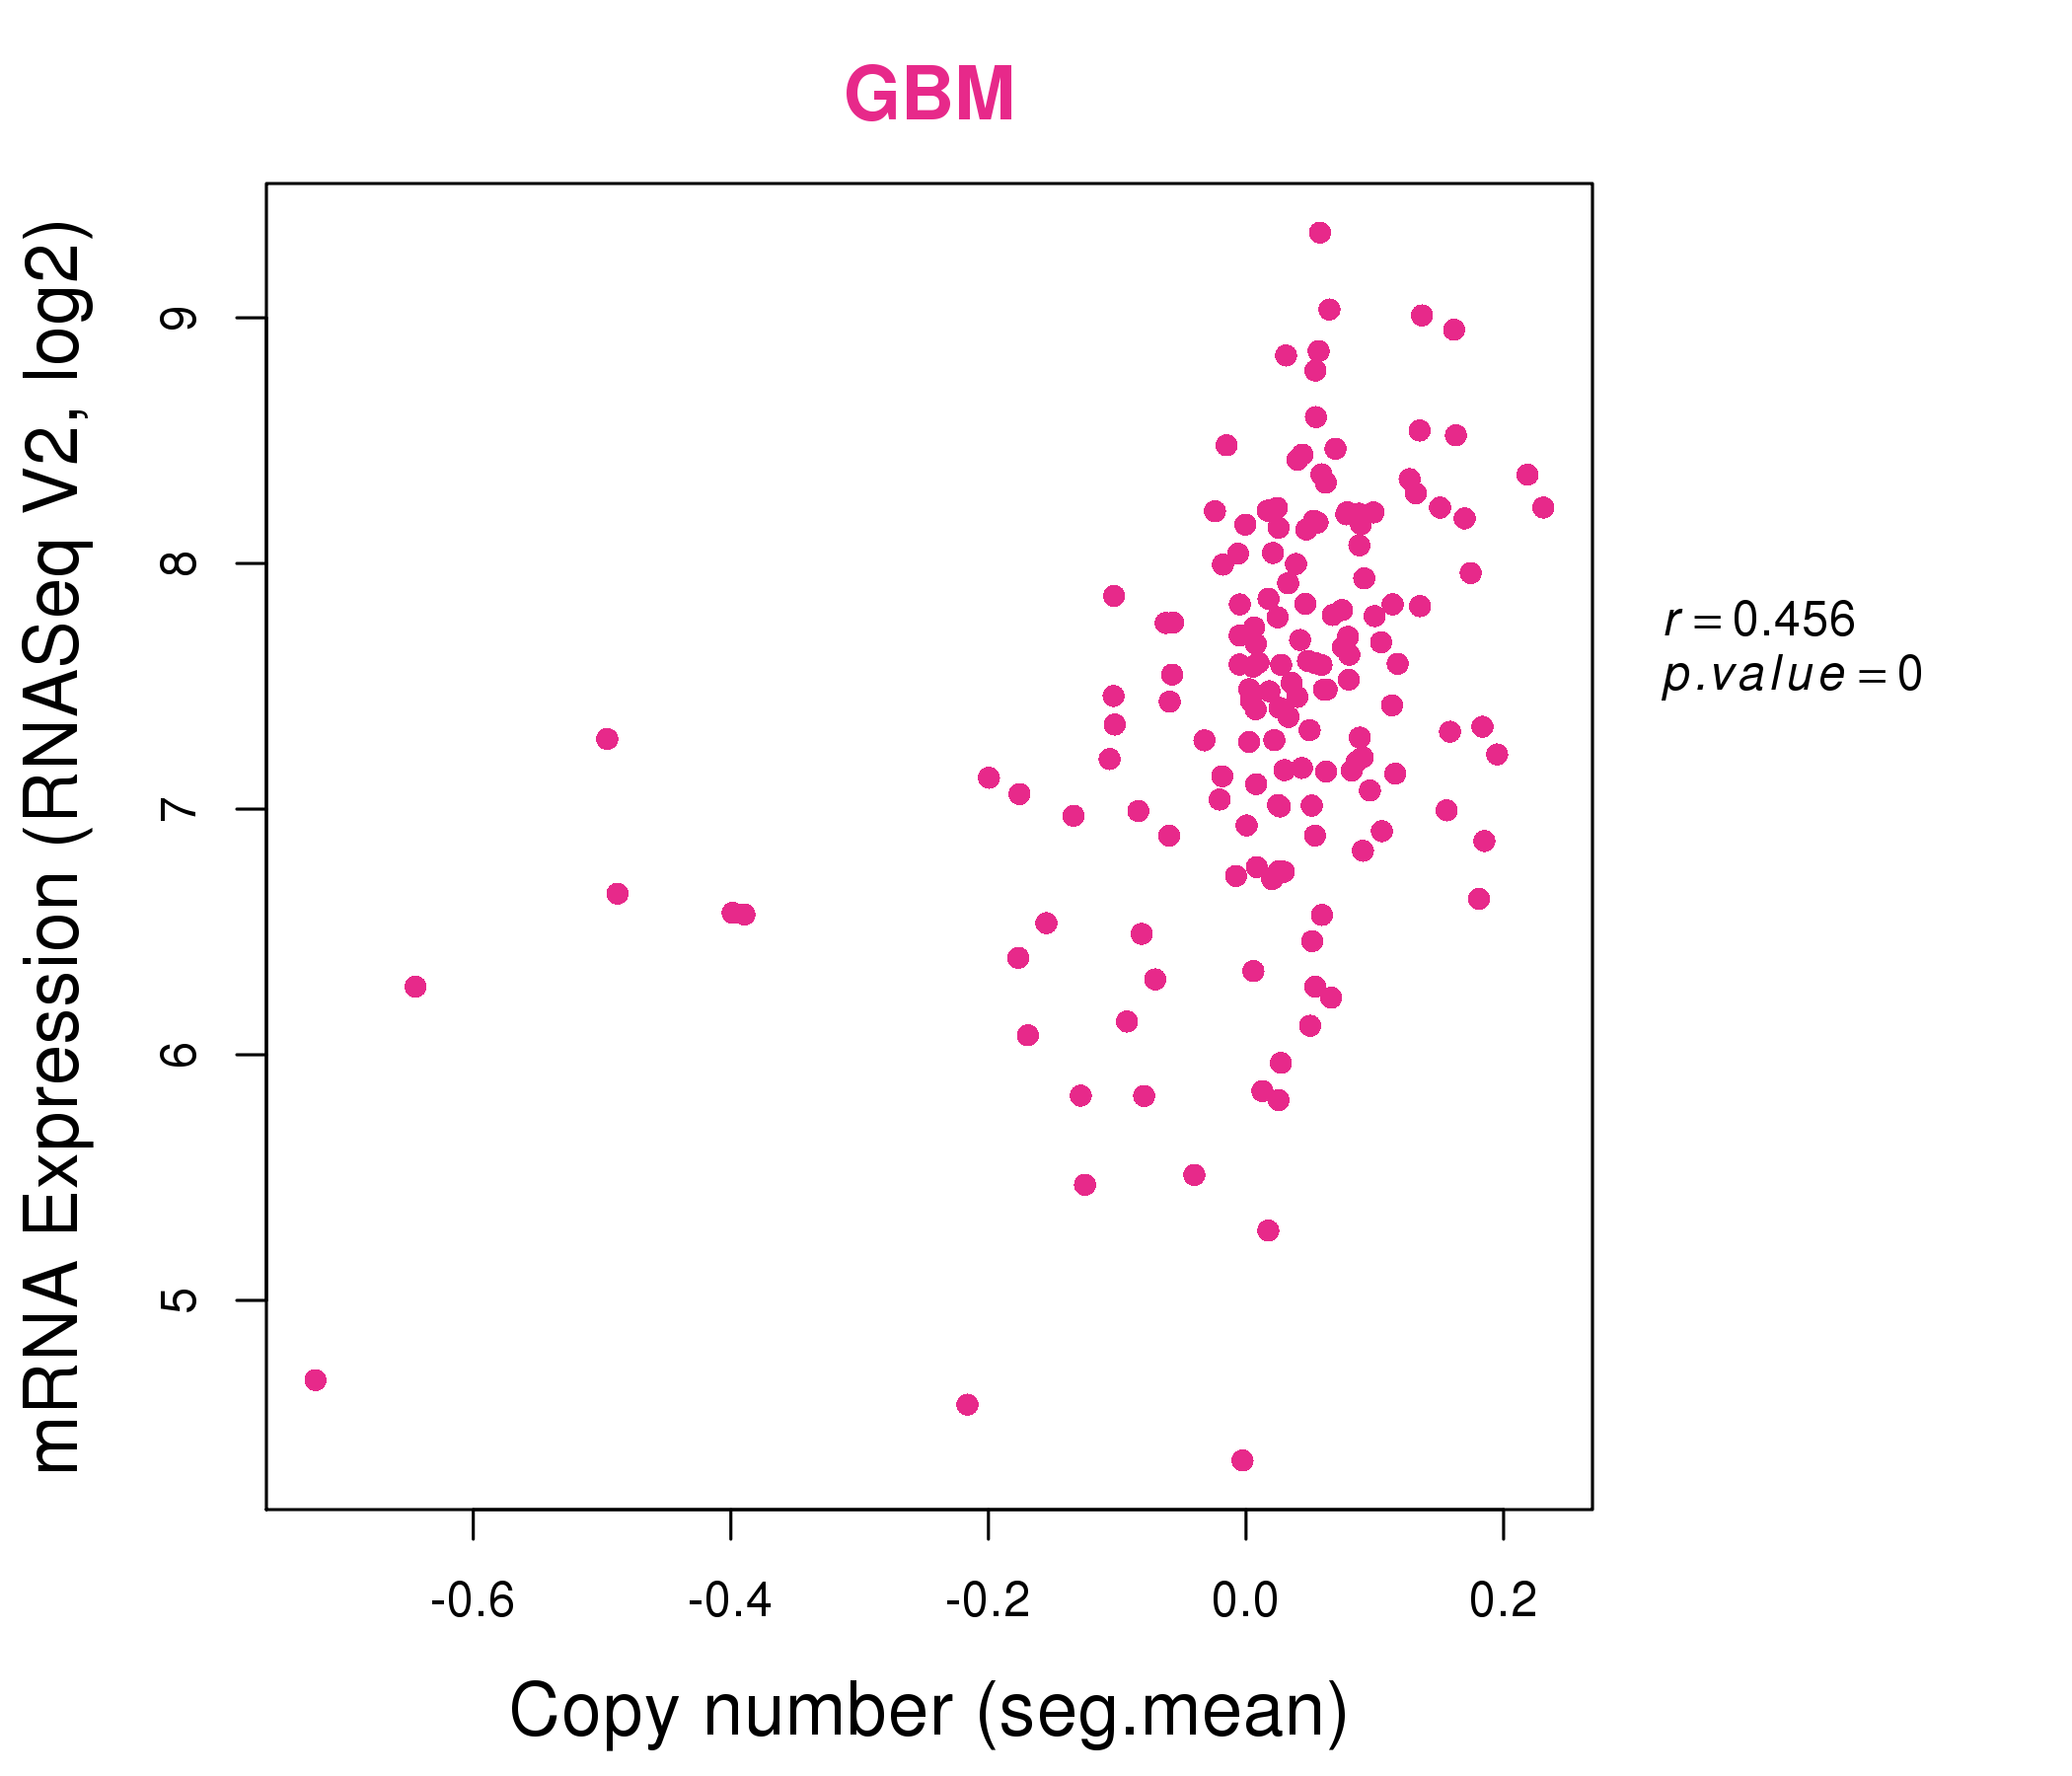
| * Copy number data were extracted from TCGA using R package TCGA-Assembler. The URLs of all public data files on TCGA DCC data server were gathered on Jan-05-2015. Function ProcessCNAData in TCGA-Assembler package was used to obtain gene-level copy number value which is calculated as the average copy number of the genomic region of a gene. |
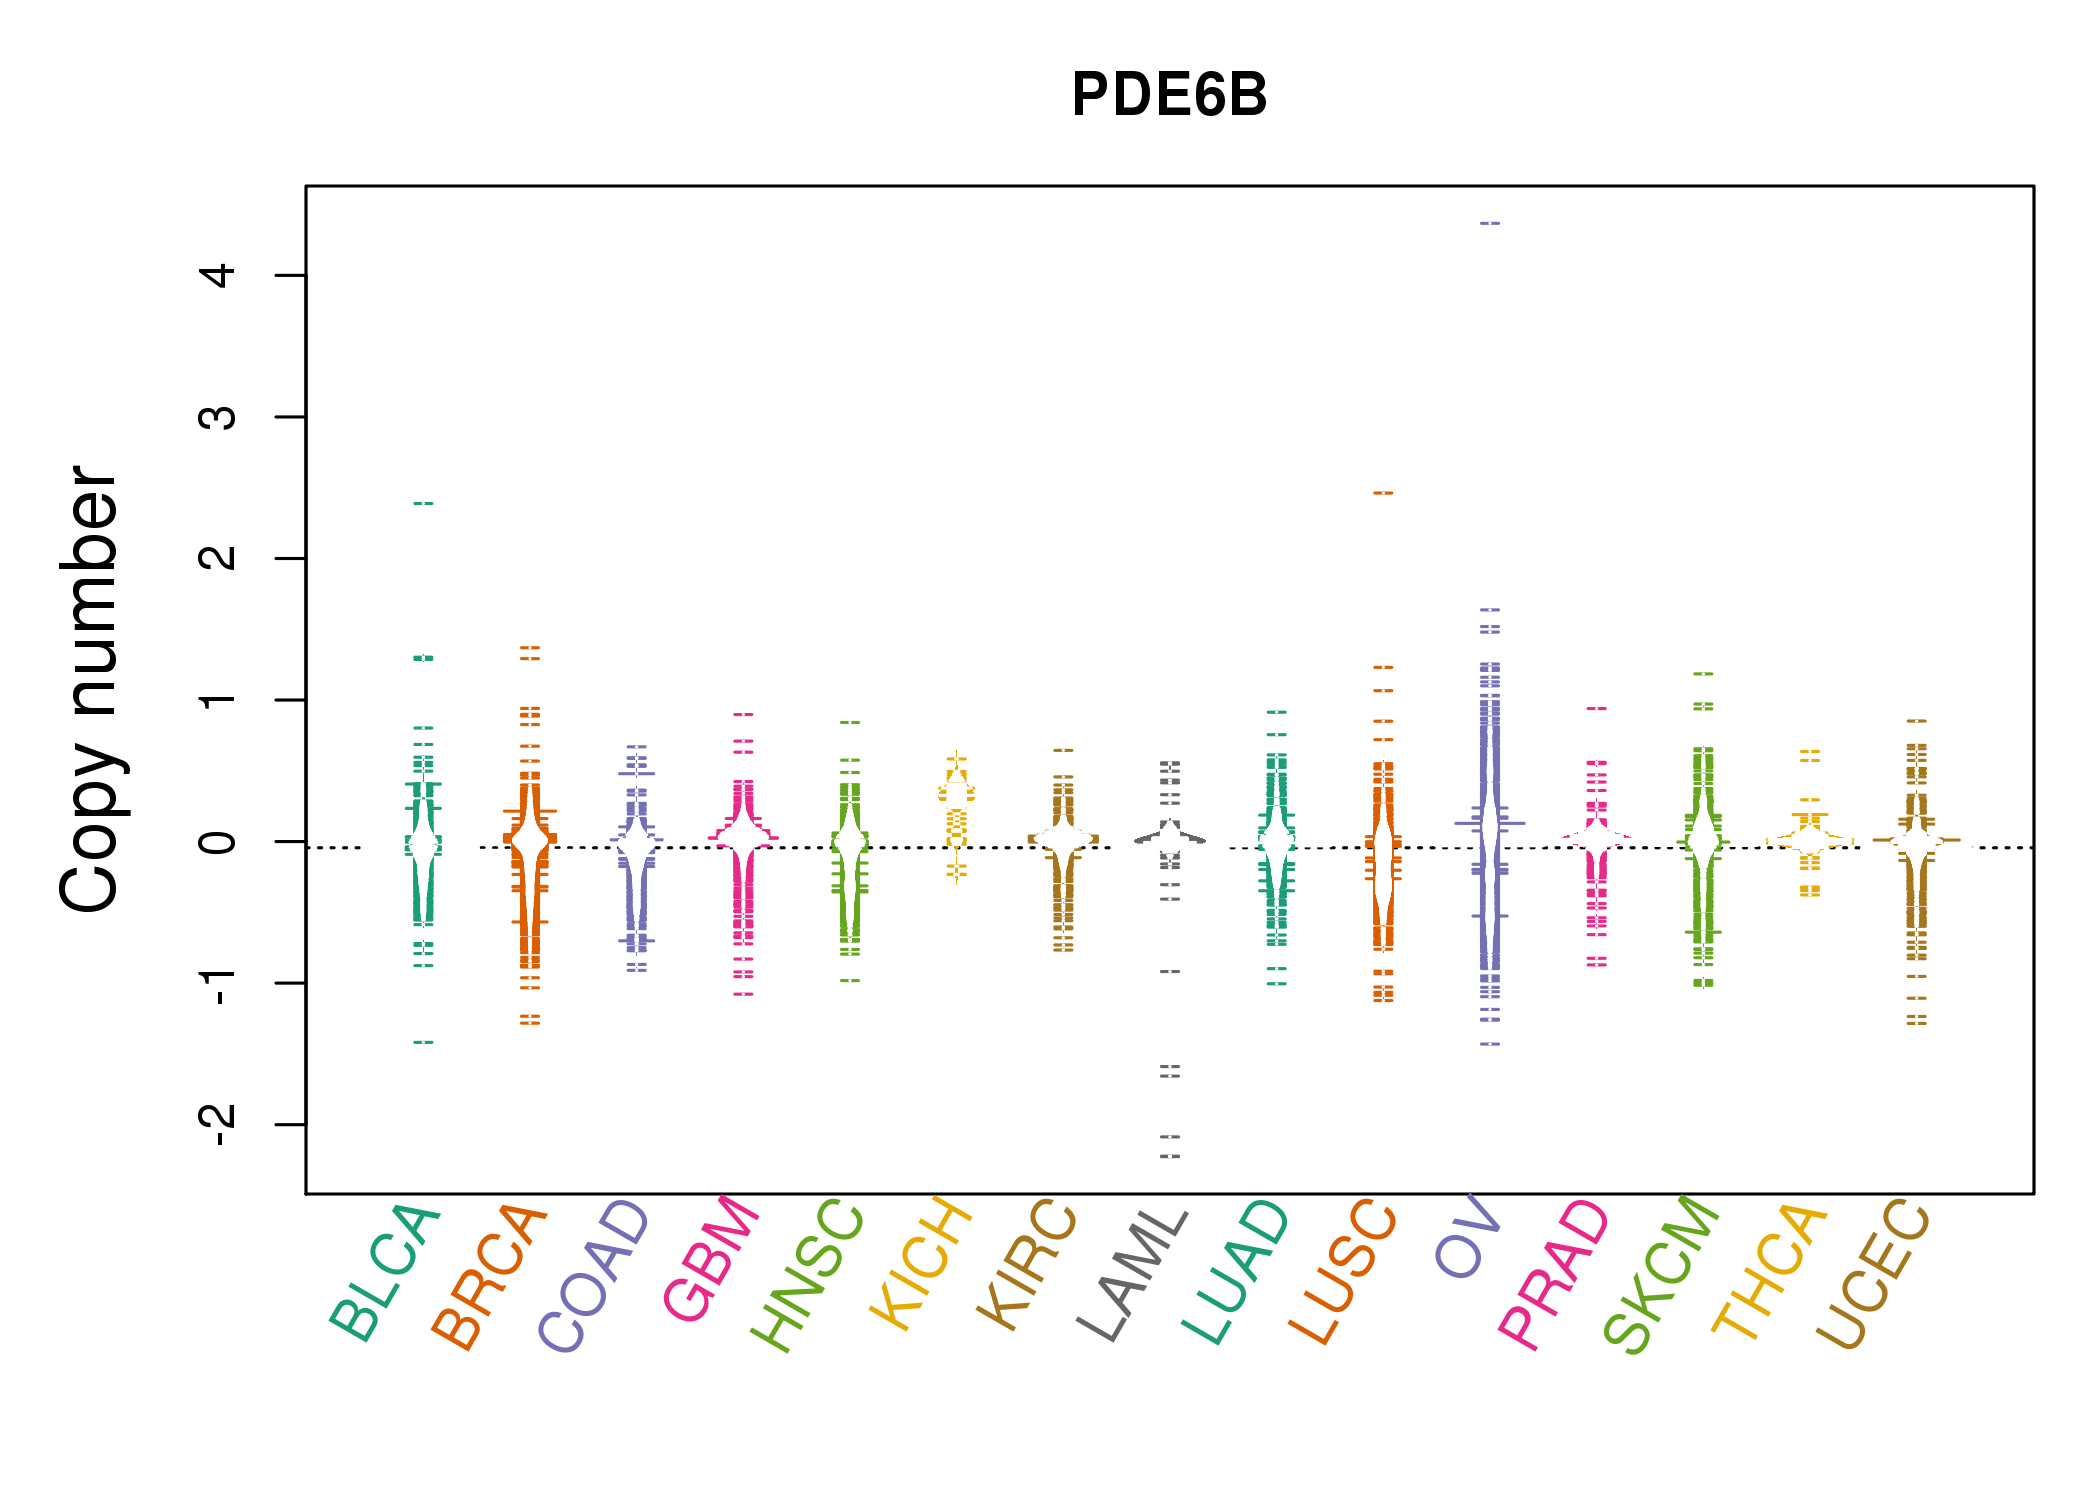 |
| cf) Tissue ID[Tissue type]: BLCA[Bladder Urothelial Carcinoma], BRCA[Breast invasive carcinoma], CESC[Cervical squamous cell carcinoma and endocervical adenocarcinoma], COAD[Colon adenocarcinoma], GBM[Glioblastoma multiforme], Glioma Low Grade, HNSC[Head and Neck squamous cell carcinoma], KICH[Kidney Chromophobe], KIRC[Kidney renal clear cell carcinoma], KIRP[Kidney renal papillary cell carcinoma], LAML[Acute Myeloid Leukemia], LUAD[Lung adenocarcinoma], LUSC[Lung squamous cell carcinoma], OV[Ovarian serous cystadenocarcinoma ], PAAD[Pancreatic adenocarcinoma], PRAD[Prostate adenocarcinoma], SKCM[Skin Cutaneous Melanoma], STAD[Stomach adenocarcinoma], THCA[Thyroid carcinoma], UCEC[Uterine Corpus Endometrial Carcinoma] |
| Top |
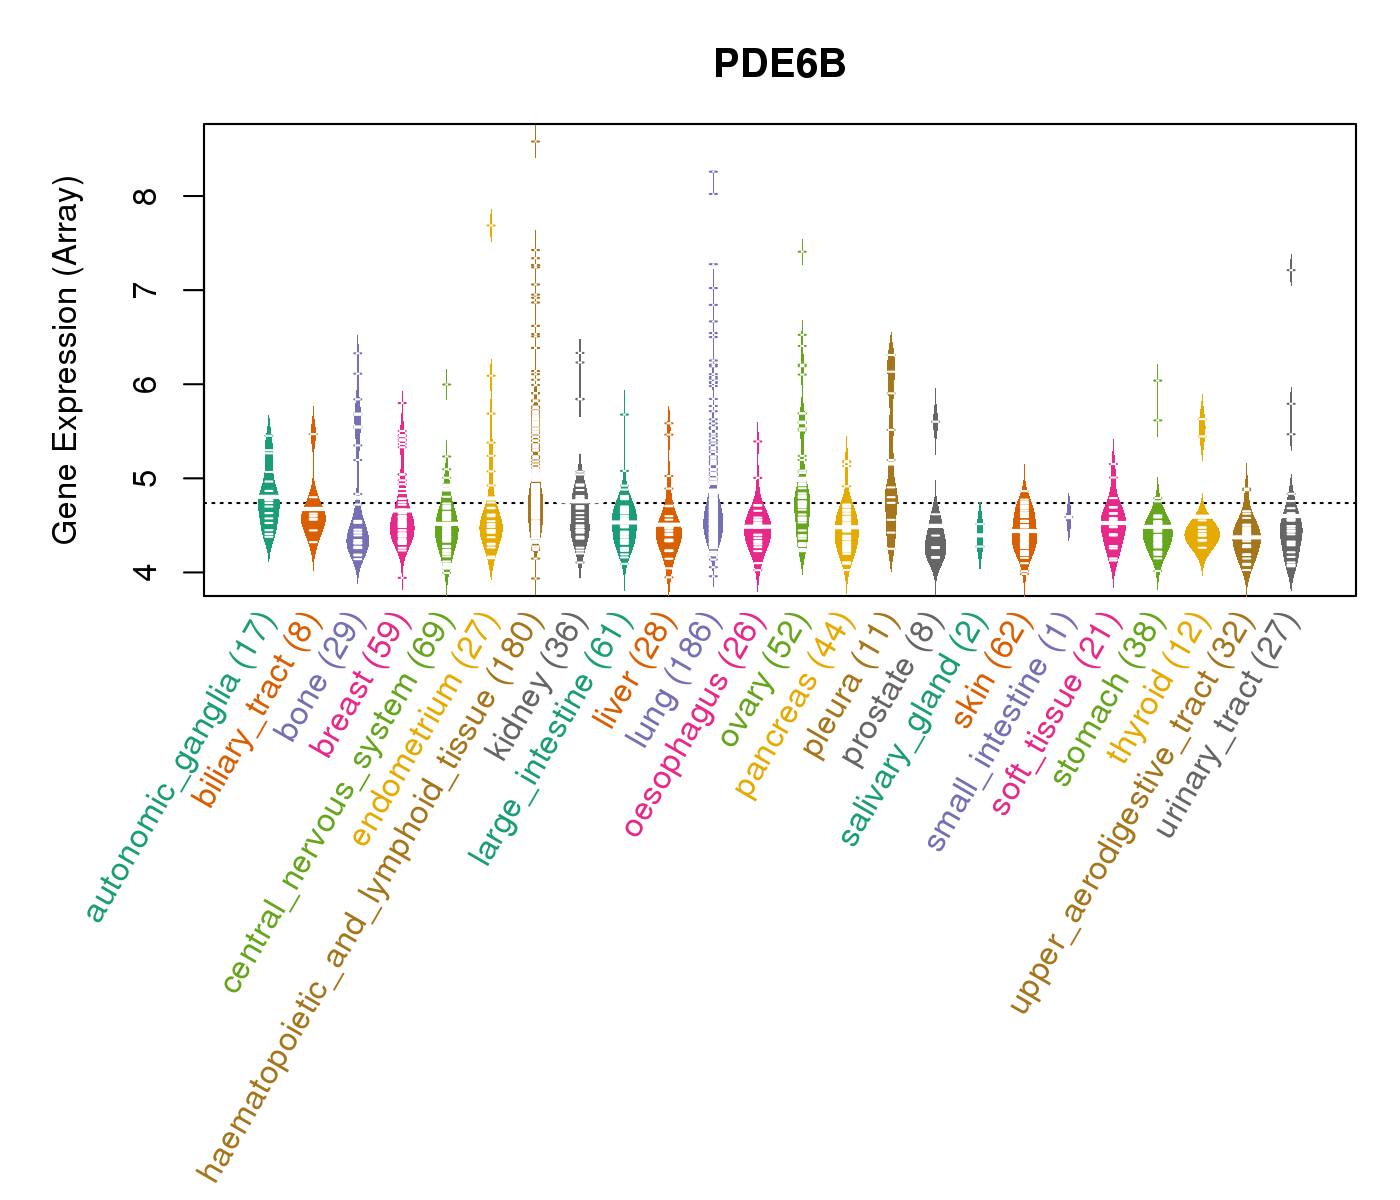
| Gene Expression for PDE6B |
| * CCLE gene expression data were extracted from CCLE_Expression_Entrez_2012-10-18.res: Gene-centric RMA-normalized mRNA expression data. |
 |
| * Normalized gene expression data of RNASeqV2 was extracted from TCGA using R package TCGA-Assembler. The URLs of all public data files on TCGA DCC data server were gathered at Jan-05-2015. Only eight cancer types have enough normal control samples for differential expression analysis. (t test, adjusted p<0.05 (using Benjamini-Hochberg FDR)) |
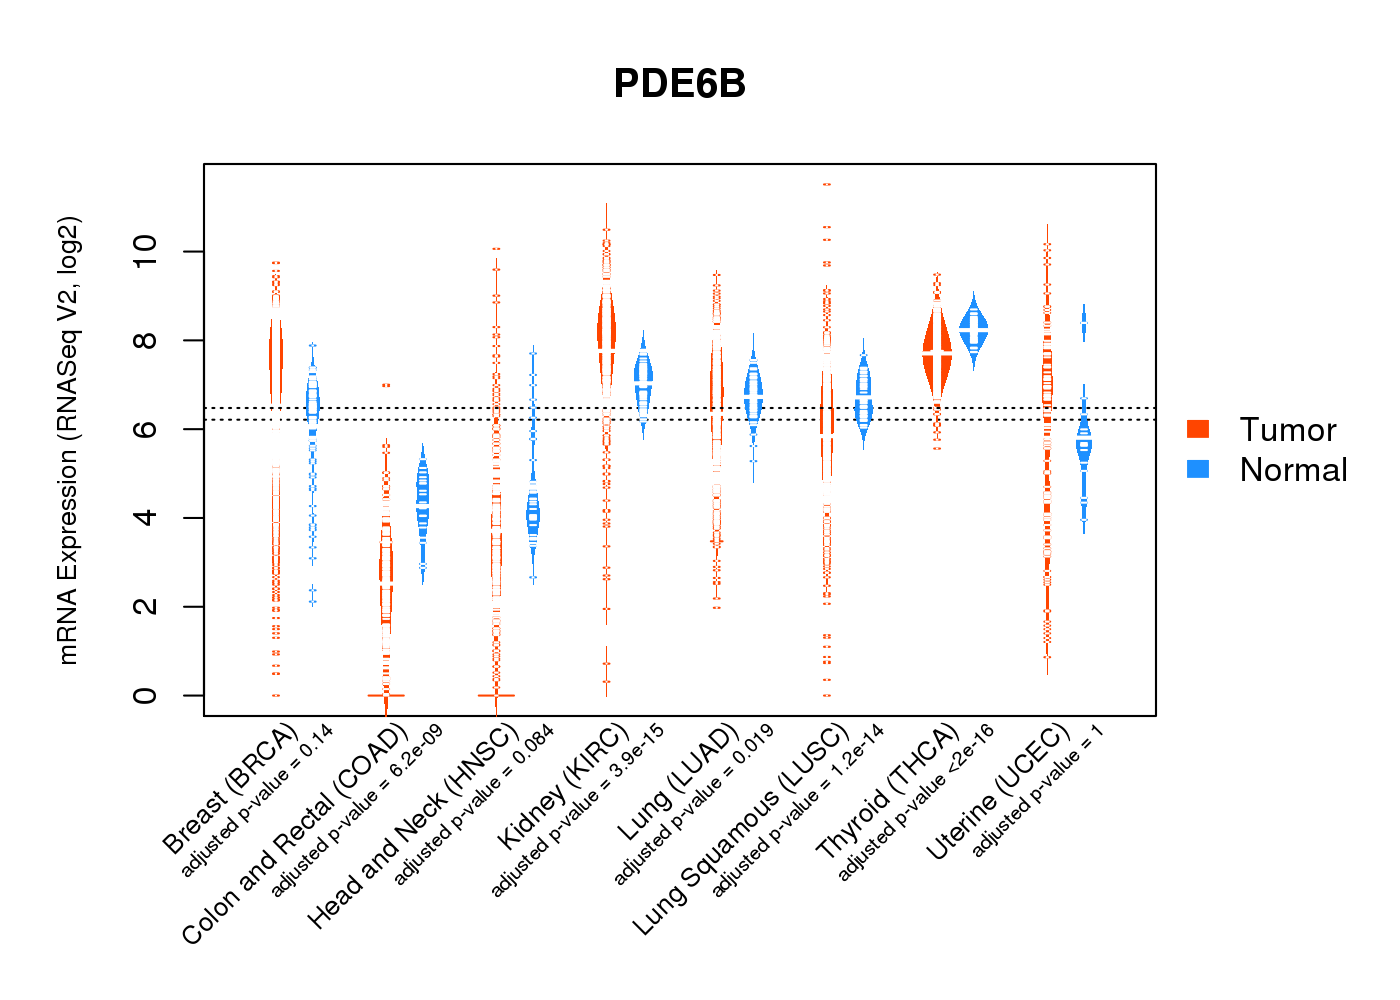 |
| Top |
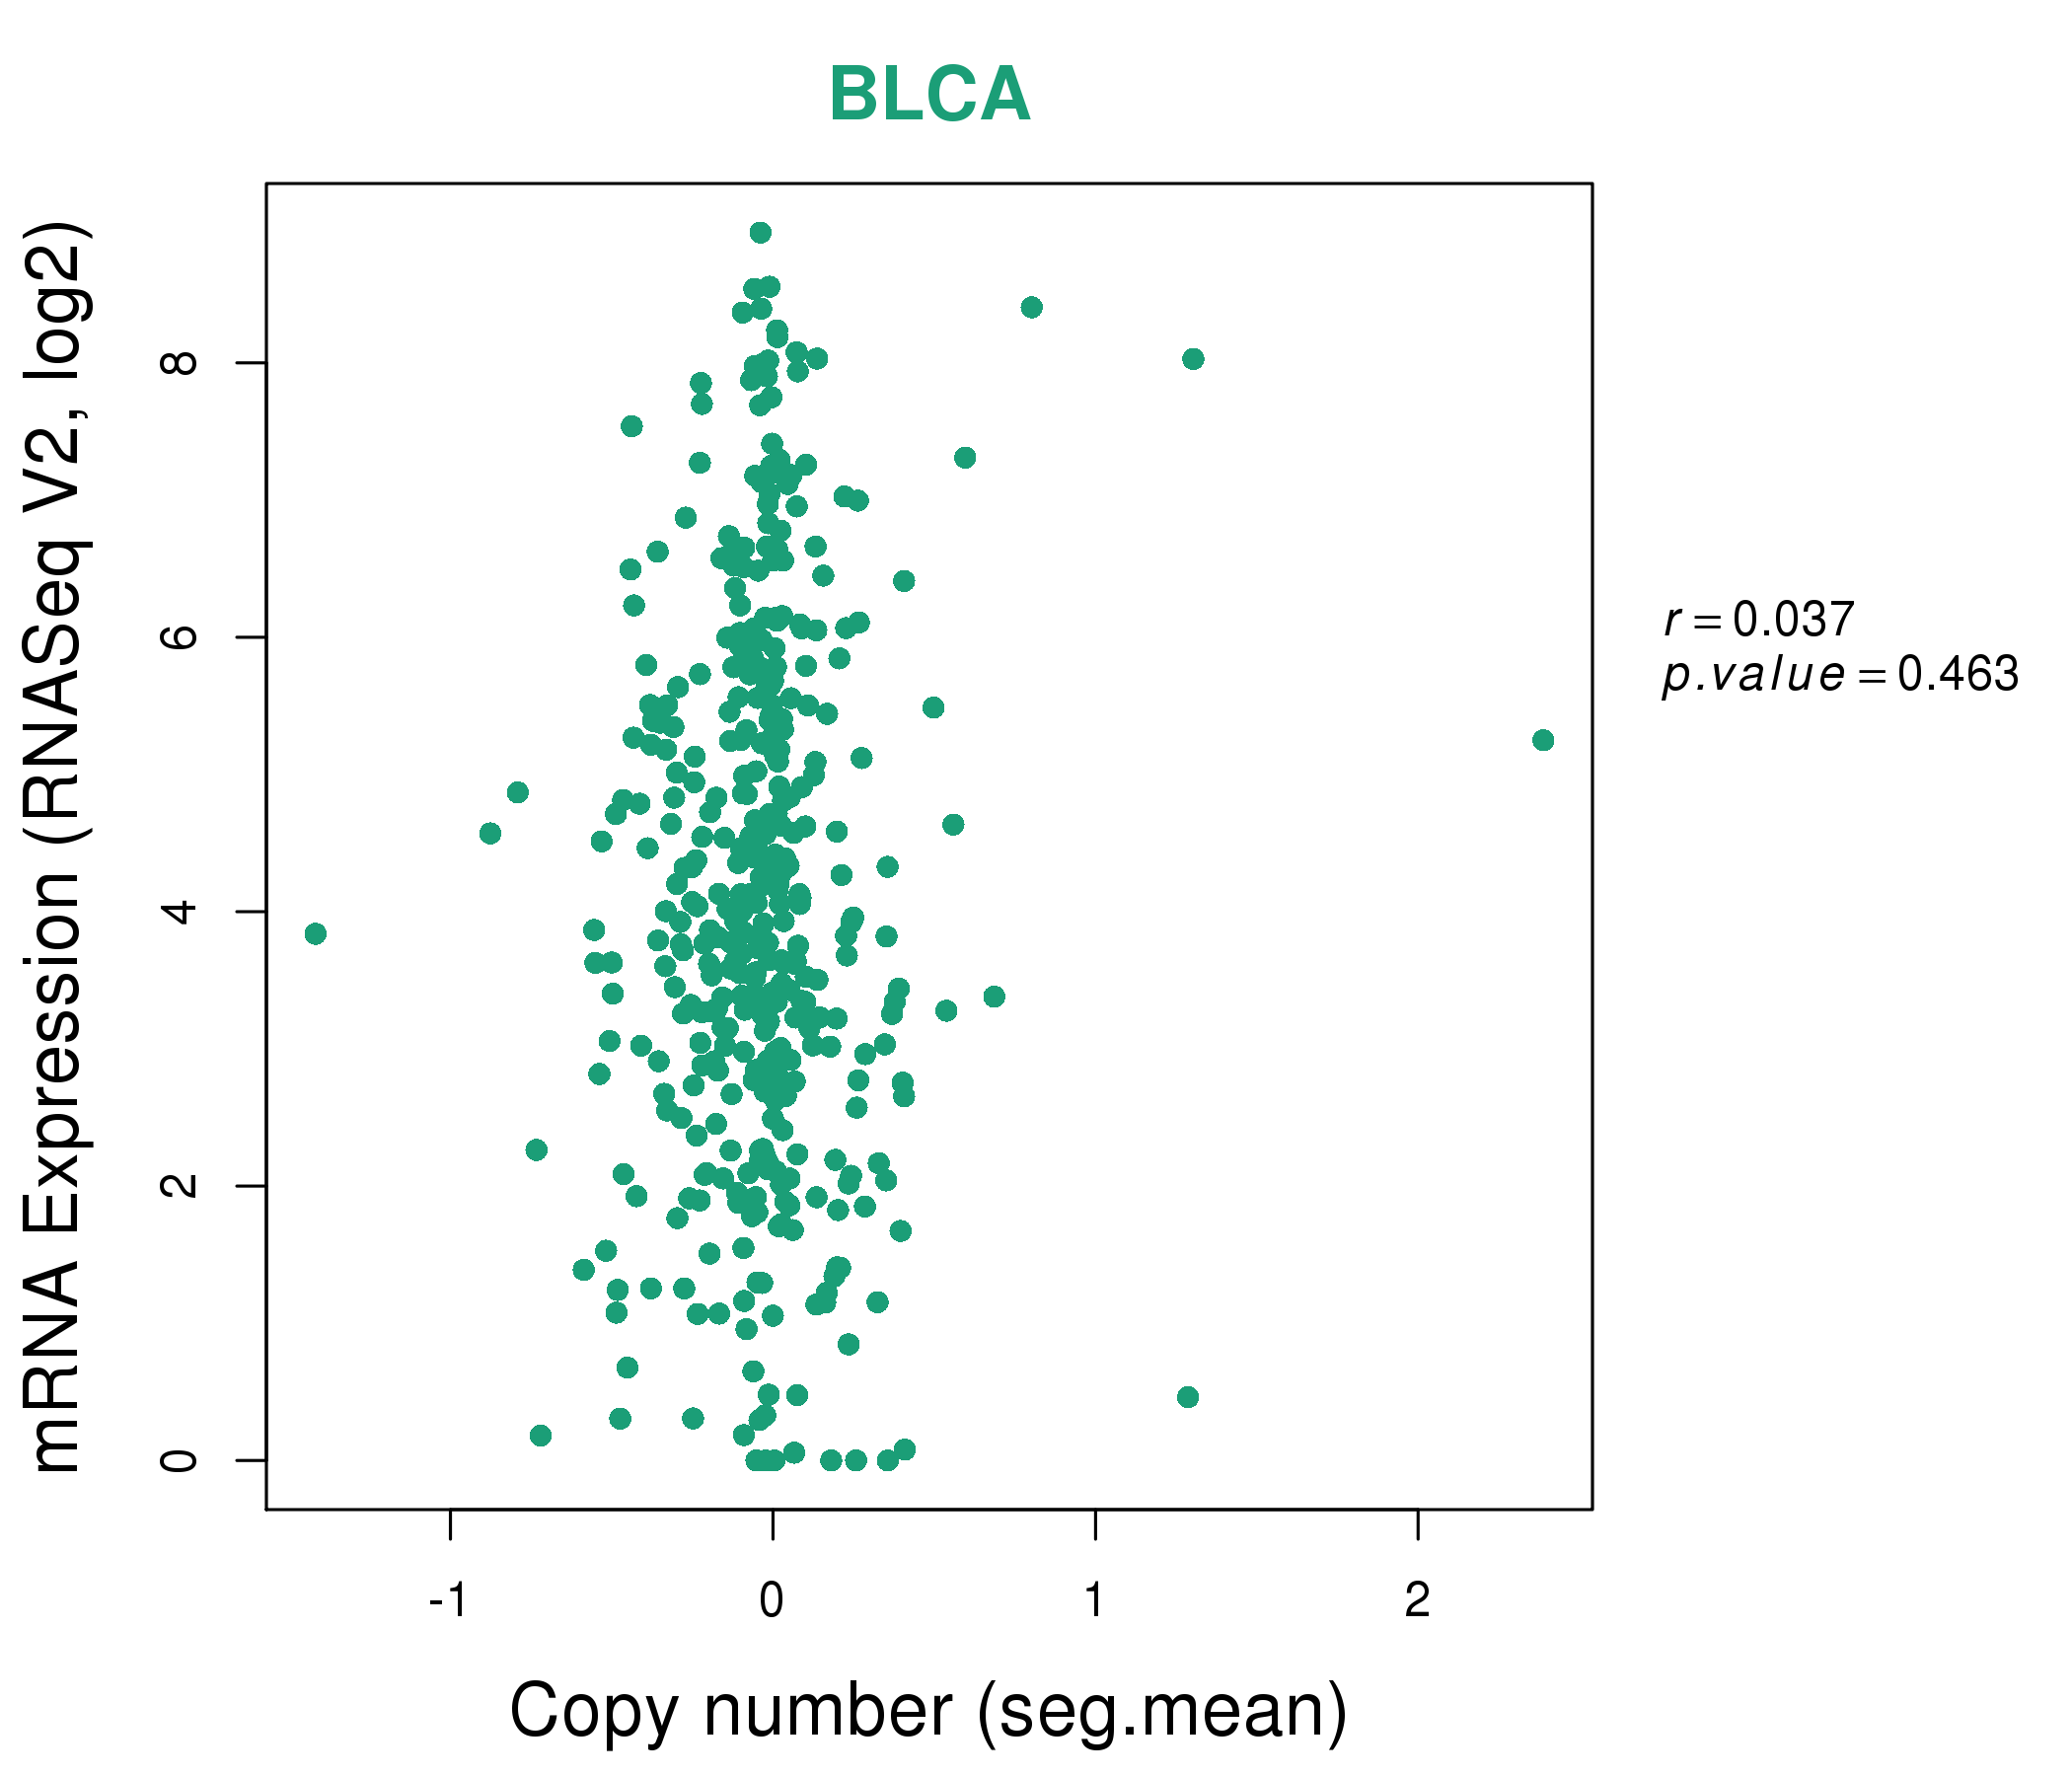
| * This plots show the correlation between CNV and gene expression. |
: Open all plots for all cancer types
 |
|
 |
|
| Top |
| Gene-Gene Network Information |
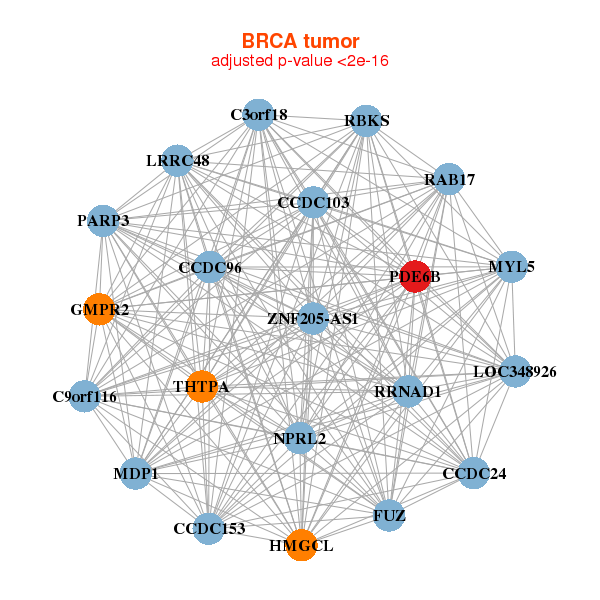
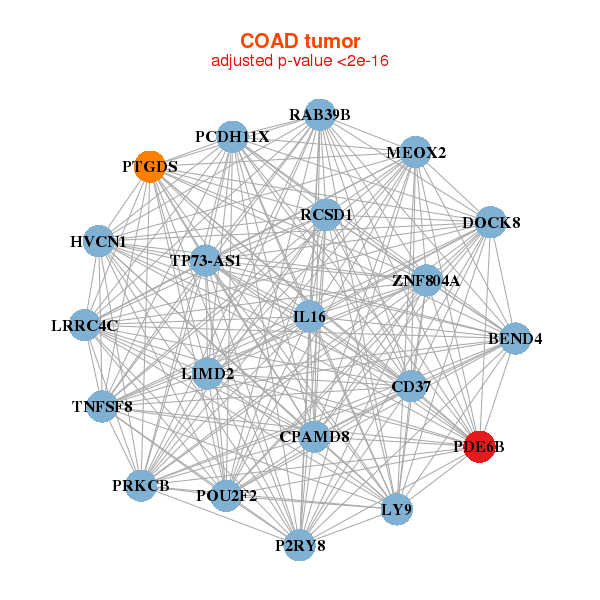
| * Co-Expression network figures were drawn using R package igraph. Only the top 20 genes with the highest correlations were shown. Red circle: input gene, orange circle: cell metabolism gene, sky circle: other gene |
: Open all plots for all cancer types
 |
|
| RRNAD1,C3orf18,C9orf116,CCDC103,CCDC153,CCDC24,CCDC96, FUZ,GMPR2,HMGCL,LOC348926,LRRC48,MDP1,ZNF205-AS1, MYL5,NPRL2,PARP3,PDE6B,RAB17,RBKS,THTPA | BSPRY,CBLC,CCDC24,EFNA4,ELMO3,GSTO2,H2AFY2, MAGEF1,PDE6B,PPAP2C,PRKCZ,PRRG2,RAB25,RTKN, SPINT1,SPINT2,STXBP2,SYTL1,TMC4,TMEM125,TMPRSS13 |
 |
|
| BEND4,CD37,CPAMD8,DOCK8,HVCN1,IL16,TP73-AS1, LIMD2,LRRC4C,LY9,MEOX2,P2RY8,PCDH11X,PDE6B, POU2F2,PRKCB,PTGDS,RAB39B,RCSD1,TNFSF8,ZNF804A | APOC1,BTK,TMEM243,CD48,CYSLTR1,EVI2A,GLT8D1, GPSM3,HELQ,KREMEN2,LAPTM5,LOC374443,LOC645431,LY86, MFNG,PDE6B,RAB33A,RINL,S100Z,SYTL1,ZCCHC7 |
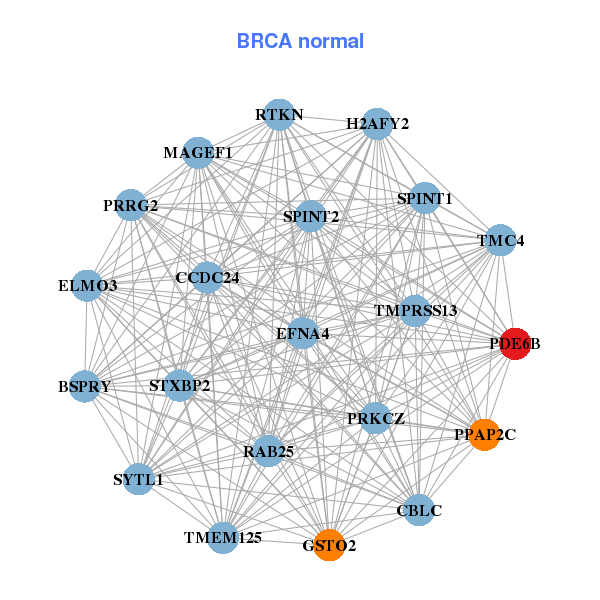
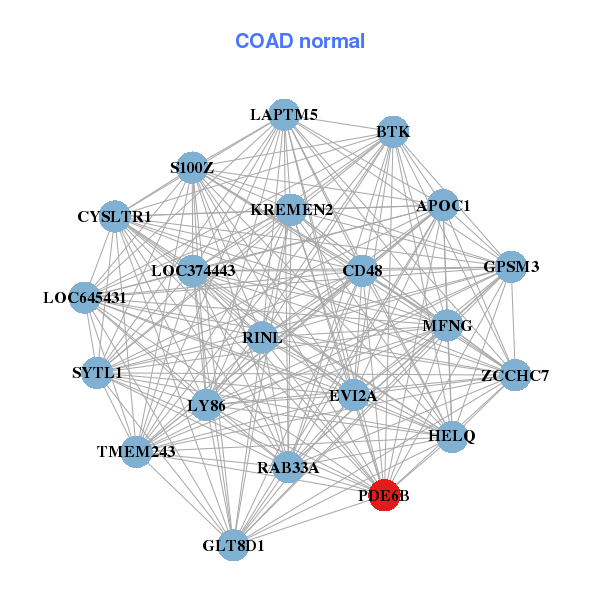
| * Co-Expression network figures were drawn using R package igraph. Only the top 20 genes with the highest correlations were shown. Red circle: input gene, orange circle: cell metabolism gene, sky circle: other gene |
: Open all plots for all cancer types
| Top |
: Open all interacting genes' information including KEGG pathway for all interacting genes from DAVID
| Top |
| Pharmacological Information for PDE6B |
| There's no related Drug. |
| Top |
| Cross referenced IDs for PDE6B |
| * We obtained these cross-references from Uniprot database. It covers 150 different DBs, 18 categories. http://www.uniprot.org/help/cross_references_section |
: Open all cross reference information
|
Copyright © 2016-Present - The Univsersity of Texas Health Science Center at Houston @ |