|
||||||||||||||||||||||||||||||||||||||||||||||||||||||||||||||||||||||||||||||||||||||||||||||||||||||||||||||||||||||||||||||||||||||||||||||||||||||||||||||||||||||||||||||||||||||||||||||||||||||||||||||||||||||||||||||||||||||||||||||||||||||||||||||||||||||||||||||||||||||||||||||||||||||||||||||||||||||||||
| |
| Phenotypic Information (metabolism pathway, cancer, disease, phenome) |
| |
| |
| Gene-Gene Network Information: Co-Expression Network, Interacting Genes & KEGG |
| |
|


| Gene Summary for AZIN1 |
| Top |
| Phenotypic Information for AZIN1(metabolism pathway, cancer, disease, phenome) |
| Cancer | CGAP: AZIN1 |
| Familial Cancer Database: AZIN1 | |
| * This gene is included in those cancer gene databases. |
|
|
|
|
|
| . | ||||||||||||||||||||||||||||||||||||||||||||||||||||||||||||||||||||||||||||||||||||||||||||||||||||||||||||||||||||||||||||||||||||||||||||||||||||||||||||||||||||||||||||||||||||||||||||||||||||||||||||||||||||||||||||||||||||||||||||||||||||||||||||||||||||||||||||||||||||||||||||||||||||||||||||||||||||
Oncogene 1 | Significant driver gene in | |||||||||||||||||||||||||||||||||||||||||||||||||||||||||||||||||||||||||||||||||||||||||||||||||||||||||||||||||||||||||||||||||||||||||||||||||||||||||||||||||||||||||||||||||||||||||||||||||||||||||||||||||||||||||||||||||||||||||||||||||||||||||||||||||||||||||||||||||||||||||||||||||||||||||||||||||||||||||
| cf) number; DB name 1 Oncogene; http://nar.oxfordjournals.org/content/35/suppl_1/D721.long, 2 Tumor Suppressor gene; https://bioinfo.uth.edu/TSGene/, 3 Cancer Gene Census; http://www.nature.com/nrc/journal/v4/n3/abs/nrc1299.html, 4 CancerGenes; http://nar.oxfordjournals.org/content/35/suppl_1/D721.long, 5 Network of Cancer Gene; http://ncg.kcl.ac.uk/index.php, 1Therapeutic Vulnerabilities in Cancer; http://cbio.mskcc.org/cancergenomics/statius/ |
| REACTOME_METABOLISM_OF_AMINO_ACIDS_AND_DERIVATIVES | |
| OMIM | |
| Orphanet | |
| Disease | KEGG Disease: AZIN1 |
| MedGen: AZIN1 (Human Medical Genetics with Condition) | |
| ClinVar: AZIN1 | |
| Phenotype | MGI: AZIN1 (International Mouse Phenotyping Consortium) |
| PhenomicDB: AZIN1 | |
| Mutations for AZIN1 |
| * Under tables are showing count per each tissue to give us broad intuition about tissue specific mutation patterns.You can go to the detailed page for each mutation database's web site. |
| - Statistics for Tissue and Mutation type | Top |
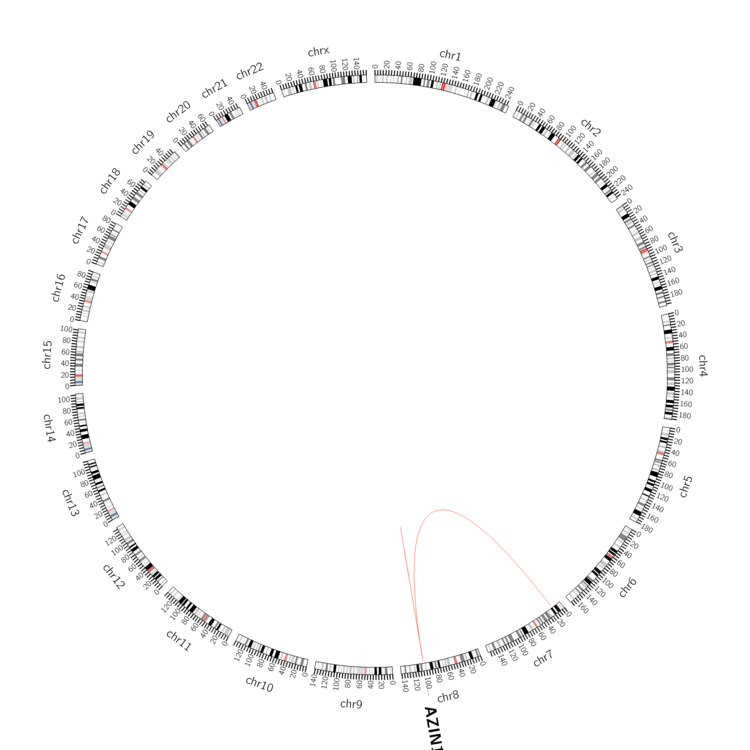 |
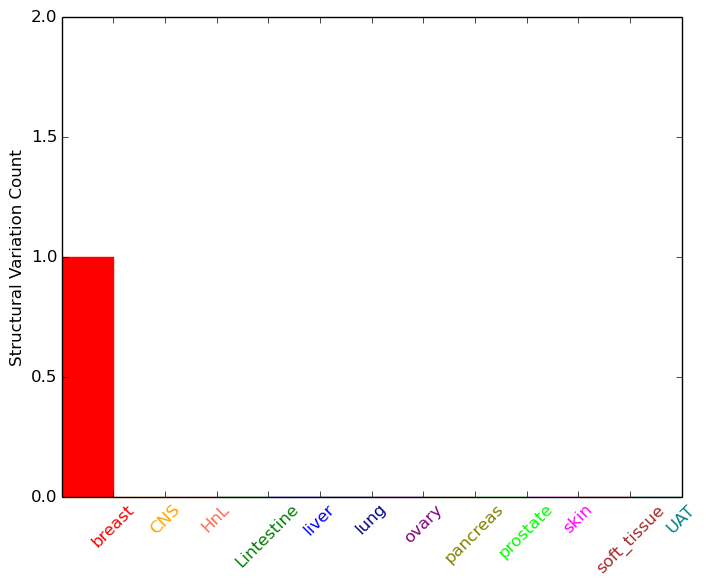
| - For Inter-chromosomal Variations |
| * Inter-chromosomal variantions includes 'interchromosomal amplicon to amplicon', 'interchromosomal amplicon to non-amplified dna', 'interchromosomal insertion', 'Interchromosomal unknown type'. |
 |
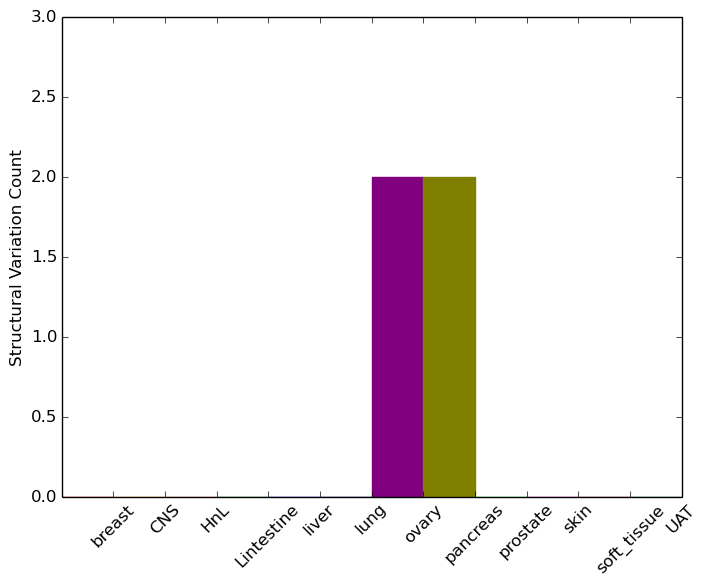
| - For Intra-chromosomal Variations |
| * Intra-chromosomal variantions includes 'intrachromosomal amplicon to amplicon', 'intrachromosomal amplicon to non-amplified dna', 'intrachromosomal deletion', 'intrachromosomal fold-back inversion', 'intrachromosomal inversion', 'intrachromosomal tandem duplication', 'Intrachromosomal unknown type', 'intrachromosomal with inverted orientation', 'intrachromosomal with non-inverted orientation'. |
 |
| Sample | Symbol_a | Chr_a | Start_a | End_a | Symbol_b | Chr_b | Start_b | End_b |
| ovary | AZIN1 | chr8 | 103851412 | 103851432 | AZIN1 | chr8 | 103851690 | 103851710 |
| ovary | AZIN1 | chr8 | 103853364 | 103853384 | AZIN1 | chr8 | 103849438 | 103849458 |
| pancreas | AZIN1 | chr8 | 103852678 | 103852698 | chr8 | 103755378 | 103755398 | |
| pancreas | AZIN1 | chr8 | 103852680 | 103852700 | chr8 | 103755378 | 103755398 |
| cf) Tissue number; Tissue name (1;Breast, 2;Central_nervous_system, 3;Haematopoietic_and_lymphoid_tissue, 4;Large_intestine, 5;Liver, 6;Lung, 7;Ovary, 8;Pancreas, 9;Prostate, 10;Skin, 11;Soft_tissue, 12;Upper_aerodigestive_tract) |
| * From mRNA Sanger sequences, Chitars2.0 arranged chimeric transcripts. This table shows AZIN1 related fusion information. |
| ID | Head Gene | Tail Gene | Accession | Gene_a | qStart_a | qEnd_a | Chromosome_a | tStart_a | tEnd_a | Gene_a | qStart_a | qEnd_a | Chromosome_a | tStart_a | tEnd_a |
| X76040 | LONP1 | 1 | 3072 | 19 | 5691846 | 5720138 | AZIN1 | 3073 | 3394 | 8 | 103839229 | 103839550 | |
| DA410167 | TASP1 | 1 | 224 | 20 | 13527454 | 13527677 | AZIN1 | 223 | 541 | 8 | 103855779 | 103870362 | |
| AA765801 | AZIN1 | 1 | 116 | 8 | 103876233 | 103876348 | AEBP2 | 111 | 321 | 12 | 19592799 | 19593011 | |
| DA493026 | AZIN1 | 2 | 327 | 8 | 103876067 | 103876392 | TRIM46 | 324 | 550 | 1 | 155156687 | 155156913 | |
| X74215 | LONP1 | 1 | 2768 | 19 | 5691846 | 5719834 | AZIN1 | 2769 | 3090 | 8 | 103839229 | 103839550 | |
| DB135580 | YWHAZ | 1 | 121 | 8 | 101965496 | 101965616 | AZIN1 | 119 | 549 | 8 | 103851958 | 103870380 | |
| AI890066 | COL6A1 | 5 | 65 | 21 | 47423955 | 47424015 | AZIN1 | 65 | 491 | 8 | 103838694 | 103839120 | |
| Top |
| Mutation type/ Tissue ID | brca | cns | cerv | endome | haematopo | kidn | Lintest | liver | lung | ns | ovary | pancre | prost | skin | stoma | thyro | urina | |||
| Total # sample | 4 | 1 | 1 | 1 | 2 | |||||||||||||||
| GAIN (# sample) | 4 | 1 | 1 | 1 | 2 | |||||||||||||||
| LOSS (# sample) |
| cf) Tissue ID; Tissue type (1; Breast, 2; Central_nervous_system, 3; Cervix, 4; Endometrium, 5; Haematopoietic_and_lymphoid_tissue, 6; Kidney, 7; Large_intestine, 8; Liver, 9; Lung, 10; NS, 11; Ovary, 12; Pancreas, 13; Prostate, 14; Skin, 15; Stomach, 16; Thyroid, 17; Urinary_tract) |
| Top |
|
 |
| Top |
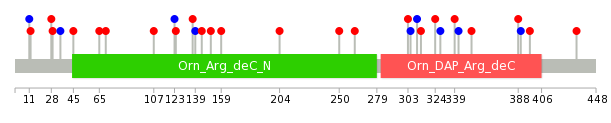
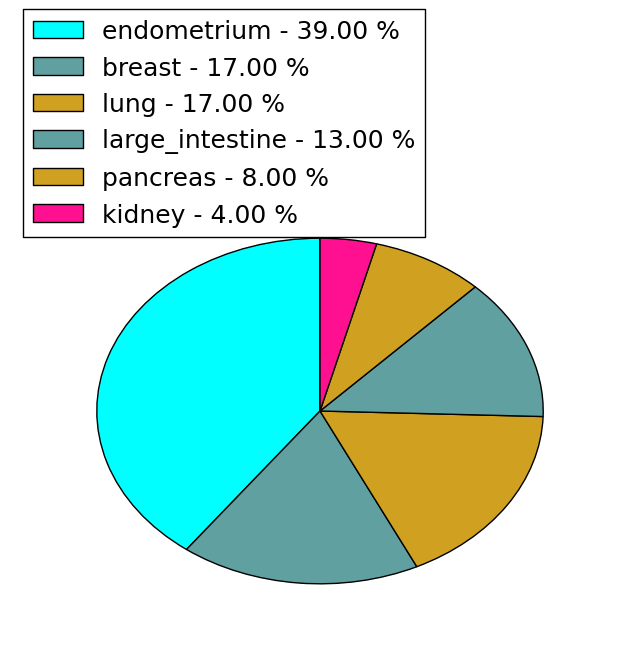
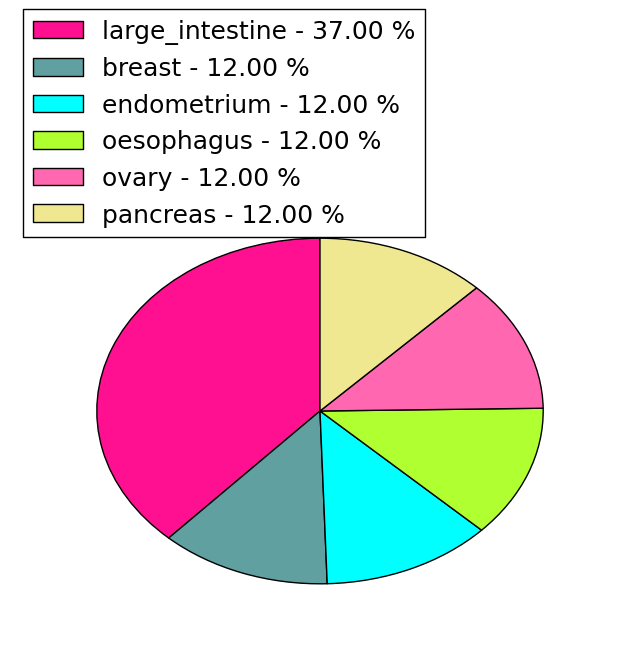
| Stat. for Non-Synonymous SNVs (# total SNVs=23) | (# total SNVs=8) |
 |  |
(# total SNVs=0) | (# total SNVs=0) |
| Top |
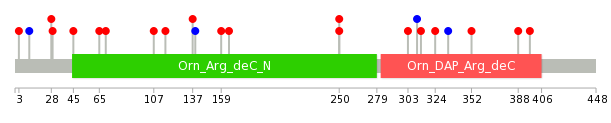
| * When you move the cursor on each content, you can see more deailed mutation information on the Tooltip. Those are primary_site,primary_histology,mutation(aa),pubmedID. |
| GRCh37 position | Mutation(aa) | Unique sampleID count |
| chr8:103851075-103851075 | p.Q116* | 2 |
| chr8:103846950-103846950 | p.E204Q | 1 |
| chr8:103851961-103851961 | p.F65L | 1 |
| chr8:103842054-103842054 | p.H339Y | 1 |
| chr8:103848592-103848592 | p.D159G | 1 |
| chr8:103852020-103852020 | p.L45R | 1 |
| chr8:103842085-103842085 | p.L328L | 1 |
| chr8:103848617-103848617 | p.V151I | 1 |
| chr8:103852049-103852049 | p.T35T | 1 |
| chr8:103842099-103842099 | p.F324V | 1 |
| Top |
|
 |
| Point Mutation/ Tissue ID | 1 | 2 | 3 | 4 | 5 | 6 | 7 | 8 | 9 | 10 | 11 | 12 | 13 | 14 | 15 | 16 | 17 | 18 | 19 | 20 |
| # sample | 1 | 1 | 5 | 1 | 1 | 2 | 1 | 1 | 1 | 9 | ||||||||||
| # mutation | 1 | 1 | 4 | 1 | 1 | 2 | 1 | 1 | 1 | 9 | ||||||||||
| nonsynonymous SNV | 1 | 3 | 1 | 1 | 2 | 1 | 1 | 8 | ||||||||||||
| synonymous SNV | 1 | 1 | 1 | 1 |
| cf) Tissue ID; Tissue type (1; BLCA[Bladder Urothelial Carcinoma], 2; BRCA[Breast invasive carcinoma], 3; CESC[Cervical squamous cell carcinoma and endocervical adenocarcinoma], 4; COAD[Colon adenocarcinoma], 5; GBM[Glioblastoma multiforme], 6; Glioma Low Grade, 7; HNSC[Head and Neck squamous cell carcinoma], 8; KICH[Kidney Chromophobe], 9; KIRC[Kidney renal clear cell carcinoma], 10; KIRP[Kidney renal papillary cell carcinoma], 11; LAML[Acute Myeloid Leukemia], 12; LUAD[Lung adenocarcinoma], 13; LUSC[Lung squamous cell carcinoma], 14; OV[Ovarian serous cystadenocarcinoma ], 15; PAAD[Pancreatic adenocarcinoma], 16; PRAD[Prostate adenocarcinoma], 17; SKCM[Skin Cutaneous Melanoma], 18:STAD[Stomach adenocarcinoma], 19:THCA[Thyroid carcinoma], 20:UCEC[Uterine Corpus Endometrial Carcinoma]) |
| Top |
| * We represented just top 10 SNVs. When you move the cursor on each content, you can see more deailed mutation information on the Tooltip. Those are primary_site, primary_histology, mutation(aa), pubmedID. |
| Genomic Position | Mutation(aa) | Unique sampleID count |
| chr8:103845440 | p.H250Y,AZIN1 | 2 |
| chr8:103851961 | p.E165K,AZIN1 | 1 |
| chr8:103842139 | p.D159G,AZIN1 | 1 |
| chr8:103852020 | p.L139L,AZIN1 | 1 |
| chr8:103842161 | p.I137M,AZIN1 | 1 |
| chr8:103855796 | p.Q116R,AZIN1 | 1 |
| chr8:103855798 | p.N107S,AZIN1 | 1 |
| chr8:103848575 | p.C70Y,AZIN1 | 1 |
| chr8:103855848 | p.F65L,AZIN1 | 1 |
| chr8:103848592 | p.D397N,AZIN1 | 1 |
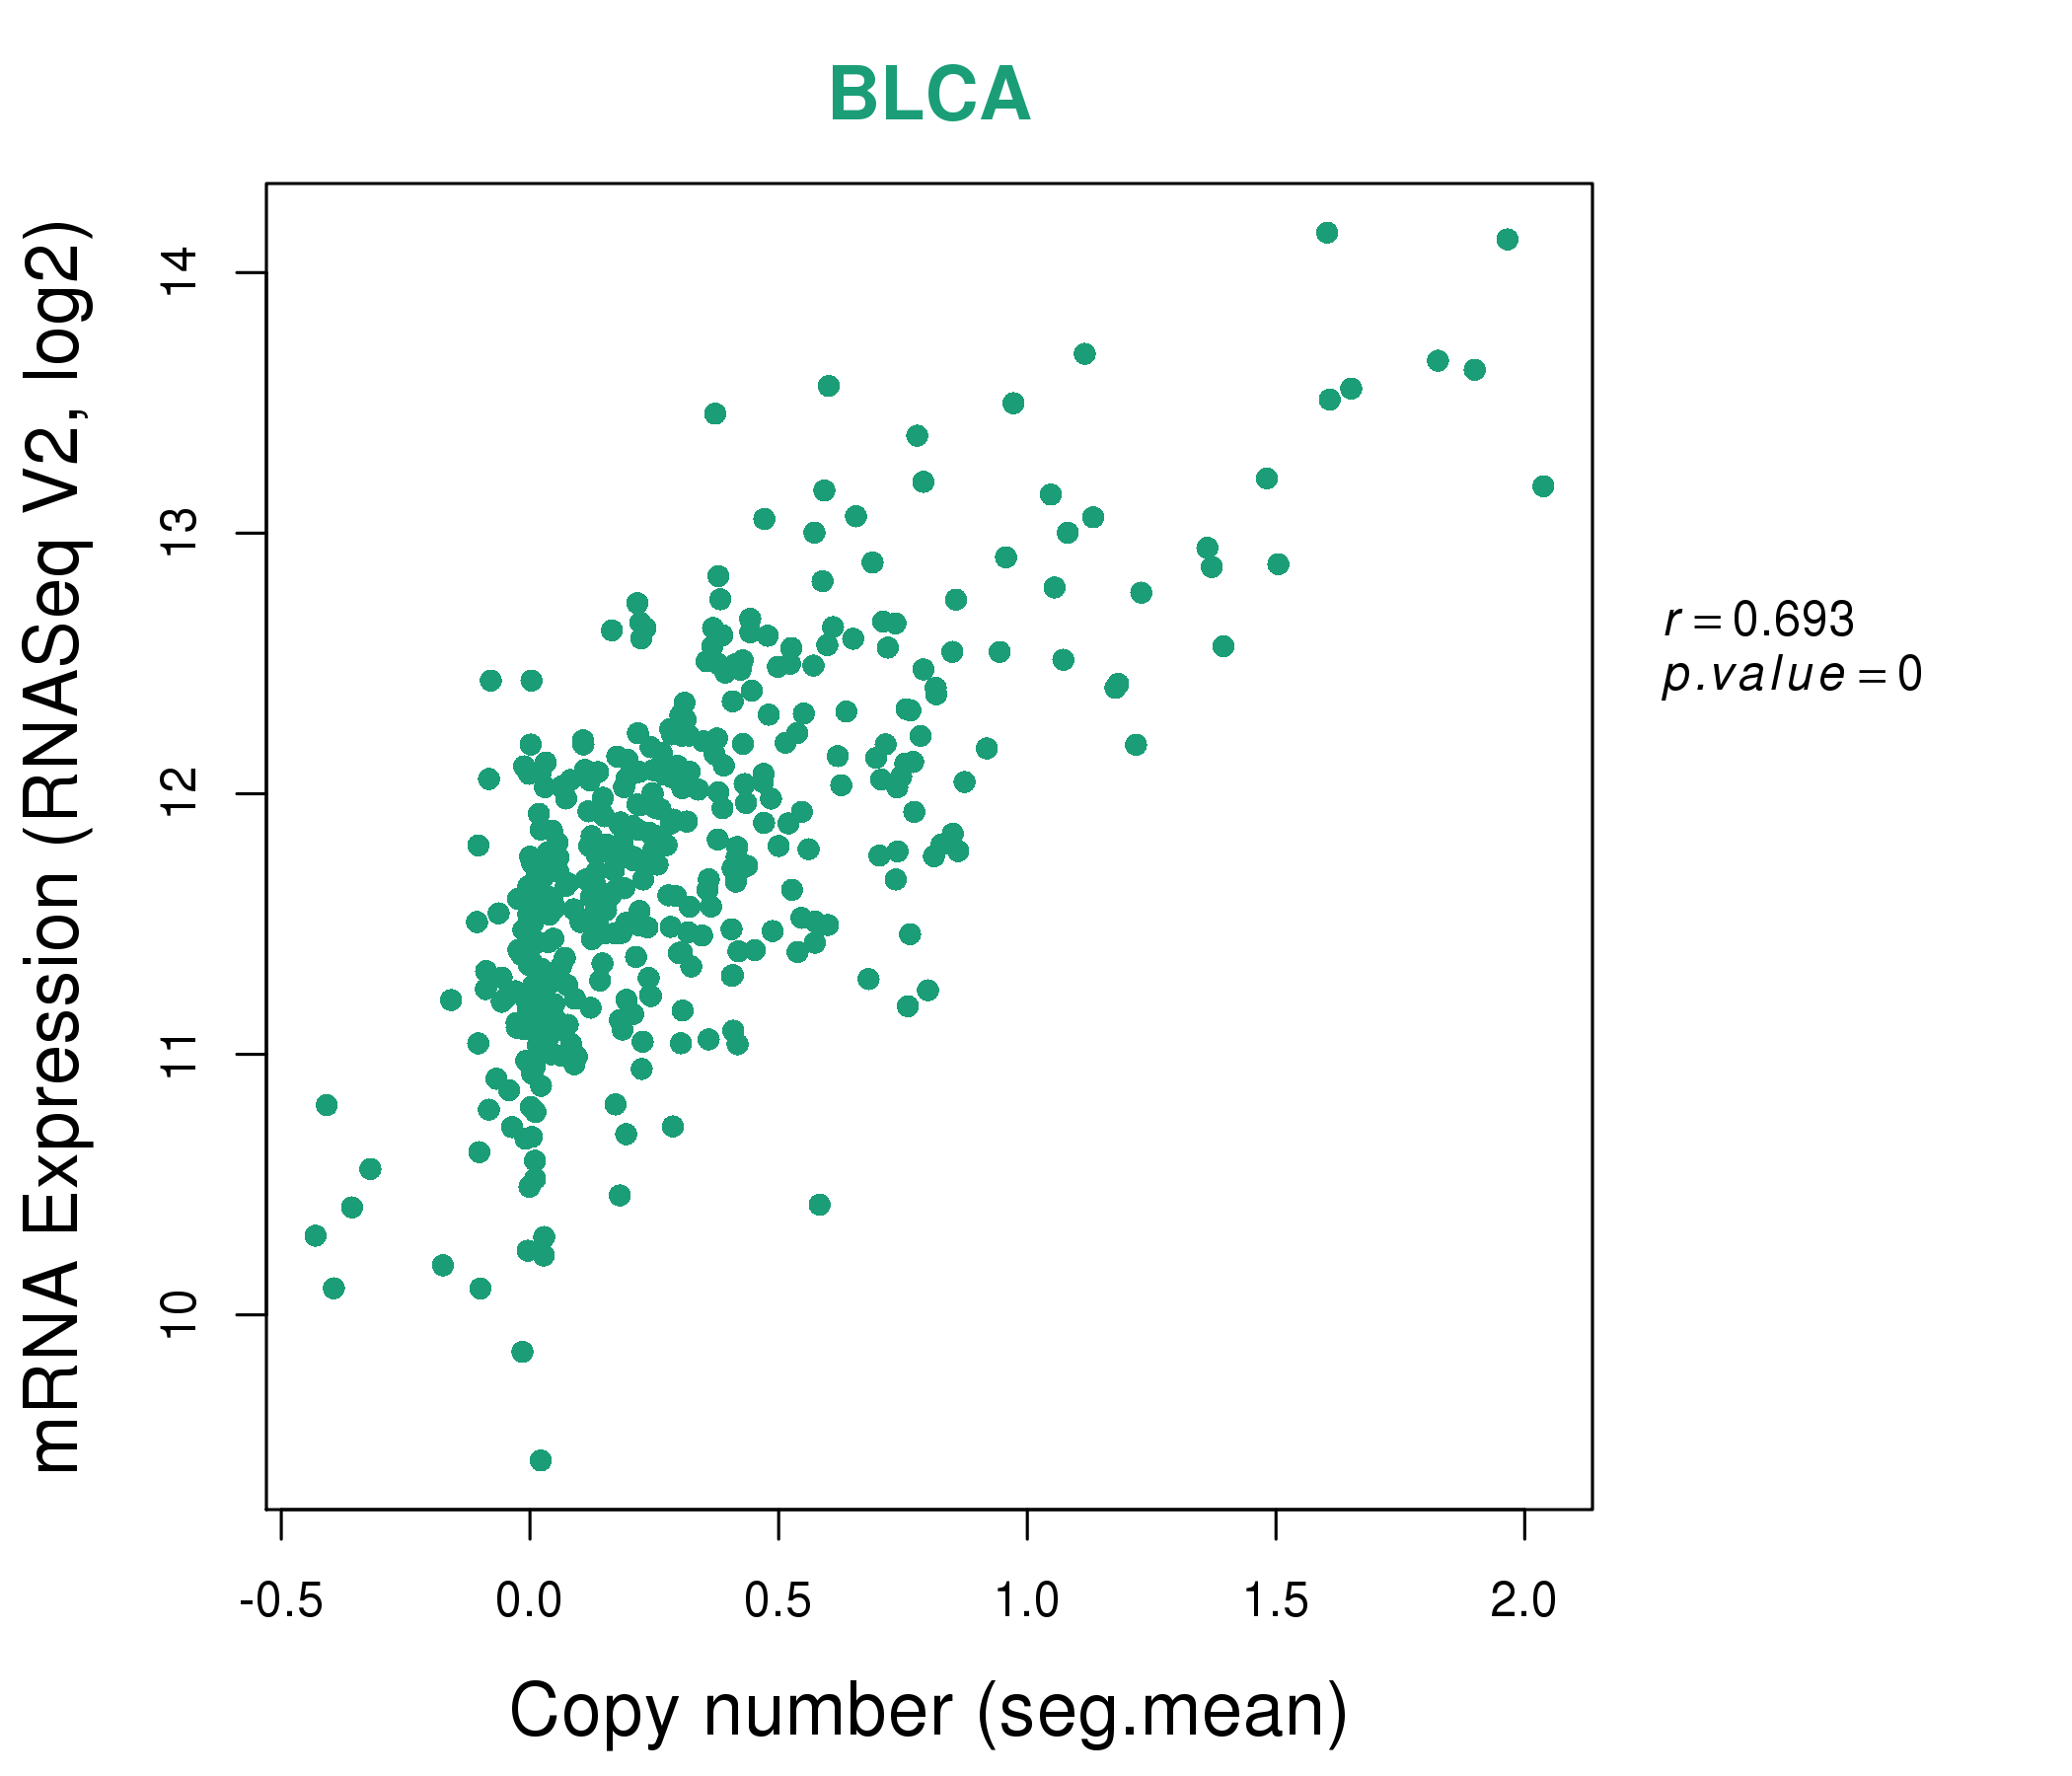
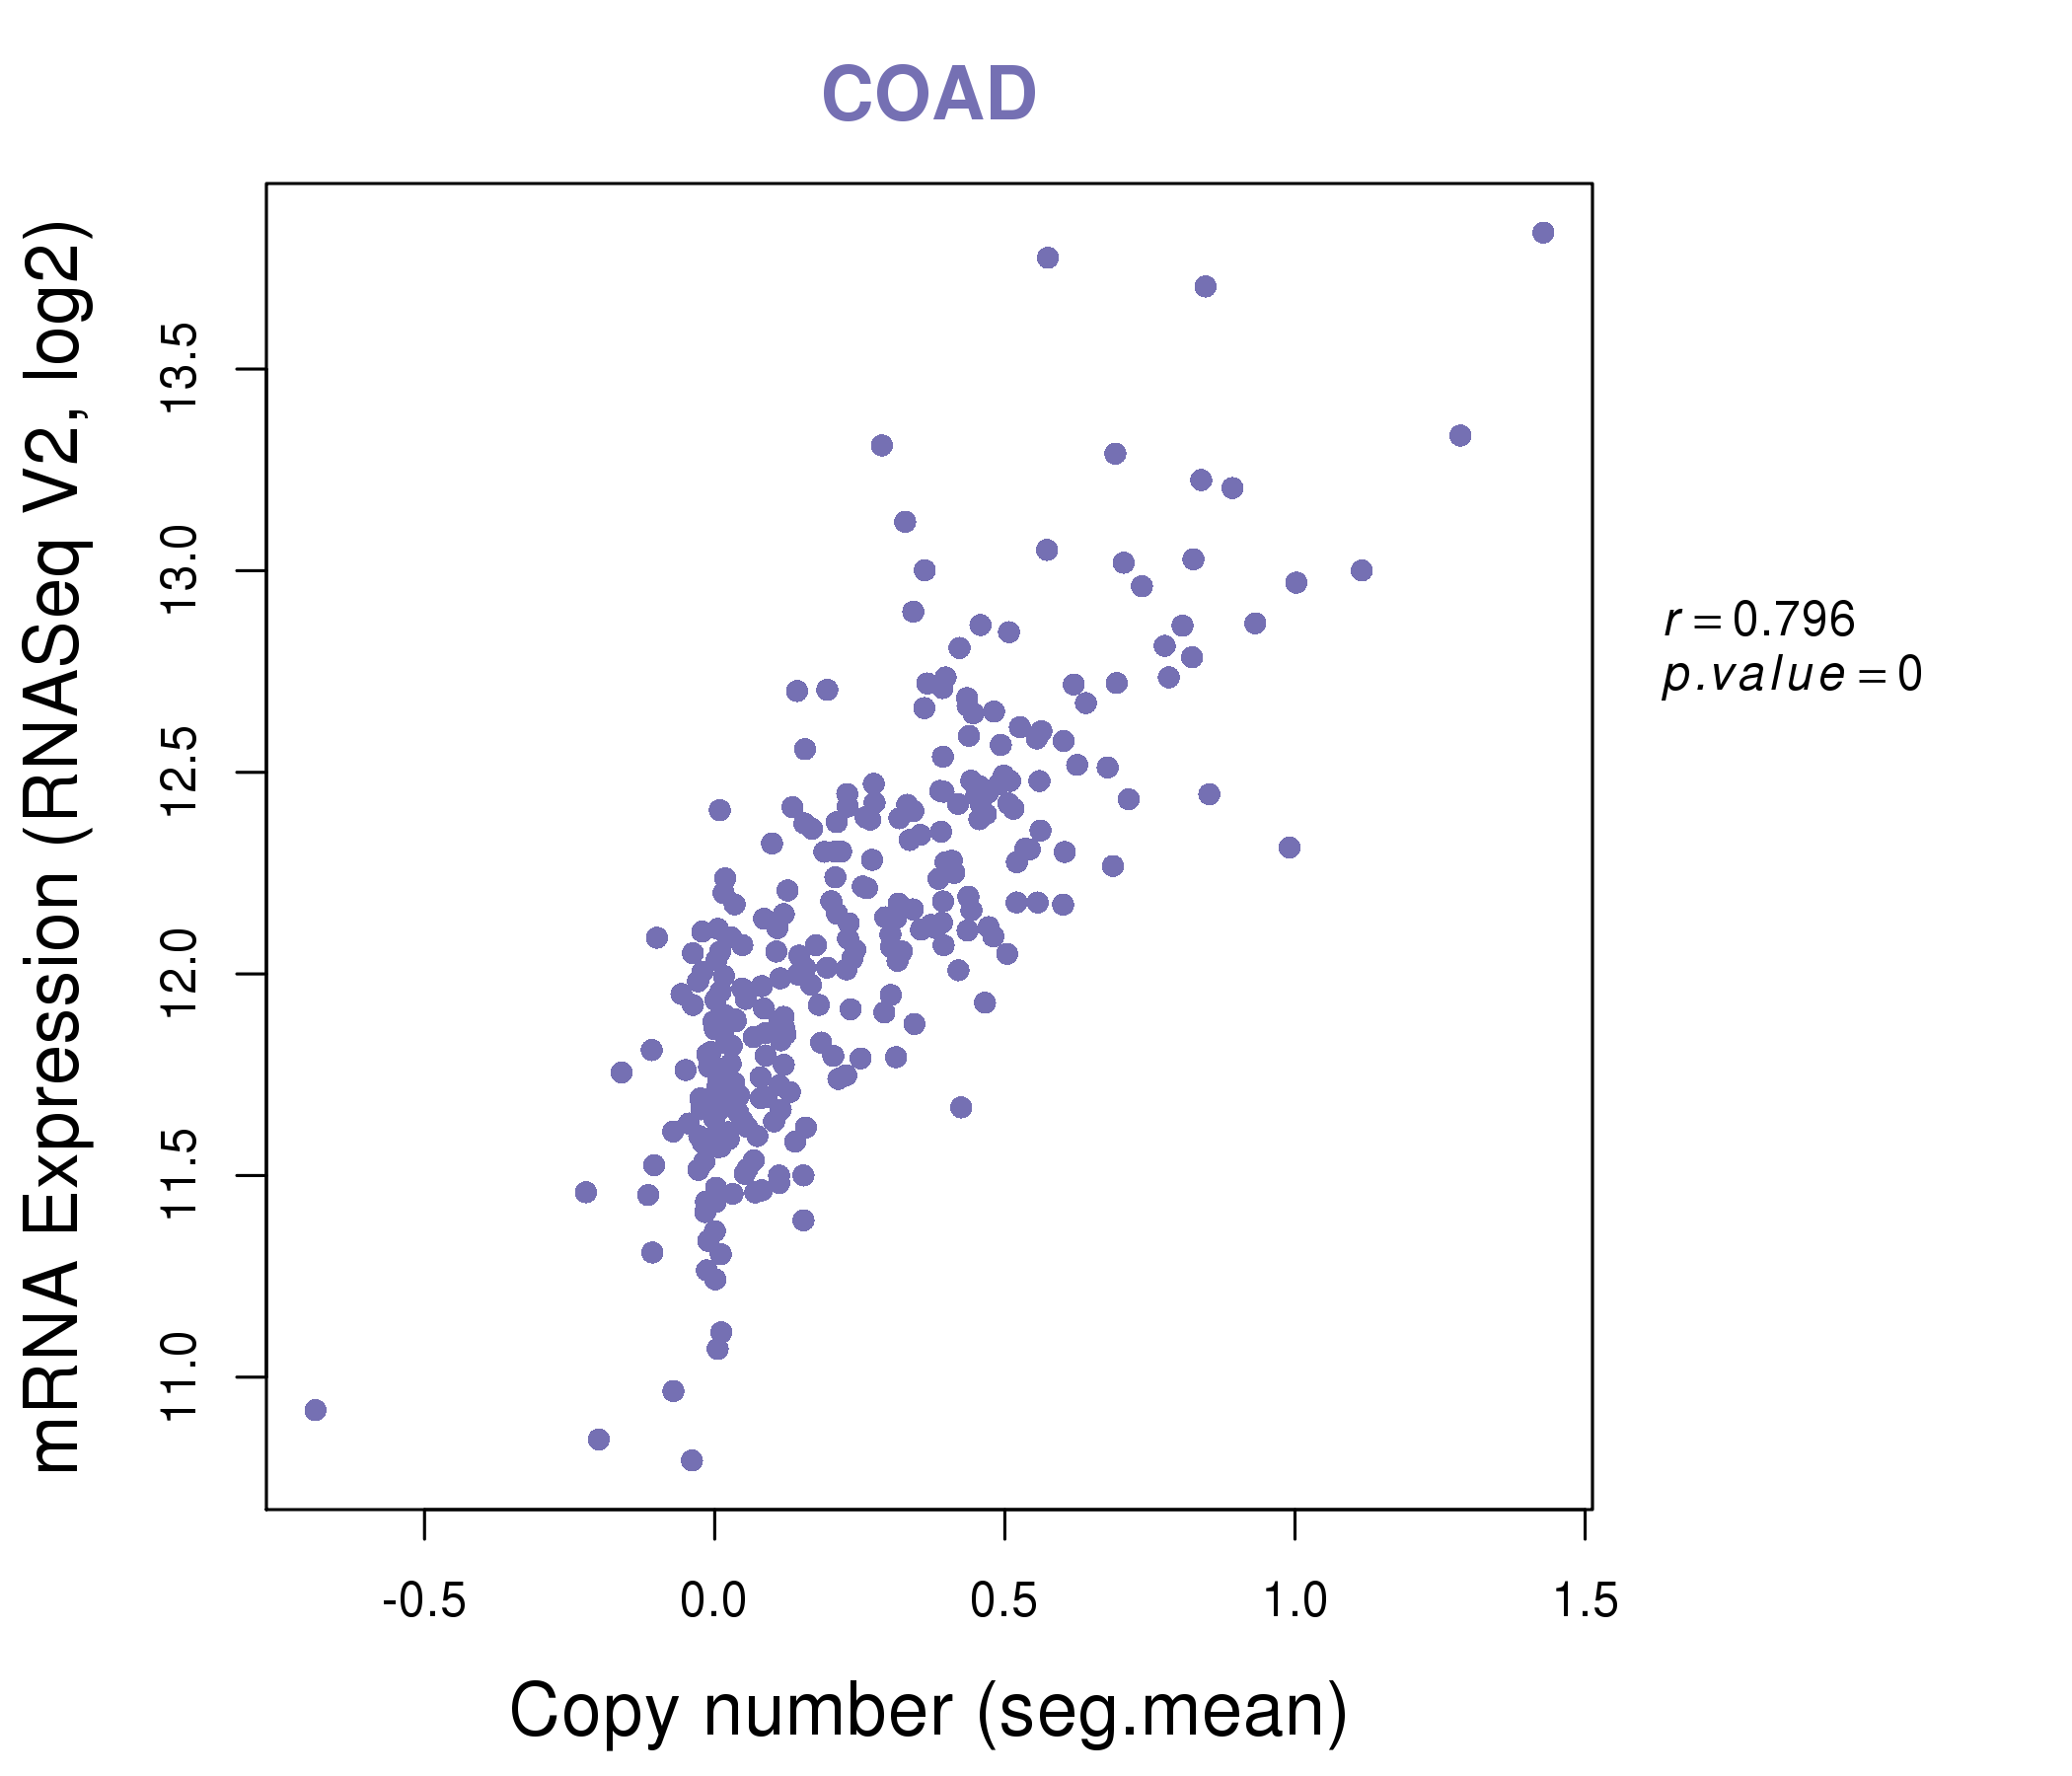
| * Copy number data were extracted from TCGA using R package TCGA-Assembler. The URLs of all public data files on TCGA DCC data server were gathered on Jan-05-2015. Function ProcessCNAData in TCGA-Assembler package was used to obtain gene-level copy number value which is calculated as the average copy number of the genomic region of a gene. |
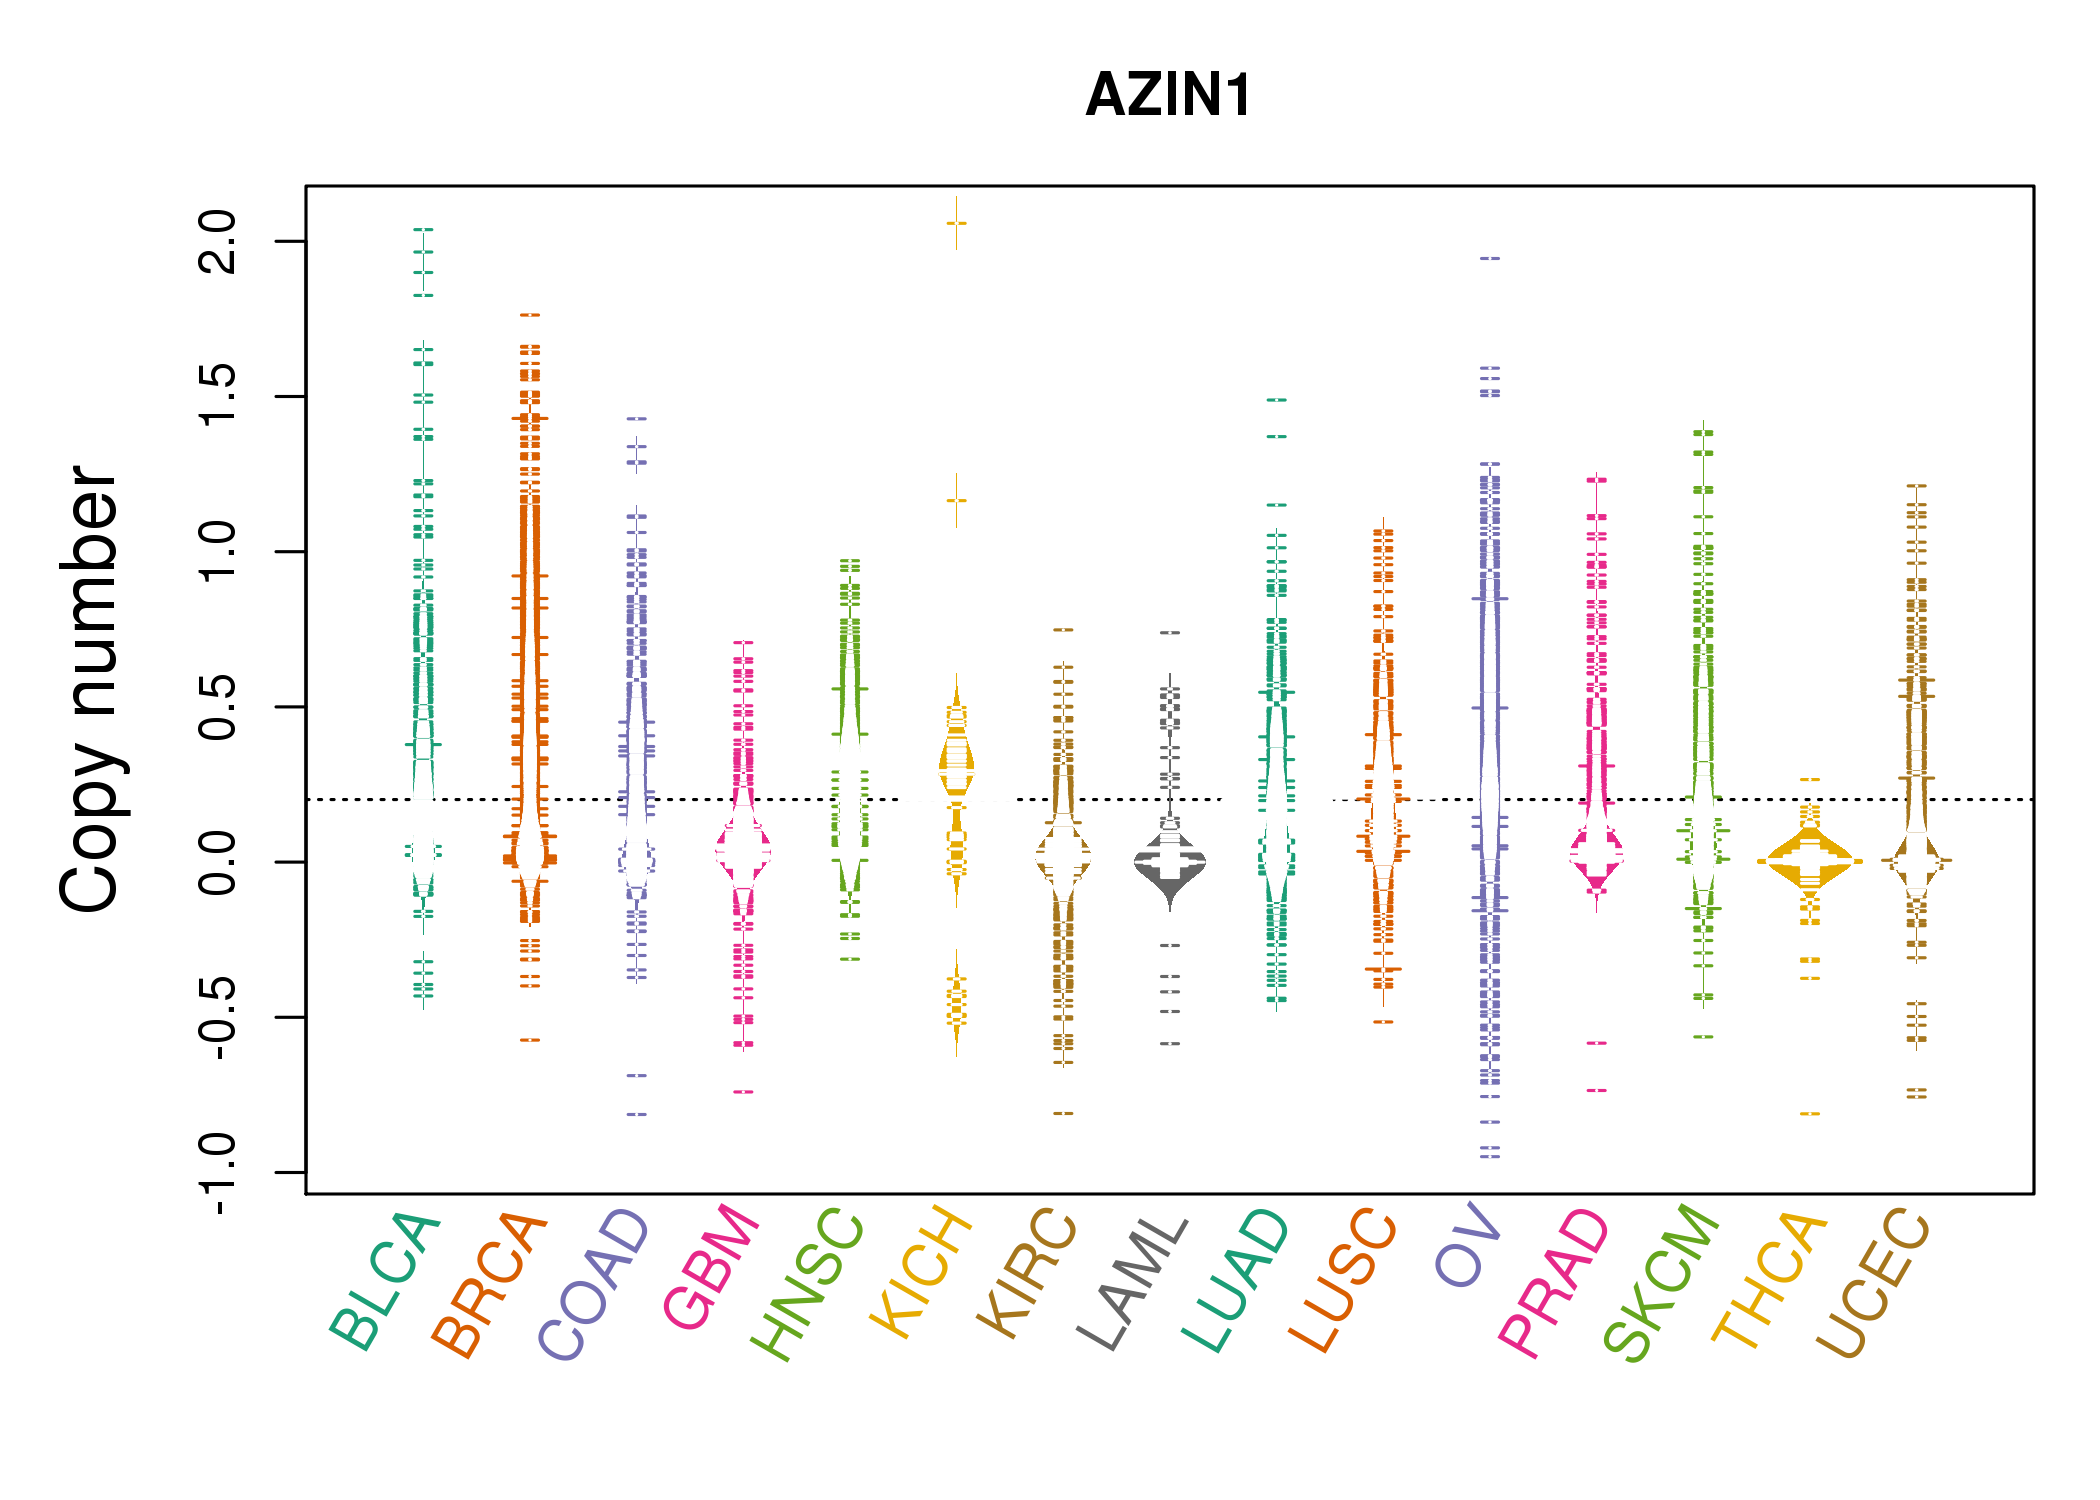 |
| cf) Tissue ID[Tissue type]: BLCA[Bladder Urothelial Carcinoma], BRCA[Breast invasive carcinoma], CESC[Cervical squamous cell carcinoma and endocervical adenocarcinoma], COAD[Colon adenocarcinoma], GBM[Glioblastoma multiforme], Glioma Low Grade, HNSC[Head and Neck squamous cell carcinoma], KICH[Kidney Chromophobe], KIRC[Kidney renal clear cell carcinoma], KIRP[Kidney renal papillary cell carcinoma], LAML[Acute Myeloid Leukemia], LUAD[Lung adenocarcinoma], LUSC[Lung squamous cell carcinoma], OV[Ovarian serous cystadenocarcinoma ], PAAD[Pancreatic adenocarcinoma], PRAD[Prostate adenocarcinoma], SKCM[Skin Cutaneous Melanoma], STAD[Stomach adenocarcinoma], THCA[Thyroid carcinoma], UCEC[Uterine Corpus Endometrial Carcinoma] |
| Top |
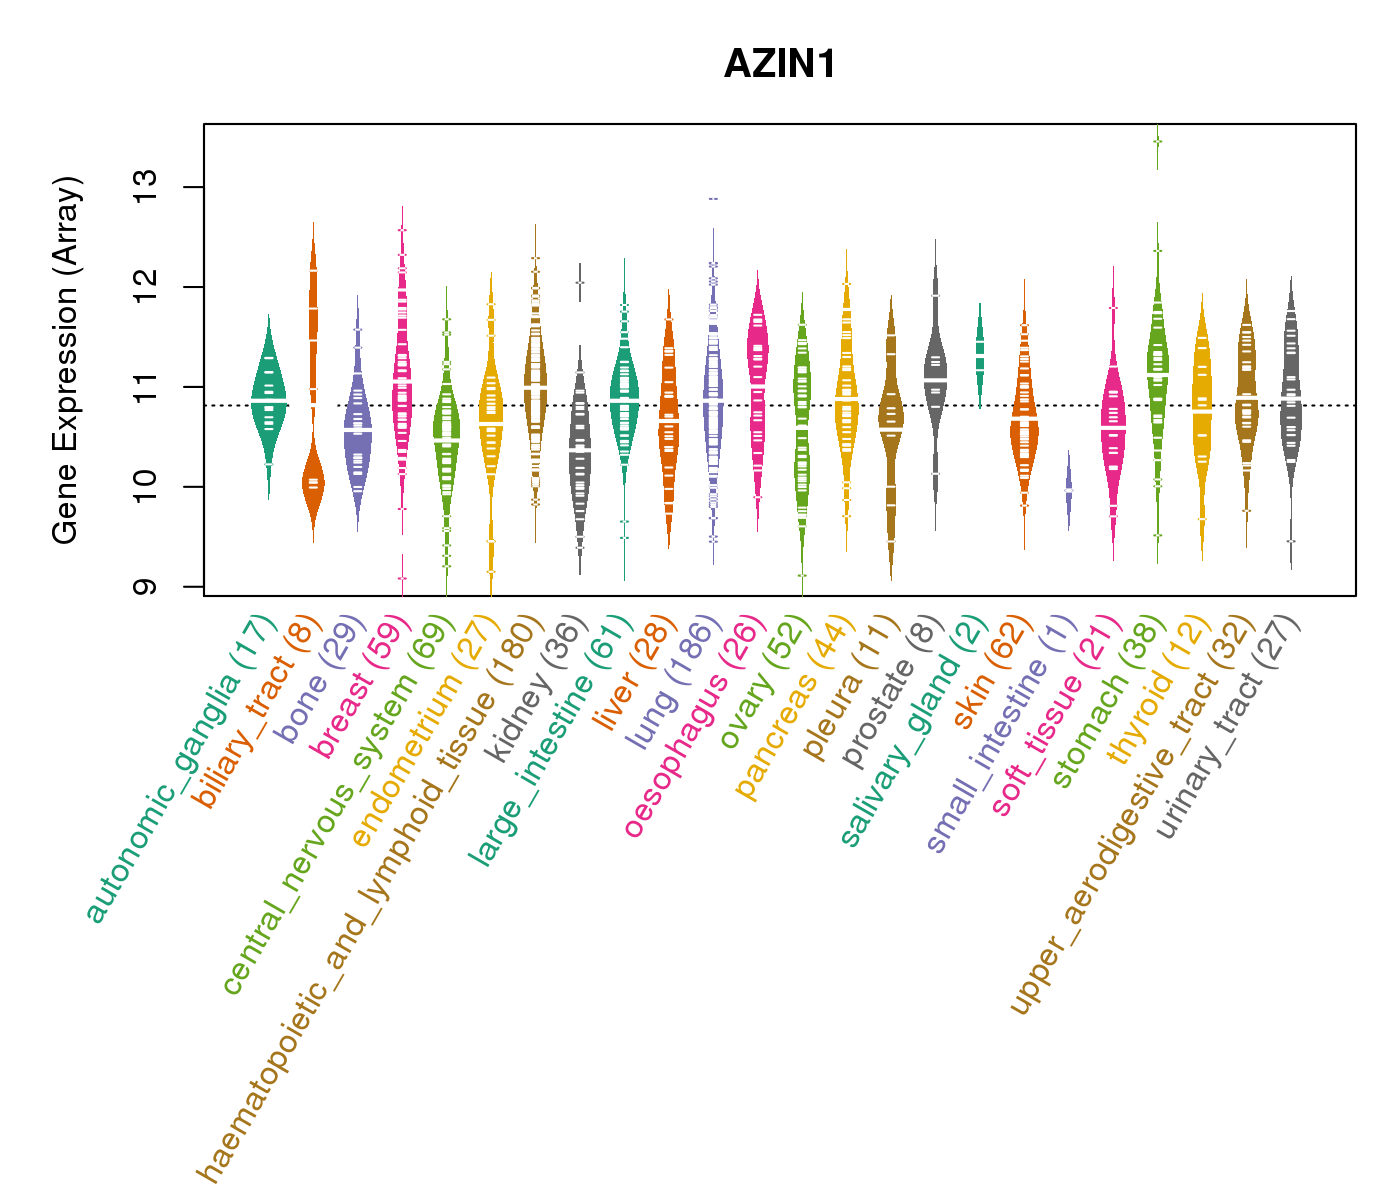
| Gene Expression for AZIN1 |
| * CCLE gene expression data were extracted from CCLE_Expression_Entrez_2012-10-18.res: Gene-centric RMA-normalized mRNA expression data. |
 |
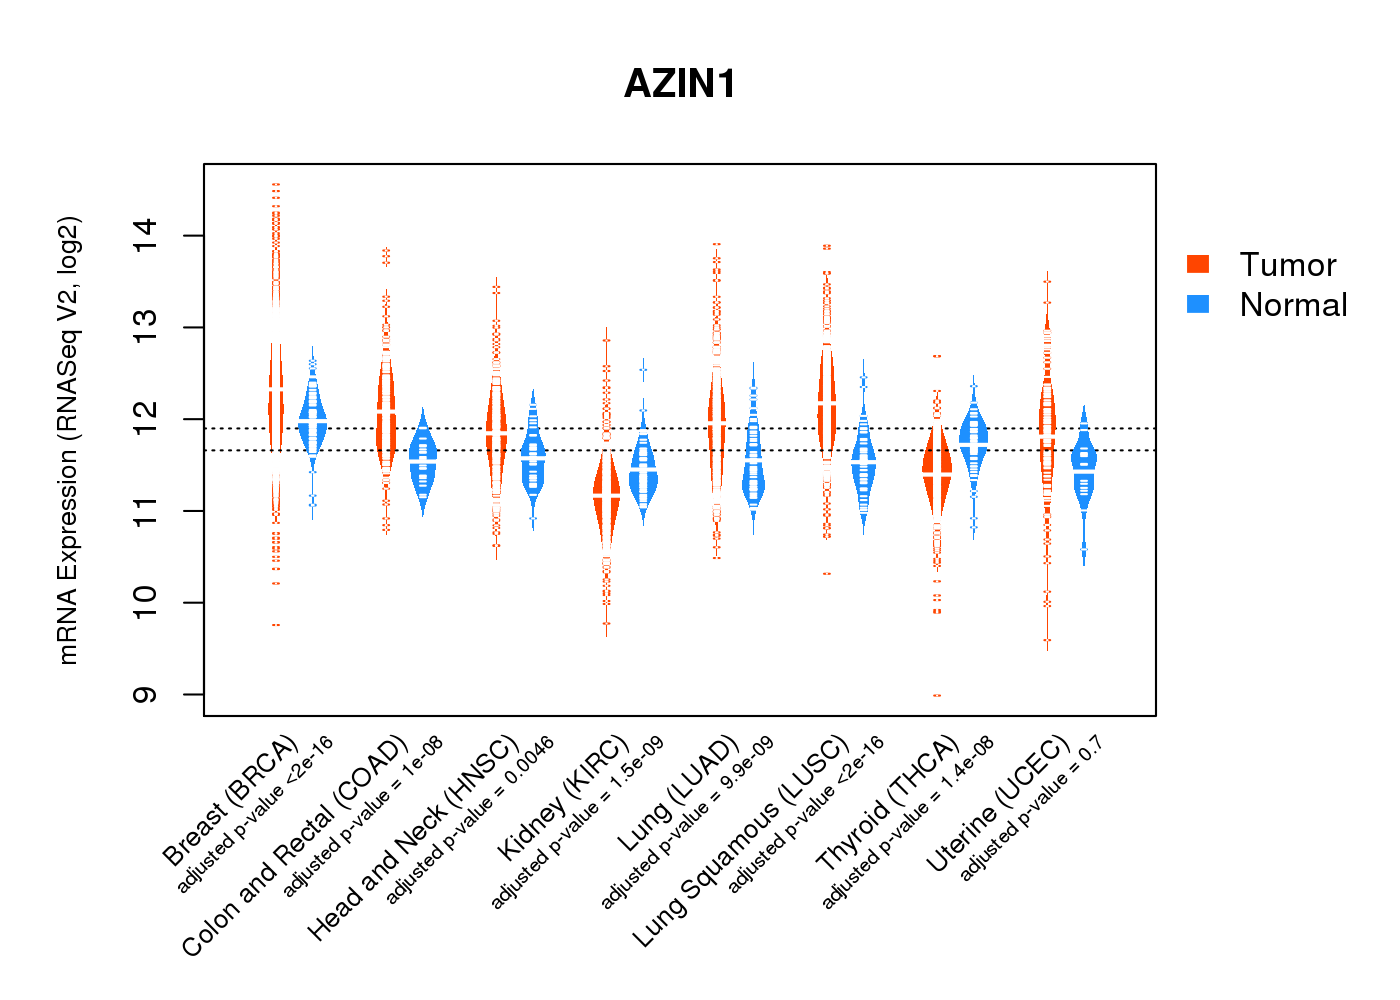
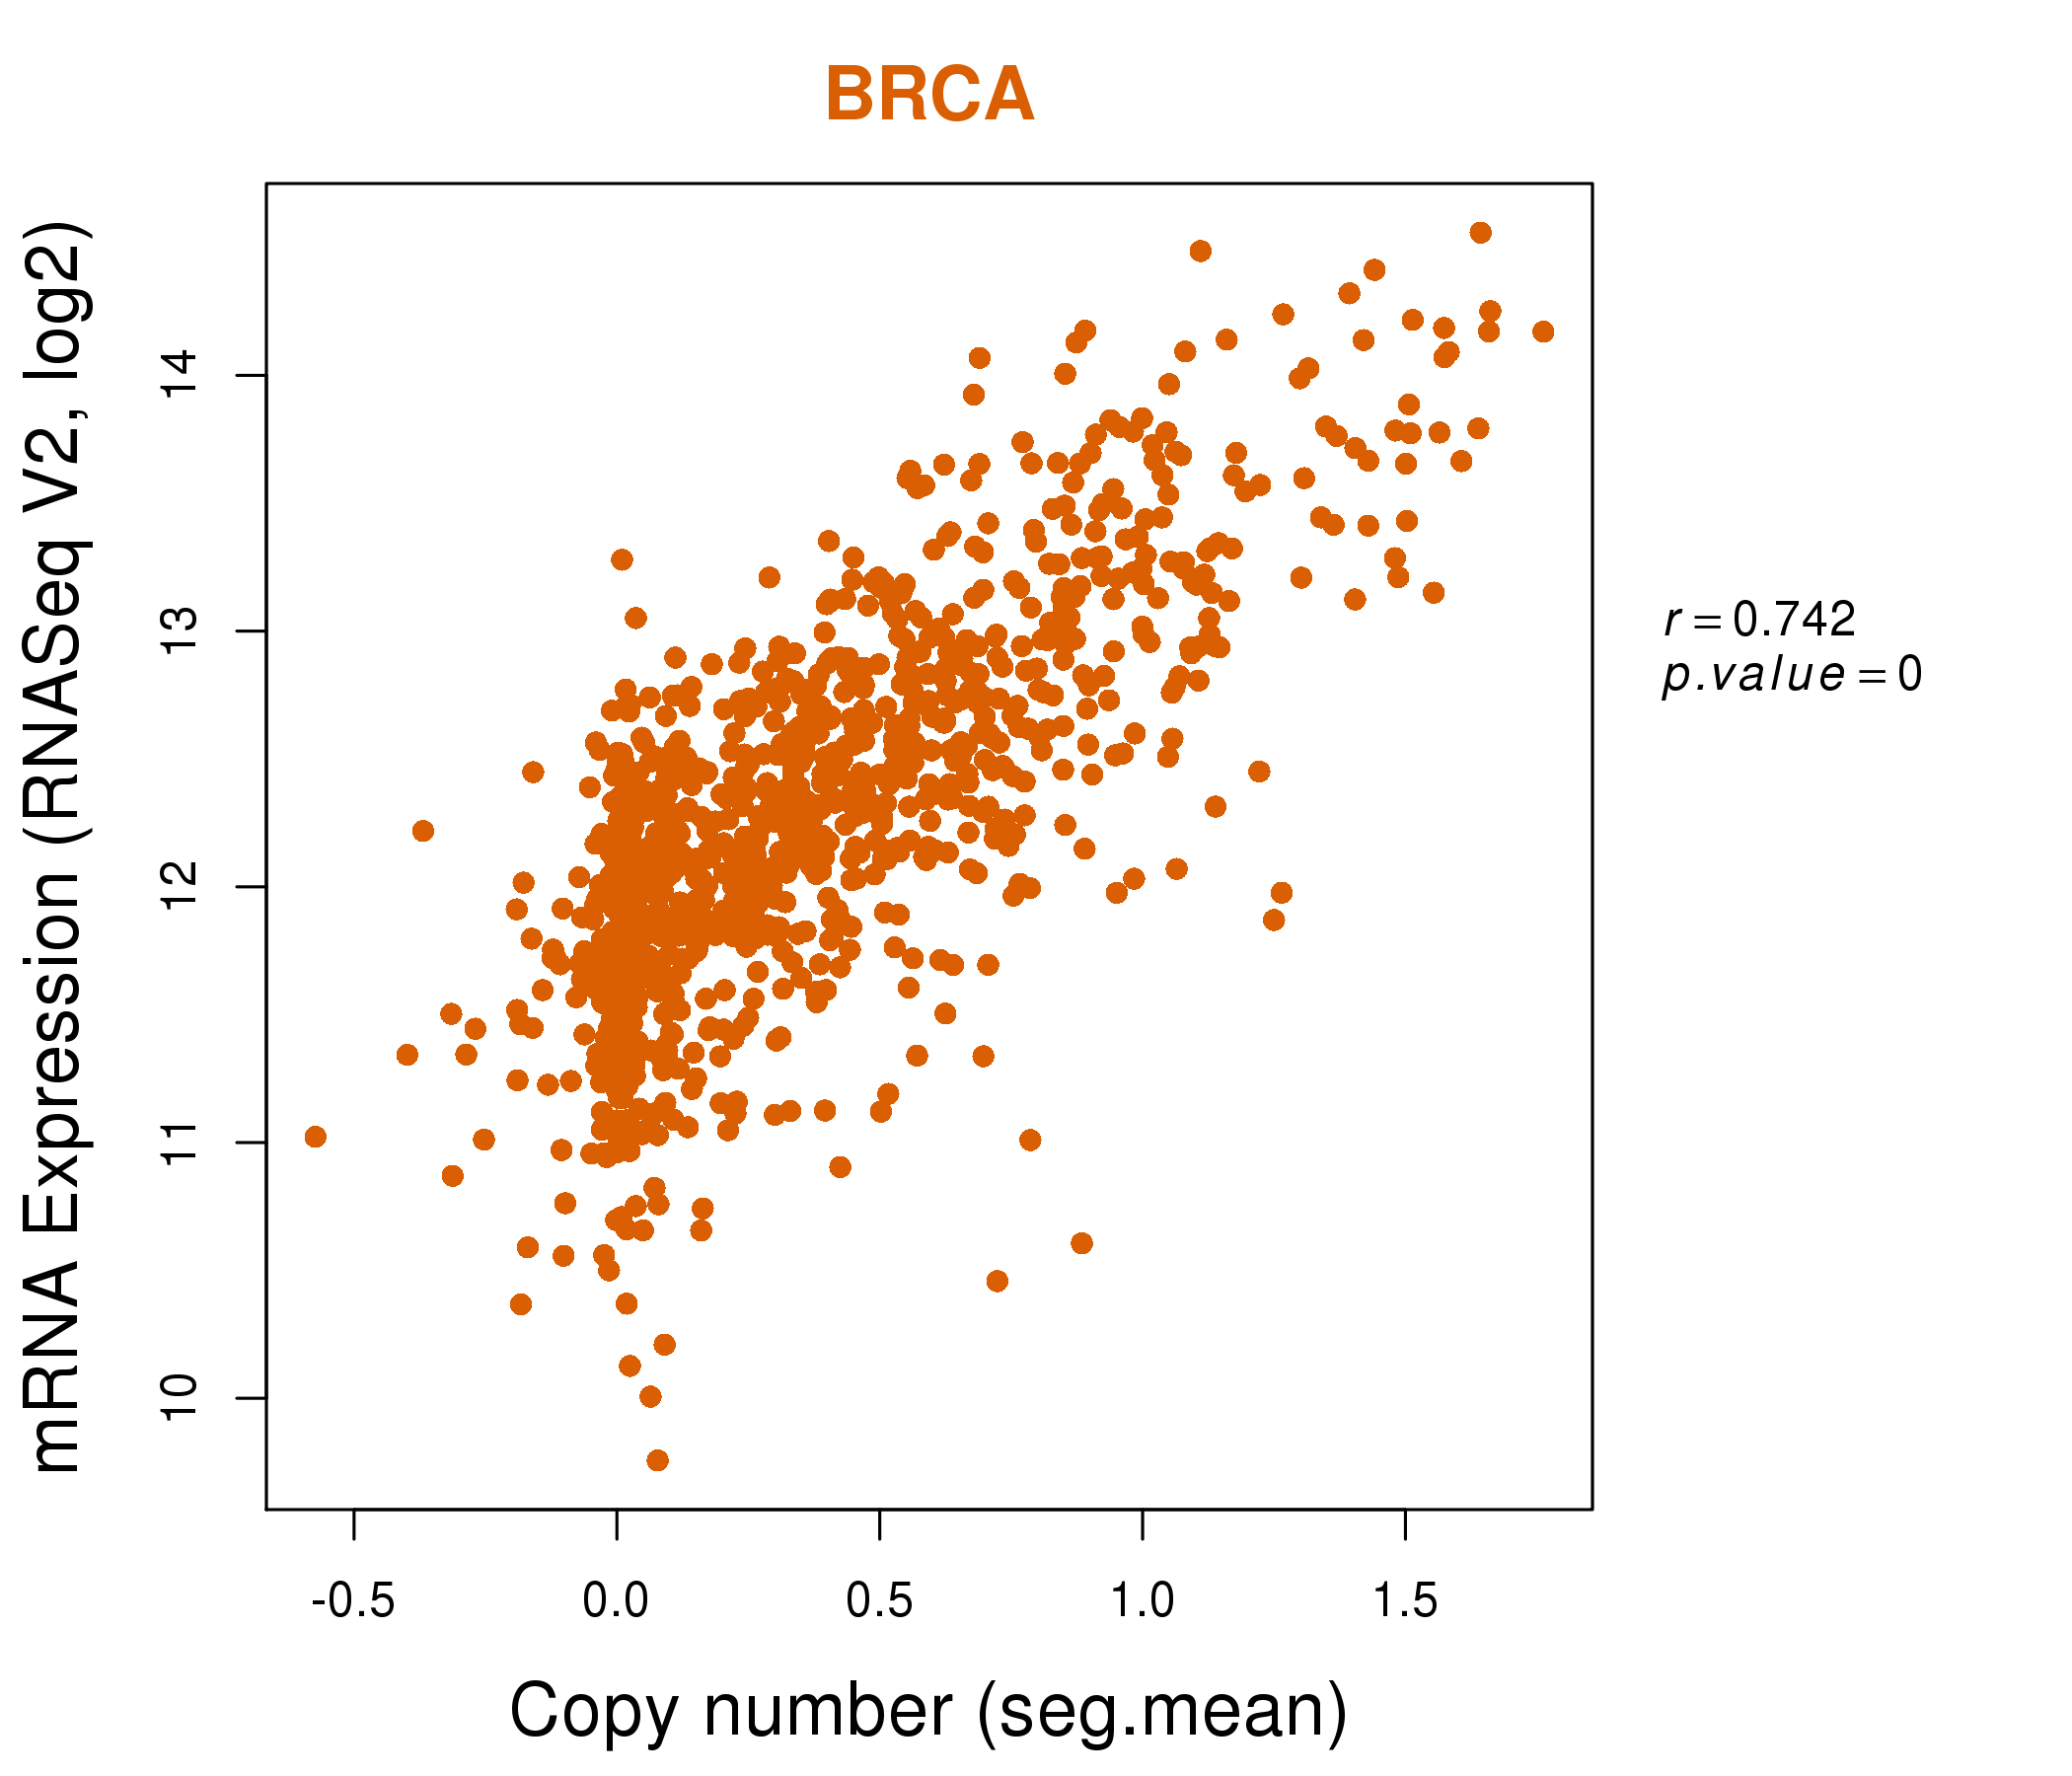
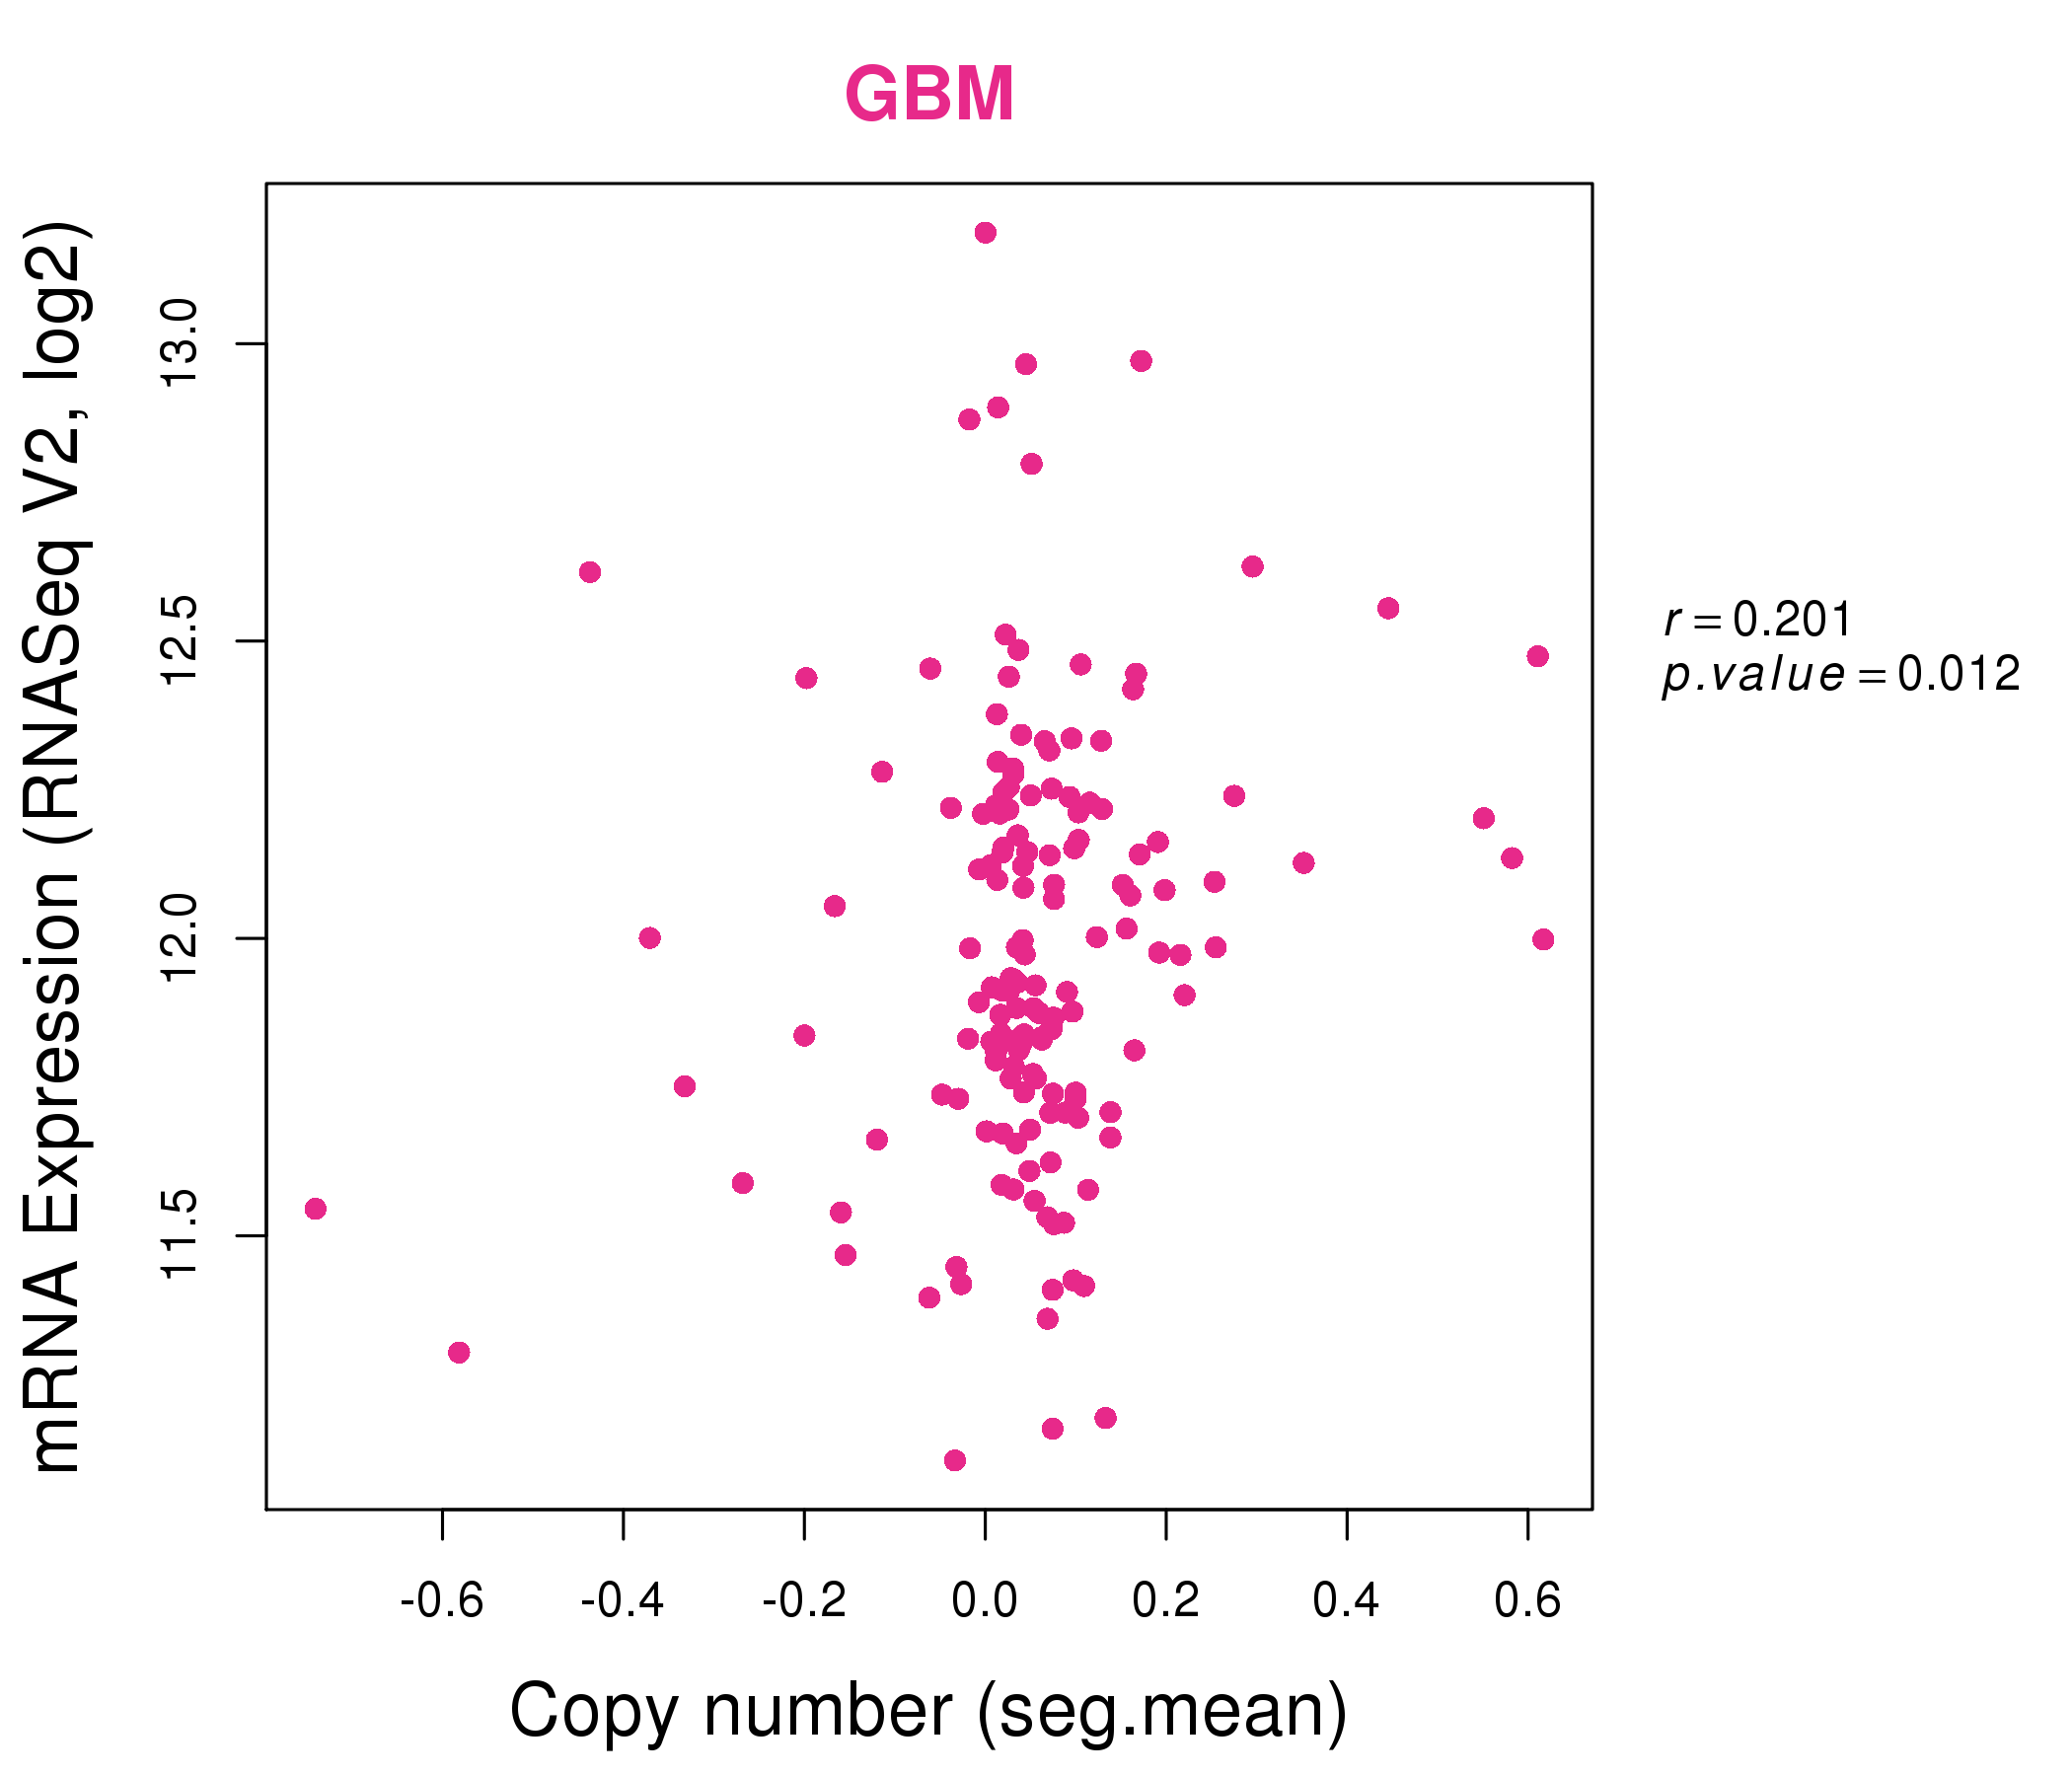
| * Normalized gene expression data of RNASeqV2 was extracted from TCGA using R package TCGA-Assembler. The URLs of all public data files on TCGA DCC data server were gathered at Jan-05-2015. Only eight cancer types have enough normal control samples for differential expression analysis. (t test, adjusted p<0.05 (using Benjamini-Hochberg FDR)) |
 |
| Top |
| * This plots show the correlation between CNV and gene expression. |
: Open all plots for all cancer types
 |
|
 |
|
| Top |
| Gene-Gene Network Information |
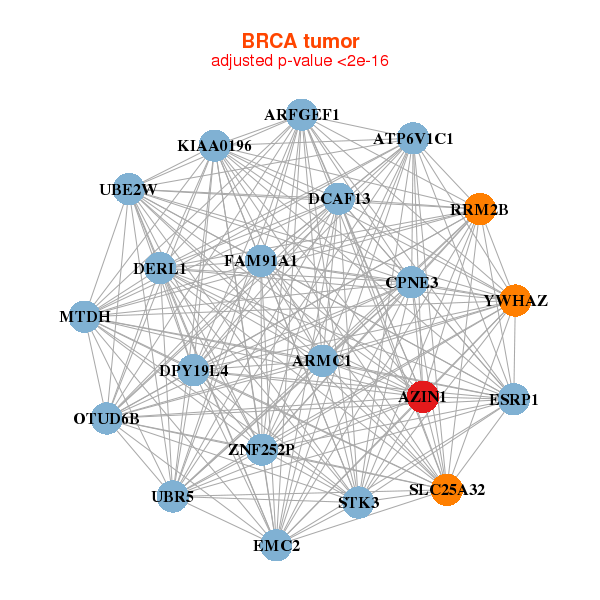
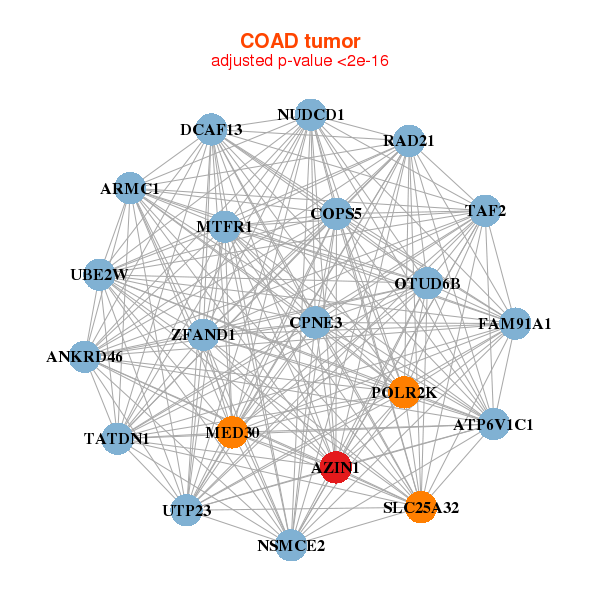
| * Co-Expression network figures were drawn using R package igraph. Only the top 20 genes with the highest correlations were shown. Red circle: input gene, orange circle: cell metabolism gene, sky circle: other gene |
: Open all plots for all cancer types
 |
|
| ARFGEF1,ARMC1,ATP6V1C1,AZIN1,CPNE3,DCAF13,DERL1, DPY19L4,ESRP1,FAM91A1,KIAA0196,MTDH,OTUD6B,RRM2B, SLC25A32,STK3,EMC2,UBE2W,UBR5,YWHAZ,ZNF252P | ARIH1,AZIN1,COG5,COPB1,CPNE3,DHX29,DIS3, KIAA0196,MBTPS2,MTDH,NBN,NMD3,PPP2R5E,SKIV2L2, SLC25A24,SMAD2,TM9SF3,UBE2W,UBQLN1,YTHDF3,ZFR |
 |
|
| ANKRD46,ARMC1,ATP6V1C1,AZIN1,COPS5,CPNE3,DCAF13, FAM91A1,MED30,MTFR1,NSMCE2,NUDCD1,OTUD6B,POLR2K, RAD21,SLC25A32,TAF2,TATDN1,UBE2W,UTP23,ZFAND1 | AIG1,ASAH2,AZIN1,SUCO,CRHR1,CRYZ,CYB5A, DDX1,FAM3C,GALK1,GCHFR,HACL1,MPP6,PAQR3, PIK3C2G,RNF141,SLC25A15,SLC2A12,SMURF2,TMEM41A,VNN1 |
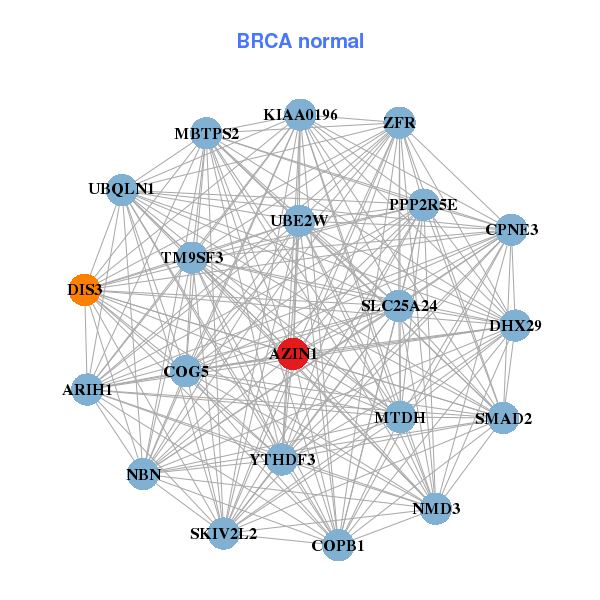
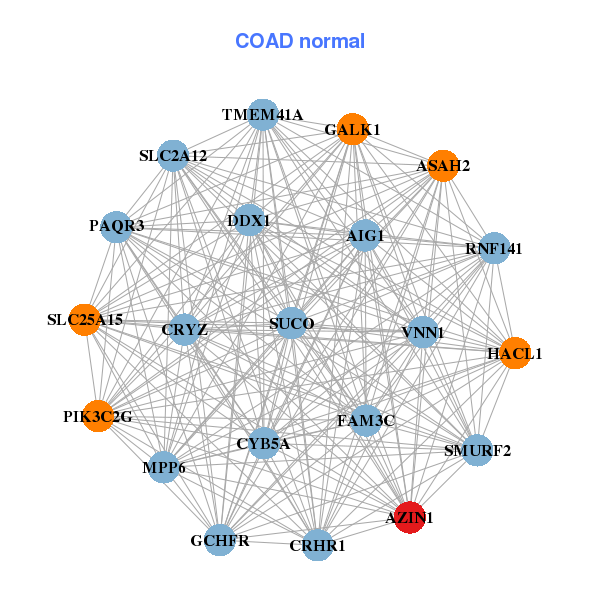
| * Co-Expression network figures were drawn using R package igraph. Only the top 20 genes with the highest correlations were shown. Red circle: input gene, orange circle: cell metabolism gene, sky circle: other gene |
: Open all plots for all cancer types
| Top |
: Open all interacting genes' information including KEGG pathway for all interacting genes from DAVID
| Top |
| Pharmacological Information for AZIN1 |
| There's no related Drug. |
| Top |
| Cross referenced IDs for AZIN1 |
| * We obtained these cross-references from Uniprot database. It covers 150 different DBs, 18 categories. http://www.uniprot.org/help/cross_references_section |
: Open all cross reference information
|
Copyright © 2016-Present - The Univsersity of Texas Health Science Center at Houston @ |