|
||||||||||||||||||||||||||||||||||||||||||||||||||||||||||||||||||||||||||||||||||||||||||||||||||||||||||||||||||||||||||||||||||||||||||||||||||||||||||||||||||||||||||||||||||||||||||||||||||||||||||||||||||||||||||||||||||||||||||||||||||||||||||||||||||||||||||||||||||||||||||||||||||||||||||||||||||||||||||
| |
| Phenotypic Information (metabolism pathway, cancer, disease, phenome) |
| |
| |
| Gene-Gene Network Information: Co-Expression Network, Interacting Genes & KEGG |
| |
|


| Gene Summary for MED15 |
| Basic gene info. | Gene symbol | MED15 |
| Gene name | mediator complex subunit 15 | |
| Synonyms | ARC105|CAG7A|CTG7A|PCQAP|TIG-1|TIG1|TNRC7 | |
| Cytomap | UCSC genome browser: 22q11.2 | |
| Genomic location | chr22 :20861885-20941919 | |
| Type of gene | protein-coding | |
| RefGenes | NM_001003891.2, NM_001293234.1,NM_001293235.1,NM_001293236.1,NM_001293237.1, NM_015889.4, | |
| Ensembl id | ENSG00000099917 | |
| Description | CTG repeat protein 7aPC2 (positive cofactor 2, multiprotein complex) glutamine/Q-rich-associated proteinPC2 glutamine/Q-rich-associated proteinPC2-glutamine-rich-associated proteinTPA inducible gene-1TPA inducible proteinTPA-inducible gene 1 protein | |
| Modification date | 20141207 | |
| dbXrefs | MIM : 607372 | |
| HGNC : HGNC | ||
| Ensembl : ENSG00000099917 | ||
| HPRD : 12117 | ||
| Vega : OTTHUMG00000150810 | ||
| Protein | UniProt: go to UniProt's Cross Reference DB Table | |
| Expression | CleanEX: HS_MED15 | |
| BioGPS: 51586 | ||
| Gene Expression Atlas: ENSG00000099917 | ||
| The Human Protein Atlas: ENSG00000099917 | ||
| Pathway | NCI Pathway Interaction Database: MED15 | |
| KEGG: MED15 | ||
| REACTOME: MED15 | ||
| ConsensusPathDB | ||
| Pathway Commons: MED15 | ||
| Metabolism | MetaCyc: MED15 | |
| HUMANCyc: MED15 | ||
| Regulation | Ensembl's Regulation: ENSG00000099917 | |
| miRBase: chr22 :20,861,885-20,941,919 | ||
| TargetScan: NM_001003891 | ||
| cisRED: ENSG00000099917 | ||
| Context | iHOP: MED15 | |
| cancer metabolism search in PubMed: MED15 | ||
| UCL Cancer Institute: MED15 | ||
| Assigned class in ccmGDB | C | |
| Top |
| Phenotypic Information for MED15(metabolism pathway, cancer, disease, phenome) |
| Cancer | CGAP: MED15 |
| Familial Cancer Database: MED15 | |
| * This gene is included in those cancer gene databases. |
|
|
|
|
|
| . | ||||||||||||||||||||||||||||||||||||||||||||||||||||||||||||||||||||||||||||||||||||||||||||||||||||||||||||||||||||||||||||||||||||||||||||||||||||||||||||||||||||||||||||||||||||||||||||||||||||||||||||||||||||||||||||||||||||||||||||||||||||||||||||||||||||||||||||||||||||||||||||||||||||||||||||||||||||
Oncogene 1 | Significant driver gene in | |||||||||||||||||||||||||||||||||||||||||||||||||||||||||||||||||||||||||||||||||||||||||||||||||||||||||||||||||||||||||||||||||||||||||||||||||||||||||||||||||||||||||||||||||||||||||||||||||||||||||||||||||||||||||||||||||||||||||||||||||||||||||||||||||||||||||||||||||||||||||||||||||||||||||||||||||||||||||
| cf) number; DB name 1 Oncogene; http://nar.oxfordjournals.org/content/35/suppl_1/D721.long, 2 Tumor Suppressor gene; https://bioinfo.uth.edu/TSGene/, 3 Cancer Gene Census; http://www.nature.com/nrc/journal/v4/n3/abs/nrc1299.html, 4 CancerGenes; http://nar.oxfordjournals.org/content/35/suppl_1/D721.long, 5 Network of Cancer Gene; http://ncg.kcl.ac.uk/index.php, 1Therapeutic Vulnerabilities in Cancer; http://cbio.mskcc.org/cancergenomics/statius/ |
| REACTOME_METABOLISM_OF_LIPIDS_AND_LIPOPROTEINS | |
| OMIM | |
| Orphanet | |
| Disease | KEGG Disease: MED15 |
| MedGen: MED15 (Human Medical Genetics with Condition) | |
| ClinVar: MED15 | |
| Phenotype | MGI: MED15 (International Mouse Phenotyping Consortium) |
| PhenomicDB: MED15 | |
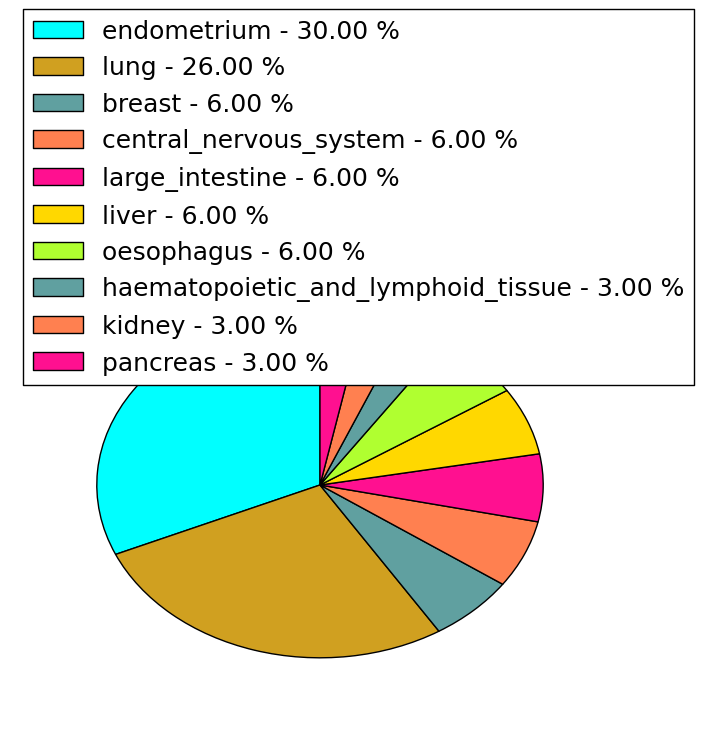
| Mutations for MED15 |
| * Under tables are showing count per each tissue to give us broad intuition about tissue specific mutation patterns.You can go to the detailed page for each mutation database's web site. |
| - Statistics for Tissue and Mutation type | Top |
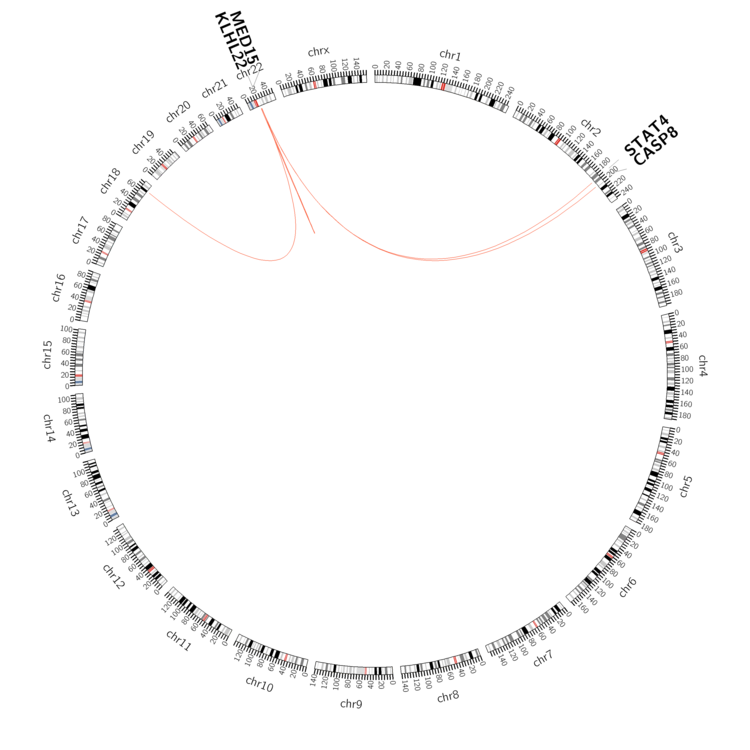 |
| - For Inter-chromosomal Variations |
| * Inter-chromosomal variantions includes 'interchromosomal amplicon to amplicon', 'interchromosomal amplicon to non-amplified dna', 'interchromosomal insertion', 'Interchromosomal unknown type'. |
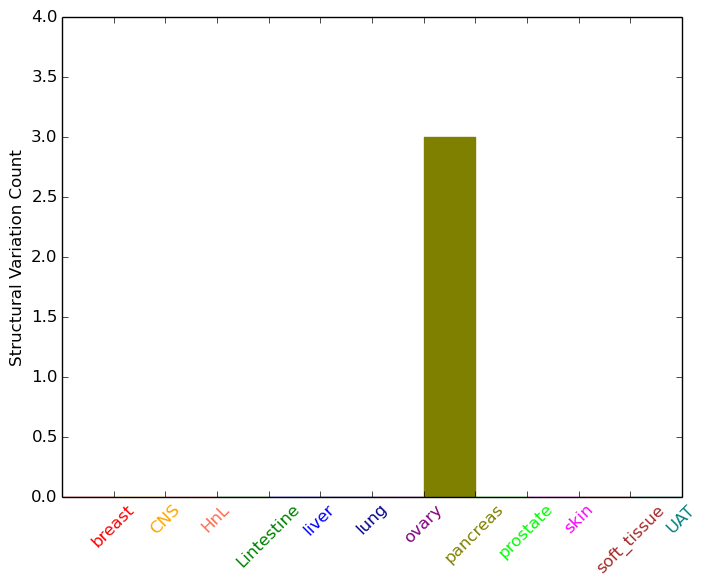 |
| - For Intra-chromosomal Variations |
| * Intra-chromosomal variantions includes 'intrachromosomal amplicon to amplicon', 'intrachromosomal amplicon to non-amplified dna', 'intrachromosomal deletion', 'intrachromosomal fold-back inversion', 'intrachromosomal inversion', 'intrachromosomal tandem duplication', 'Intrachromosomal unknown type', 'intrachromosomal with inverted orientation', 'intrachromosomal with non-inverted orientation'. |
 |
| Sample | Symbol_a | Chr_a | Start_a | End_a | Symbol_b | Chr_b | Start_b | End_b |
| ovary | MED15 | chr22 | 20894360 | 20894380 | KLHL22 | chr22 | 20828830 | 20828850 |
| ovary | MED15 | chr22 | 20902091 | 20902111 | chr22 | 19632321 | 19632341 | |
| ovary | MED15 | chr22 | 20920146 | 20920166 | MED15 | chr22 | 20922582 | 20922602 |
| pancreas | MED15 | chr22 | 20879731 | 20879751 | chr22 | 21018928 | 21018948 | |
| pancreas | MED15 | chr22 | 20915323 | 20915343 | MED15 | chr22 | 20915804 | 20915824 |
| cf) Tissue number; Tissue name (1;Breast, 2;Central_nervous_system, 3;Haematopoietic_and_lymphoid_tissue, 4;Large_intestine, 5;Liver, 6;Lung, 7;Ovary, 8;Pancreas, 9;Prostate, 10;Skin, 11;Soft_tissue, 12;Upper_aerodigestive_tract) |
| * From mRNA Sanger sequences, Chitars2.0 arranged chimeric transcripts. This table shows MED15 related fusion information. |
| ID | Head Gene | Tail Gene | Accession | Gene_a | qStart_a | qEnd_a | Chromosome_a | tStart_a | tEnd_a | Gene_a | qStart_a | qEnd_a | Chromosome_a | tStart_a | tEnd_a |
| BI051034 | MED15 | 5 | 110 | 22 | 20939460 | 20939565 | MED15 | 106 | 165 | 22 | 20939403 | 20939462 | |
| CF125171 | RPN2 | 1 | 104 | 20 | 35835739 | 35835842 | MED15 | 97 | 666 | 22 | 20861958 | 20918847 | |
| DB259160 | FAM46A | 1 | 180 | 6 | 82462217 | 82462396 | MED15 | 175 | 579 | 22 | 20937008 | 20938693 | |
| BG003281 | EWSR1 | 3 | 64 | 22 | 29695685 | 29695746 | MED15 | 53 | 210 | 22 | 20928982 | 20929139 | |
| DB193761 | RPLP2 | 1 | 245 | 11 | 809968 | 811645 | MED15 | 240 | 477 | 22 | 20922848 | 20937156 | |
| BF999641 | MED15 | 1 | 163 | 22 | 20923723 | 20923885 | MED15 | 159 | 454 | 22 | 20928720 | 20929015 | |
| BG003287 | EWSR1 | 8 | 69 | 22 | 29695685 | 29695746 | MED15 | 58 | 215 | 22 | 20928982 | 20929139 | |
| BG003288 | EWSR1 | 11 | 72 | 22 | 29695685 | 29695746 | MED15 | 61 | 217 | 22 | 20928982 | 20929139 | |
| BF991563 | MED15 | 15 | 134 | 22 | 20928838 | 20928959 | TRIM40 | 128 | 178 | 6 | 1445388 | 1445438 | |
| Top |
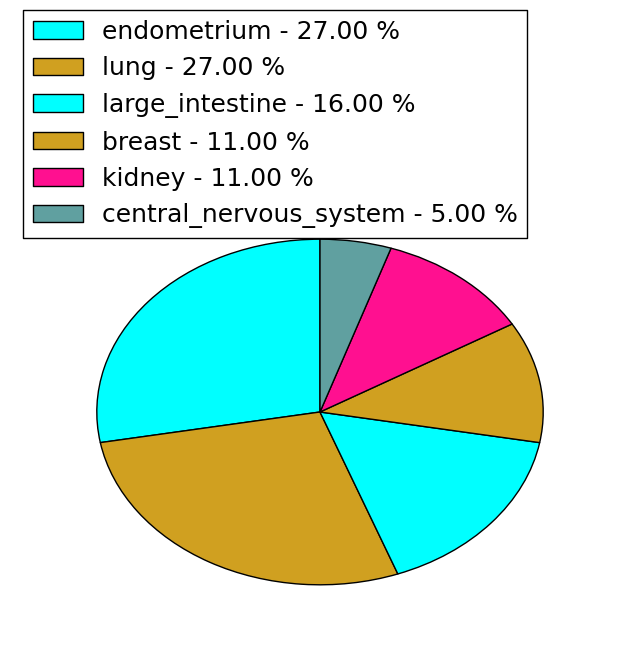
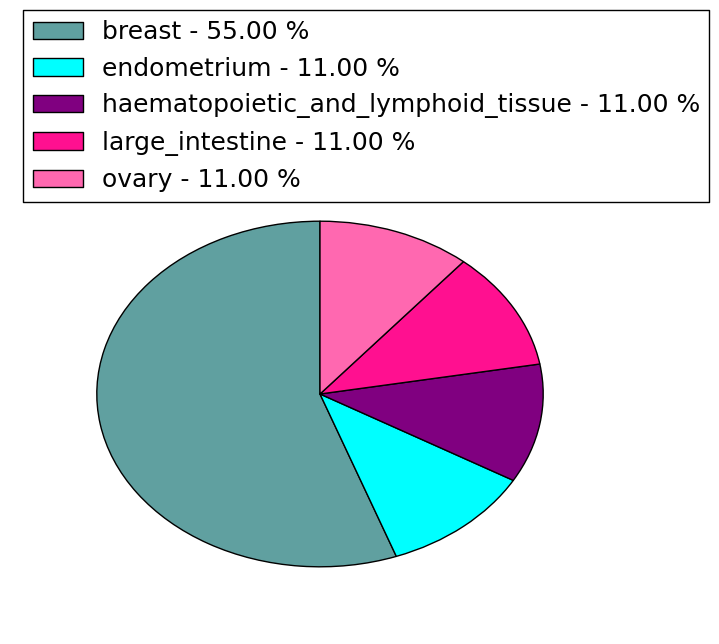
| Mutation type/ Tissue ID | brca | cns | cerv | endome | haematopo | kidn | Lintest | liver | lung | ns | ovary | pancre | prost | skin | stoma | thyro | urina | |||
| Total # sample | 1 | 1 | 1 | 1 | 2 | |||||||||||||||
| GAIN (# sample) | 1 | 1 | 1 | 2 | ||||||||||||||||
| LOSS (# sample) | 1 |
| cf) Tissue ID; Tissue type (1; Breast, 2; Central_nervous_system, 3; Cervix, 4; Endometrium, 5; Haematopoietic_and_lymphoid_tissue, 6; Kidney, 7; Large_intestine, 8; Liver, 9; Lung, 10; NS, 11; Ovary, 12; Pancreas, 13; Prostate, 14; Skin, 15; Stomach, 16; Thyroid, 17; Urinary_tract) |
| Top |
|
 |
| Top |
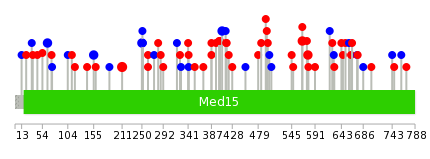
| Stat. for Non-Synonymous SNVs (# total SNVs=30) | (# total SNVs=18) |
 |  |
(# total SNVs=5) | (# total SNVs=9) |
 |  |
| Top |
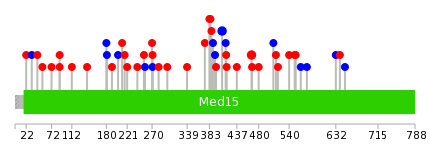
| * When you move the cursor on each content, you can see more deailed mutation information on the Tooltip. Those are primary_site,primary_histology,mutation(aa),pubmedID. |
| GRCh37 position | Mutation(aa) | Unique sampleID count |
| chr22:20920813-20920814 | p.Q250_Q251insQ | 8 |
| chr22:20918916-20918918 | p.Q211delQ | 3 |
| chr22:20918772-20918772 | p.Q163* | 2 |
| chr22:20905758-20905758 | p.I64I | 2 |
| chr22:20920813-20920813 | p.Q250Q | 2 |
| chr22:20937642-20937642 | p.M566I | 2 |
| chr22:20937674-20937674 | p.S577L | 2 |
| chr22:20929471-20929471 | p.S408S | 2 |
| chr22:20918750-20918750 | p.L155L | 2 |
| chr22:20920850-20920851 | p.A263_L264insAA | 1 |
| Top |
|
 |
| Point Mutation/ Tissue ID | 1 | 2 | 3 | 4 | 5 | 6 | 7 | 8 | 9 | 10 | 11 | 12 | 13 | 14 | 15 | 16 | 17 | 18 | 19 | 20 |
| # sample | 4 | 1 | 4 | 1 | 1 | 3 | 6 | 2 | 2 | 6 | 7 | 11 | ||||||||
| # mutation | 4 | 1 | 4 | 1 | 1 | 3 | 6 | 2 | 2 | 6 | 8 | 13 | ||||||||
| nonsynonymous SNV | 4 | 1 | 2 | 1 | 1 | 1 | 5 | 1 | 2 | 3 | 5 | 9 | ||||||||
| synonymous SNV | 2 | 2 | 1 | 1 | 3 | 3 | 4 |
| cf) Tissue ID; Tissue type (1; BLCA[Bladder Urothelial Carcinoma], 2; BRCA[Breast invasive carcinoma], 3; CESC[Cervical squamous cell carcinoma and endocervical adenocarcinoma], 4; COAD[Colon adenocarcinoma], 5; GBM[Glioblastoma multiforme], 6; Glioma Low Grade, 7; HNSC[Head and Neck squamous cell carcinoma], 8; KICH[Kidney Chromophobe], 9; KIRC[Kidney renal clear cell carcinoma], 10; KIRP[Kidney renal papillary cell carcinoma], 11; LAML[Acute Myeloid Leukemia], 12; LUAD[Lung adenocarcinoma], 13; LUSC[Lung squamous cell carcinoma], 14; OV[Ovarian serous cystadenocarcinoma ], 15; PAAD[Pancreatic adenocarcinoma], 16; PRAD[Prostate adenocarcinoma], 17; SKCM[Skin Cutaneous Melanoma], 18:STAD[Stomach adenocarcinoma], 19:THCA[Thyroid carcinoma], 20:UCEC[Uterine Corpus Endometrial Carcinoma]) |
| Top |
| * We represented just top 10 SNVs. When you move the cursor on each content, you can see more deailed mutation information on the Tooltip. Those are primary_site, primary_histology, mutation(aa), pubmedID. |
| Genomic Position | Mutation(aa) | Unique sampleID count |
| chr22:20929471 | p.S408S | 2 |
| chr22:20937674 | p.S466L,MED15 | 2 |
| chr22:20909246 | p.T387A | 1 |
| chr22:20940112 | p.P509P,MED15 | 1 |
| chr22:20920999 | p.A88S,MED15 | 1 |
| chr22:20929492 | p.H396R | 1 |
| chr22:20937677 | p.V514I,MED15 | 1 |
| chr22:20909319 | p.Q180Q,MED15 | 1 |
| chr22:20940876 | p.I518T,MED15 | 1 |
| chr22:20921038 | p.Q181Q,MED15 | 1 |
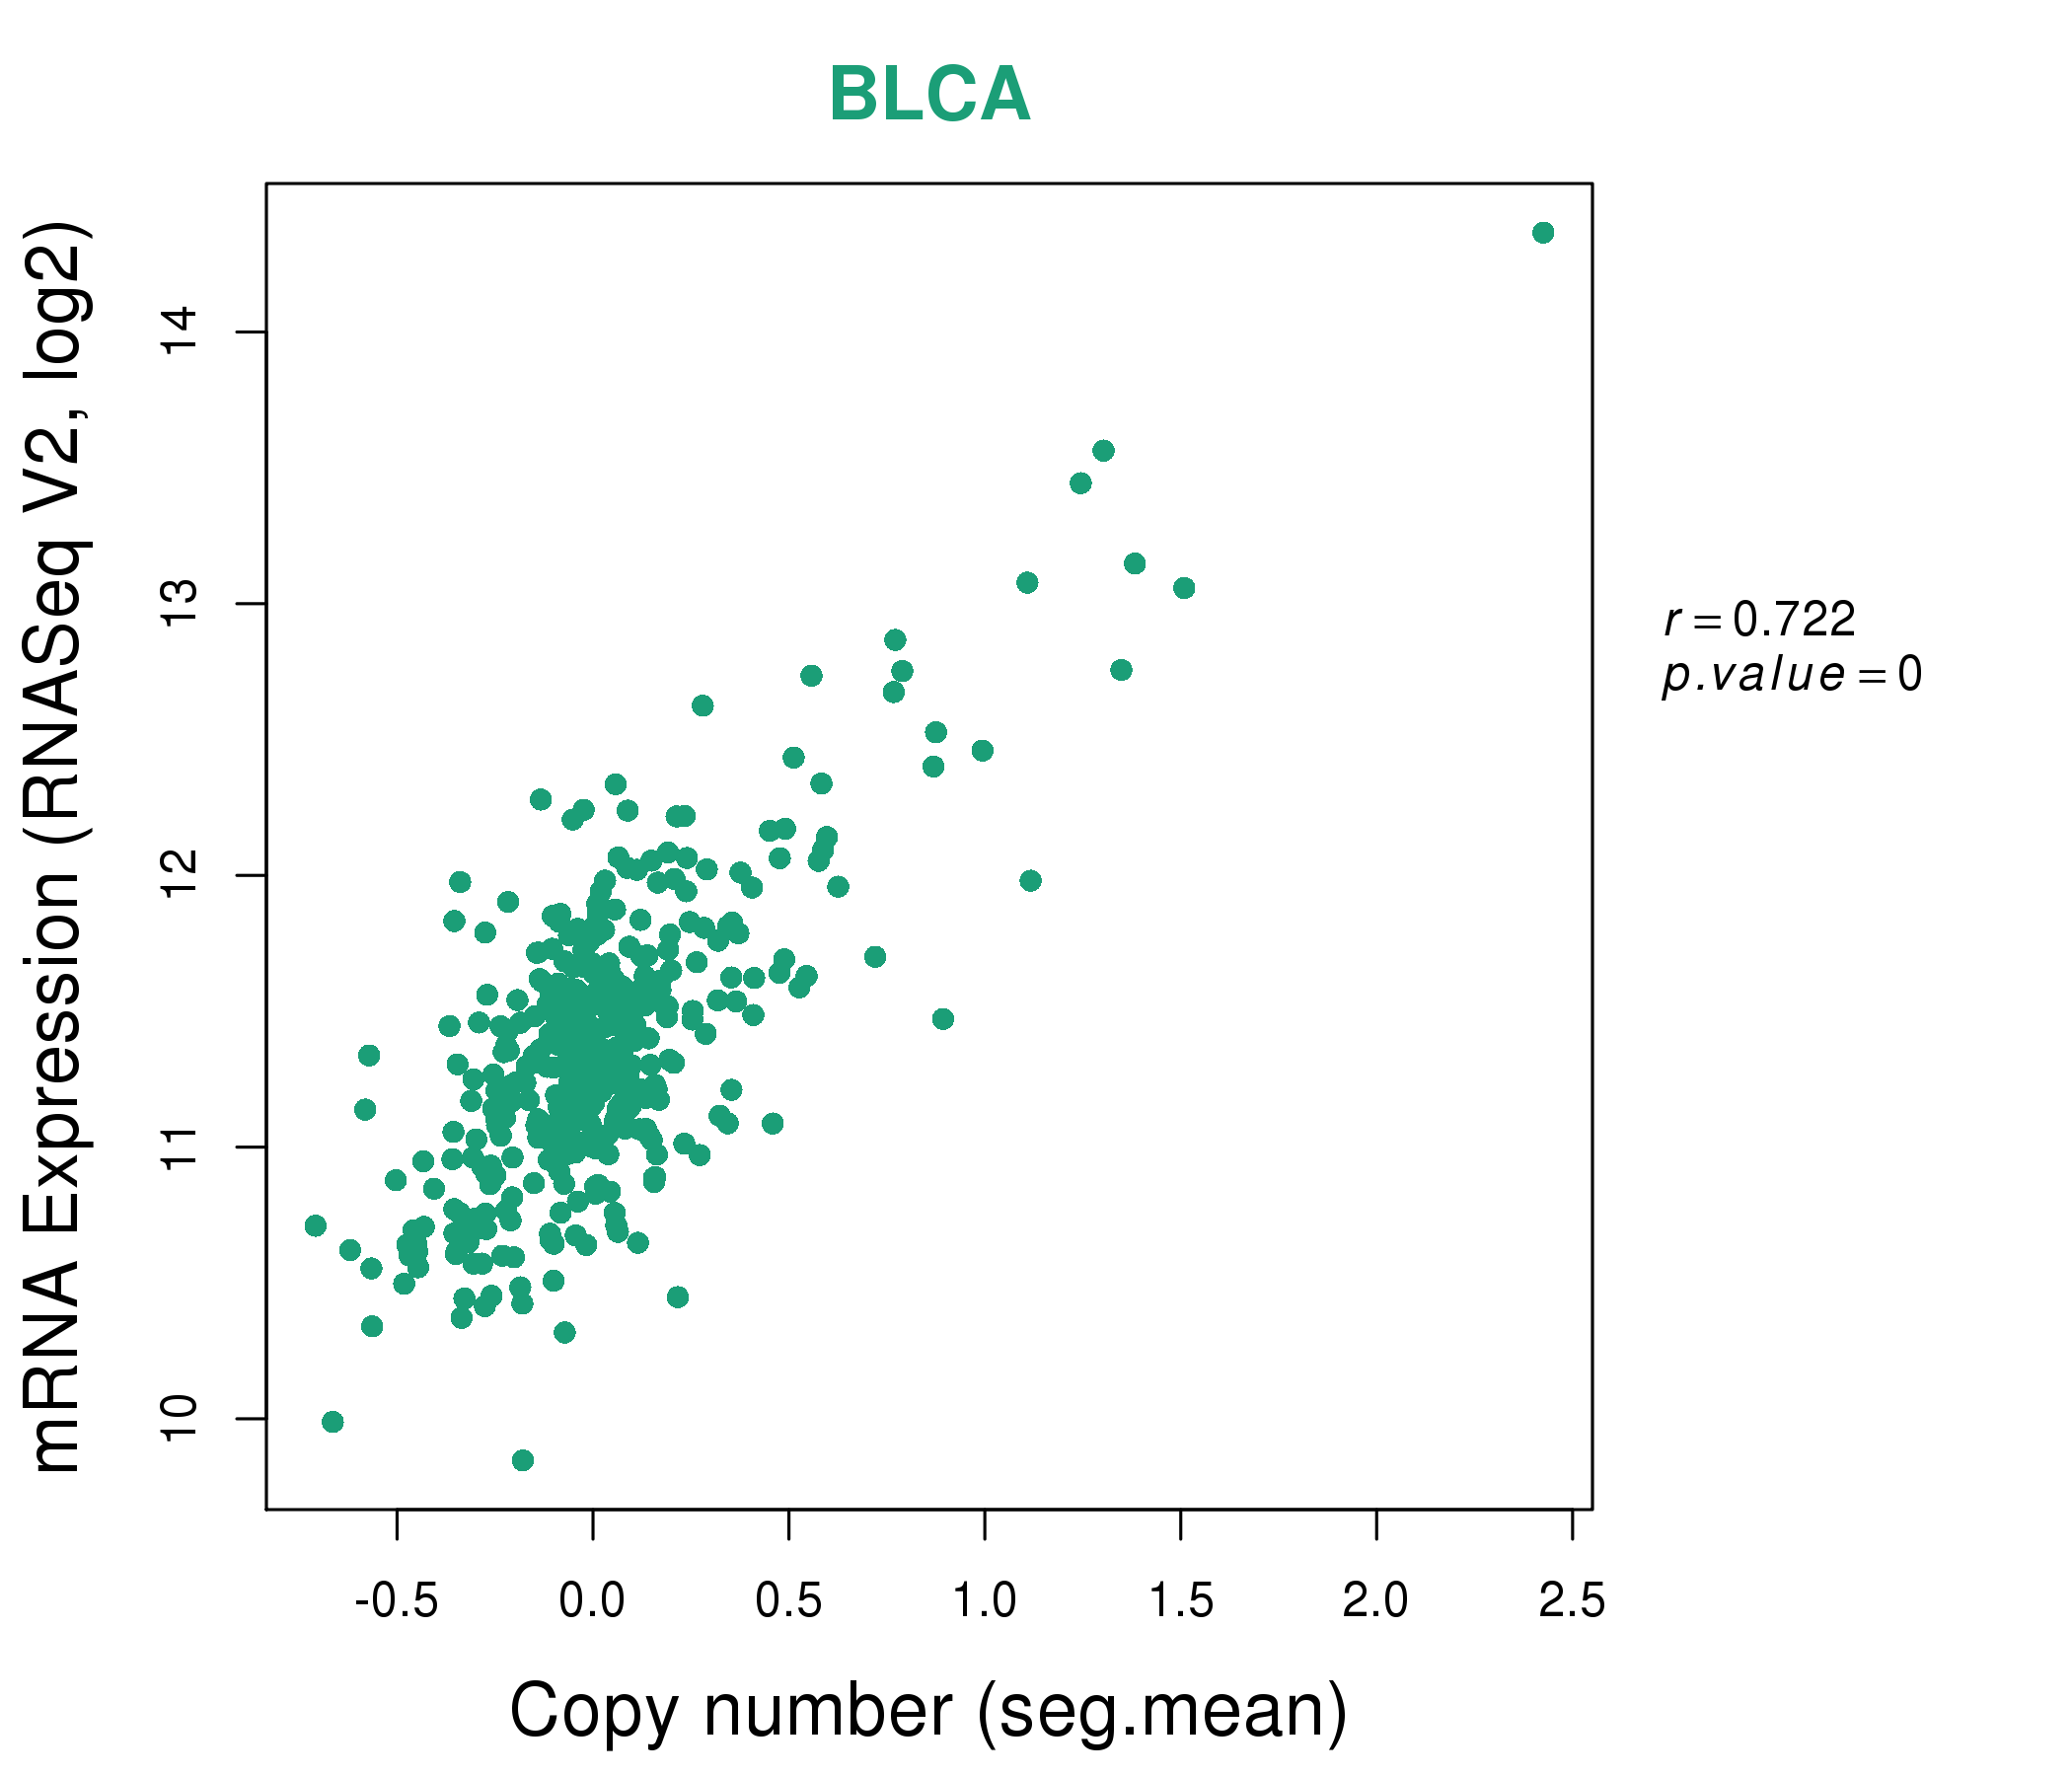
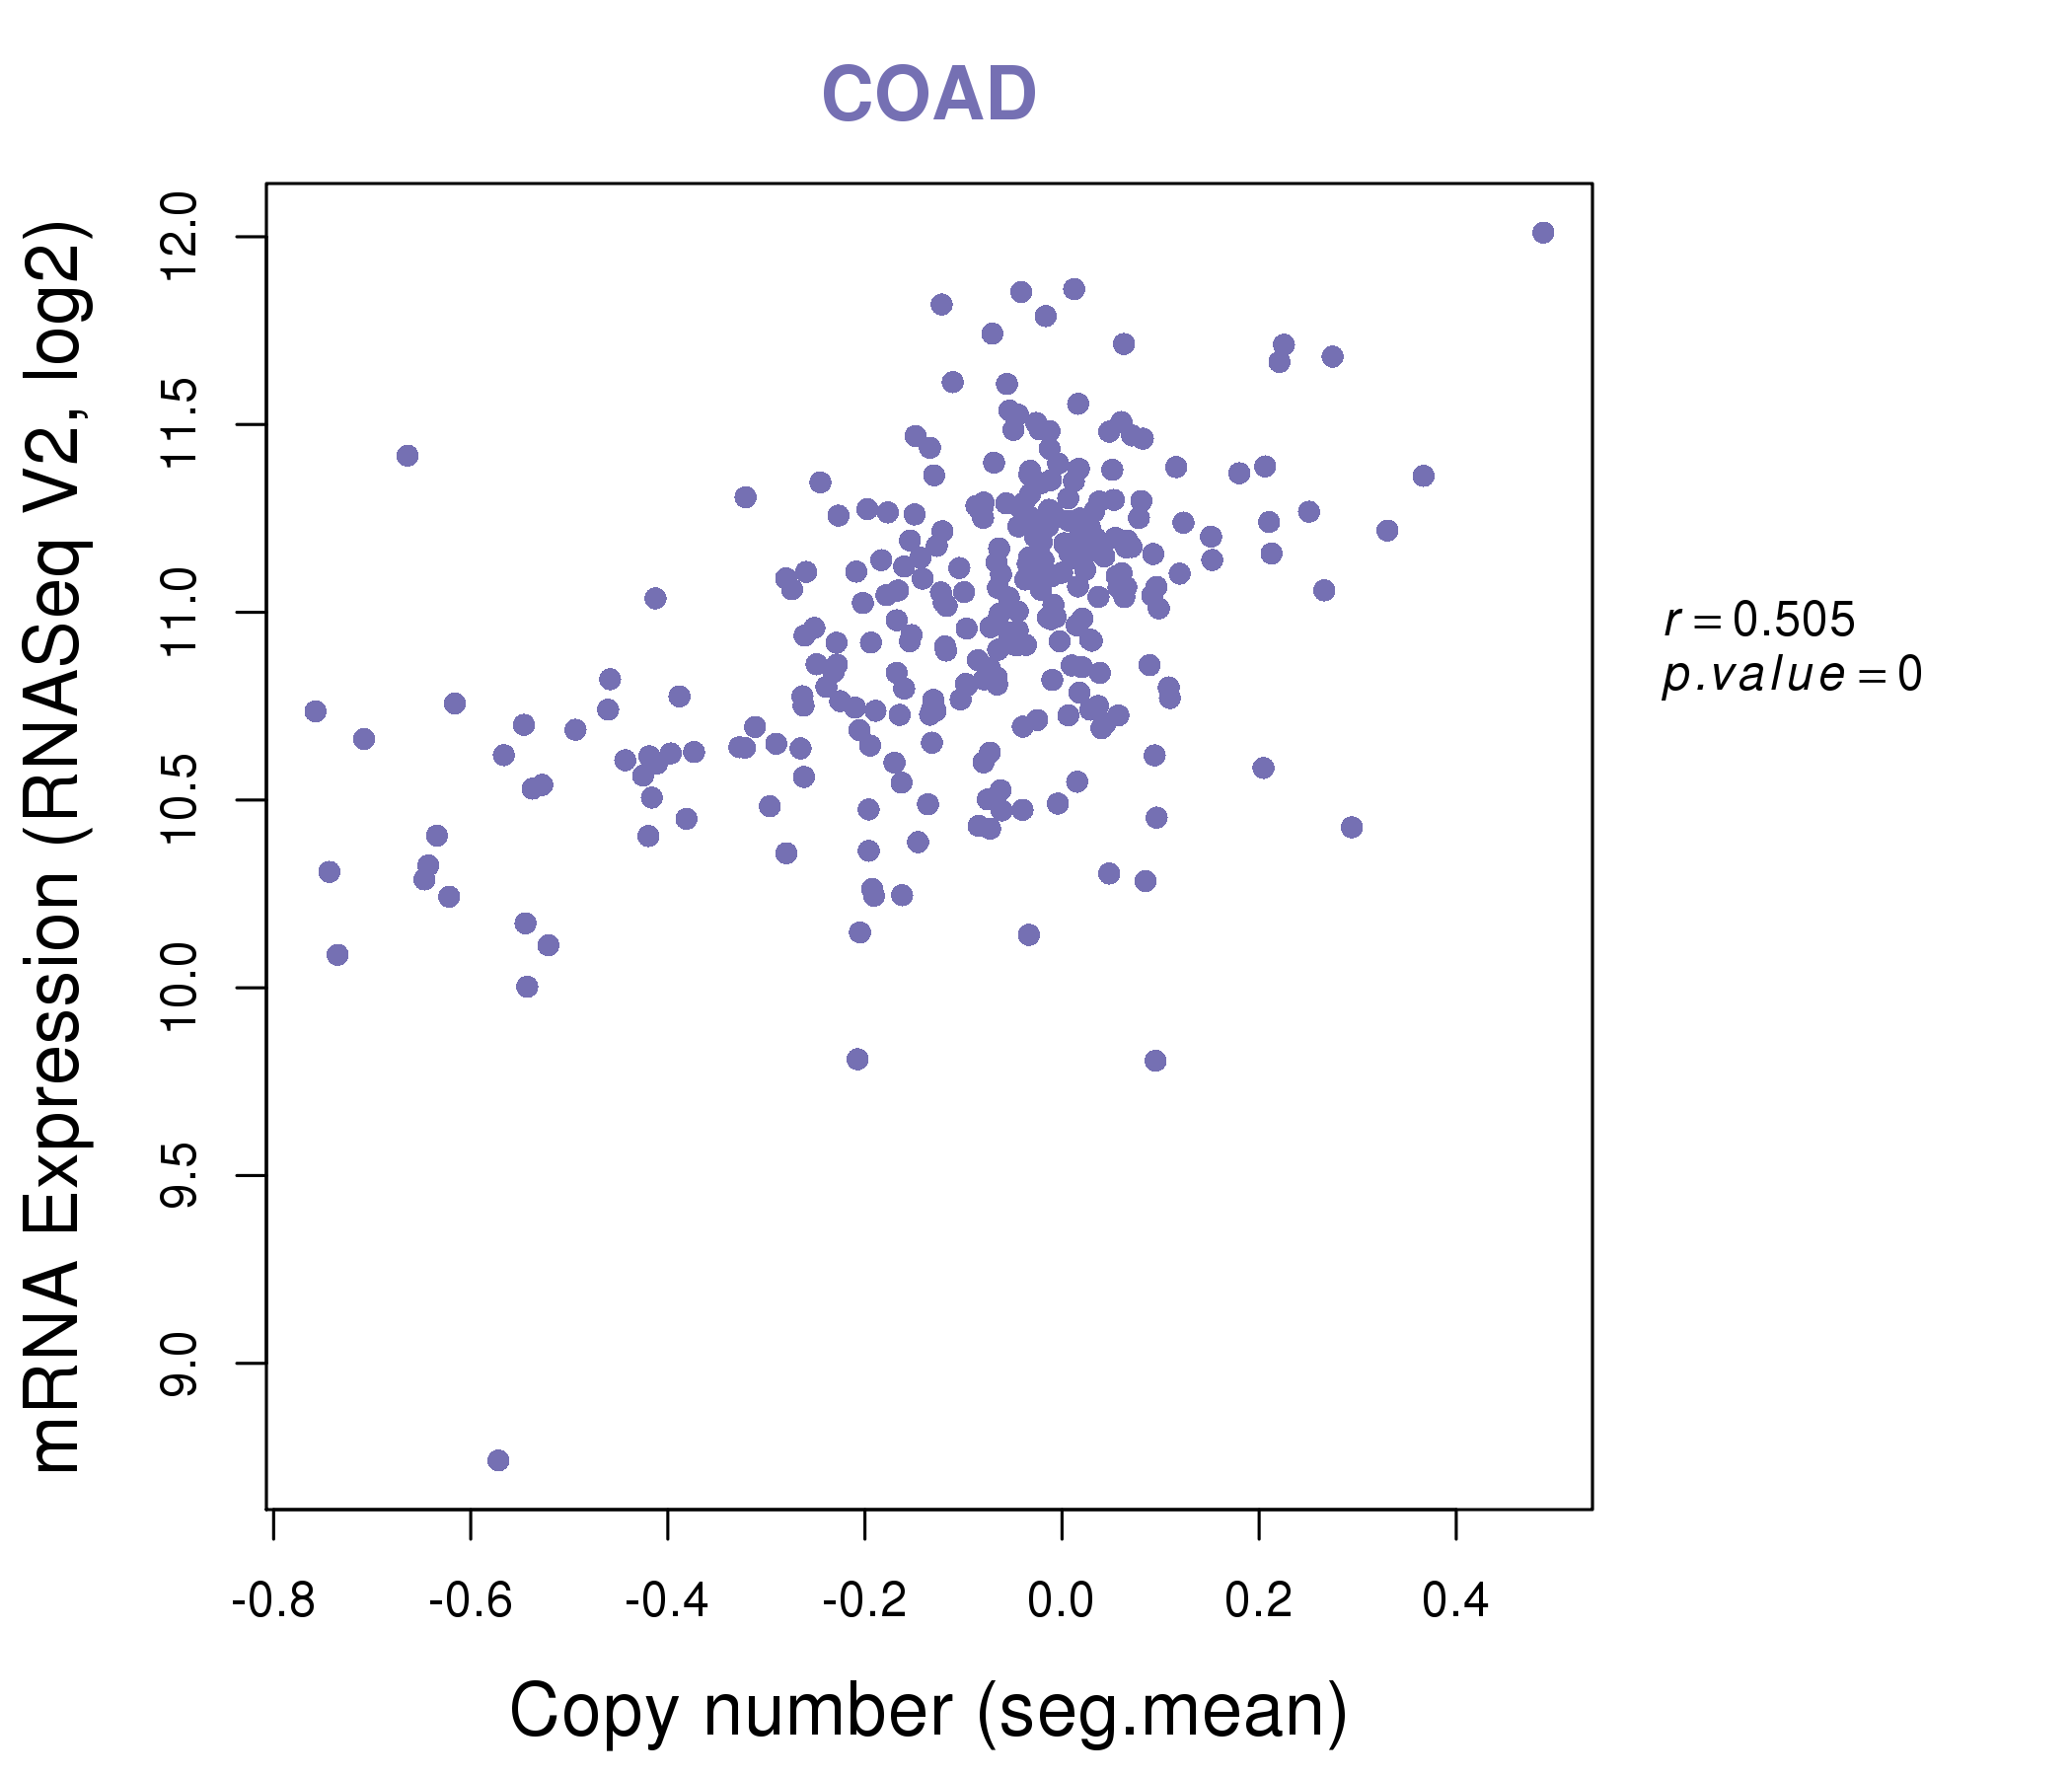
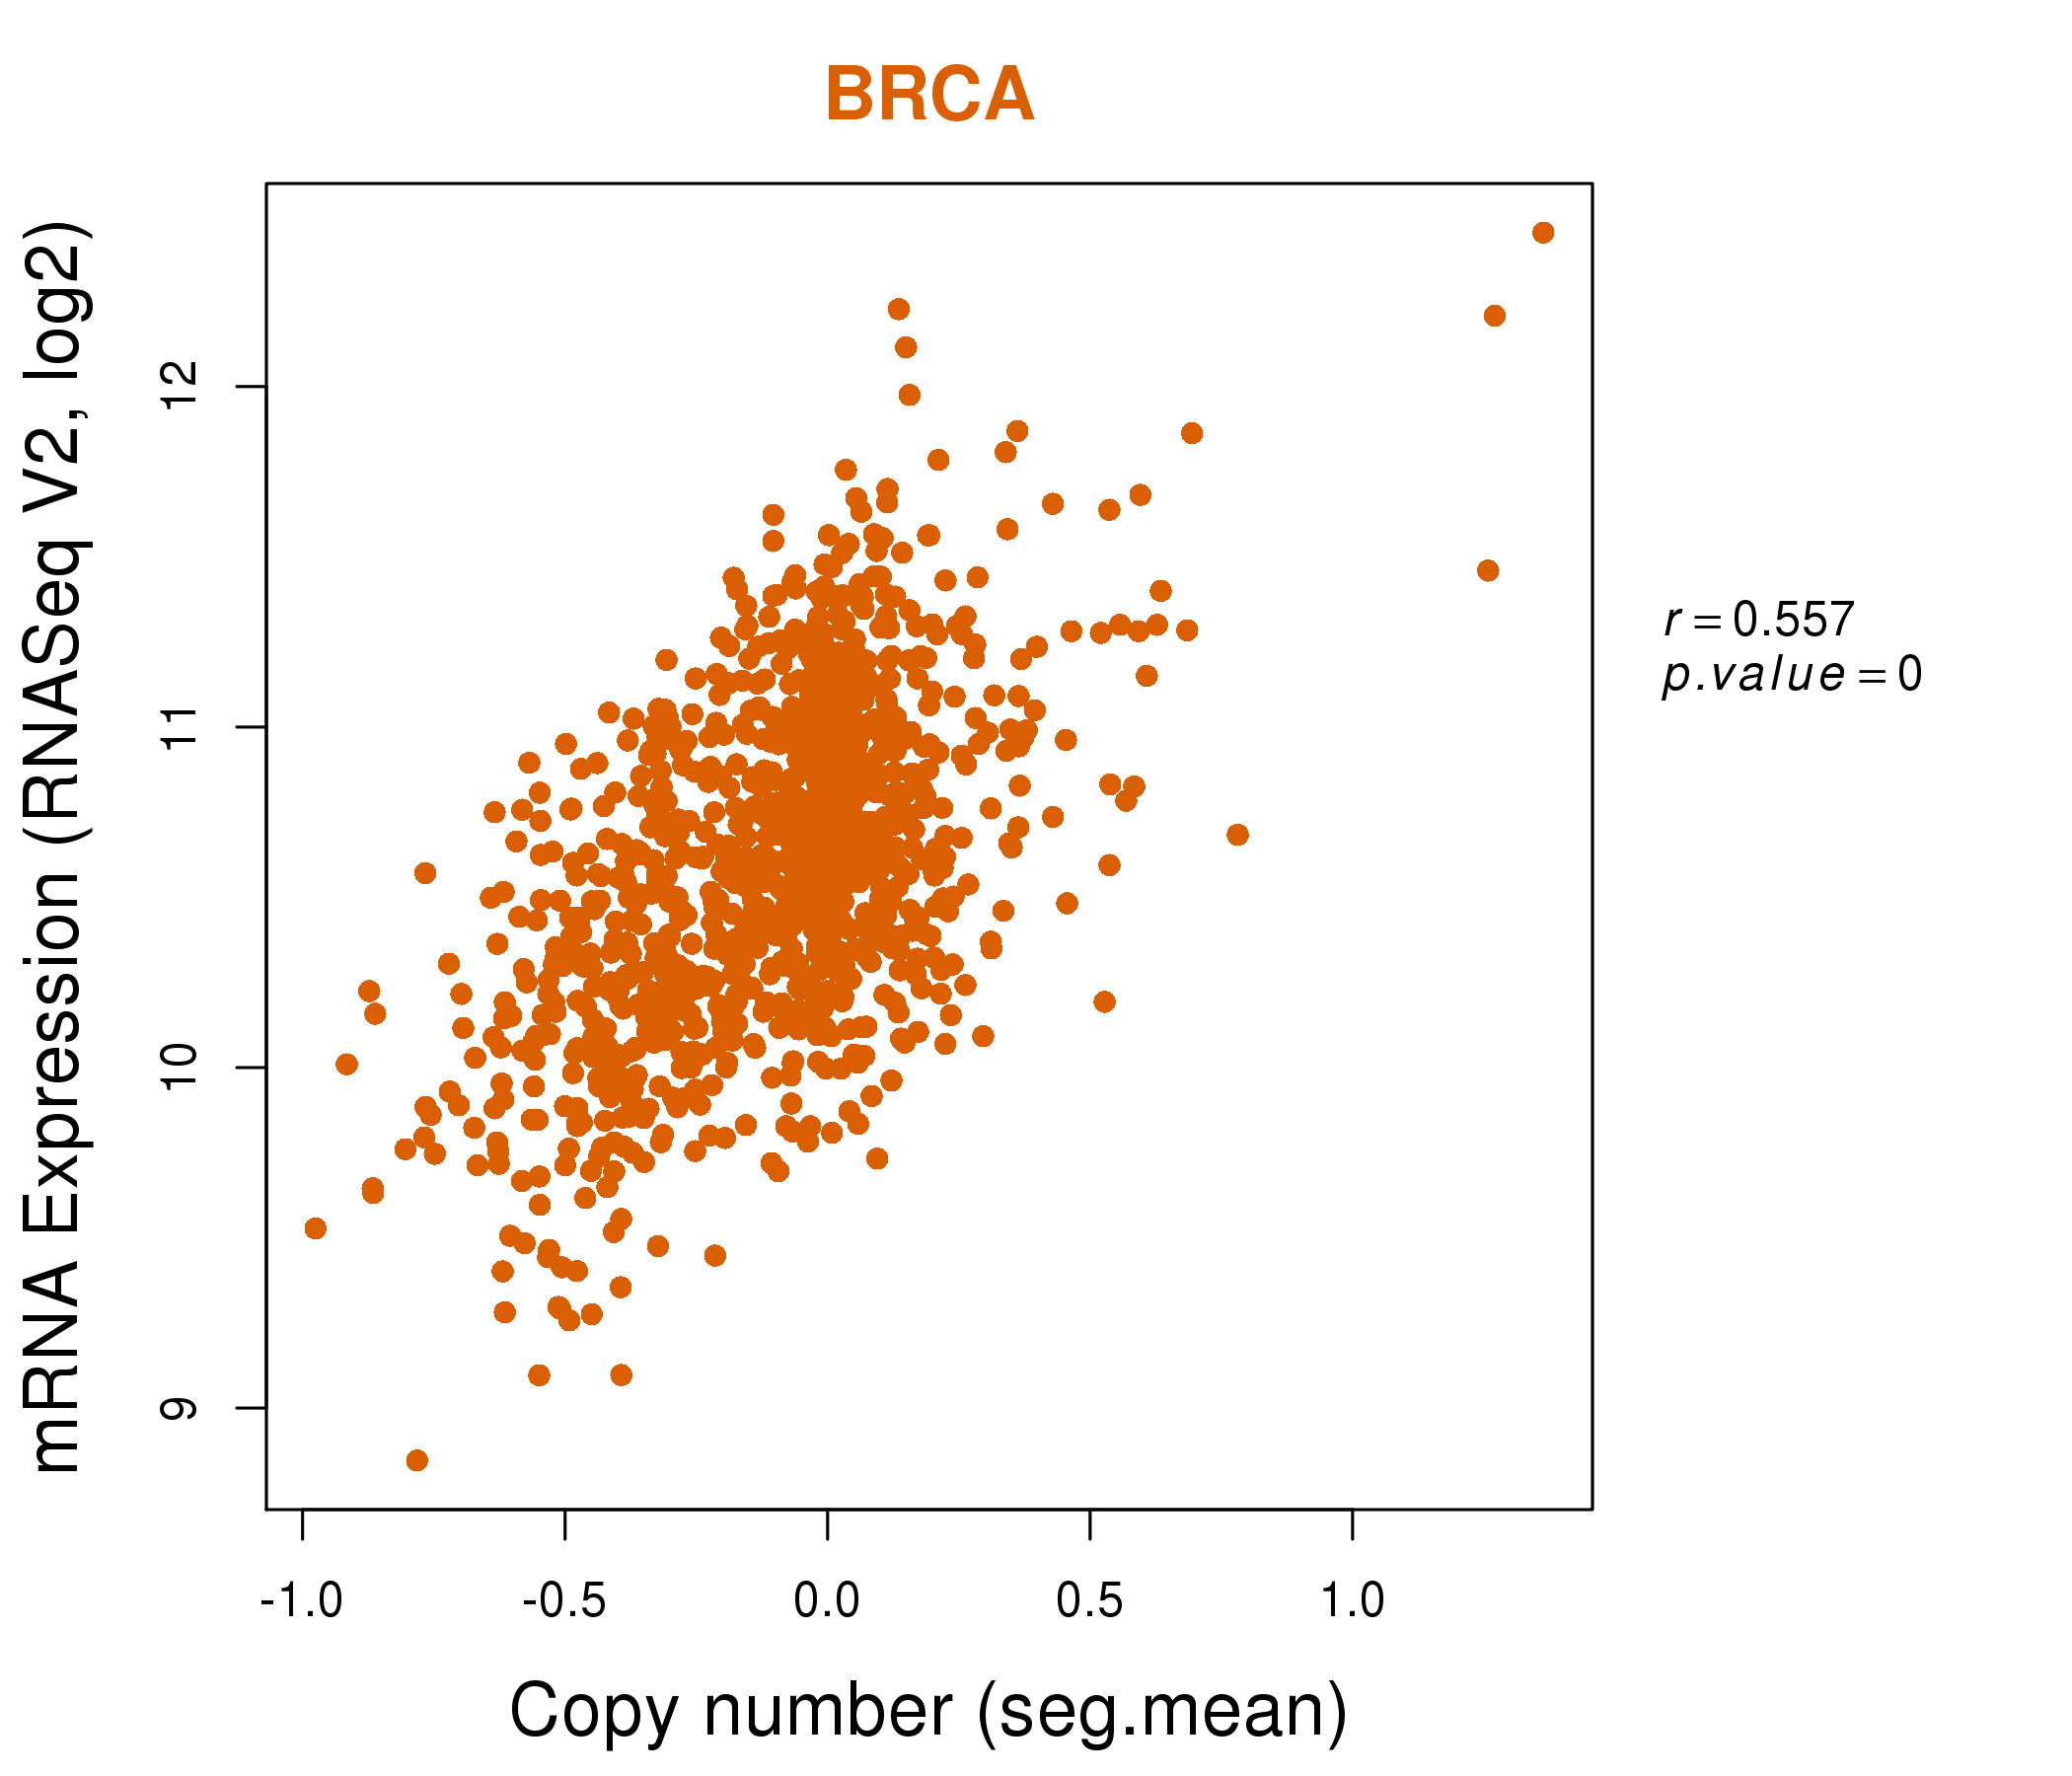
| * Copy number data were extracted from TCGA using R package TCGA-Assembler. The URLs of all public data files on TCGA DCC data server were gathered on Jan-05-2015. Function ProcessCNAData in TCGA-Assembler package was used to obtain gene-level copy number value which is calculated as the average copy number of the genomic region of a gene. |
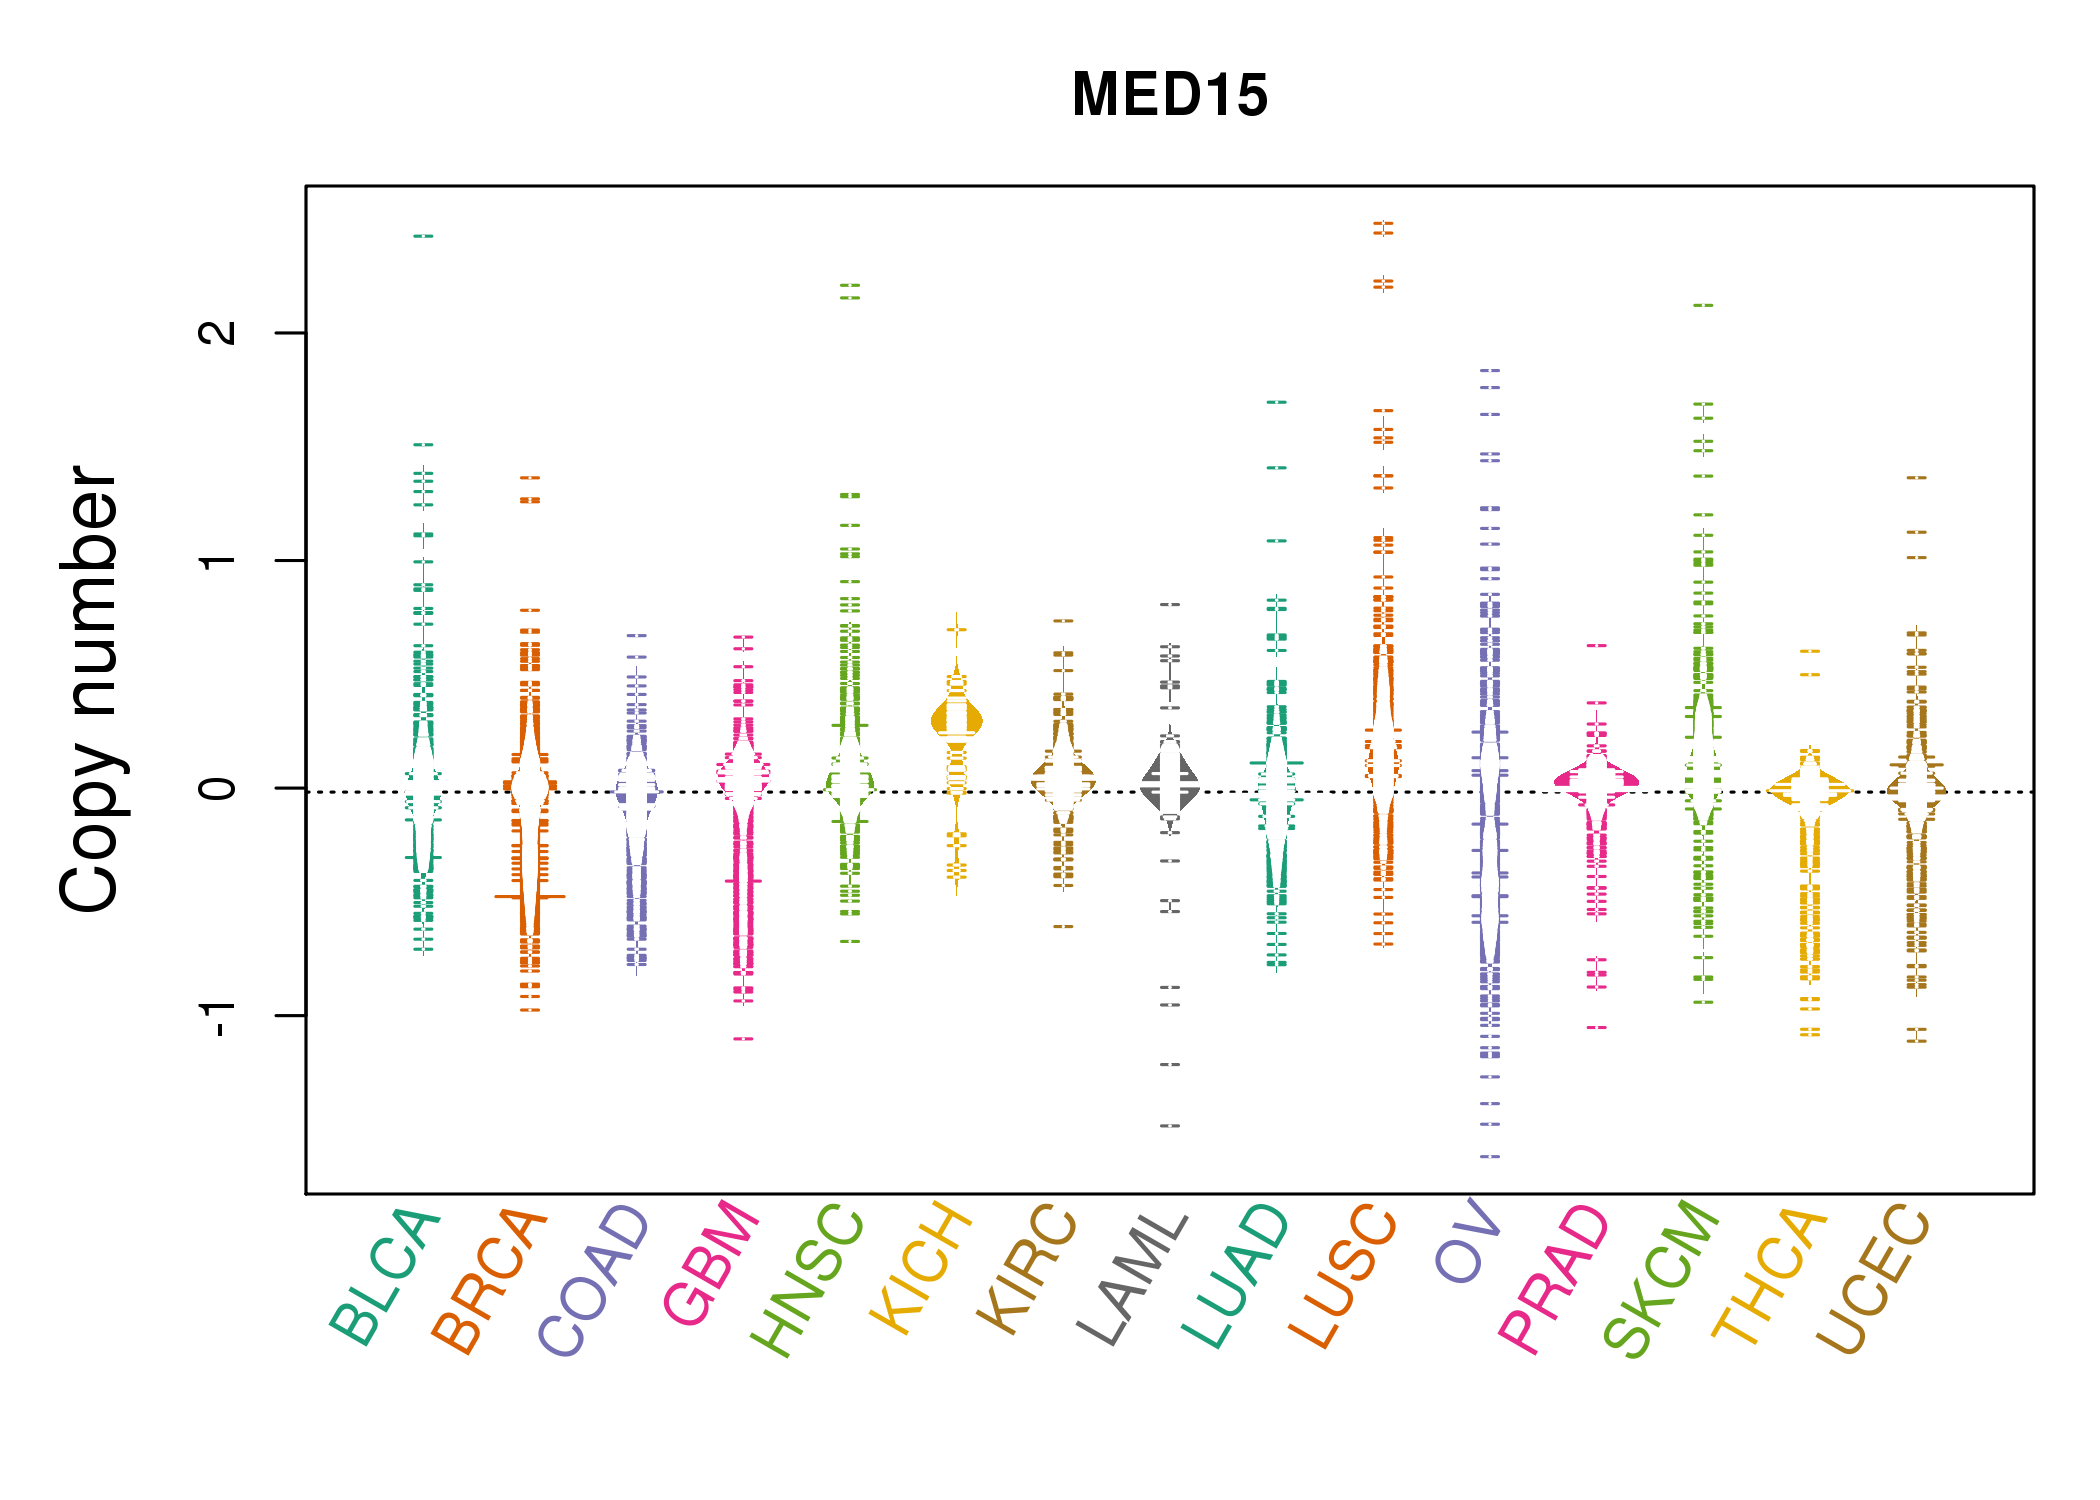 |
| cf) Tissue ID[Tissue type]: BLCA[Bladder Urothelial Carcinoma], BRCA[Breast invasive carcinoma], CESC[Cervical squamous cell carcinoma and endocervical adenocarcinoma], COAD[Colon adenocarcinoma], GBM[Glioblastoma multiforme], Glioma Low Grade, HNSC[Head and Neck squamous cell carcinoma], KICH[Kidney Chromophobe], KIRC[Kidney renal clear cell carcinoma], KIRP[Kidney renal papillary cell carcinoma], LAML[Acute Myeloid Leukemia], LUAD[Lung adenocarcinoma], LUSC[Lung squamous cell carcinoma], OV[Ovarian serous cystadenocarcinoma ], PAAD[Pancreatic adenocarcinoma], PRAD[Prostate adenocarcinoma], SKCM[Skin Cutaneous Melanoma], STAD[Stomach adenocarcinoma], THCA[Thyroid carcinoma], UCEC[Uterine Corpus Endometrial Carcinoma] |
| Top |
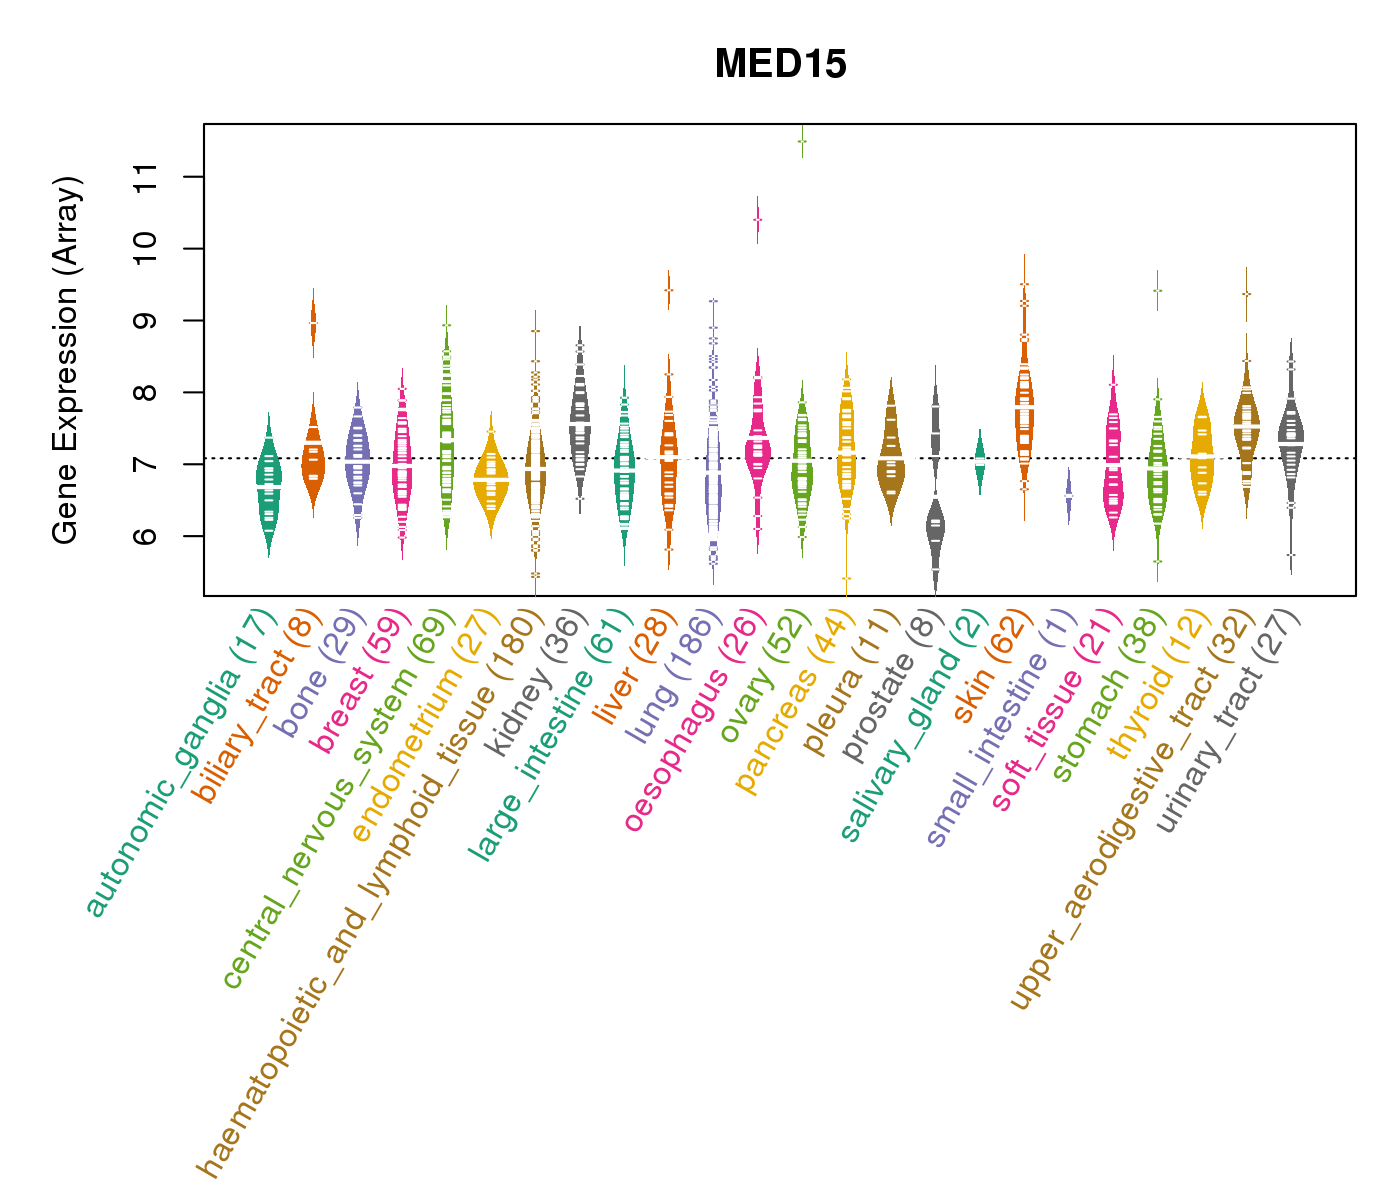
| Gene Expression for MED15 |
| * CCLE gene expression data were extracted from CCLE_Expression_Entrez_2012-10-18.res: Gene-centric RMA-normalized mRNA expression data. |
 |
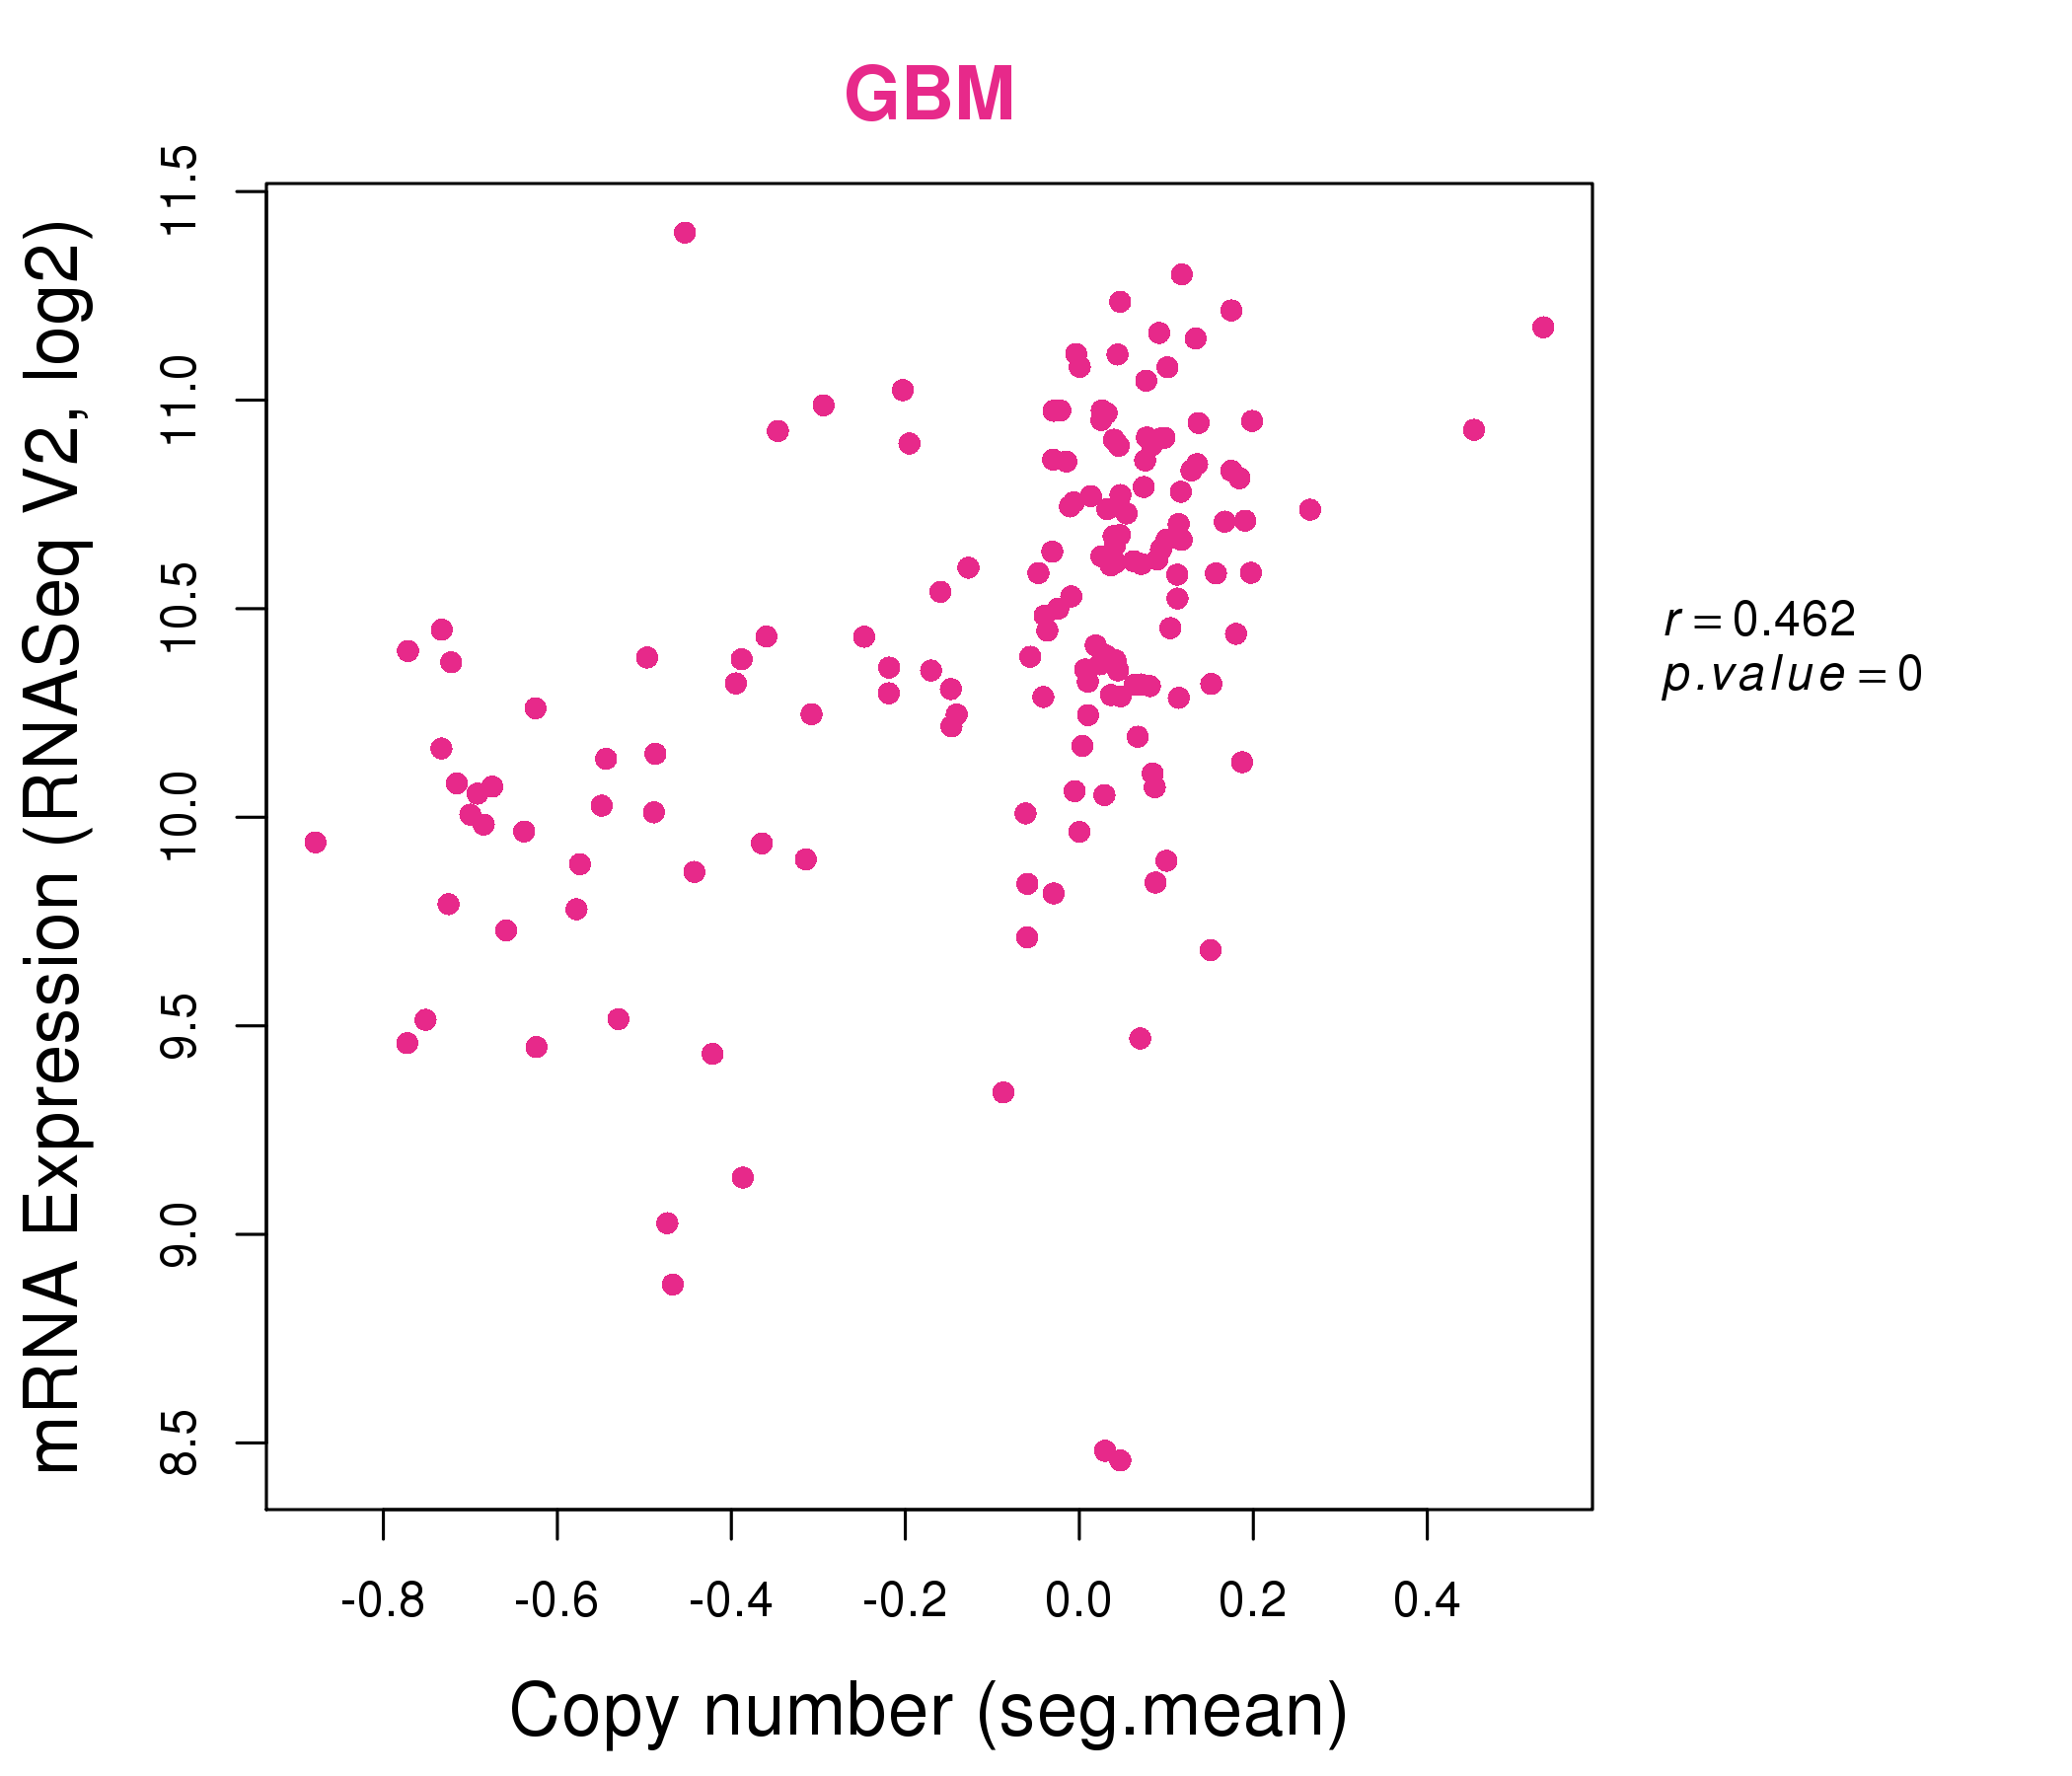
| * Normalized gene expression data of RNASeqV2 was extracted from TCGA using R package TCGA-Assembler. The URLs of all public data files on TCGA DCC data server were gathered at Jan-05-2015. Only eight cancer types have enough normal control samples for differential expression analysis. (t test, adjusted p<0.05 (using Benjamini-Hochberg FDR)) |
 |
| Top |
| * This plots show the correlation between CNV and gene expression. |
: Open all plots for all cancer types
 |
|
 |
|
| Top |
| Gene-Gene Network Information |
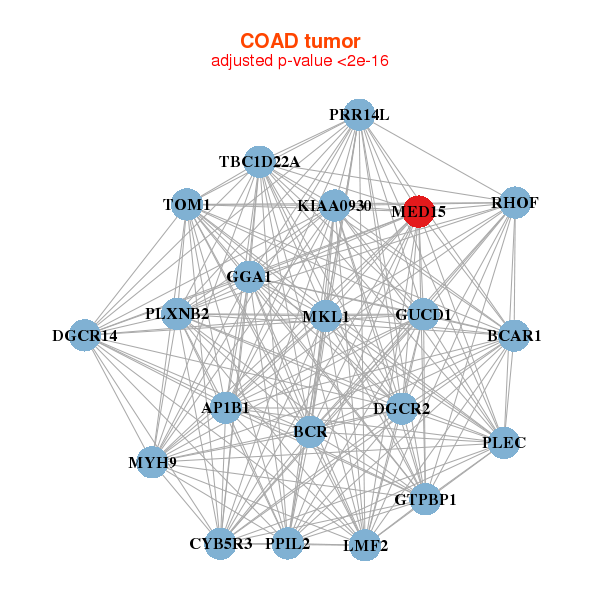
| * Co-Expression network figures were drawn using R package igraph. Only the top 20 genes with the highest correlations were shown. Red circle: input gene, orange circle: cell metabolism gene, sky circle: other gene |
: Open all plots for all cancer types
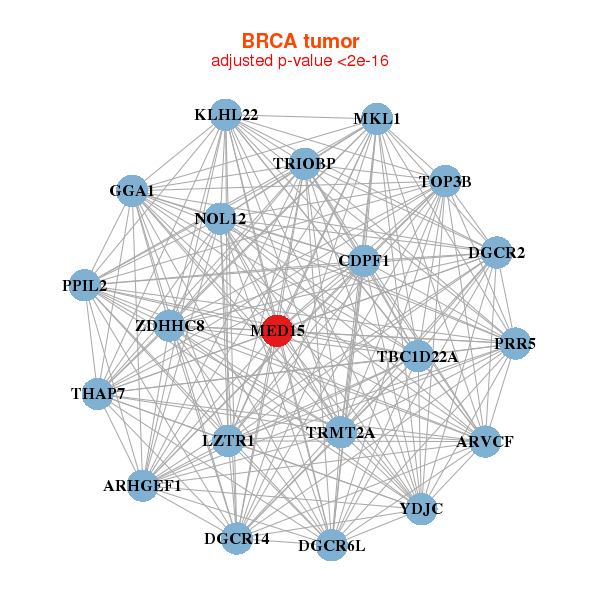 |
|
| ARHGEF1,ARVCF,CDPF1,DGCR14,DGCR2,DGCR6L,GGA1, KLHL22,LZTR1,MED15,MKL1,NOL12,PPIL2,PRR5, TBC1D22A,THAP7,TOP3B,TRIOBP,TRMT2A,YDJC,ZDHHC8 | BTBD2,TMEM259,BRAT1,HGS,AP5Z1,LMF2,LZTS2, MAP3K11,MBD3,MED15,NCLN,PLCB3,PNPLA6,RANBP3, SH3GL1,SIPA1,SLC39A13,SLC4A2,STRN4,VAC14,ZDHHC8 |
 |
|
| AP1B1,BCAR1,BCR,GUCD1,PRR14L,KIAA0930,CYB5R3, DGCR14,DGCR2,GGA1,GTPBP1,LMF2,MED15,MKL1, MYH9,PLEC,PLXNB2,PPIL2,RHOF,TBC1D22A,TOM1 | AP2A1,ELMSAN1,FLII,GBF1,ARHGAP35,KDM2A,KSR1, MED15,NDST1,NFE2L1,OTUD7B,PI4KA,PLXNB2,RAPGEF1, SOX13,TAOK2,UBR4,ZFYVE26,ZGPAT,ZMIZ1,ZNF592 |
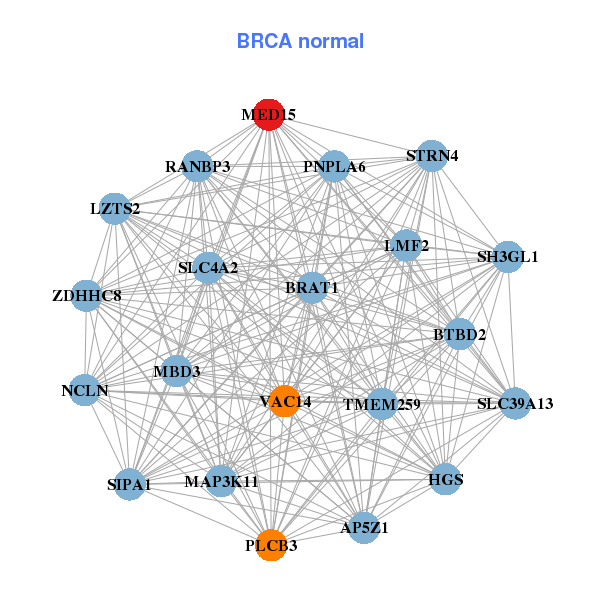
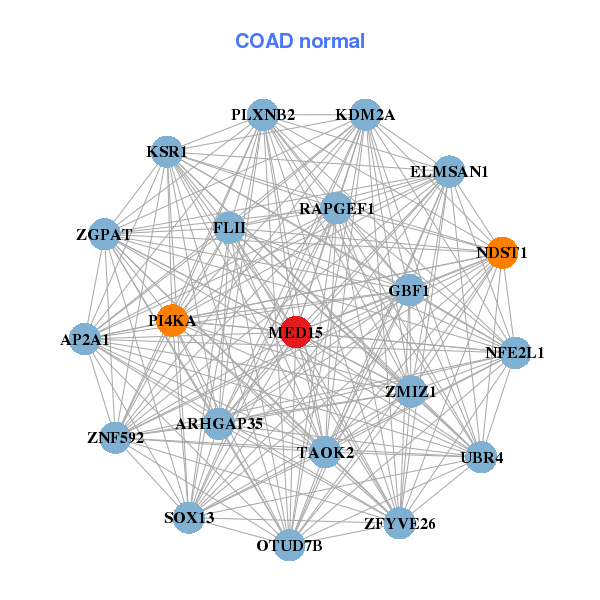
| * Co-Expression network figures were drawn using R package igraph. Only the top 20 genes with the highest correlations were shown. Red circle: input gene, orange circle: cell metabolism gene, sky circle: other gene |
: Open all plots for all cancer types
| Top |
: Open all interacting genes' information including KEGG pathway for all interacting genes from DAVID
| Top |
| Pharmacological Information for MED15 |
| There's no related Drug. |
| Top |
| Cross referenced IDs for MED15 |
| * We obtained these cross-references from Uniprot database. It covers 150 different DBs, 18 categories. http://www.uniprot.org/help/cross_references_section |
: Open all cross reference information
|
Copyright © 2016-Present - The Univsersity of Texas Health Science Center at Houston @ |