|
|||||||||||||||||||||||||||||||||||||||||||||||||||||||||||||||||||||||||||||||||||||||||||||||||||||||||||||||||||||||||||||||||||||||||||||||||||||||||||||||||||||||||||||||||||||||||||||||||||||||||||||||||||||||||||||||||||||||||||||||||||||||||||||||||||||||||||||||||||||||||||||||||||||||||||||||||||||||||||||||||||||||||||||||||||||||||
| |
| Phenotypic Information (metabolism pathway, cancer, disease, phenome) |
| |
| |
| Gene-Gene Network Information: Co-Expression Network, Interacting Genes & KEGG |
| |
|


| Gene Summary for PDK4 |
| Basic gene info. | Gene symbol | PDK4 |
| Gene name | pyruvate dehydrogenase kinase, isozyme 4 | |
| Synonyms | - | |
| Cytomap | UCSC genome browser: 7q21.3 | |
| Genomic location | chr7 :95212808-95225925 | |
| Type of gene | protein-coding | |
| RefGenes | NM_002612.3, | |
| Ensembl id | ENSG00000004799 | |
| Description | [Pyruvate dehydrogenase (acetyl-transferring)] kinase isozyme 4, mitochondrial[Pyruvate dehydrogenase [lipoamide]] kinase isozyme 4, mitochondrialpyruvate dehydrogenase kinase, isoenzyme 4pyruvate dehydrogenase, lipoamide, kinase isozyme 4, mitochondri | |
| Modification date | 20141207 | |
| dbXrefs | MIM : 602527 | |
| HGNC : HGNC | ||
| Ensembl : ENSG00000004799 | ||
| HPRD : 03957 | ||
| Vega : OTTHUMG00000153977 | ||
| Protein | UniProt: Q16654 go to UniProt's Cross Reference DB Table | |
| Expression | CleanEX: HS_PDK4 | |
| BioGPS: 5166 | ||
| Gene Expression Atlas: ENSG00000004799 | ||
| The Human Protein Atlas: ENSG00000004799 | ||
| Pathway | NCI Pathway Interaction Database: PDK4 | |
| KEGG: PDK4 | ||
| REACTOME: PDK4 | ||
| ConsensusPathDB | ||
| Pathway Commons: PDK4 | ||
| Metabolism | MetaCyc: PDK4 | |
| HUMANCyc: PDK4 | ||
| Regulation | Ensembl's Regulation: ENSG00000004799 | |
| miRBase: chr7 :95,212,808-95,225,925 | ||
| TargetScan: NM_002612 | ||
| cisRED: ENSG00000004799 | ||
| Context | iHOP: PDK4 | |
| cancer metabolism search in PubMed: PDK4 | ||
| UCL Cancer Institute: PDK4 | ||
| Assigned class in ccmGDB | A - This gene has a literature evidence and it belongs to cancer gene. | |
| References showing role of PDK4 in cancer cell metabolism | 1. Sun Y, Daemen A, Hatzivassiliou G, Arnott D, Wilson C, et al. (2014) Metabolic and transcriptional profiling reveals pyruvate dehydrogenase kinase 4 as a mediator of epithelial-mesenchymal transition and drug resistance in tumor cells. Cancer & metabolism 2: 20. go to article | |
| Top |
| Phenotypic Information for PDK4(metabolism pathway, cancer, disease, phenome) |
| Cancer | CGAP: PDK4 |
| Familial Cancer Database: PDK4 | |
| * This gene is included in those cancer gene databases. |
|
|
|
|
|
|
| |||||||||||||||||||||||||||||||||||||||||||||||||||||||||||||||||||||||||||||||||||||||||||||||||||||||||||||||||||||||||||||||||||||||||||||||||||||||||||||||||||||||||||||||||||||||||||||||||||||||||||||||||||||||||||||||||||||||||||||||||||||||||||||||||||||||||||||||||||||||||||||||||||||||||||||||||||||||||||||||||||||||||||||||||||
Oncogene 1 | Significant driver gene in | ||||||||||||||||||||||||||||||||||||||||||||||||||||||||||||||||||||||||||||||||||||||||||||||||||||||||||||||||||||||||||||||||||||||||||||||||||||||||||||||||||||||||||||||||||||||||||||||||||||||||||||||||||||||||||||||||||||||||||||||||||||||||||||||||||||||||||||||||||||||||||||||||||||||||||||||||||||||||||||||||||||||||||||||||||||||||
| cf) number; DB name 1 Oncogene; http://nar.oxfordjournals.org/content/35/suppl_1/D721.long, 2 Tumor Suppressor gene; https://bioinfo.uth.edu/TSGene/, 3 Cancer Gene Census; http://www.nature.com/nrc/journal/v4/n3/abs/nrc1299.html, 4 CancerGenes; http://nar.oxfordjournals.org/content/35/suppl_1/D721.long, 5 Network of Cancer Gene; http://ncg.kcl.ac.uk/index.php, 1Therapeutic Vulnerabilities in Cancer; http://cbio.mskcc.org/cancergenomics/statius/ |
| REACTOME_PYRUVATE_METABOLISM_AND_CITRIC_ACID_TCA_CYCLE REACTOME_PYRUVATE_METABOLISM | |
| OMIM | 602527; gene. |
| Orphanet | |
| Disease | KEGG Disease: PDK4 |
| MedGen: PDK4 (Human Medical Genetics with Condition) | |
| ClinVar: PDK4 | |
| Phenotype | MGI: PDK4 (International Mouse Phenotyping Consortium) |
| PhenomicDB: PDK4 | |
| Mutations for PDK4 |
| * Under tables are showing count per each tissue to give us broad intuition about tissue specific mutation patterns.You can go to the detailed page for each mutation database's web site. |
| There's no structural variation information in COSMIC data for this gene. |
| * From mRNA Sanger sequences, Chitars2.0 arranged chimeric transcripts. This table shows PDK4 related fusion information. |
| ID | Head Gene | Tail Gene | Accession | Gene_a | qStart_a | qEnd_a | Chromosome_a | tStart_a | tEnd_a | Gene_a | qStart_a | qEnd_a | Chromosome_a | tStart_a | tEnd_a |
| AW992900 | EHF | 25 | 291 | 11 | 34684241 | 34684503 | PDK4 | 287 | 622 | 7 | 95214085 | 95214420 | |
| Top |
| Mutation type/ Tissue ID | brca | cns | cerv | endome | haematopo | kidn | Lintest | liver | lung | ns | ovary | pancre | prost | skin | stoma | thyro | urina | |||
| Total # sample | 1 | 1 | 1 | 2 | 1 | |||||||||||||||
| GAIN (# sample) | 1 | 2 | 1 | |||||||||||||||||
| LOSS (# sample) | 1 | 1 |
| cf) Tissue ID; Tissue type (1; Breast, 2; Central_nervous_system, 3; Cervix, 4; Endometrium, 5; Haematopoietic_and_lymphoid_tissue, 6; Kidney, 7; Large_intestine, 8; Liver, 9; Lung, 10; NS, 11; Ovary, 12; Pancreas, 13; Prostate, 14; Skin, 15; Stomach, 16; Thyroid, 17; Urinary_tract) |
| Top |
|
 |
| Top |
| Stat. for Non-Synonymous SNVs (# total SNVs=40) | (# total SNVs=6) |
 |  |
(# total SNVs=0) | (# total SNVs=0) |
| Top |
| * When you move the cursor on each content, you can see more deailed mutation information on the Tooltip. Those are primary_site,primary_histology,mutation(aa),pubmedID. |
| GRCh37 position | Mutation(aa) | Unique sampleID count |
| chr7:95222119-95222119 | p.R161Q | 3 |
| chr7:95222231-95222231 | p.R124* | 3 |
| chr7:95216415-95216415 | p.L334F | 2 |
| chr7:95221341-95221341 | p.Y218C | 2 |
| chr7:95216376-95216376 | p.D347D | 2 |
| chr7:95222183-95222183 | p.E140Q | 2 |
| chr7:95222230-95222230 | p.R124Q | 2 |
| chr7:95224435-95224435 | p.R58* | 2 |
| chr7:95221874-95221874 | p.S189R | 1 |
| chr7:95223049-95223049 | p.F102L | 1 |
| Top |
|
 |
| Point Mutation/ Tissue ID | 1 | 2 | 3 | 4 | 5 | 6 | 7 | 8 | 9 | 10 | 11 | 12 | 13 | 14 | 15 | 16 | 17 | 18 | 19 | 20 |
| # sample | 2 | 4 | 1 | 3 | 1 | 1 | 3 | 8 | 2 | 10 | ||||||||||
| # mutation | 2 | 4 | 1 | 3 | 1 | 1 | 3 | 8 | 3 | 11 | ||||||||||
| nonsynonymous SNV | 2 | 3 | 1 | 3 | 1 | 3 | 6 | 2 | 9 | |||||||||||
| synonymous SNV | 1 | 1 | 2 | 1 | 2 |
| cf) Tissue ID; Tissue type (1; BLCA[Bladder Urothelial Carcinoma], 2; BRCA[Breast invasive carcinoma], 3; CESC[Cervical squamous cell carcinoma and endocervical adenocarcinoma], 4; COAD[Colon adenocarcinoma], 5; GBM[Glioblastoma multiforme], 6; Glioma Low Grade, 7; HNSC[Head and Neck squamous cell carcinoma], 8; KICH[Kidney Chromophobe], 9; KIRC[Kidney renal clear cell carcinoma], 10; KIRP[Kidney renal papillary cell carcinoma], 11; LAML[Acute Myeloid Leukemia], 12; LUAD[Lung adenocarcinoma], 13; LUSC[Lung squamous cell carcinoma], 14; OV[Ovarian serous cystadenocarcinoma ], 15; PAAD[Pancreatic adenocarcinoma], 16; PRAD[Prostate adenocarcinoma], 17; SKCM[Skin Cutaneous Melanoma], 18:STAD[Stomach adenocarcinoma], 19:THCA[Thyroid carcinoma], 20:UCEC[Uterine Corpus Endometrial Carcinoma]) |
| Top |
| * We represented just top 10 SNVs. When you move the cursor on each content, you can see more deailed mutation information on the Tooltip. Those are primary_site, primary_histology, mutation(aa), pubmedID. |
| Genomic Position | Mutation(aa) | Unique sampleID count |
| chr7:95222119 | p.R161Q | 3 |
| chr7:95222230 | p.R124Q | 2 |
| chr7:95224411 | p.K290K | 1 |
| chr7:95216798 | p.E71K | 1 |
| chr7:95224434 | p.G283V | 1 |
| chr7:95216806 | p.A66T | 1 |
| chr7:95222138 | p.I279T | 1 |
| chr7:95215020 | p.R58Q | 1 |
| chr7:95224435 | p.S390Y | 1 |
| chr7:95216809 | p.P271S | 1 |
| * Copy number data were extracted from TCGA using R package TCGA-Assembler. The URLs of all public data files on TCGA DCC data server were gathered on Jan-05-2015. Function ProcessCNAData in TCGA-Assembler package was used to obtain gene-level copy number value which is calculated as the average copy number of the genomic region of a gene. |
 |
| cf) Tissue ID[Tissue type]: BLCA[Bladder Urothelial Carcinoma], BRCA[Breast invasive carcinoma], CESC[Cervical squamous cell carcinoma and endocervical adenocarcinoma], COAD[Colon adenocarcinoma], GBM[Glioblastoma multiforme], Glioma Low Grade, HNSC[Head and Neck squamous cell carcinoma], KICH[Kidney Chromophobe], KIRC[Kidney renal clear cell carcinoma], KIRP[Kidney renal papillary cell carcinoma], LAML[Acute Myeloid Leukemia], LUAD[Lung adenocarcinoma], LUSC[Lung squamous cell carcinoma], OV[Ovarian serous cystadenocarcinoma ], PAAD[Pancreatic adenocarcinoma], PRAD[Prostate adenocarcinoma], SKCM[Skin Cutaneous Melanoma], STAD[Stomach adenocarcinoma], THCA[Thyroid carcinoma], UCEC[Uterine Corpus Endometrial Carcinoma] |
| Top |
| Gene Expression for PDK4 |
| * CCLE gene expression data were extracted from CCLE_Expression_Entrez_2012-10-18.res: Gene-centric RMA-normalized mRNA expression data. |
 |
| * Normalized gene expression data of RNASeqV2 was extracted from TCGA using R package TCGA-Assembler. The URLs of all public data files on TCGA DCC data server were gathered at Jan-05-2015. Only eight cancer types have enough normal control samples for differential expression analysis. (t test, adjusted p<0.05 (using Benjamini-Hochberg FDR)) |
 |
| Top |
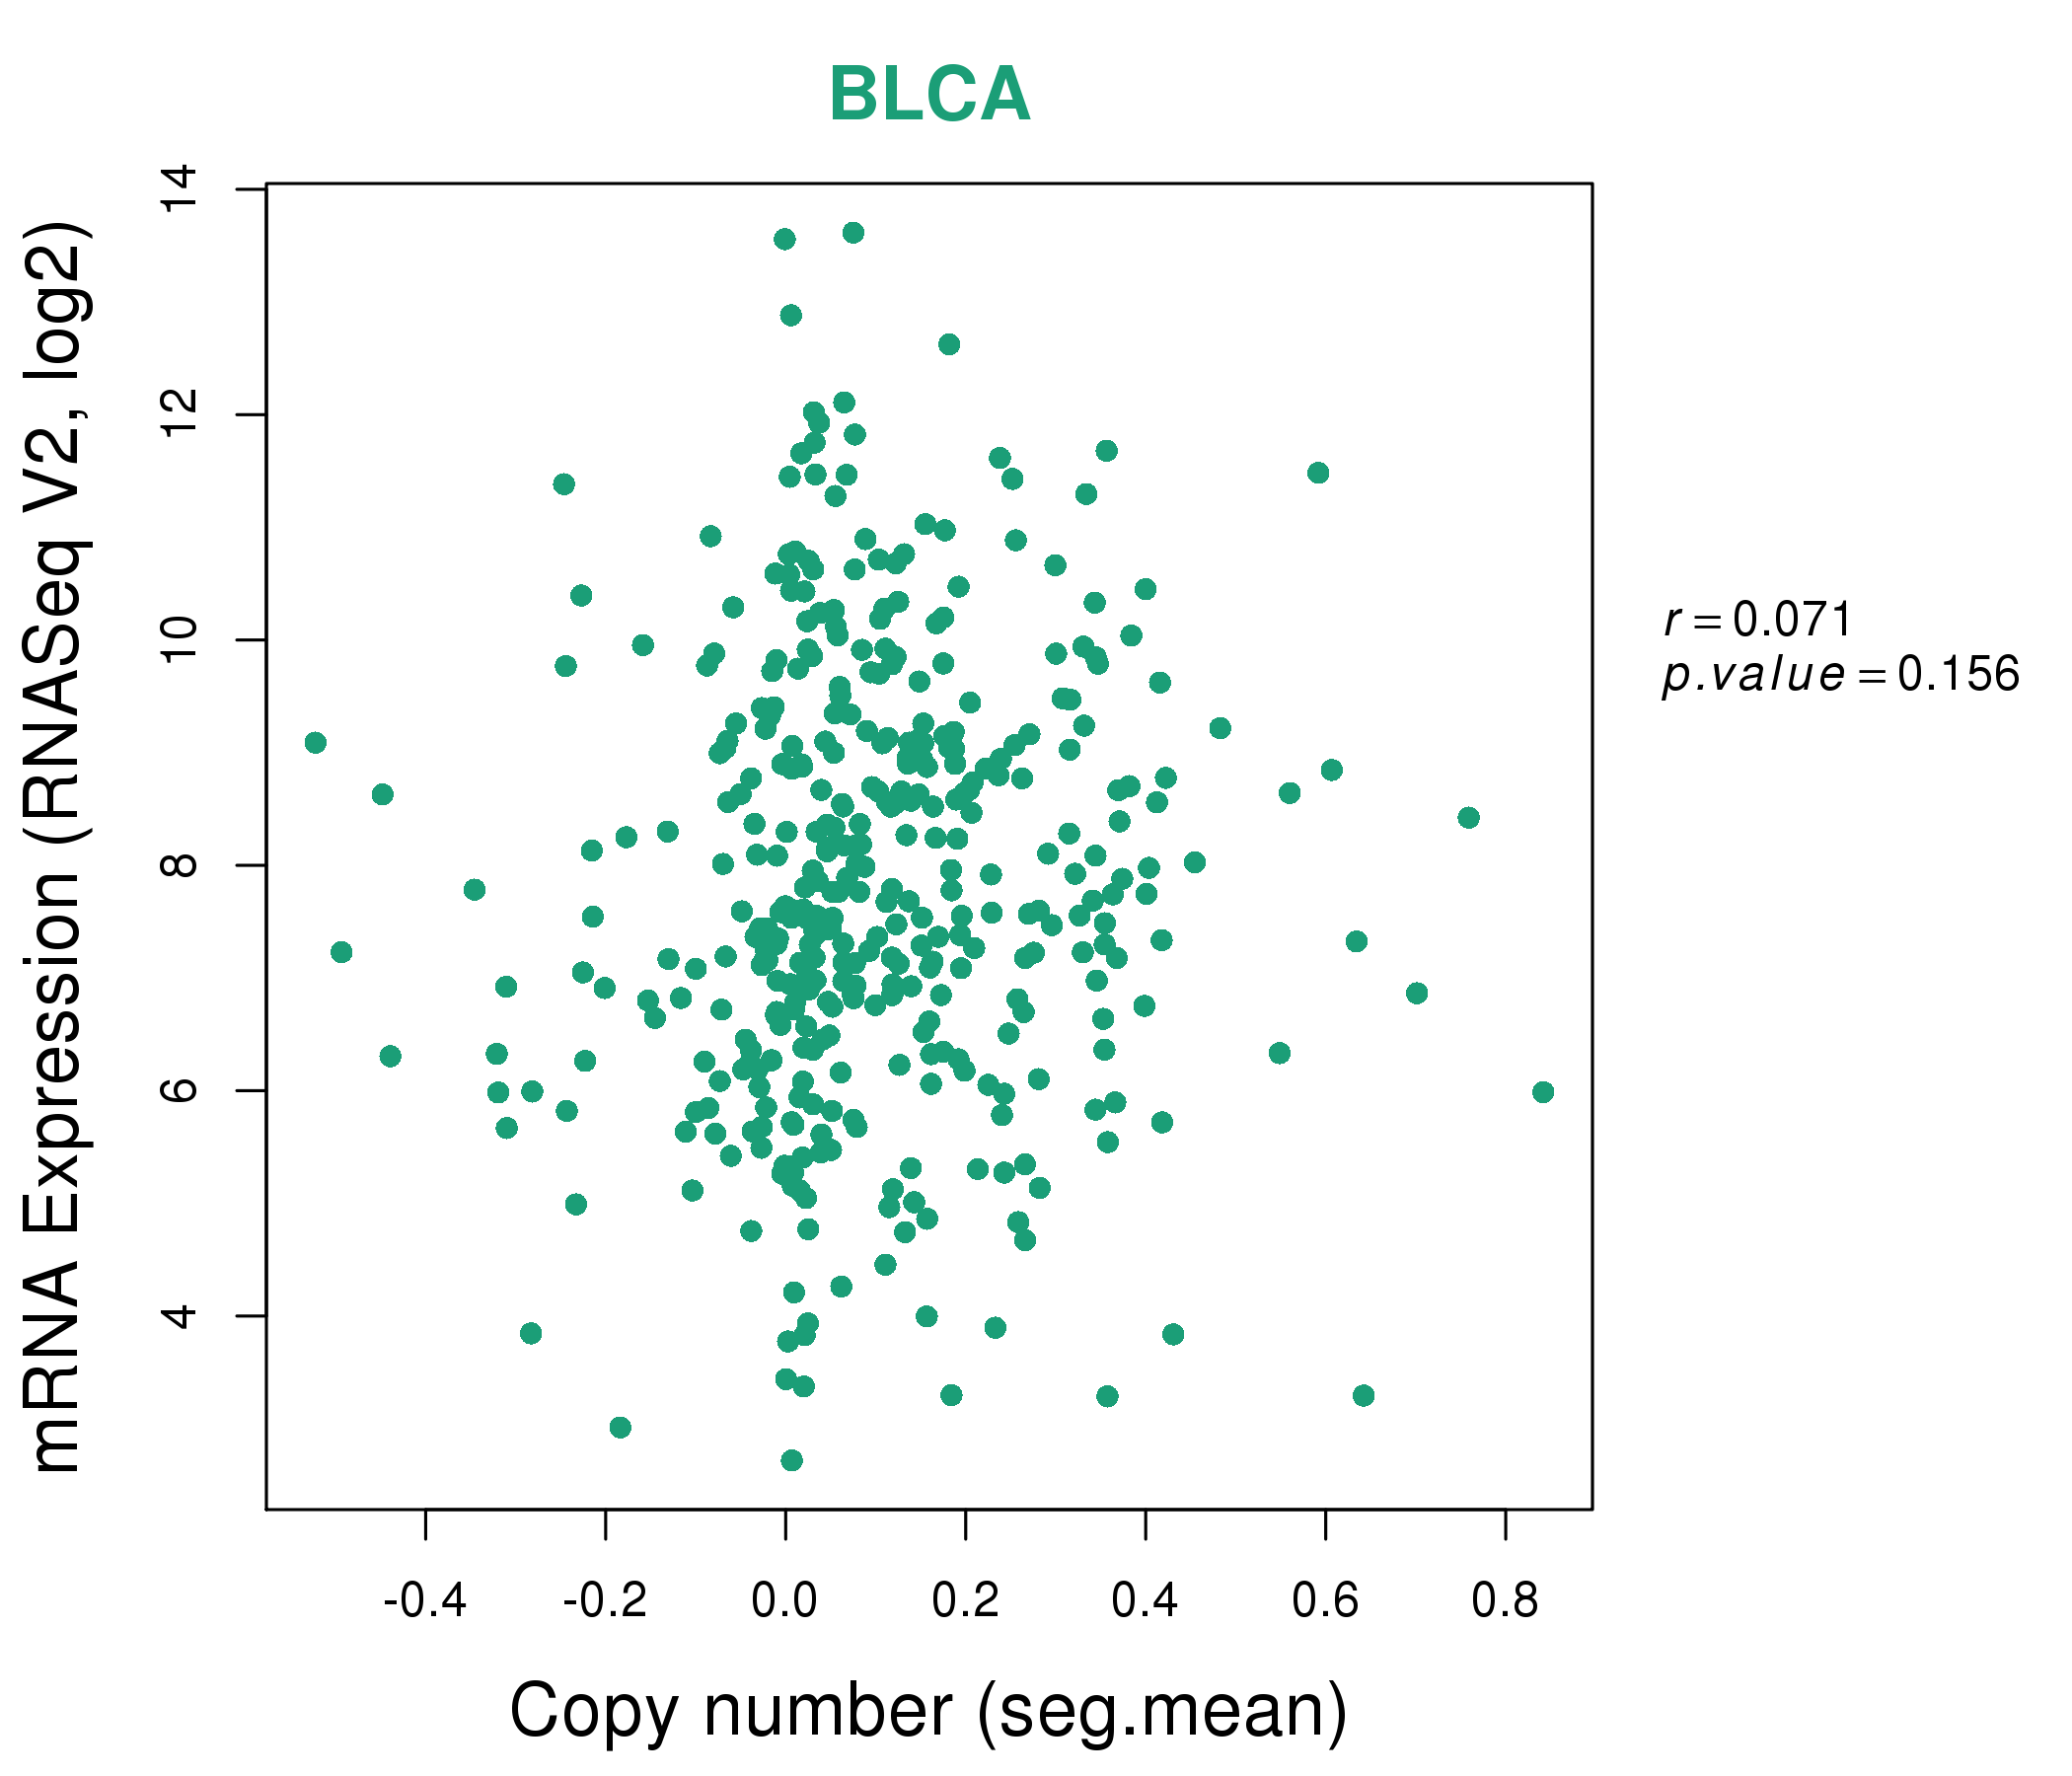
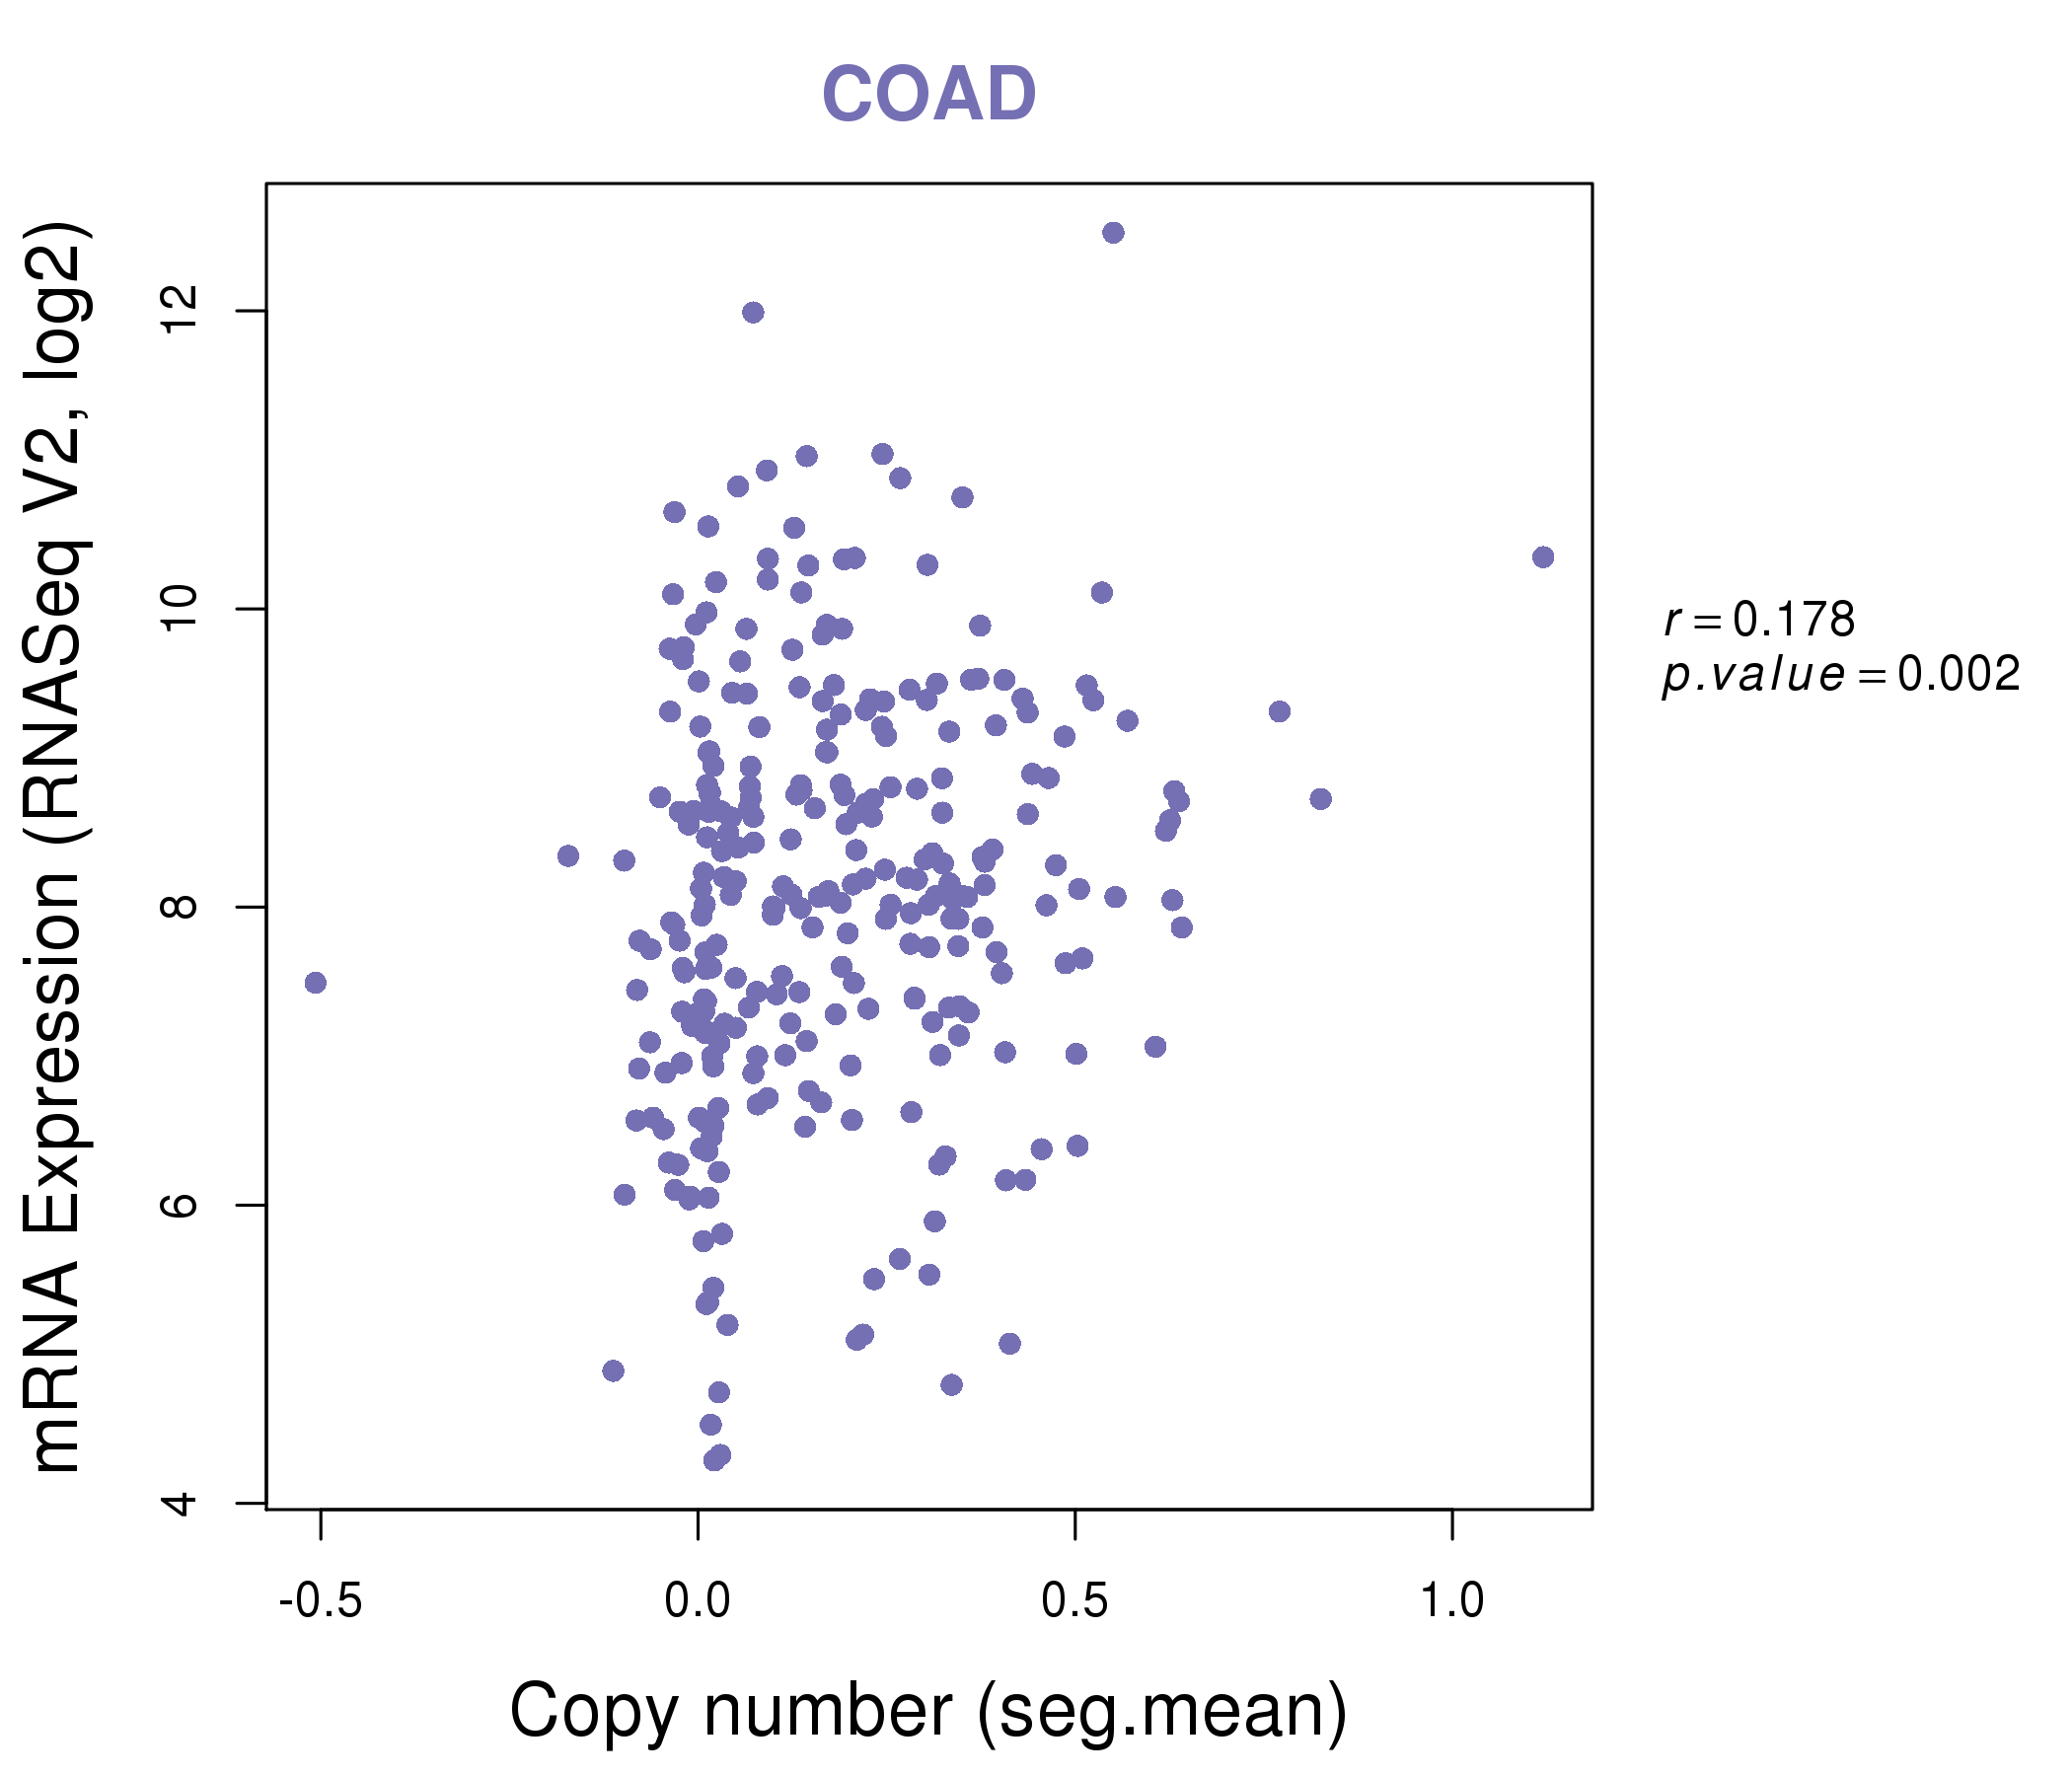
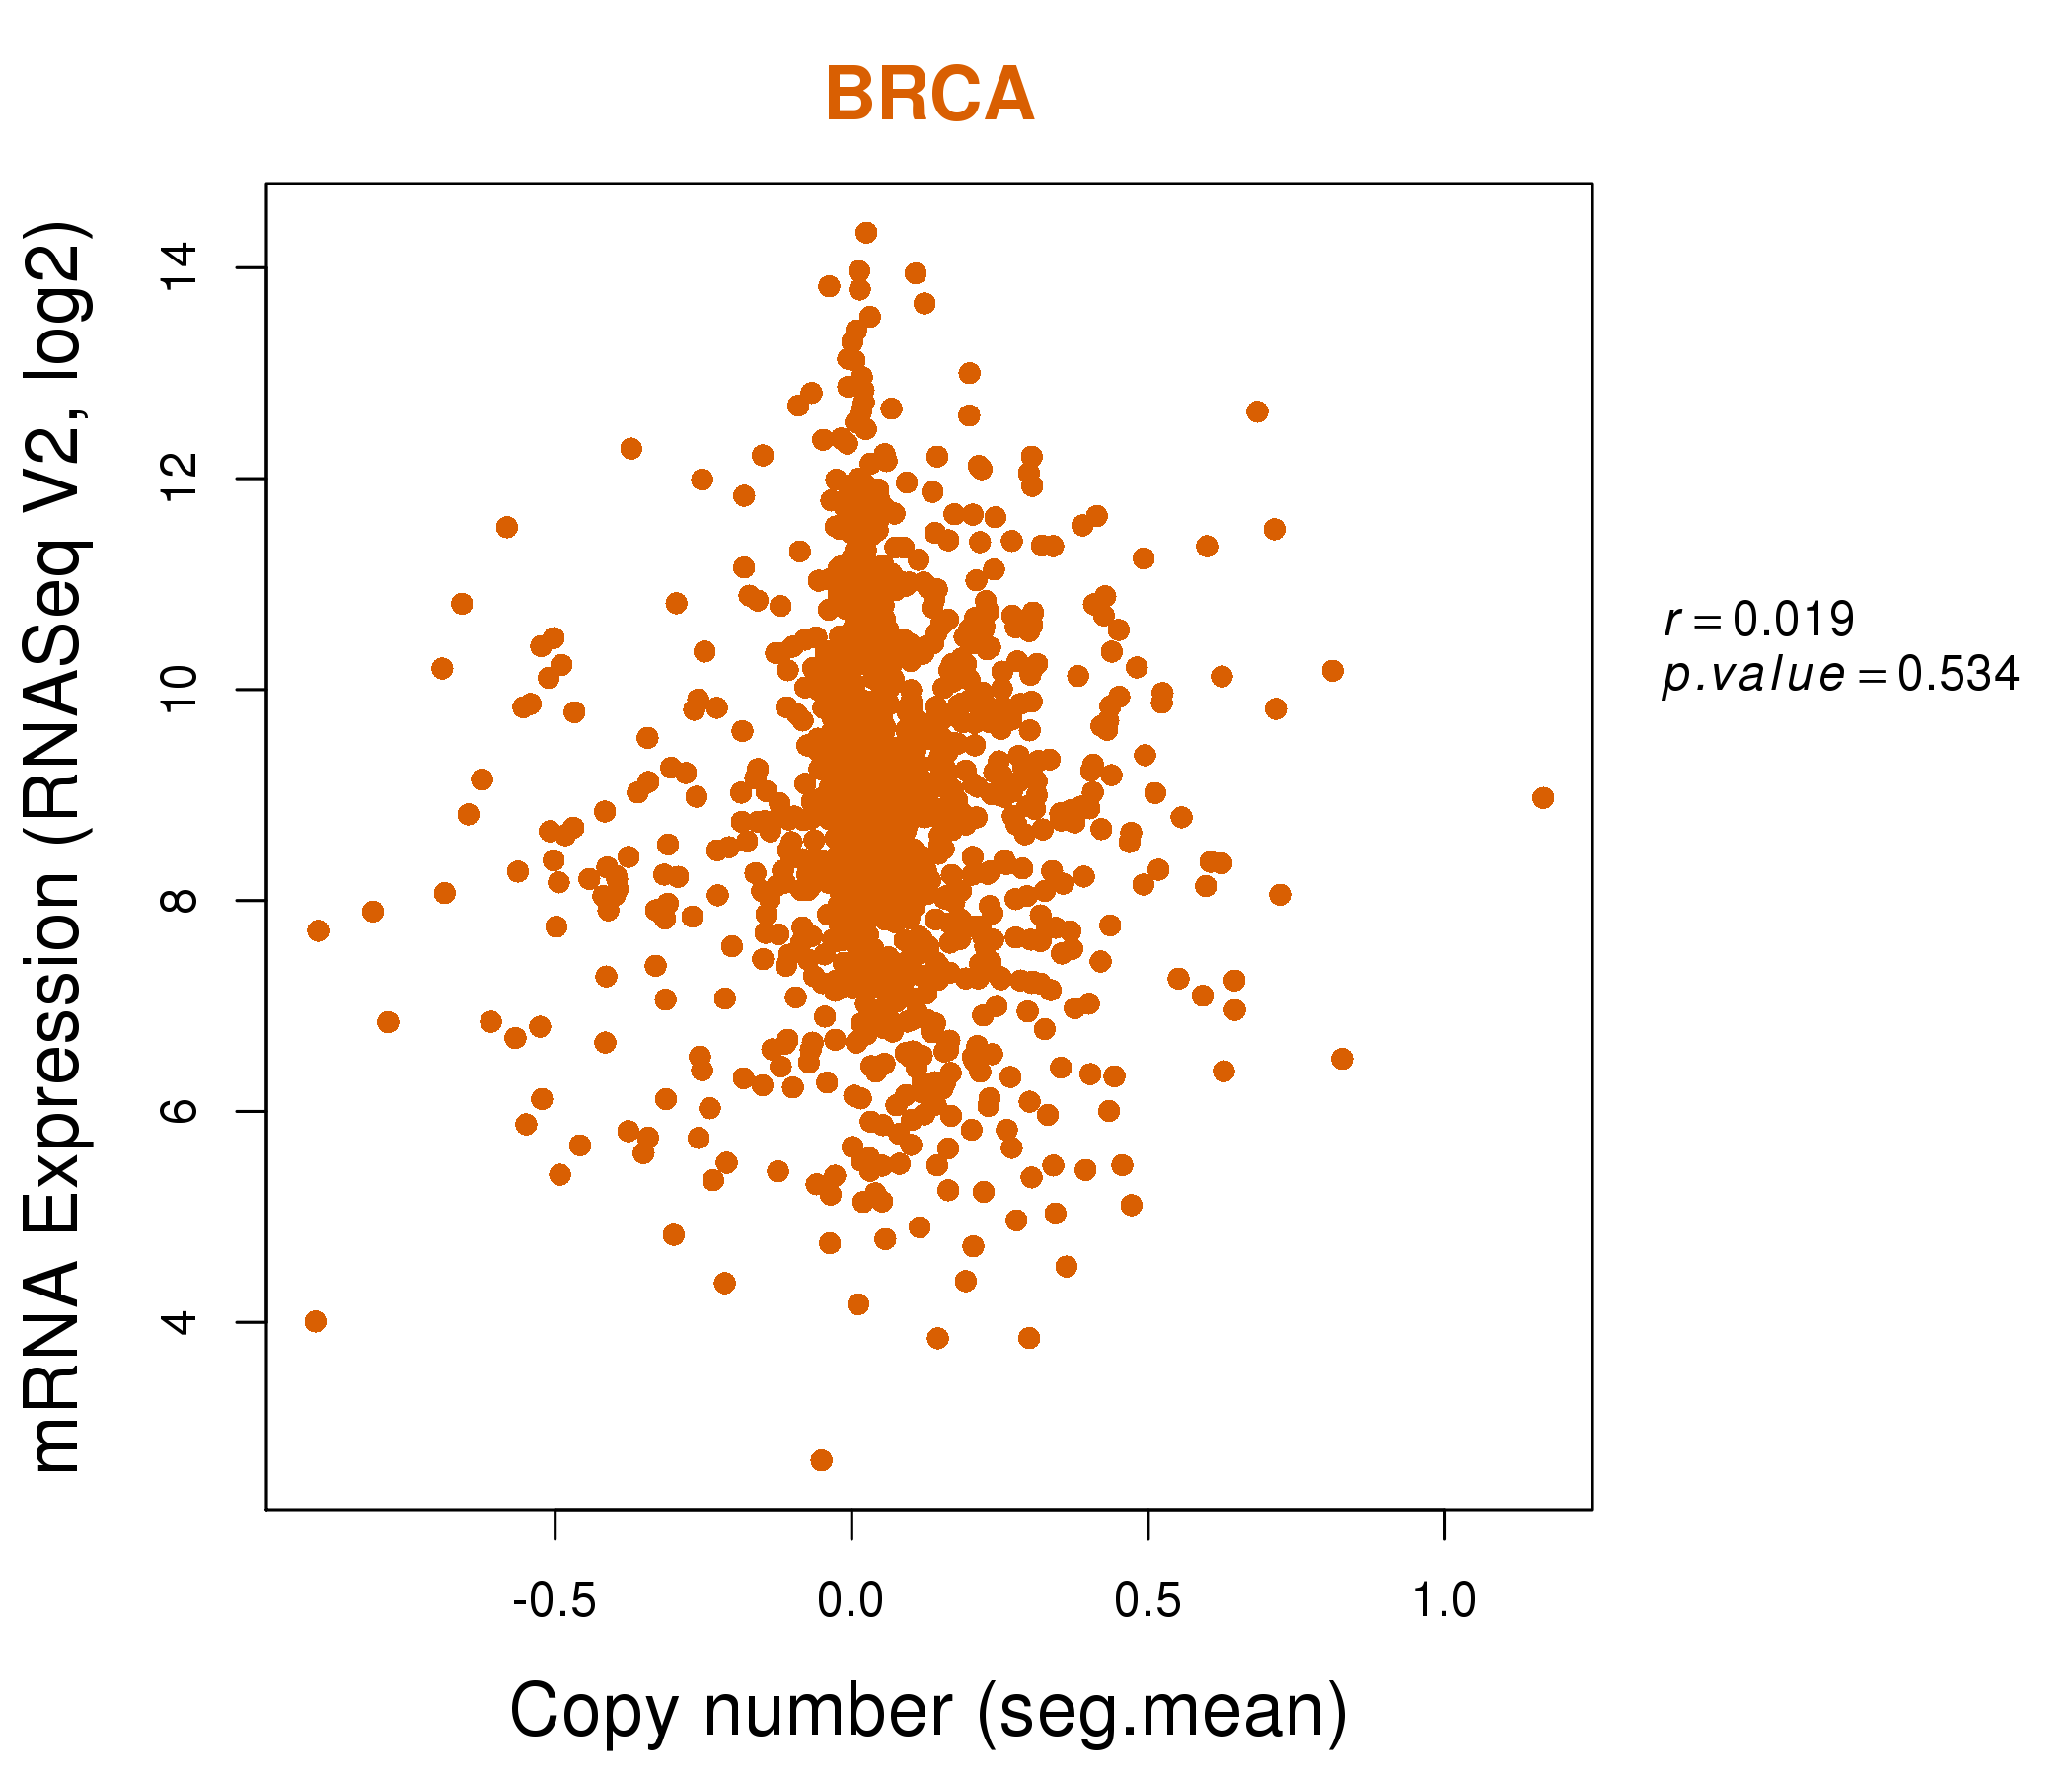
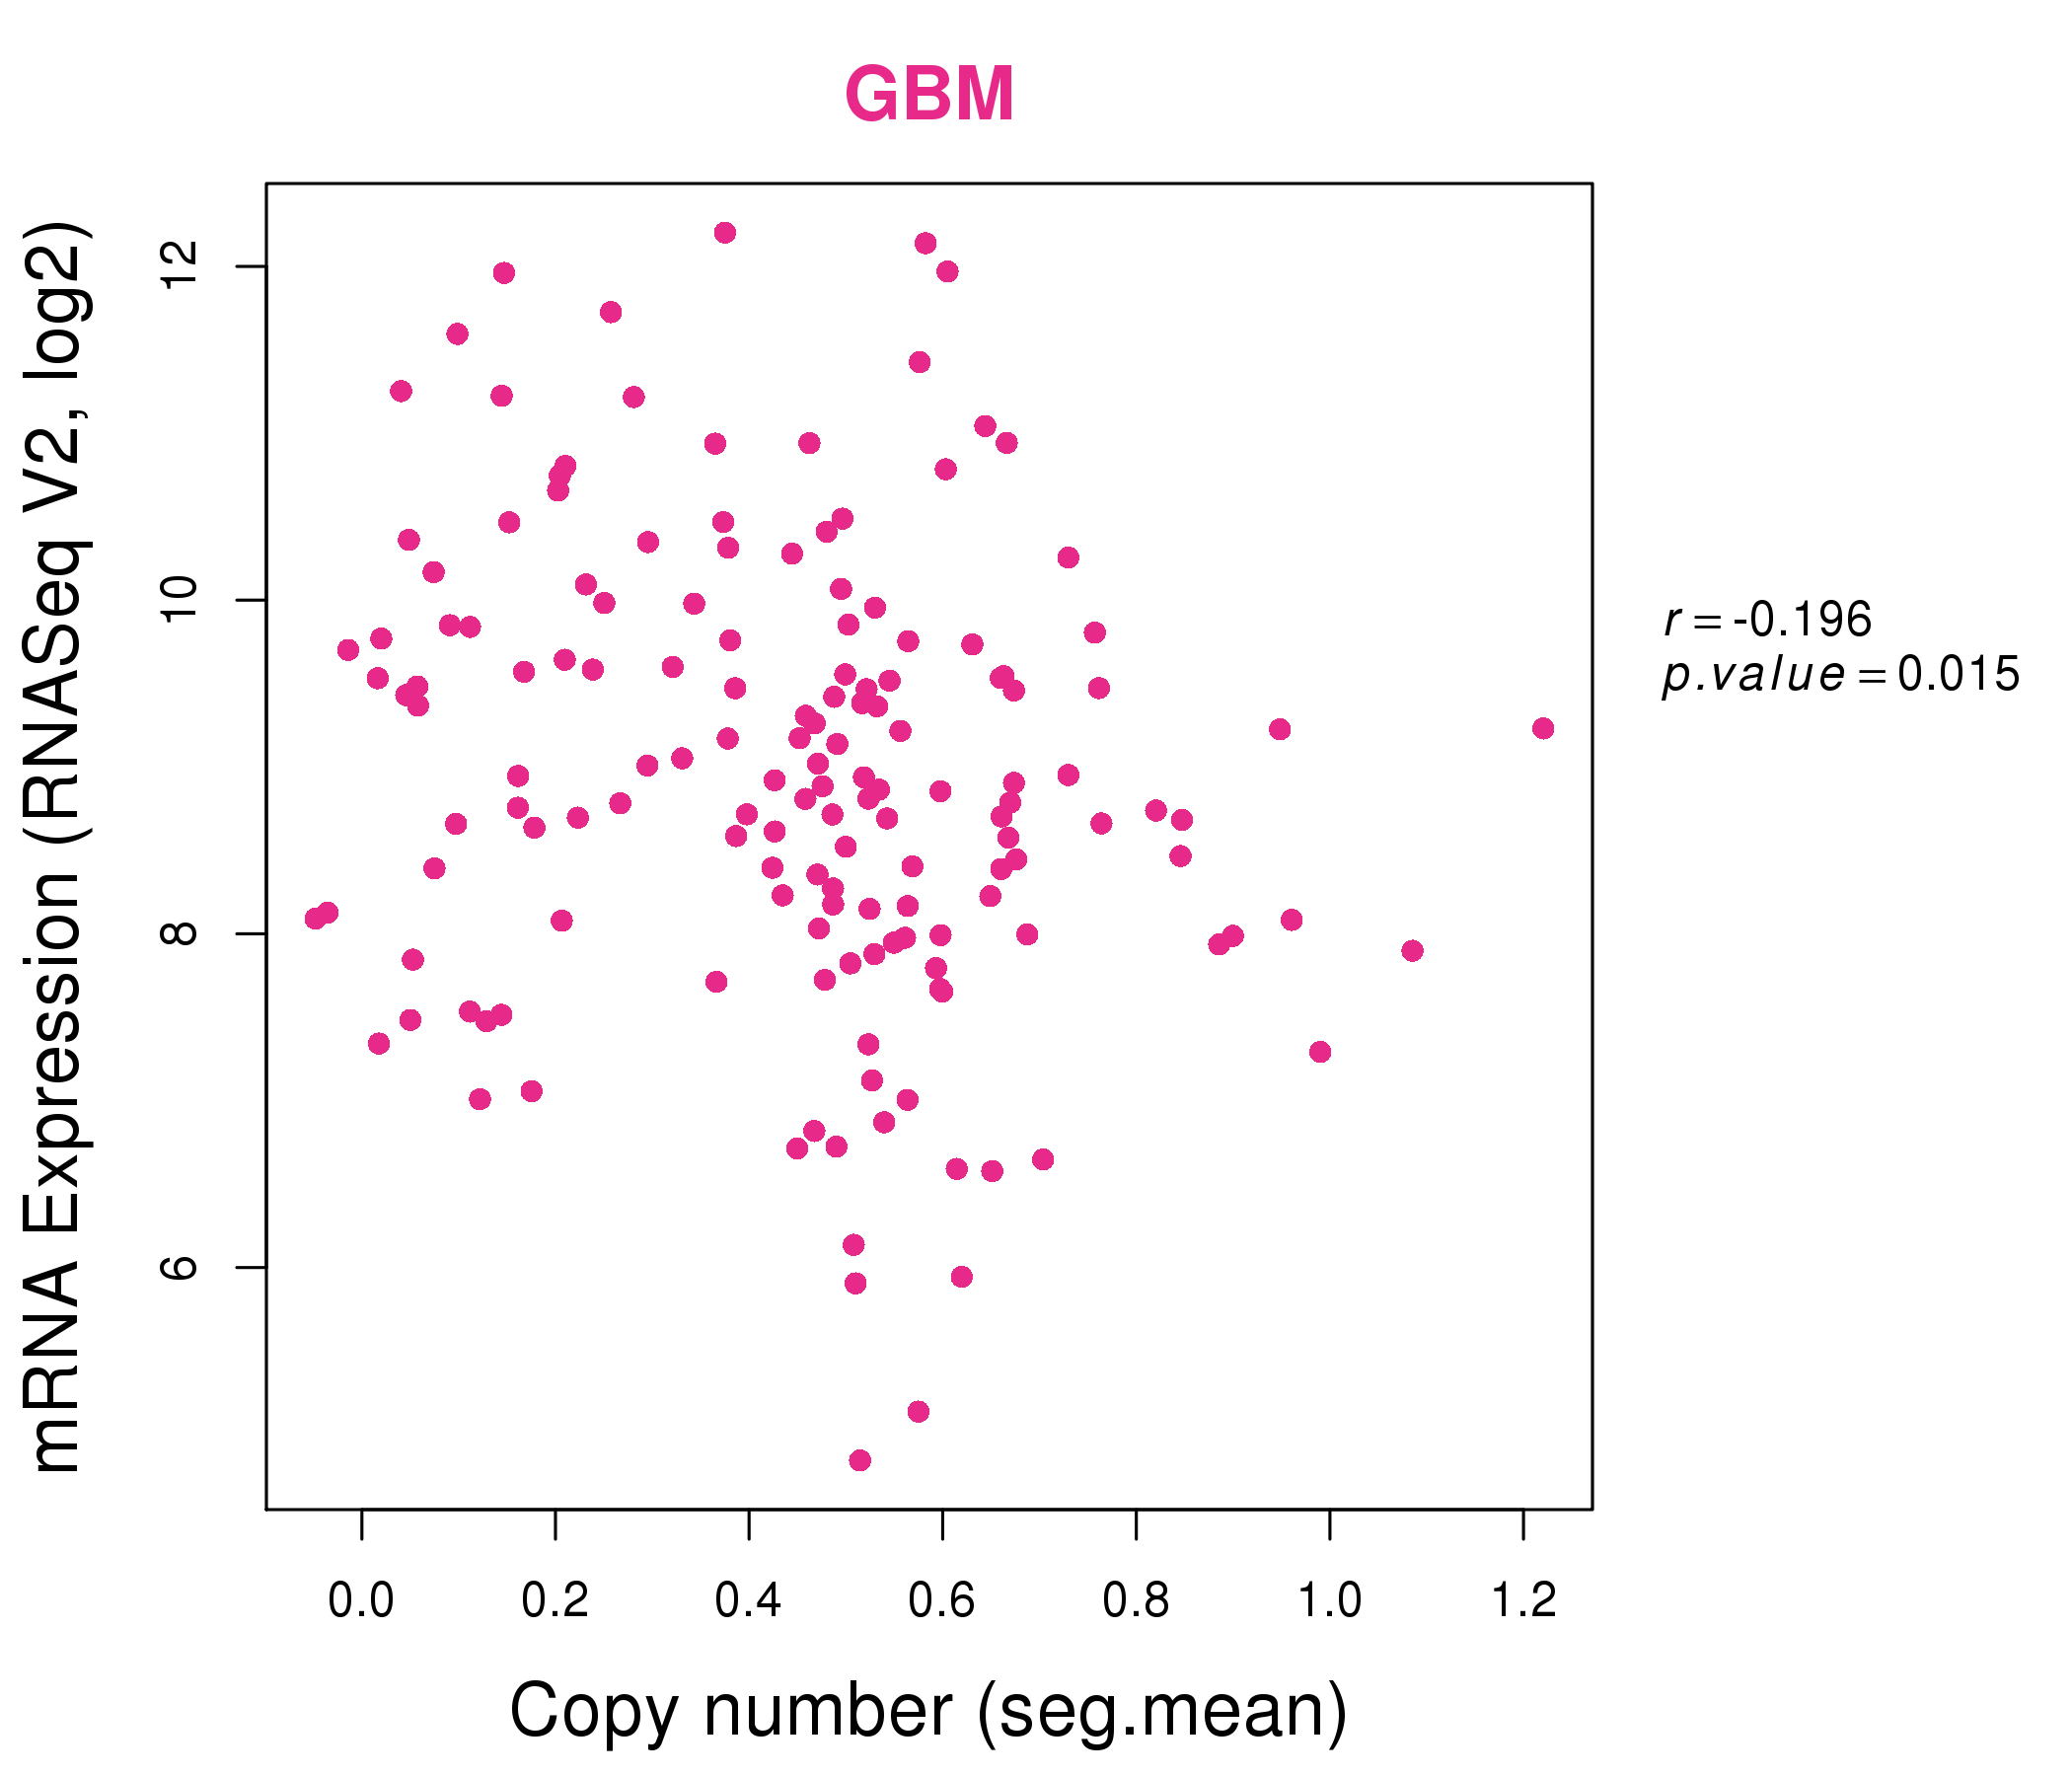
| * This plots show the correlation between CNV and gene expression. |
: Open all plots for all cancer types
 |
|
 |
|
| Top |
| Gene-Gene Network Information |
| * Co-Expression network figures were drawn using R package igraph. Only the top 20 genes with the highest correlations were shown. Red circle: input gene, orange circle: cell metabolism gene, sky circle: other gene |
: Open all plots for all cancer types
 |
| ||||
| ADIPOQ,AOC3,APOLD1,AQP7P1,BTNL9,CD300LG,GPIHBP1, ITIH5,KCNIP2,KLF15,KLF9,LIPE,NPR1,PDE2A, PDK4,PLIN1,S1PR1,SDPR,SPRY1,TMEM132C,TXNIP | ABCG8,CHAC2,DLST,DSG4,EYA1,FZD9,HADH, HOXA11,KIAA0408,KLF15,MLX,NIPSNAP3B,PDK4,PHYH, RNF157,SDPR,TMEM100,TOB2,TXNIP,VDAC2,ZFAND5 | ||||
 |
| ||||
| ANGPTL1,AOC3,AARD,CCDC69,CHRDL1,CRYAB,FHL1, HPD,HSPB6,ITIH5,KCNAB1,KCNB1,LIFR,LOC572558, MYOM1,P2RY14,PDE2A,PDK4,PHKG1,PRELP,SDPR | RGCC,CYP4B1,FAM107A,FKBP5,FOSB,GADD45B,GEM, GKN1,IP6K3,KLF15,KLF9,LRP1B,PDK4,PER1, SCNN1G,SOCS2,STC1,TFAP2B,TUB,ZB |

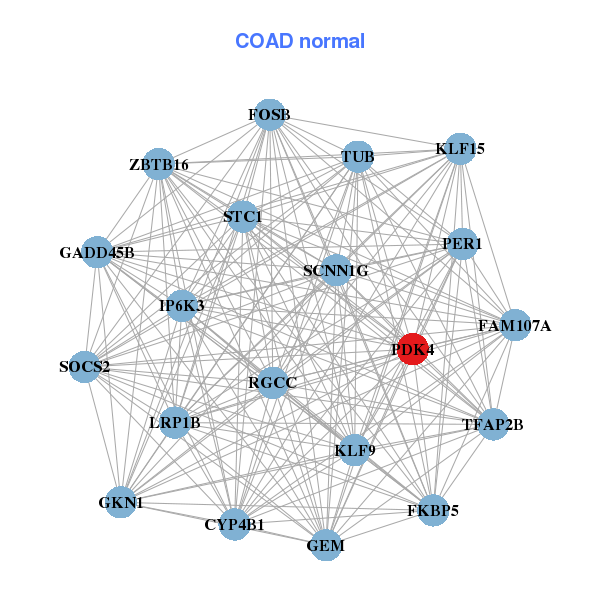
| * Co-Expression network figures were drawn using R package igraph. Only the top 20 genes with the highest correlations were shown. Red circle: input gene, orange circle: cell metabolism gene, sky circle: other gene |
: Open all plots for all cancer types
| Top |
: Open all interacting genes' information including KEGG pathway for all interacting genes from DAVID
| Top |
| Pharmacological Information for PDK4 |
| DB Category | DB Name | DB's ID and Url link |
| Chemistry | BindingDB | Q16654; -. |
| Chemistry | ChEMBL | CHEMBL2096665; -. |
| Organism-specific databases | PharmGKB | PA33157; -. |
| Organism-specific databases | CTD | 5166; -. |
| * Gene Centered Interaction Network. |
 |
| * Drug Centered Interaction Network. |
| DrugBank ID | Target Name | Drug Groups | Generic Name | Drug Centered Network | Drug Structure |
| DB08356 | pyruvate dehydrogenase kinase, isozyme 4 | experimental | 4-[4-(4-methoxyphenyl)-5-methyl-1H-pyrazol-3-yl]benzene-1,3-diol | 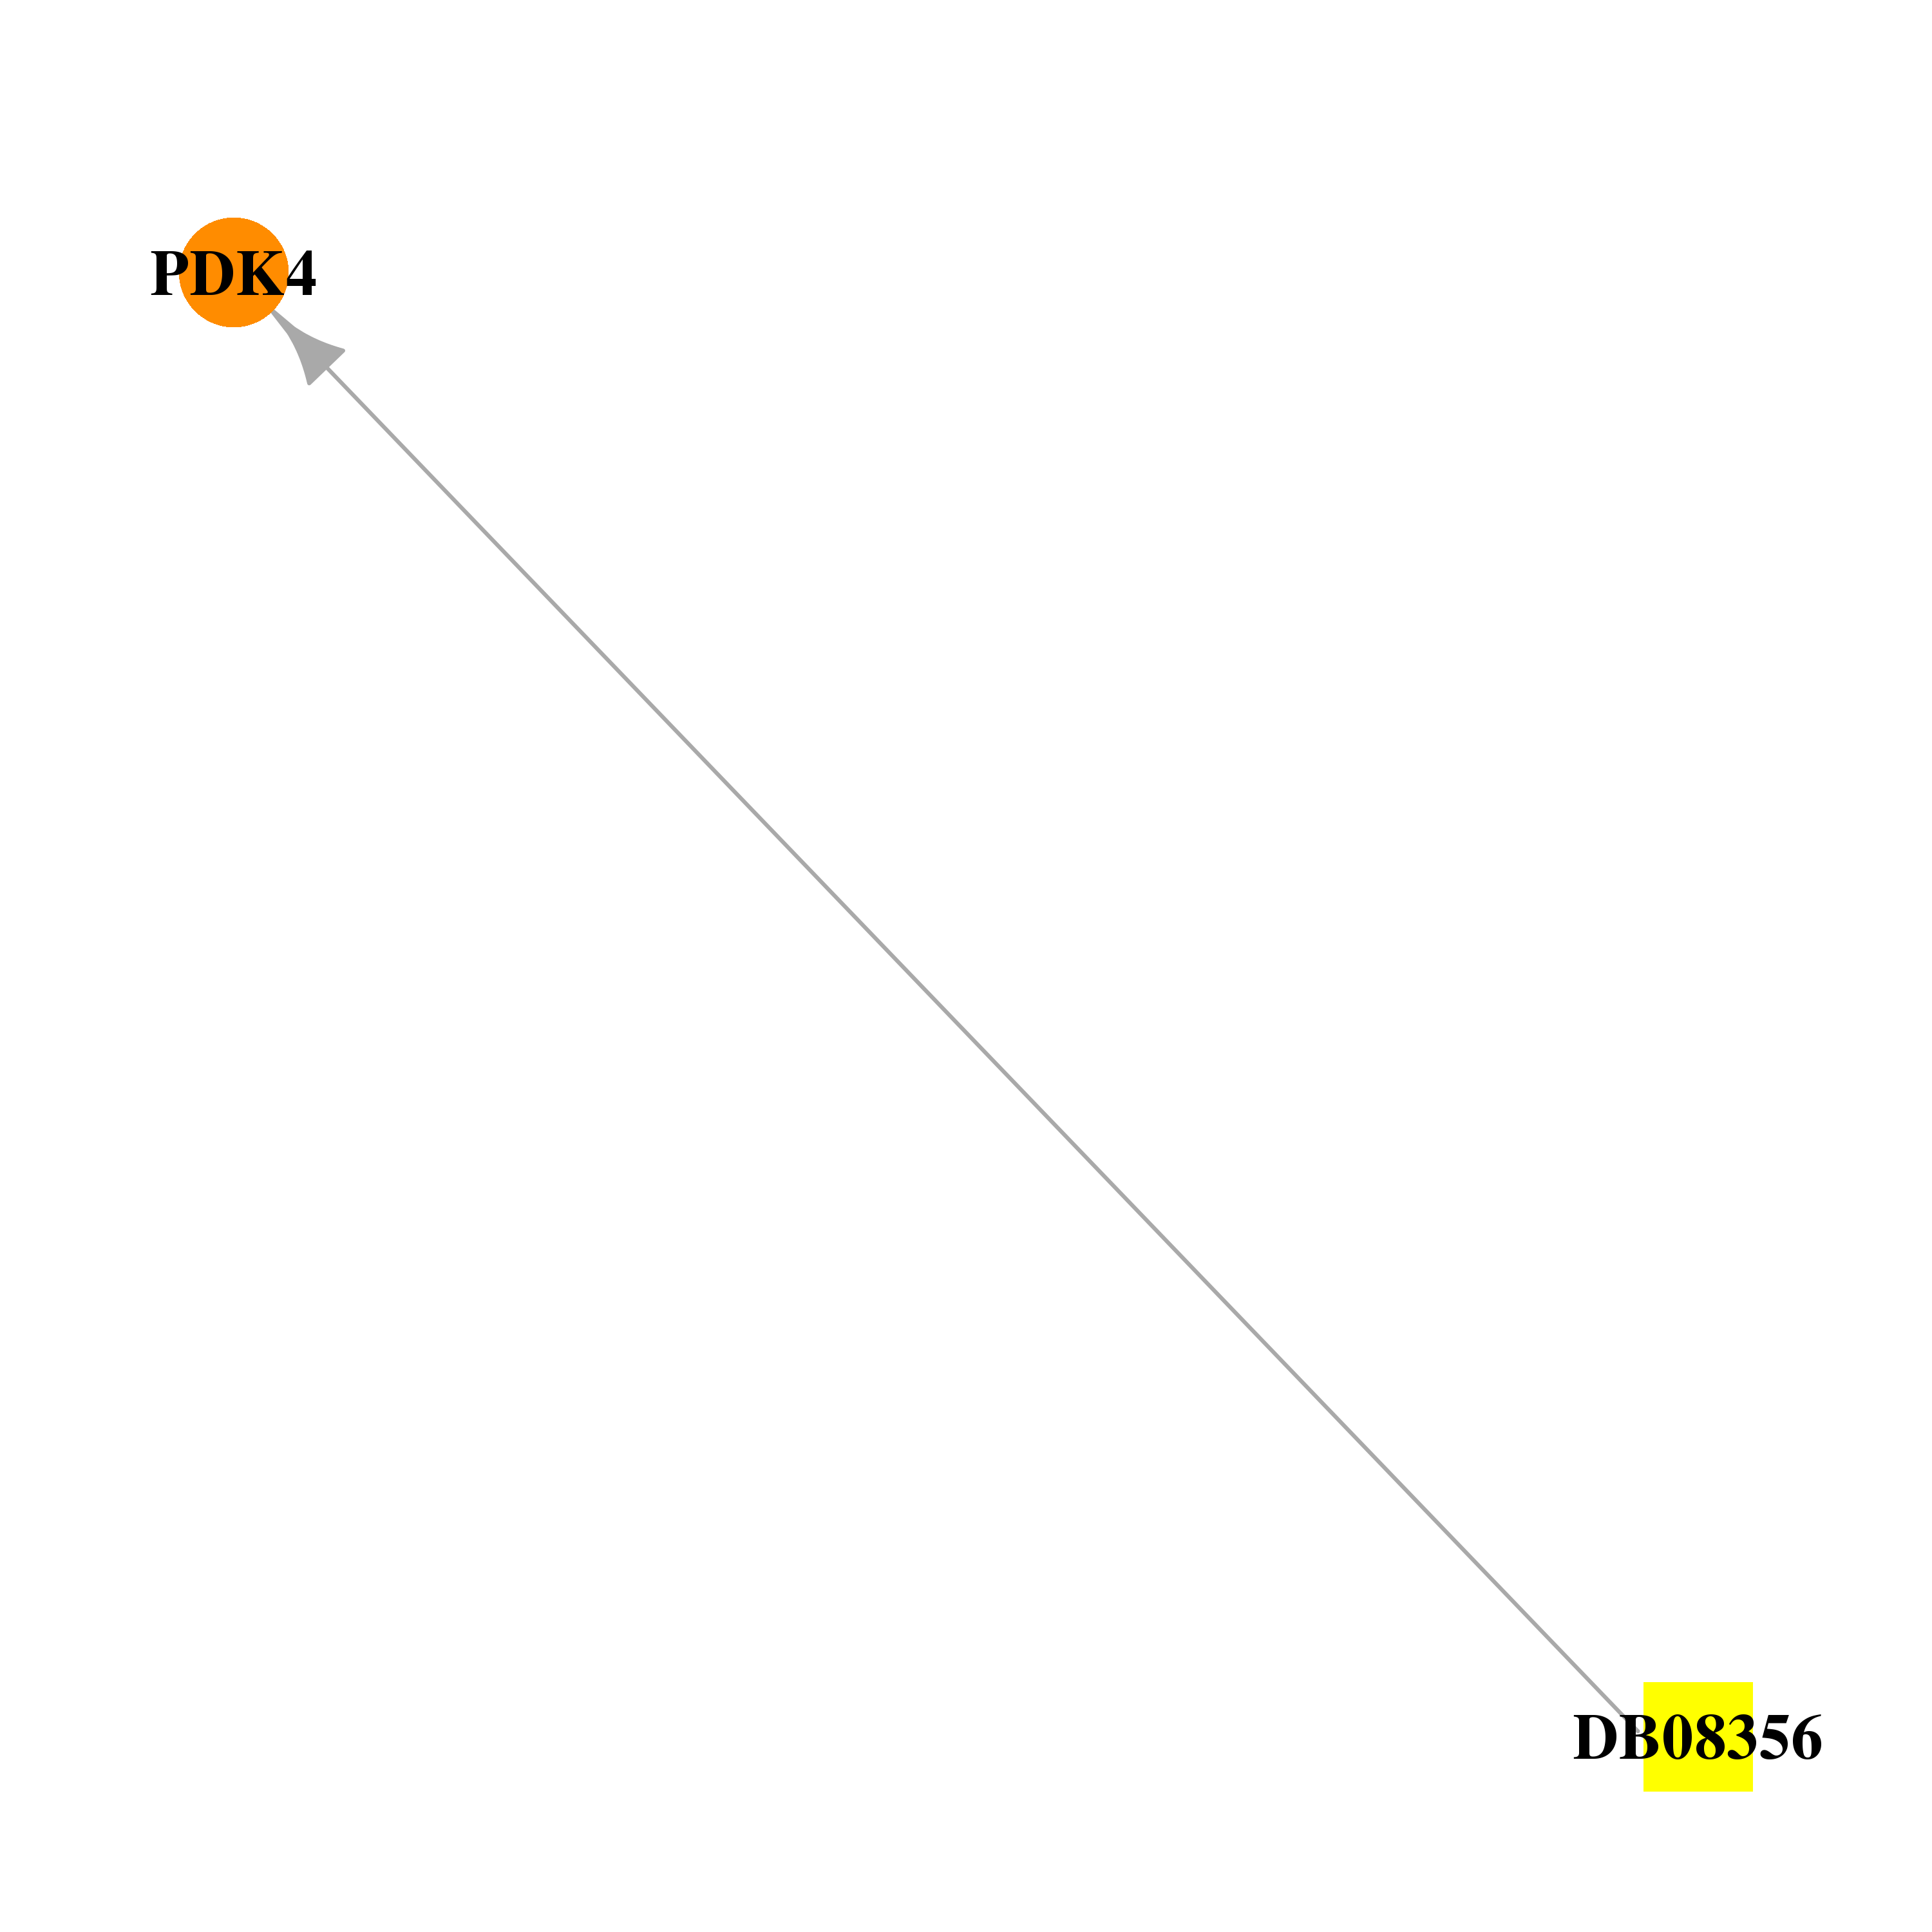 | 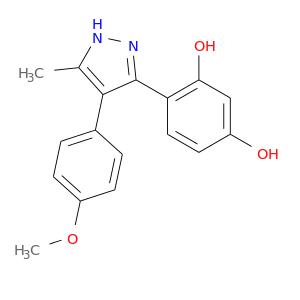 |
| Top |
| Cross referenced IDs for PDK4 |
| * We obtained these cross-references from Uniprot database. It covers 150 different DBs, 18 categories. http://www.uniprot.org/help/cross_references_section |
: Open all cross reference information
|
Copyright © 2016-Present - The Univsersity of Texas Health Science Center at Houston @ |