|
|||||||||||||||||||||||||||||||||||||||||||||||||||||||||||||||||||||||||||||||||||||||||||||||||||||||||||||||||||||||||||||||||||||||||||||||||||||||||||||||||||||||||||||||||||||||||||||||||||||||||||||||||||||||||||||||||||||||||||||||||||||||||||||||||||||||||||||||||||||||||||||||||||||||||||||||||||||||||||||||||||||||||||||||||||||||||||||||
| |
| Phenotypic Information (metabolism pathway, cancer, disease, phenome) |
| |
| |
| Gene-Gene Network Information: Co-Expression Network, Interacting Genes & KEGG |
| |
|


| Gene Summary for ENPP1 |
| Basic gene info. | Gene symbol | ENPP1 |
| Gene name | ectonucleotide pyrophosphatase/phosphodiesterase 1 | |
| Synonyms | ARHR2|COLED|M6S1|NPP1|NPPS|PC-1|PCA1|PDNP1 | |
| Cytomap | UCSC genome browser: 6q22-q23 | |
| Genomic location | chr6 :132129155-132216295 | |
| Type of gene | protein-coding | |
| RefGenes | NM_006208.2, | |
| Ensembl id | ENSG00000197594 | |
| Description | E-NPP 1Ly-41 antigenalkaline phosphodiesterase 1ectonucleotide pyrophosphatase/phosphodiesterase family member 1membrane component chromosome 6 surface marker 1membrane component, chromosome 6, surface marker 1phosphodiesterase I/nucleotide pyrophos | |
| Modification date | 20141222 | |
| dbXrefs | MIM : 173335 | |
| HGNC : HGNC | ||
| Ensembl : ENSG00000197594 | ||
| HPRD : 01415 | ||
| Vega : OTTHUMG00000015572 | ||
| Protein | UniProt: go to UniProt's Cross Reference DB Table | |
| Expression | CleanEX: HS_ENPP1 | |
| BioGPS: 5167 | ||
| Gene Expression Atlas: ENSG00000197594 | ||
| The Human Protein Atlas: ENSG00000197594 | ||
| Pathway | NCI Pathway Interaction Database: ENPP1 | |
| KEGG: ENPP1 | ||
| REACTOME: ENPP1 | ||
| ConsensusPathDB | ||
| Pathway Commons: ENPP1 | ||
| Metabolism | MetaCyc: ENPP1 | |
| HUMANCyc: ENPP1 | ||
| Regulation | Ensembl's Regulation: ENSG00000197594 | |
| miRBase: chr6 :132,129,155-132,216,295 | ||
| TargetScan: NM_006208 | ||
| cisRED: ENSG00000197594 | ||
| Context | iHOP: ENPP1 | |
| cancer metabolism search in PubMed: ENPP1 | ||
| UCL Cancer Institute: ENPP1 | ||
| Assigned class in ccmGDB | C | |
| Top |
| Phenotypic Information for ENPP1(metabolism pathway, cancer, disease, phenome) |
| Cancer | CGAP: ENPP1 |
| Familial Cancer Database: ENPP1 | |
| * This gene is included in those cancer gene databases. |
|
|
|
|
|
|
| |||||||||||||||||||||||||||||||||||||||||||||||||||||||||||||||||||||||||||||||||||||||||||||||||||||||||||||||||||||||||||||||||||||||||||||||||||||||||||||||||||||||||||||||||||||||||||||||||||||||||||||||||||||||||||||||||||||||||||||||||||||||||||||||||||||||||||||||||||||||||||||||||||||||||||||||||||||||||||||||||||||||||||||||||||||||||
Oncogene 1 | Significant driver gene in | ||||||||||||||||||||||||||||||||||||||||||||||||||||||||||||||||||||||||||||||||||||||||||||||||||||||||||||||||||||||||||||||||||||||||||||||||||||||||||||||||||||||||||||||||||||||||||||||||||||||||||||||||||||||||||||||||||||||||||||||||||||||||||||||||||||||||||||||||||||||||||||||||||||||||||||||||||||||||||||||||||||||||||||||||||||||||||||||
| cf) number; DB name 1 Oncogene; http://nar.oxfordjournals.org/content/35/suppl_1/D721.long, 2 Tumor Suppressor gene; https://bioinfo.uth.edu/TSGene/, 3 Cancer Gene Census; http://www.nature.com/nrc/journal/v4/n3/abs/nrc1299.html, 4 CancerGenes; http://nar.oxfordjournals.org/content/35/suppl_1/D721.long, 5 Network of Cancer Gene; http://ncg.kcl.ac.uk/index.php, 1Therapeutic Vulnerabilities in Cancer; http://cbio.mskcc.org/cancergenomics/statius/ |
| KEGG_PURINE_METABOLISM KEGG_STARCH_AND_SUCROSE_METABOLISM KEGG_RIBOFLAVIN_METABOLISM KEGG_NICOTINATE_AND_NICOTINAMIDE_METABOLISM REACTOME_METABOLISM_OF_VITAMINS_AND_COFACTORS | |
| OMIM | |
| Orphanet | |
| Disease | KEGG Disease: ENPP1 |
| MedGen: ENPP1 (Human Medical Genetics with Condition) | |
| ClinVar: ENPP1 | |
| Phenotype | MGI: ENPP1 (International Mouse Phenotyping Consortium) |
| PhenomicDB: ENPP1 | |
| Mutations for ENPP1 |
| * Under tables are showing count per each tissue to give us broad intuition about tissue specific mutation patterns.You can go to the detailed page for each mutation database's web site. |
| - Statistics for Tissue and Mutation type | Top |
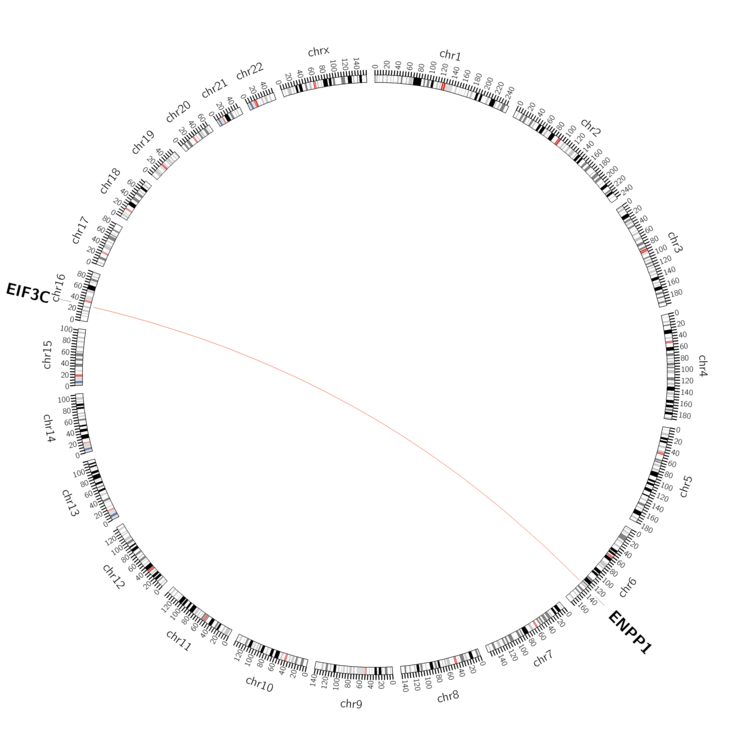 |
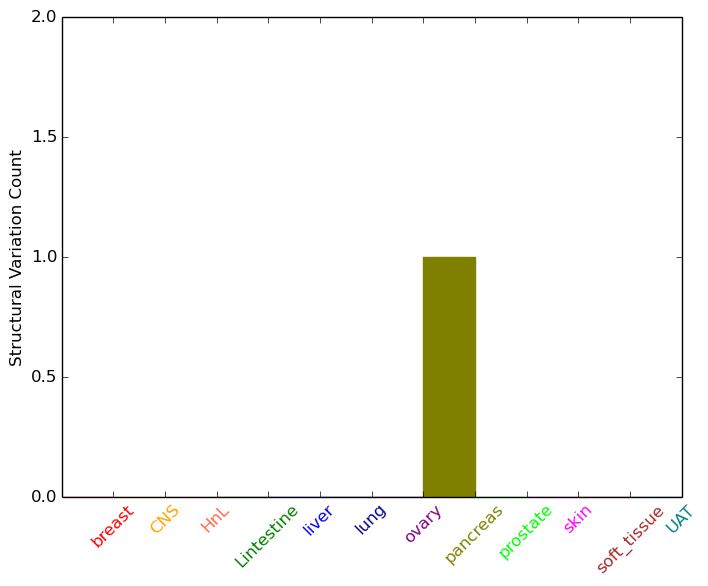
| - For Inter-chromosomal Variations |
| * Inter-chromosomal variantions includes 'interchromosomal amplicon to amplicon', 'interchromosomal amplicon to non-amplified dna', 'interchromosomal insertion', 'Interchromosomal unknown type'. |
 |
| - For Intra-chromosomal Variations |
| There's no intra-chromosomal structural variation. |
| Sample | Symbol_a | Chr_a | Start_a | End_a | Symbol_b | Chr_b | Start_b | End_b |
| cf) Tissue number; Tissue name (1;Breast, 2;Central_nervous_system, 3;Haematopoietic_and_lymphoid_tissue, 4;Large_intestine, 5;Liver, 6;Lung, 7;Ovary, 8;Pancreas, 9;Prostate, 10;Skin, 11;Soft_tissue, 12;Upper_aerodigestive_tract) |
| * From mRNA Sanger sequences, Chitars2.0 arranged chimeric transcripts. This table shows ENPP1 related fusion information. |
| ID | Head Gene | Tail Gene | Accession | Gene_a | qStart_a | qEnd_a | Chromosome_a | tStart_a | tEnd_a | Gene_a | qStart_a | qEnd_a | Chromosome_a | tStart_a | tEnd_a |
| Top |
| Mutation type/ Tissue ID | brca | cns | cerv | endome | haematopo | kidn | Lintest | liver | lung | ns | ovary | pancre | prost | skin | stoma | thyro | urina | |||
| Total # sample | 1 | 1 | ||||||||||||||||||
| GAIN (# sample) | 1 | |||||||||||||||||||
| LOSS (# sample) | 1 |
| cf) Tissue ID; Tissue type (1; Breast, 2; Central_nervous_system, 3; Cervix, 4; Endometrium, 5; Haematopoietic_and_lymphoid_tissue, 6; Kidney, 7; Large_intestine, 8; Liver, 9; Lung, 10; NS, 11; Ovary, 12; Pancreas, 13; Prostate, 14; Skin, 15; Stomach, 16; Thyroid, 17; Urinary_tract) |
| Top |
|
 |
| Top |
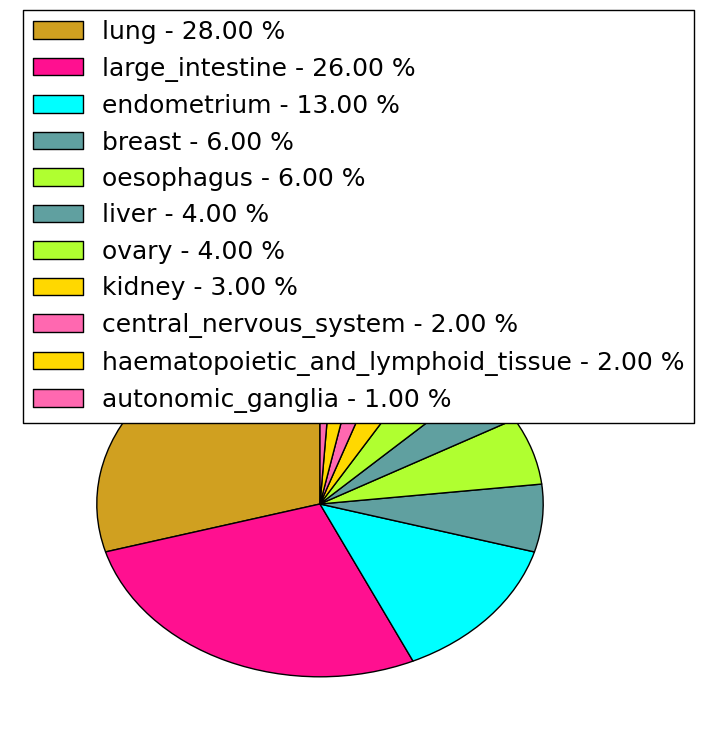
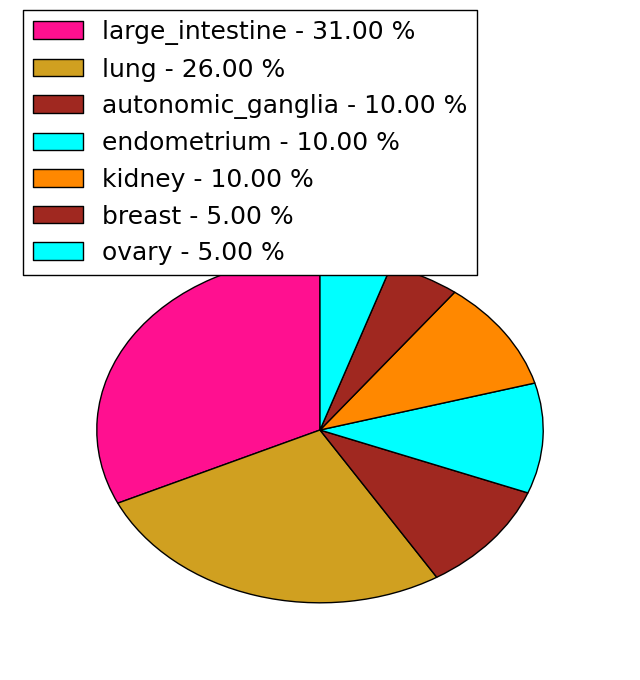
| Stat. for Non-Synonymous SNVs (# total SNVs=88) | (# total SNVs=19) |
 |  |
(# total SNVs=0) | (# total SNVs=0) |
| Top |
| * When you move the cursor on each content, you can see more deailed mutation information on the Tooltip. Those are primary_site,primary_histology,mutation(aa),pubmedID. |
| GRCh37 position | Mutation(aa) | Unique sampleID count |
| chr6:132211590-132211590 | p.E854G | 4 |
| chr6:132193231-132193231 | p.R424Q | 4 |
| chr6:132201173-132201173 | p.N648S | 3 |
| chr6:132211563-132211563 | p.G845E | 3 |
| chr6:132201163-132201163 | p.V645M | 2 |
| chr6:132206138-132206138 | p.V741V | 2 |
| chr6:132190590-132190590 | p.R404* | 2 |
| chr6:132171205-132171205 | p.G78E | 2 |
| chr6:132204911-132204911 | p.Q718* | 2 |
| chr6:132194055-132194055 | p.? | 2 |
| Top |
|
 |
| Point Mutation/ Tissue ID | 1 | 2 | 3 | 4 | 5 | 6 | 7 | 8 | 9 | 10 | 11 | 12 | 13 | 14 | 15 | 16 | 17 | 18 | 19 | 20 |
| # sample | 3 | 3 | 17 | 1 | 5 | 3 | 1 | 12 | 7 | 4 | 2 | 16 | 5 | 1 | 11 | |||||
| # mutation | 3 | 3 | 17 | 1 | 5 | 3 | 1 | 13 | 8 | 3 | 2 | 16 | 5 | 1 | 13 | |||||
| nonsynonymous SNV | 2 | 3 | 11 | 1 | 4 | 1 | 1 | 10 | 6 | 2 | 10 | 4 | 1 | 11 | ||||||
| synonymous SNV | 1 | 6 | 1 | 2 | 3 | 2 | 1 | 2 | 6 | 1 | 2 |
| cf) Tissue ID; Tissue type (1; BLCA[Bladder Urothelial Carcinoma], 2; BRCA[Breast invasive carcinoma], 3; CESC[Cervical squamous cell carcinoma and endocervical adenocarcinoma], 4; COAD[Colon adenocarcinoma], 5; GBM[Glioblastoma multiforme], 6; Glioma Low Grade, 7; HNSC[Head and Neck squamous cell carcinoma], 8; KICH[Kidney Chromophobe], 9; KIRC[Kidney renal clear cell carcinoma], 10; KIRP[Kidney renal papillary cell carcinoma], 11; LAML[Acute Myeloid Leukemia], 12; LUAD[Lung adenocarcinoma], 13; LUSC[Lung squamous cell carcinoma], 14; OV[Ovarian serous cystadenocarcinoma ], 15; PAAD[Pancreatic adenocarcinoma], 16; PRAD[Prostate adenocarcinoma], 17; SKCM[Skin Cutaneous Melanoma], 18:STAD[Stomach adenocarcinoma], 19:THCA[Thyroid carcinoma], 20:UCEC[Uterine Corpus Endometrial Carcinoma]) |
| Top |
| * We represented just top 10 SNVs. When you move the cursor on each content, you can see more deailed mutation information on the Tooltip. Those are primary_site, primary_histology, mutation(aa), pubmedID. |
| Genomic Position | Mutation(aa) | Unique sampleID count |
| chr6:132211590 | p.E906G | 4 |
| chr6:132171147 | p.R111C | 3 |
| chr6:132207750 | p.V793V | 2 |
| chr6:132203595 | p.Y737Y | 2 |
| chr6:132206138 | p.F831F | 2 |
| chr6:132179870 | p.L97L | 1 |
| chr6:132203498 | p.T209T | 1 |
| chr6:132211589 | p.N411K | 1 |
| chr6:132168933 | p.P690L | 1 |
| chr6:132189200 | p.R782Q | 1 |
| * Copy number data were extracted from TCGA using R package TCGA-Assembler. The URLs of all public data files on TCGA DCC data server were gathered on Jan-05-2015. Function ProcessCNAData in TCGA-Assembler package was used to obtain gene-level copy number value which is calculated as the average copy number of the genomic region of a gene. |
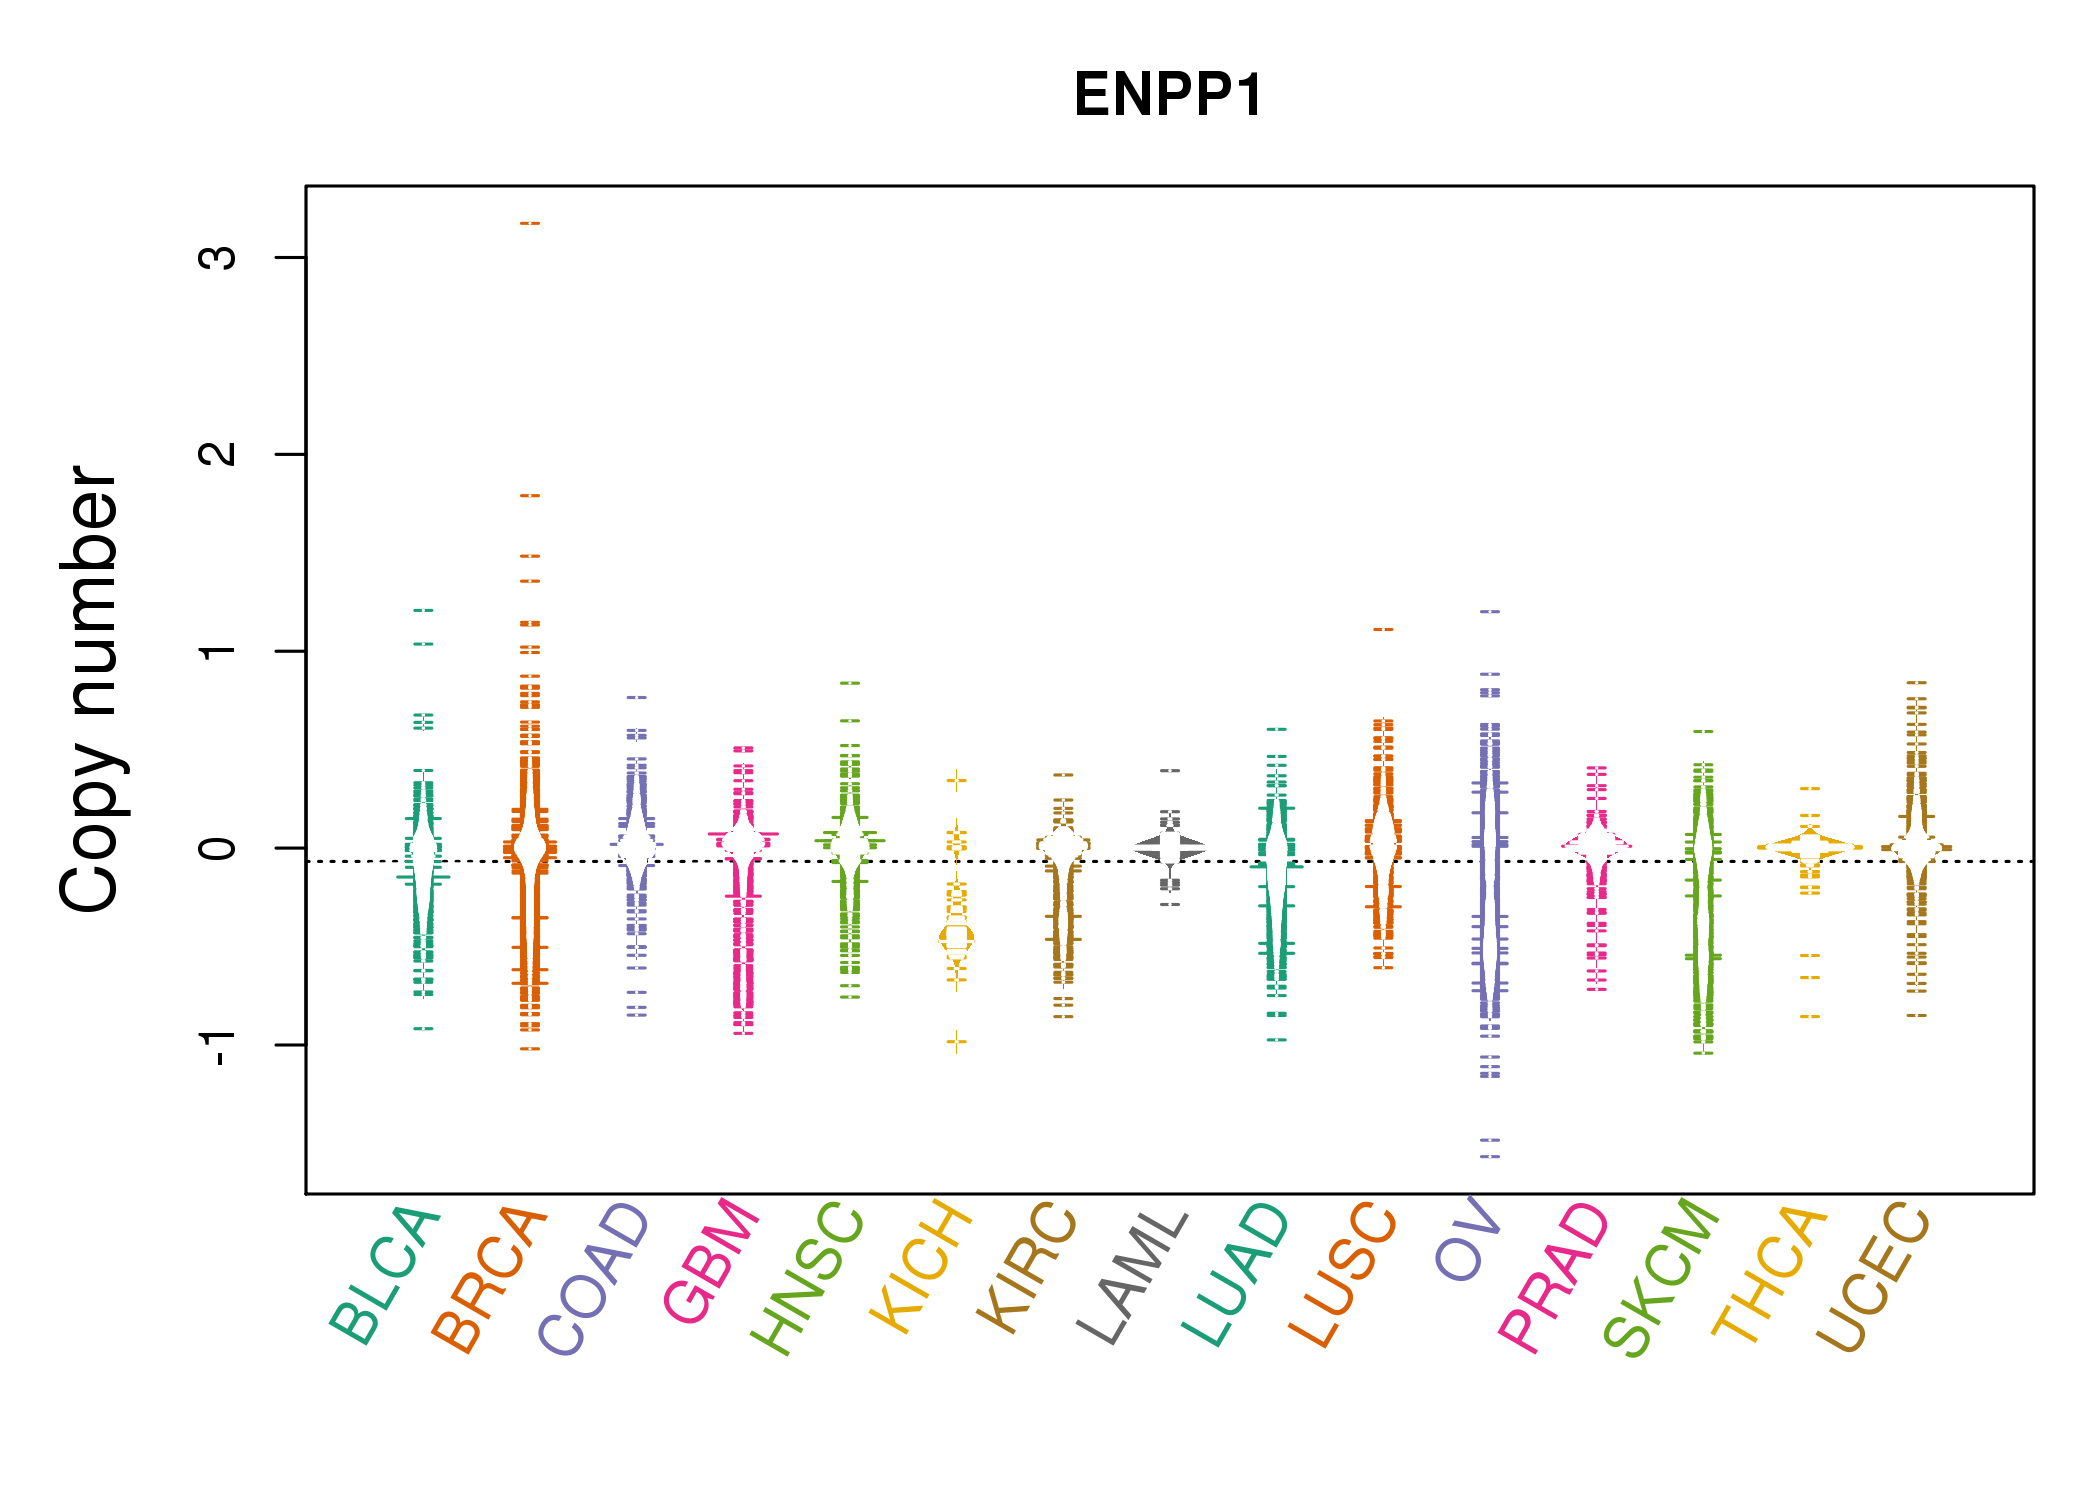 |
| cf) Tissue ID[Tissue type]: BLCA[Bladder Urothelial Carcinoma], BRCA[Breast invasive carcinoma], CESC[Cervical squamous cell carcinoma and endocervical adenocarcinoma], COAD[Colon adenocarcinoma], GBM[Glioblastoma multiforme], Glioma Low Grade, HNSC[Head and Neck squamous cell carcinoma], KICH[Kidney Chromophobe], KIRC[Kidney renal clear cell carcinoma], KIRP[Kidney renal papillary cell carcinoma], LAML[Acute Myeloid Leukemia], LUAD[Lung adenocarcinoma], LUSC[Lung squamous cell carcinoma], OV[Ovarian serous cystadenocarcinoma ], PAAD[Pancreatic adenocarcinoma], PRAD[Prostate adenocarcinoma], SKCM[Skin Cutaneous Melanoma], STAD[Stomach adenocarcinoma], THCA[Thyroid carcinoma], UCEC[Uterine Corpus Endometrial Carcinoma] |
| Top |
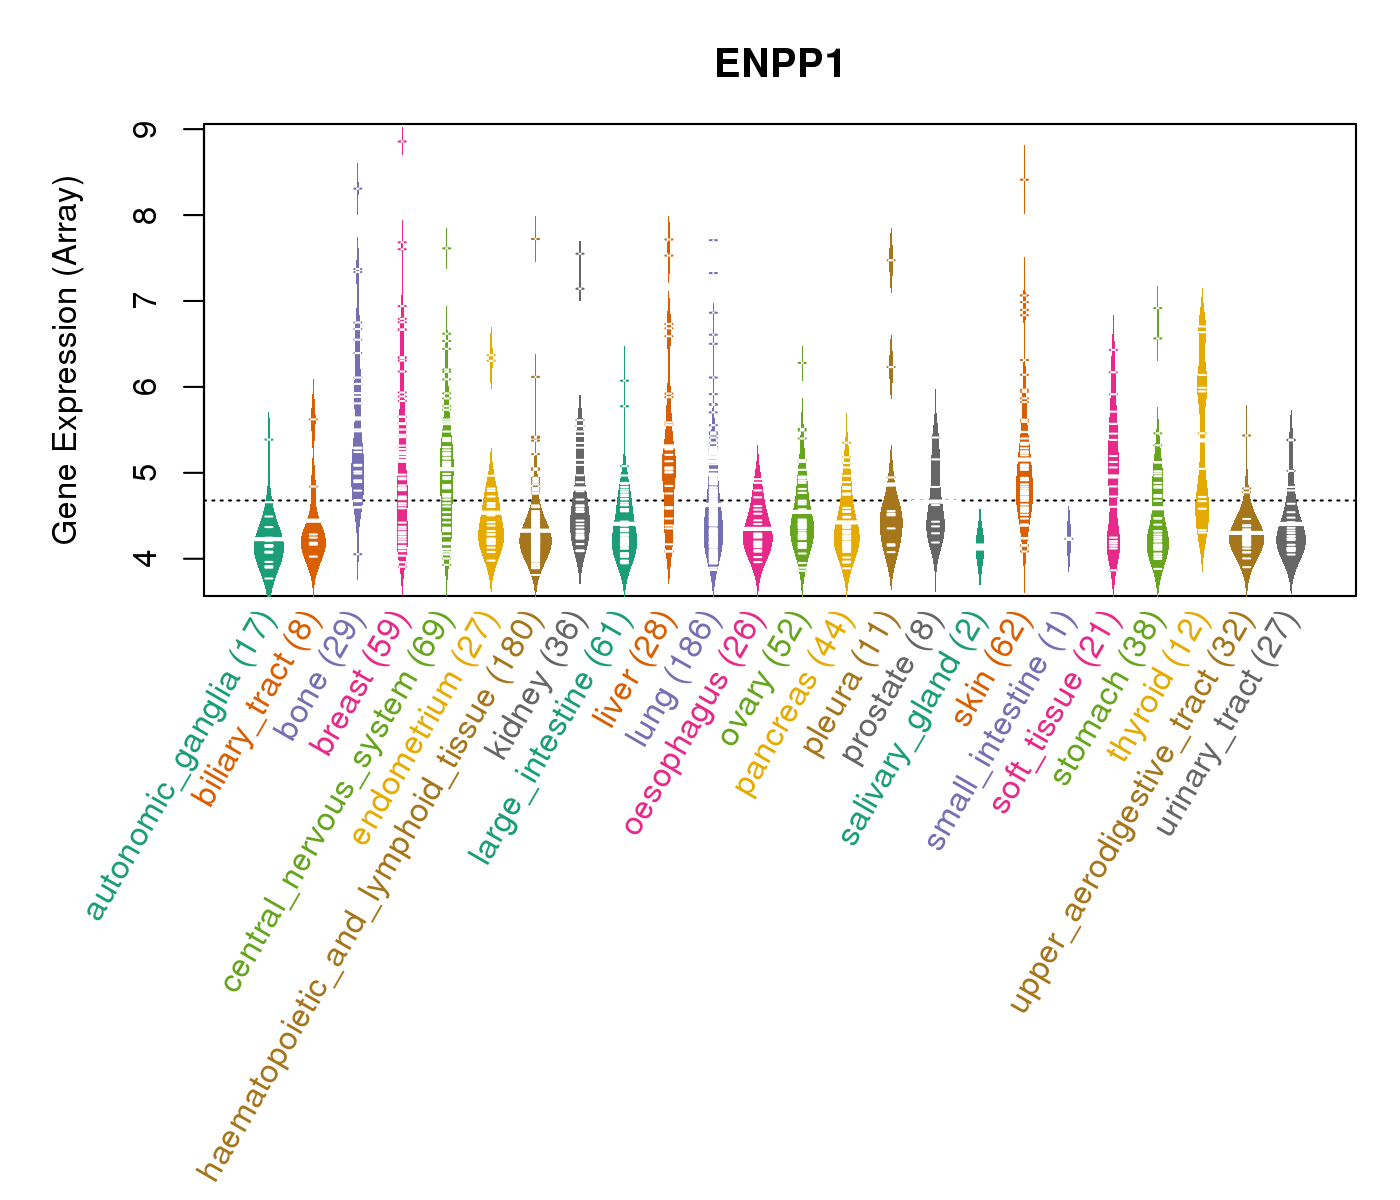
| Gene Expression for ENPP1 |
| * CCLE gene expression data were extracted from CCLE_Expression_Entrez_2012-10-18.res: Gene-centric RMA-normalized mRNA expression data. |
 |
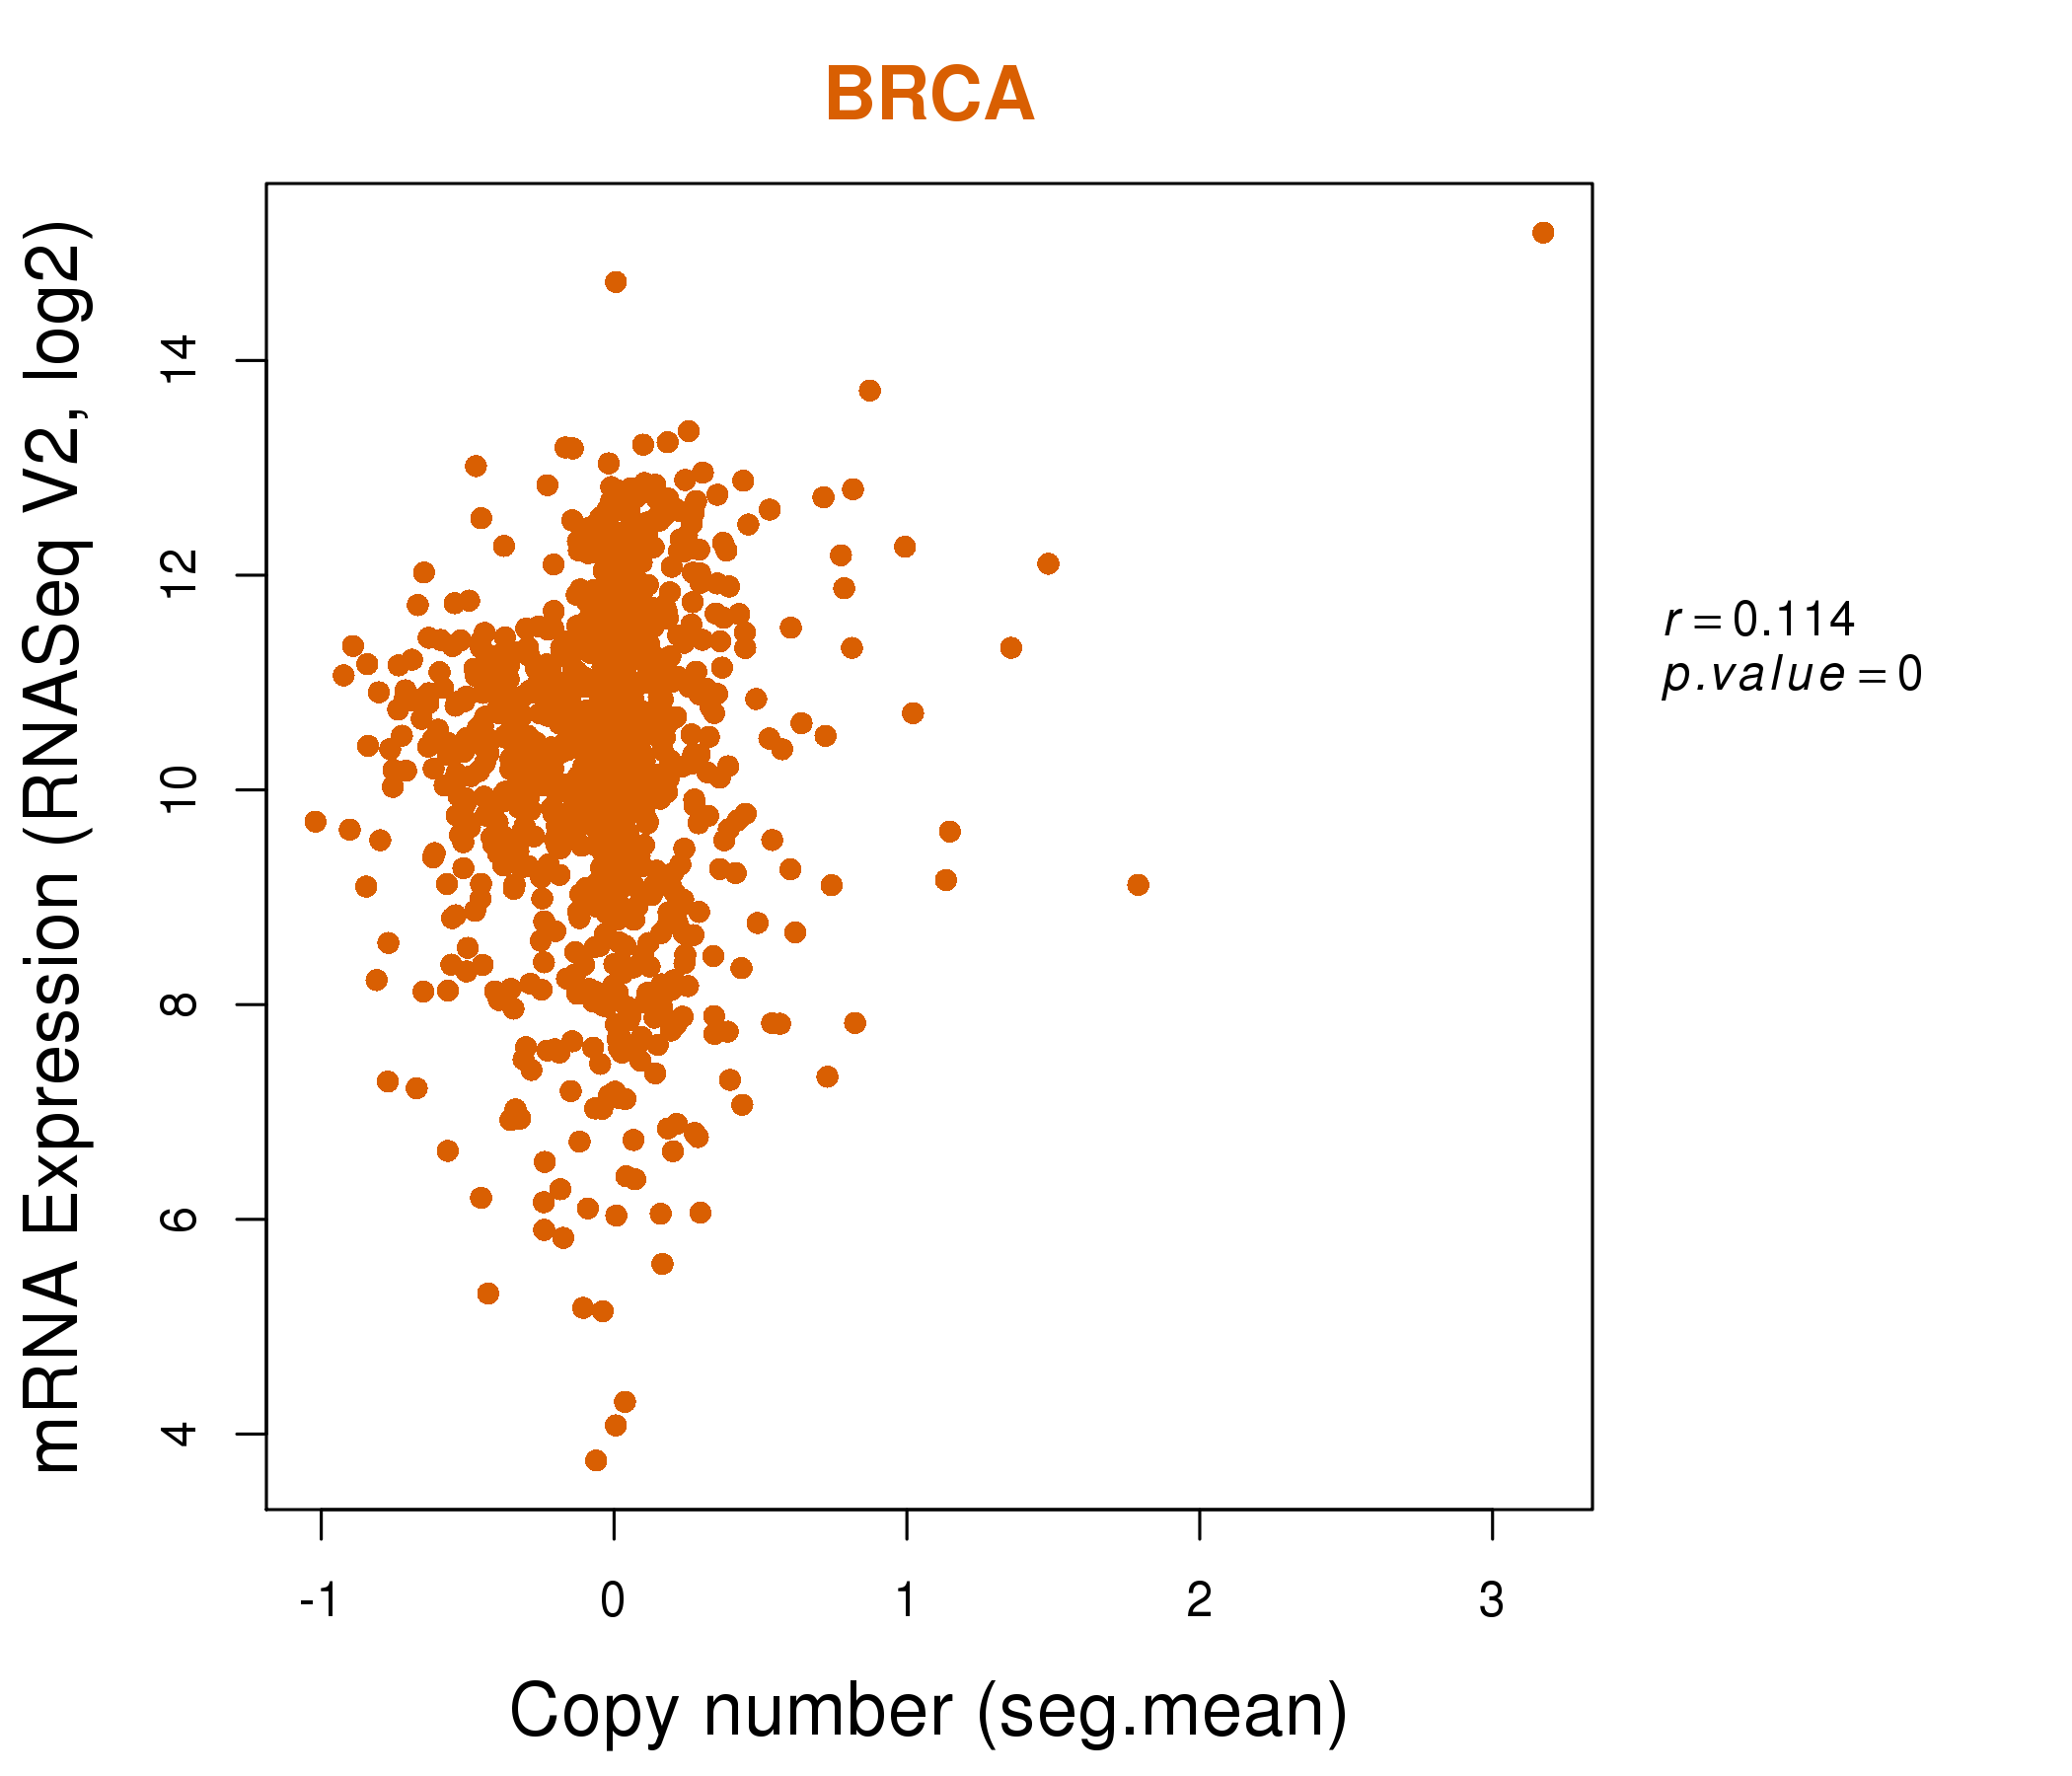
| * Normalized gene expression data of RNASeqV2 was extracted from TCGA using R package TCGA-Assembler. The URLs of all public data files on TCGA DCC data server were gathered at Jan-05-2015. Only eight cancer types have enough normal control samples for differential expression analysis. (t test, adjusted p<0.05 (using Benjamini-Hochberg FDR)) |
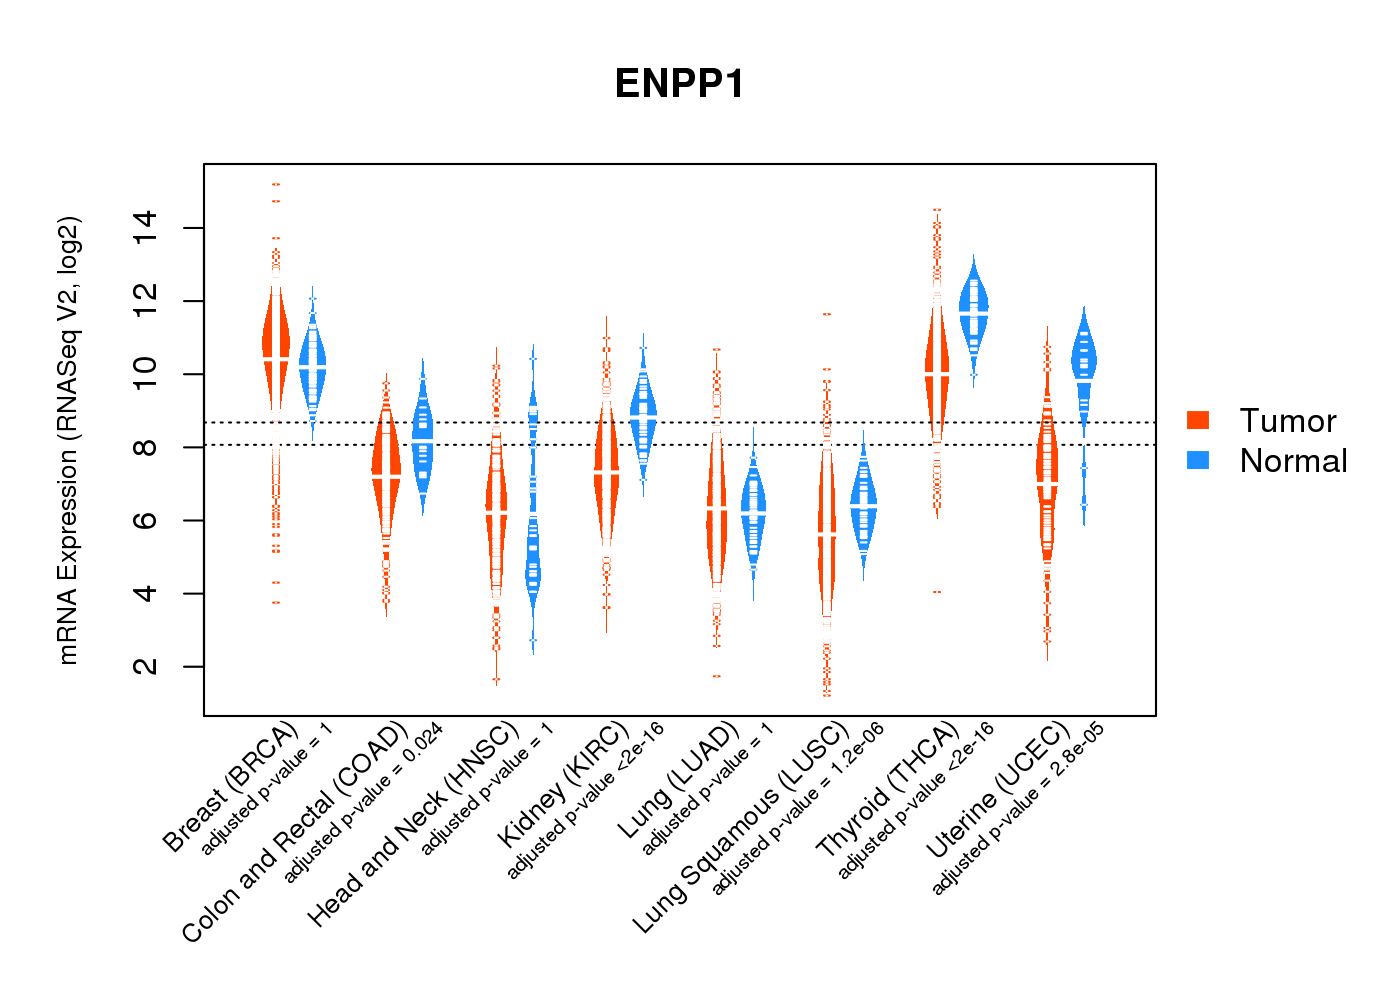 |
| Top |
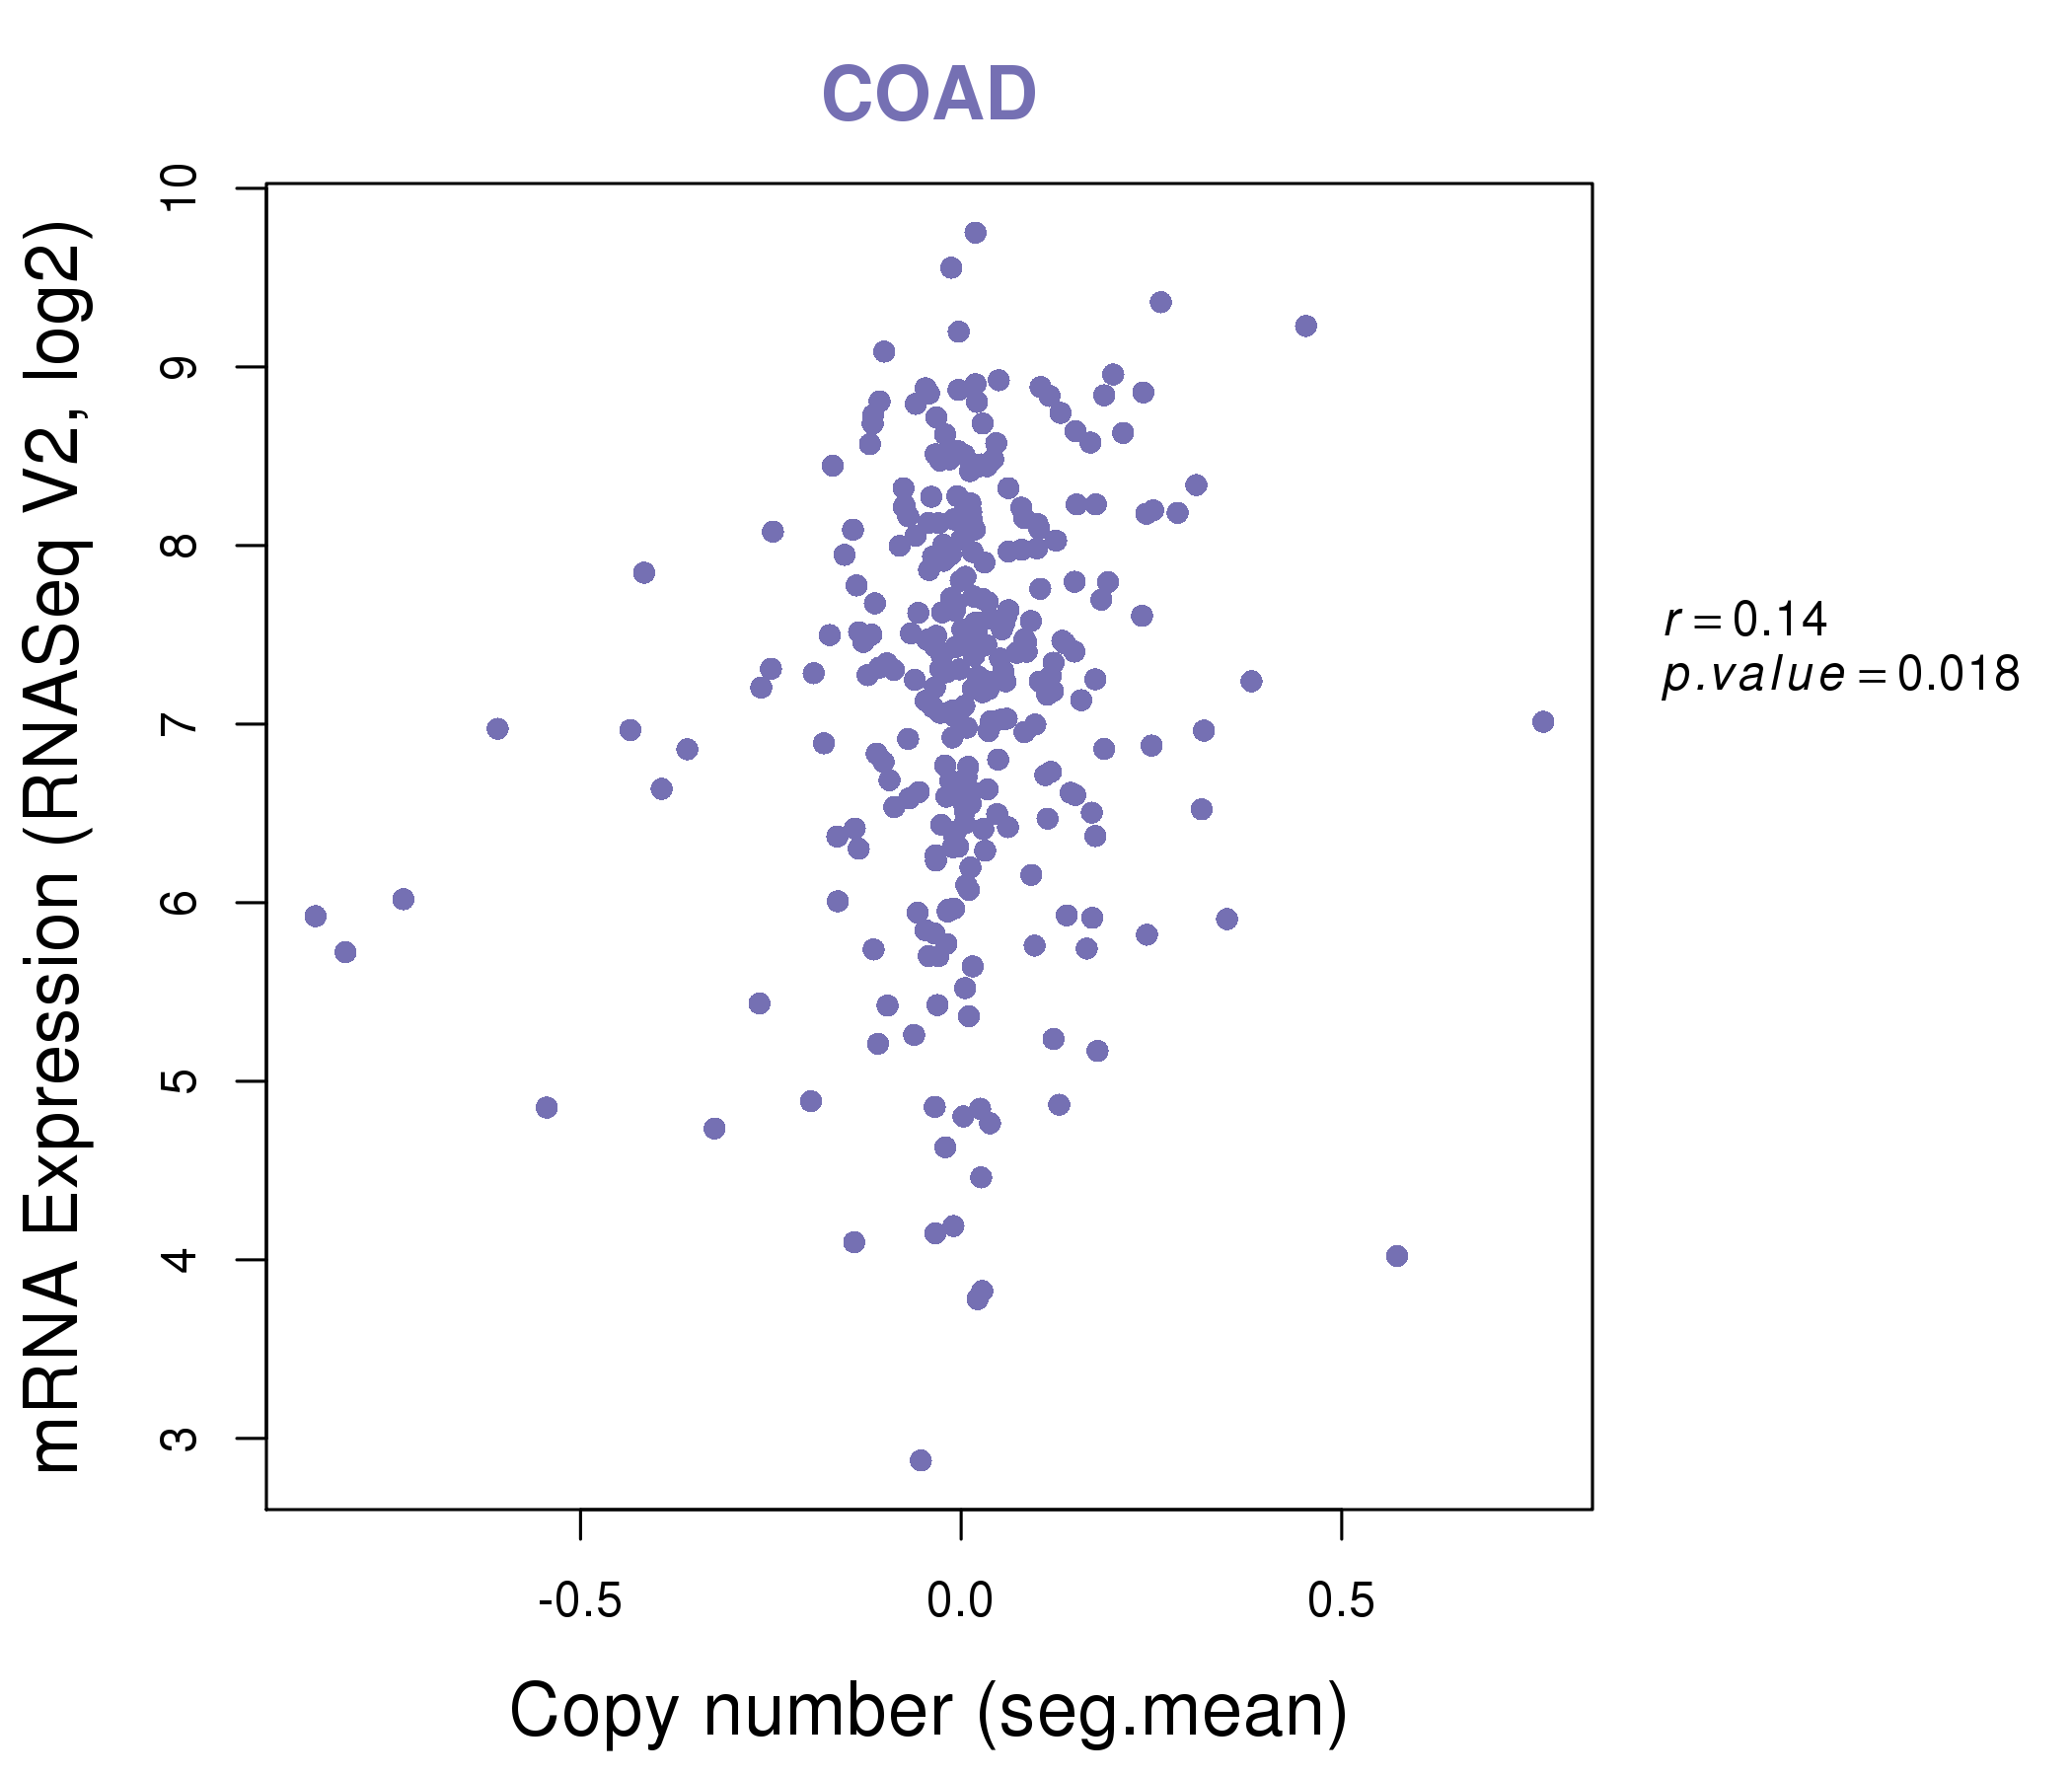
| * This plots show the correlation between CNV and gene expression. |
: Open all plots for all cancer types
 |
|
 |
|

| Top |
| Gene-Gene Network Information |
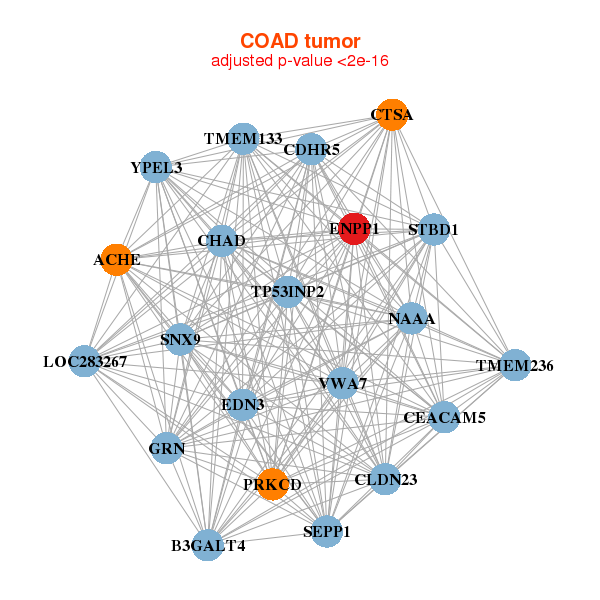
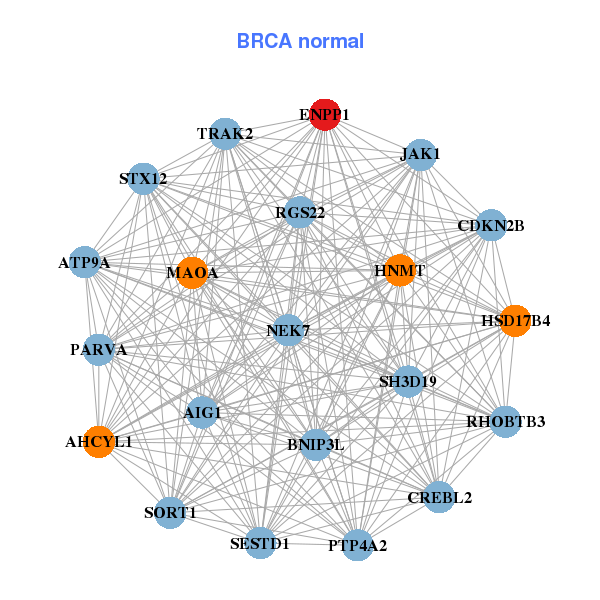
| * Co-Expression network figures were drawn using R package igraph. Only the top 20 genes with the highest correlations were shown. Red circle: input gene, orange circle: cell metabolism gene, sky circle: other gene |
: Open all plots for all cancer types
 |
| ||||
| AIM1,ATG5,SMIM14,C6orf203,LINC00589,ENPP1,FOXA1, GOLGA1,KCTD3,KRT40,KRTAP1-3,KRTAP3-2,KRTAP3-3,MAN1A1, MED23,NEDD1,PDSS2,SIPA1L2,STX7,XBP1,ZNRF3 | AHCYL1,AIG1,ATP9A,BNIP3L,CDKN2B,CREBL2,ENPP1, HNMT,HSD17B4,JAK1,MAOA,NEK7,PARVA,PTP4A2, RGS22,RHOBTB3,SESTD1,SH3D19,SORT1,STX12,TRAK2 | ||||
 |
| ||||
| ACHE,B3GALT4,VWA7,CDHR5,CEACAM5,CHAD,CLDN23, CTSA,EDN3,ENPP1,TMEM236,GRN,LOC283267,NAAA, PRKCD,SEPP1,SNX9,STBD1,TMEM133,TP53INP2,YPEL3 | ACOX1,APPL2,ATP1B1,BAHD1,STPG1,CDKN2B,CGN, RHOV___CHP1,CLCN2,ENPP1,ABHD17C,GBA,IST1,MAST2, MGLL,MYO15B,PEX26,RNF103,SFXN1,TMEM127,WASL |
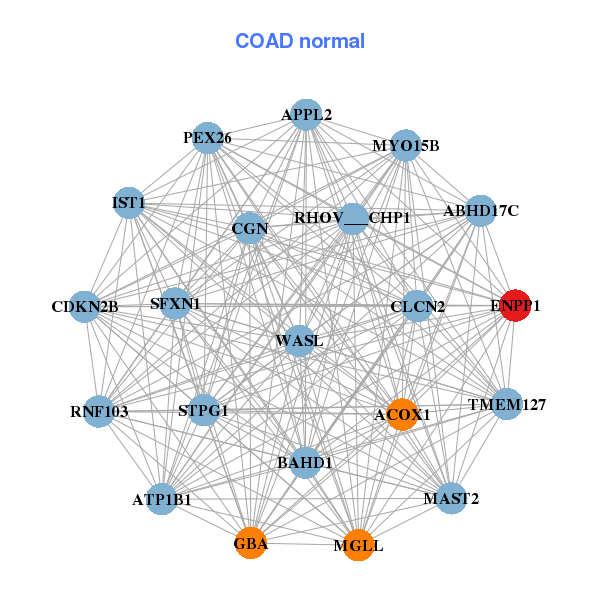
| * Co-Expression network figures were drawn using R package igraph. Only the top 20 genes with the highest correlations were shown. Red circle: input gene, orange circle: cell metabolism gene, sky circle: other gene |
: Open all plots for all cancer types
| Top |
: Open all interacting genes' information including KEGG pathway for all interacting genes from DAVID
| Top |
| Pharmacological Information for ENPP1 |
| DB Category | DB Name | DB's ID and Url link |
| * Gene Centered Interaction Network. |
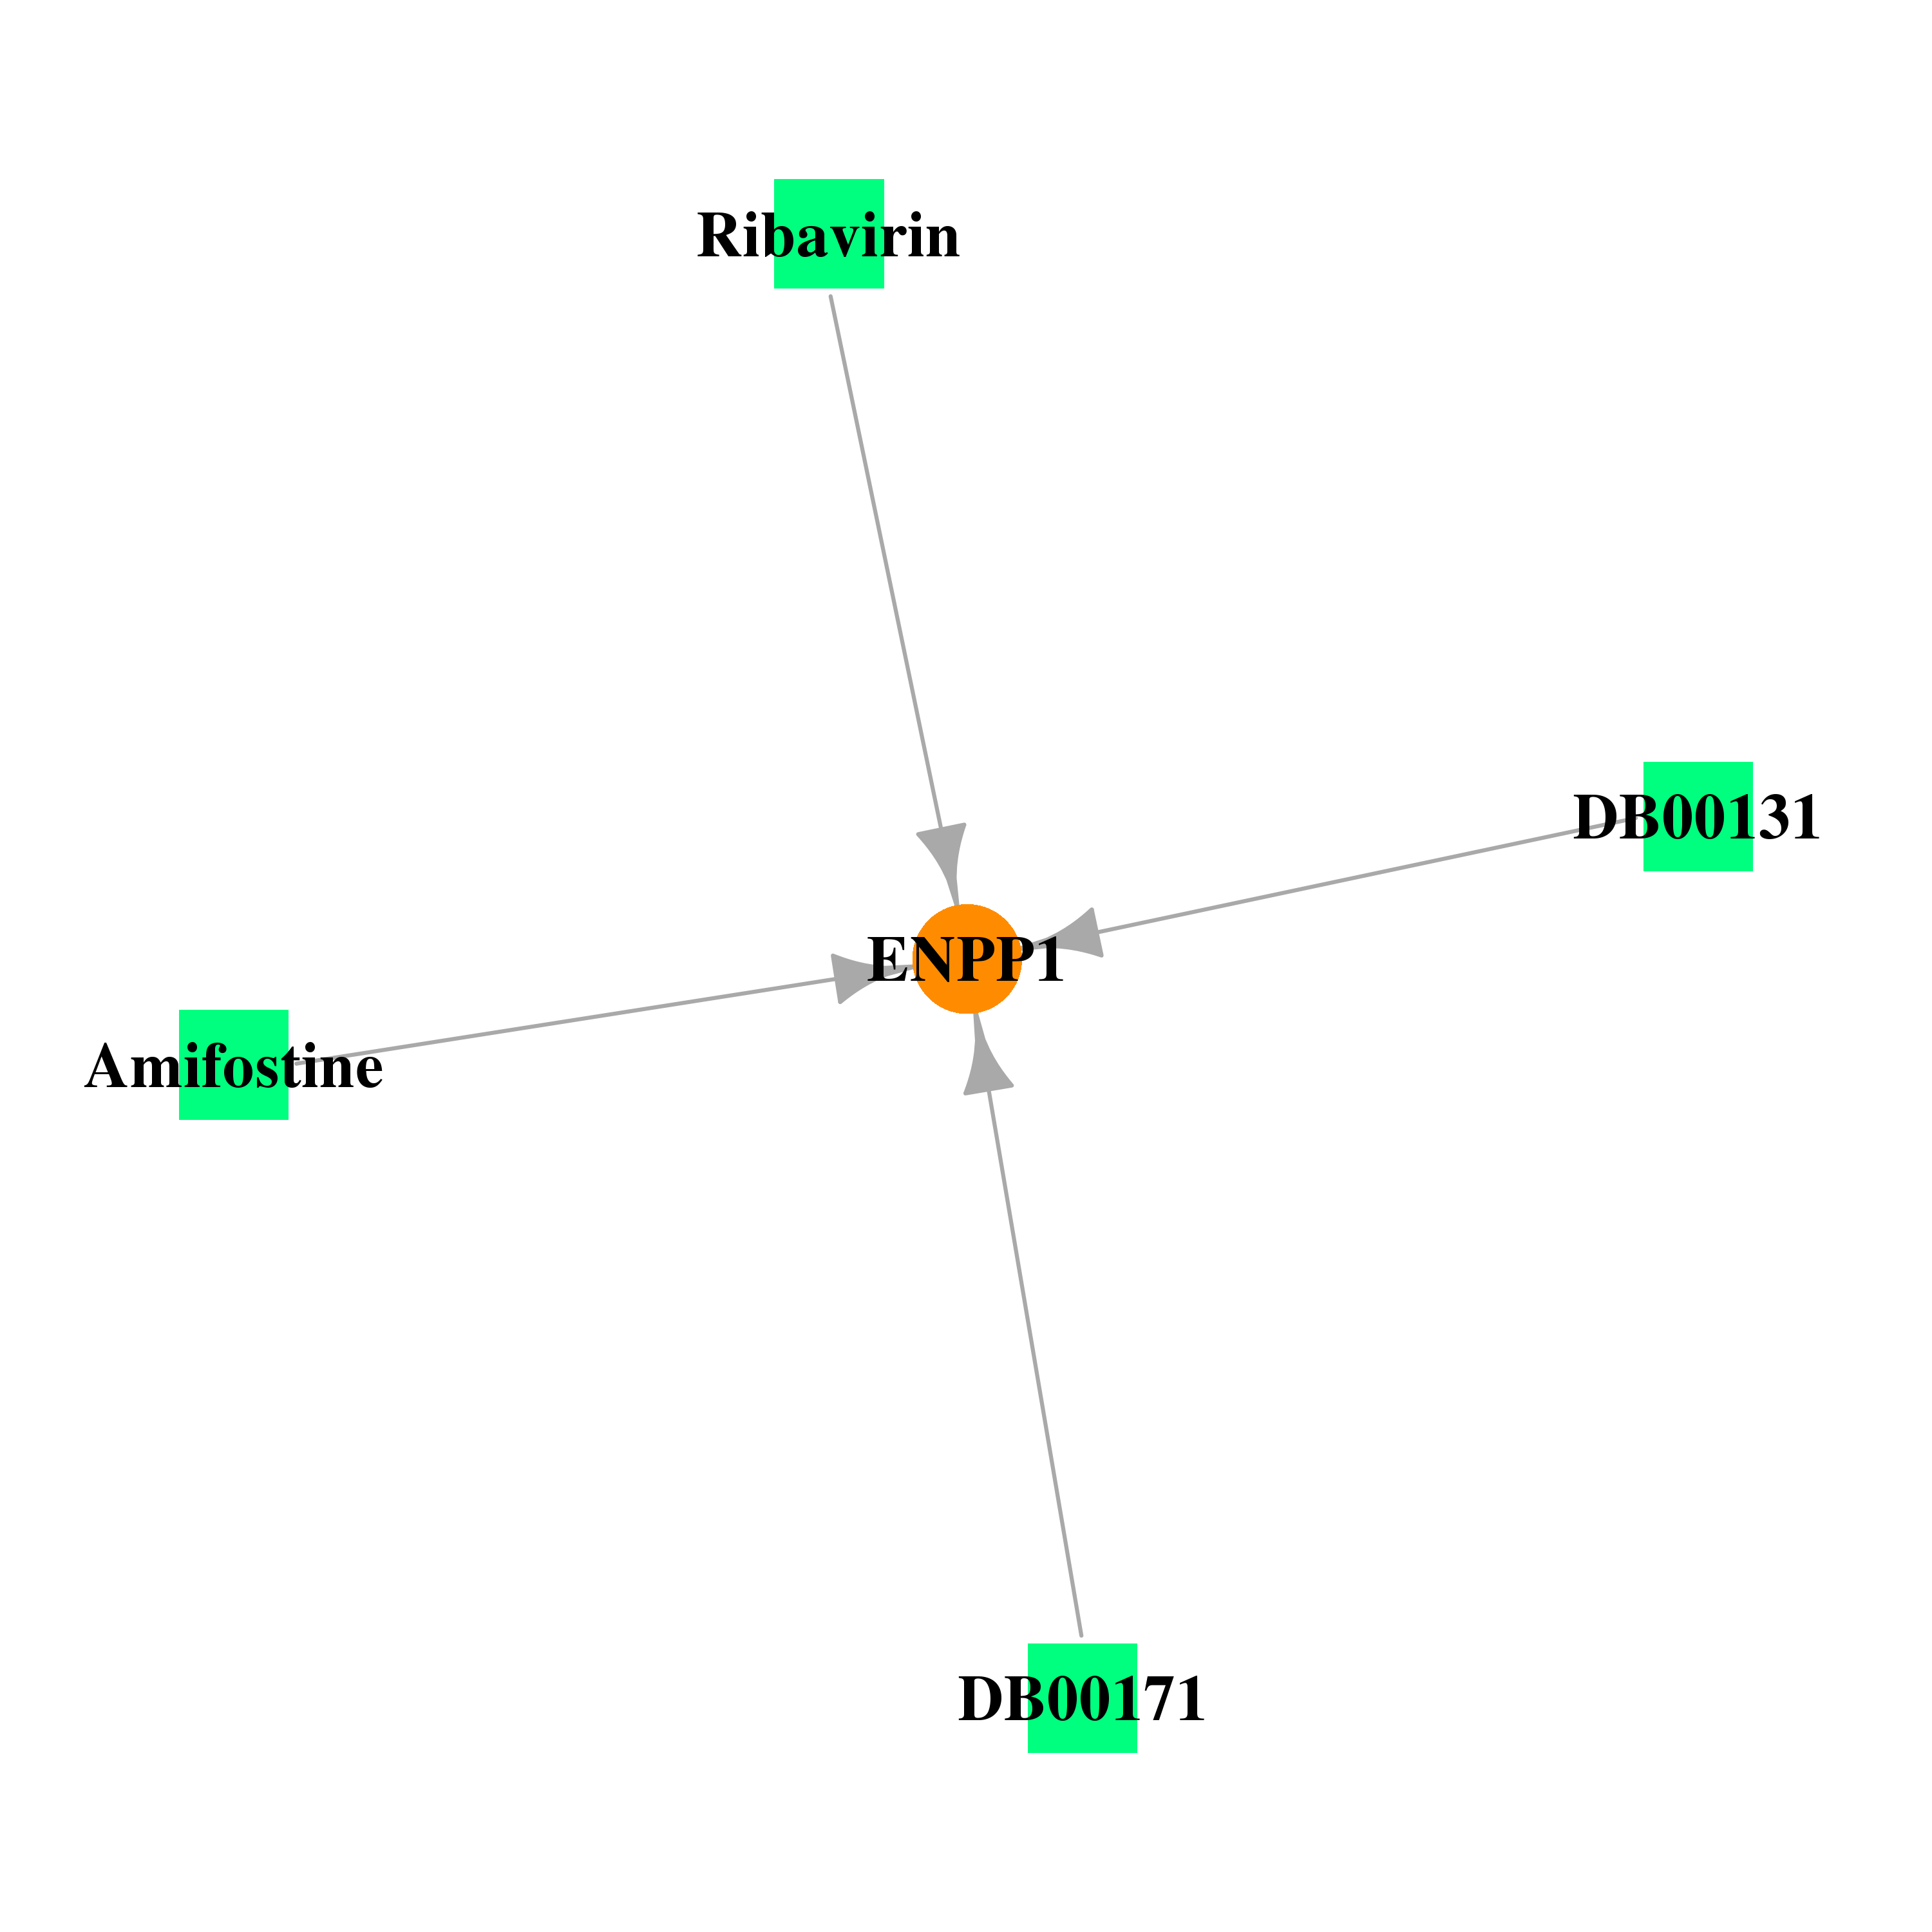 |
| * Drug Centered Interaction Network. |
| DrugBank ID | Target Name | Drug Groups | Generic Name | Drug Centered Network | Drug Structure |
| DB00811 | ectonucleotide pyrophosphatase/phosphodiesterase 1 | approved | Ribavirin | 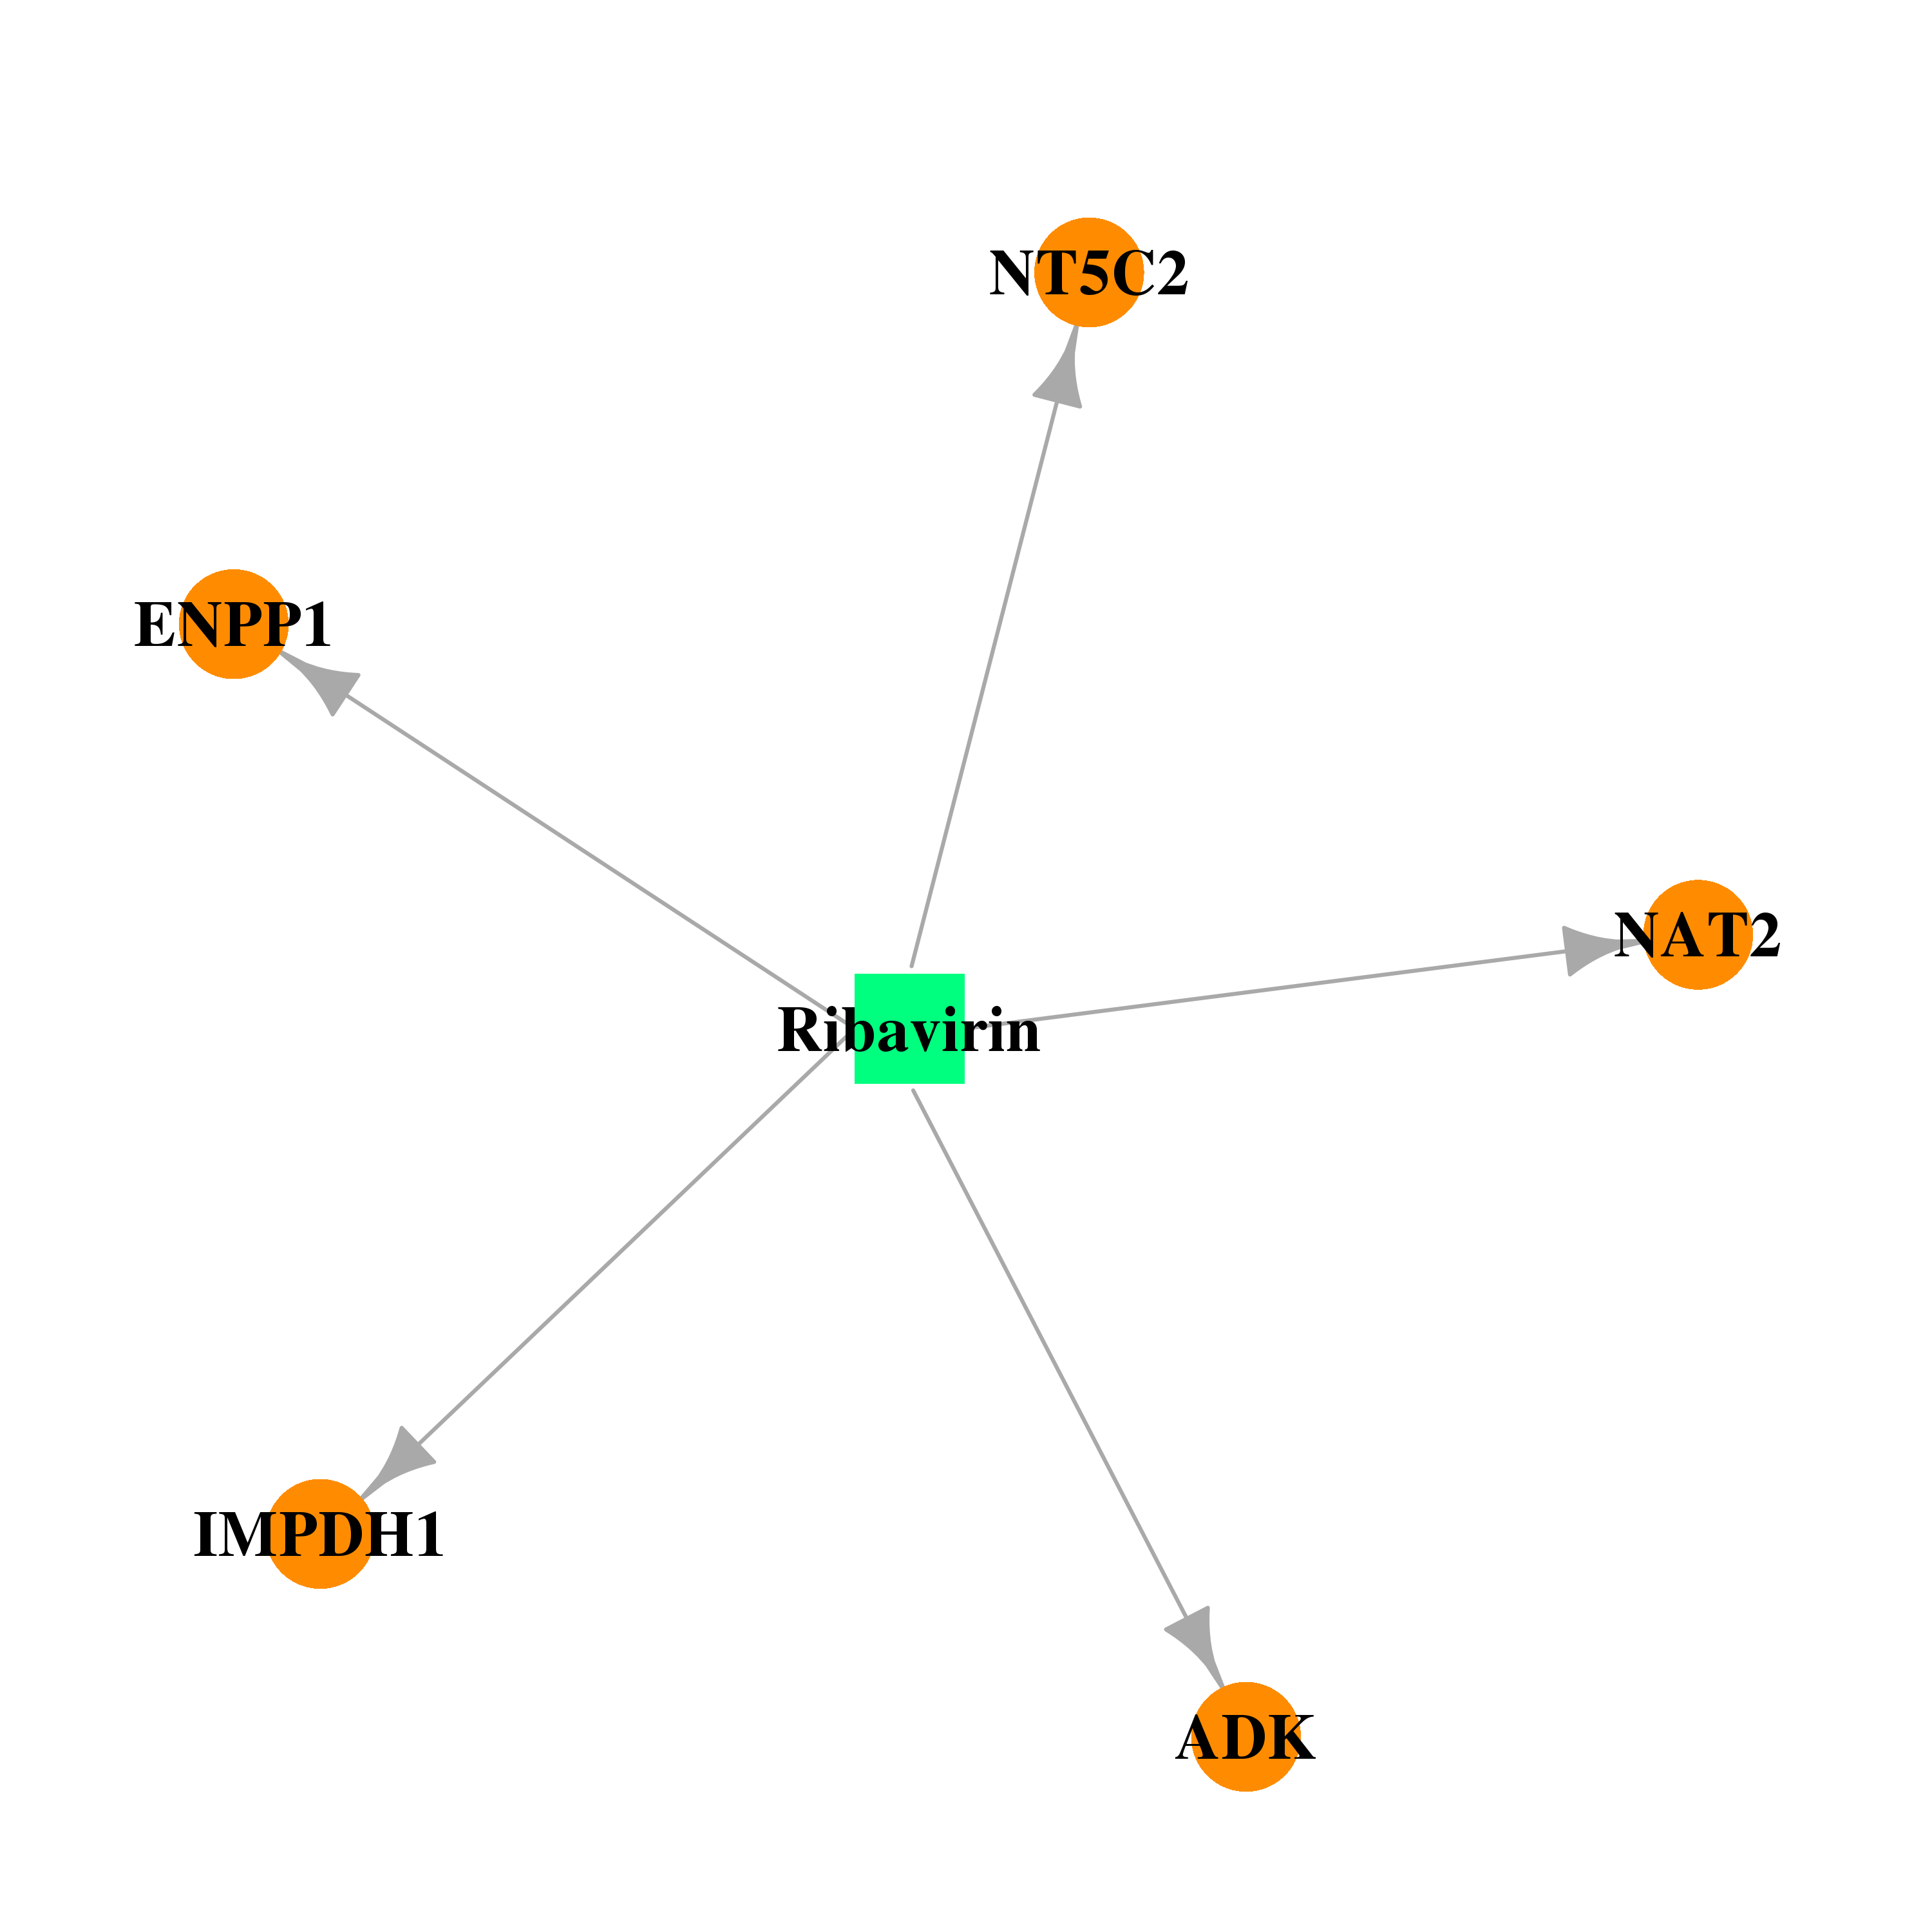 | 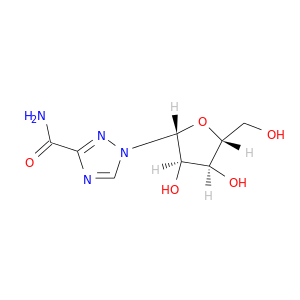 |
| DB01143 | ectonucleotide pyrophosphatase/phosphodiesterase 1 | approved; investigational | Amifostine | 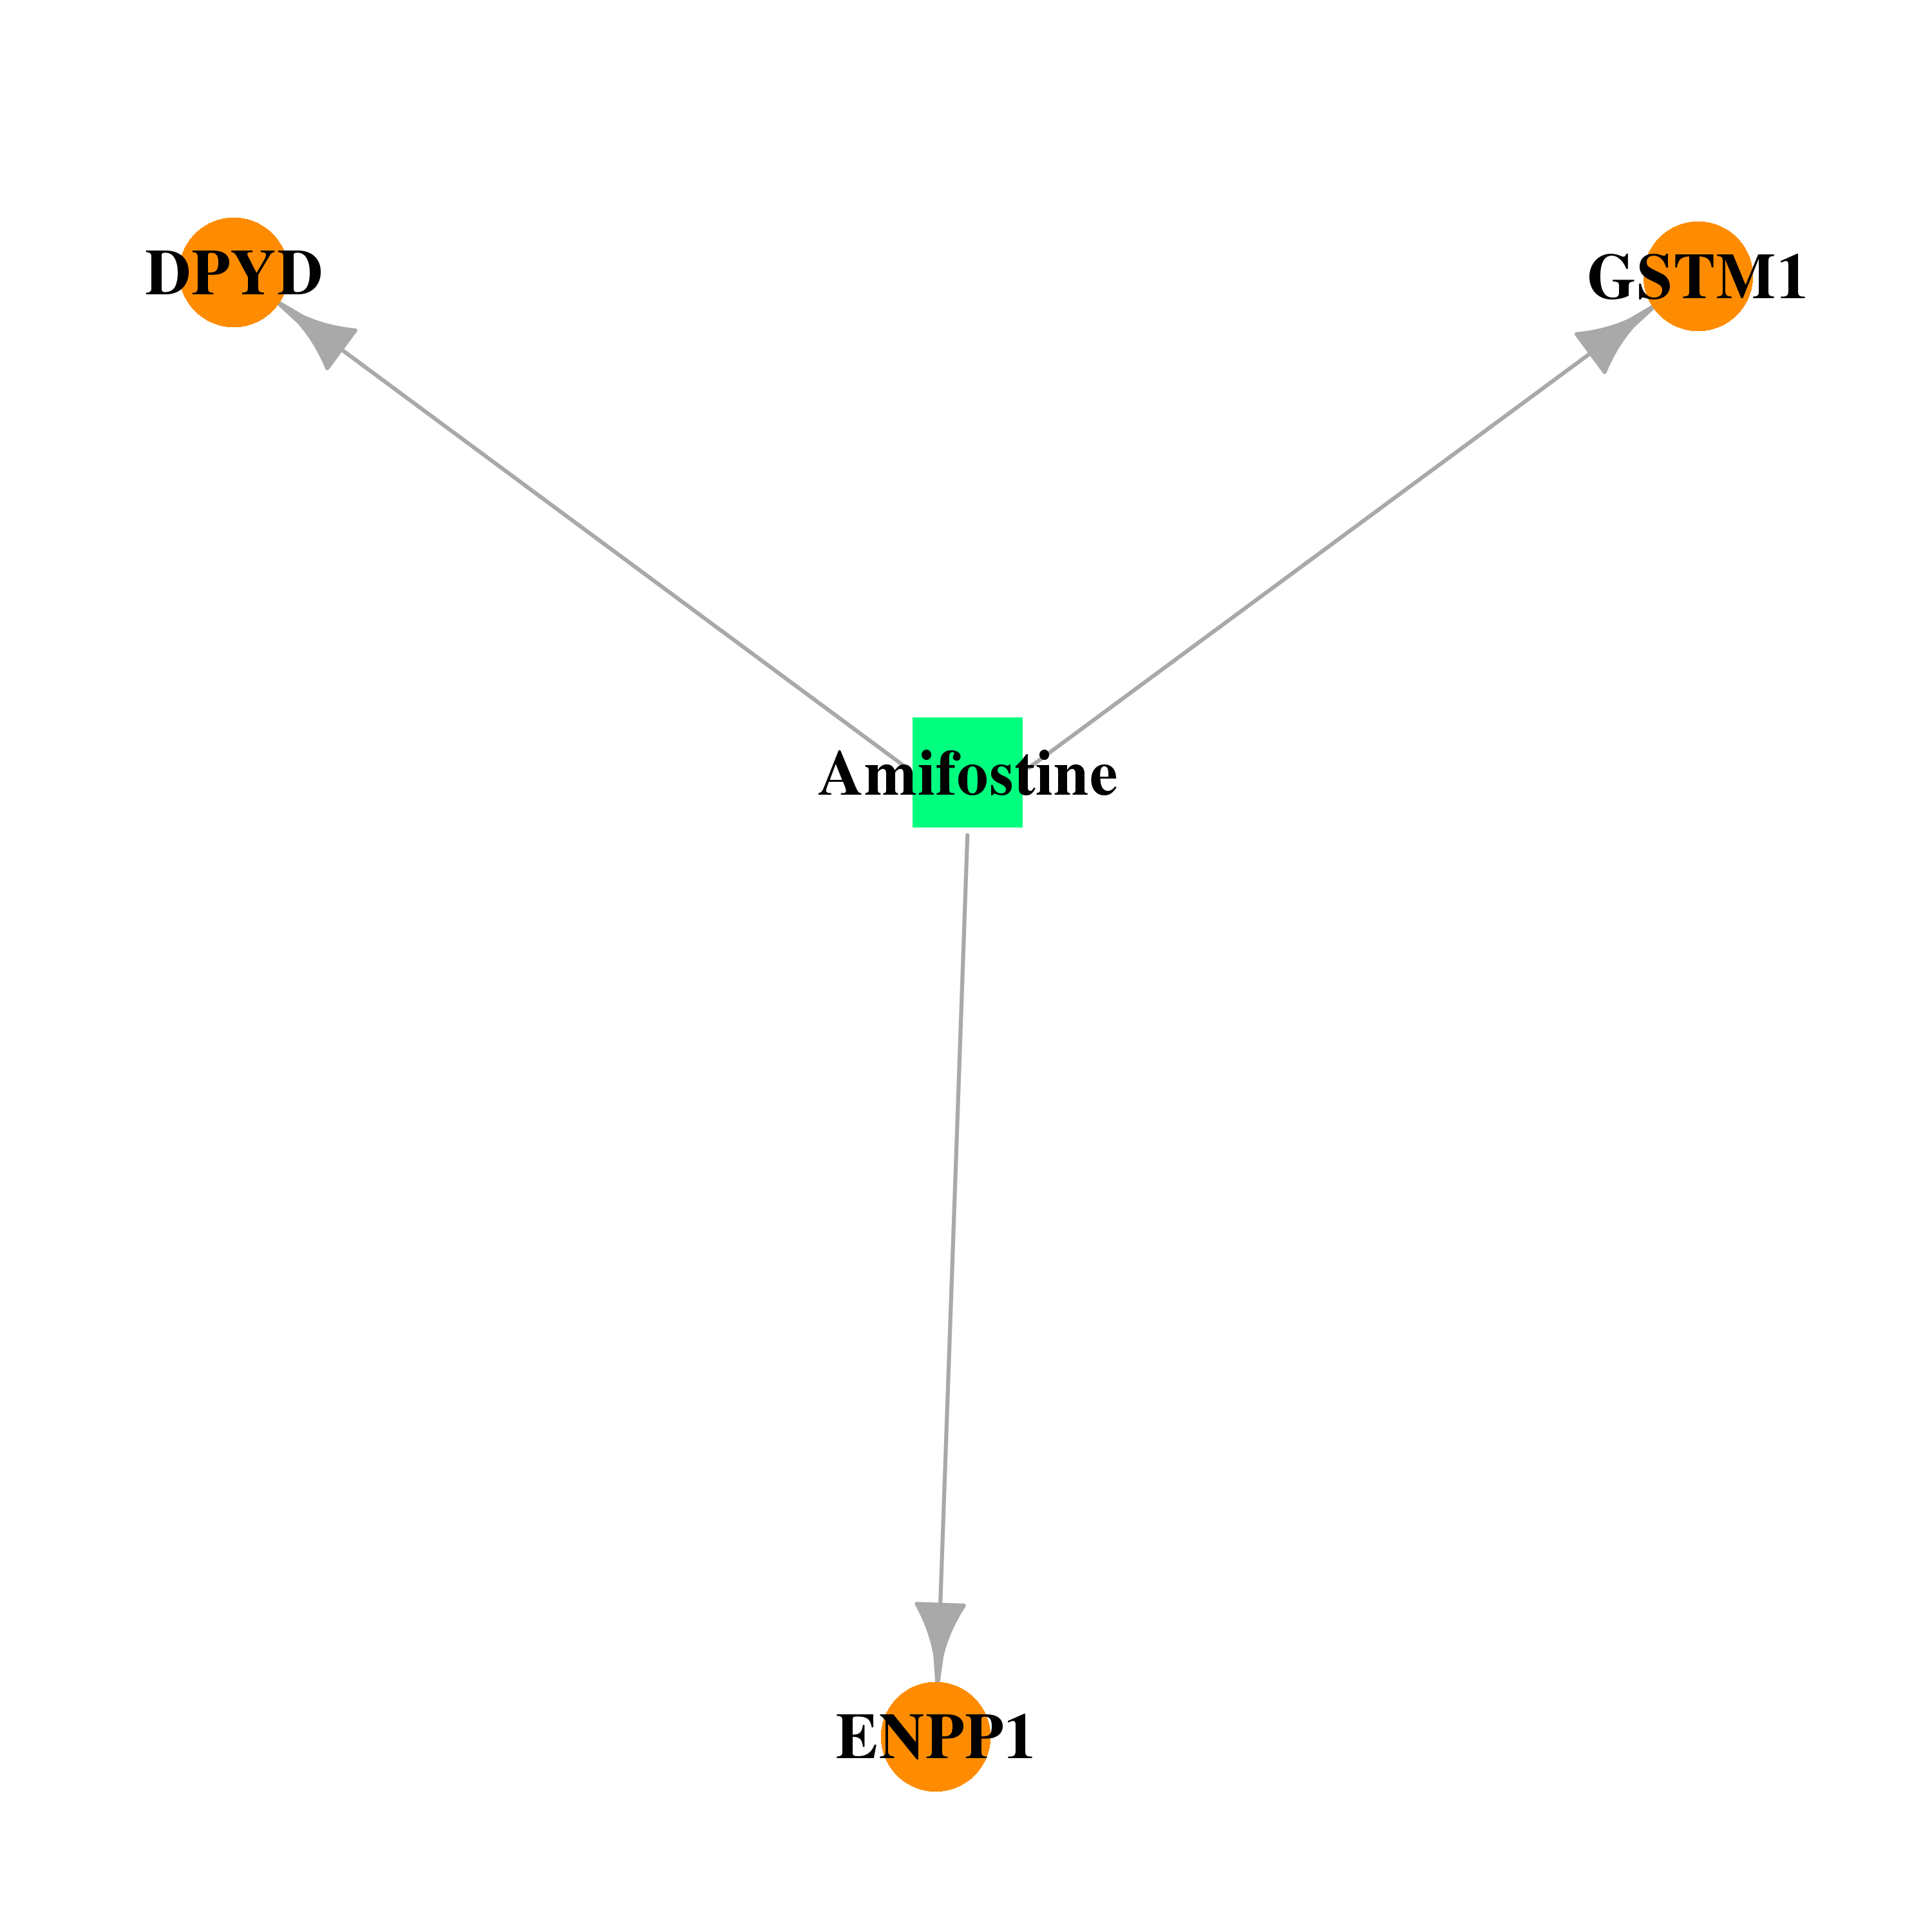 |  |
| DB00131 | ectonucleotide pyrophosphatase/phosphodiesterase 1 | approved; nutraceutical | Adenosine monophosphate | 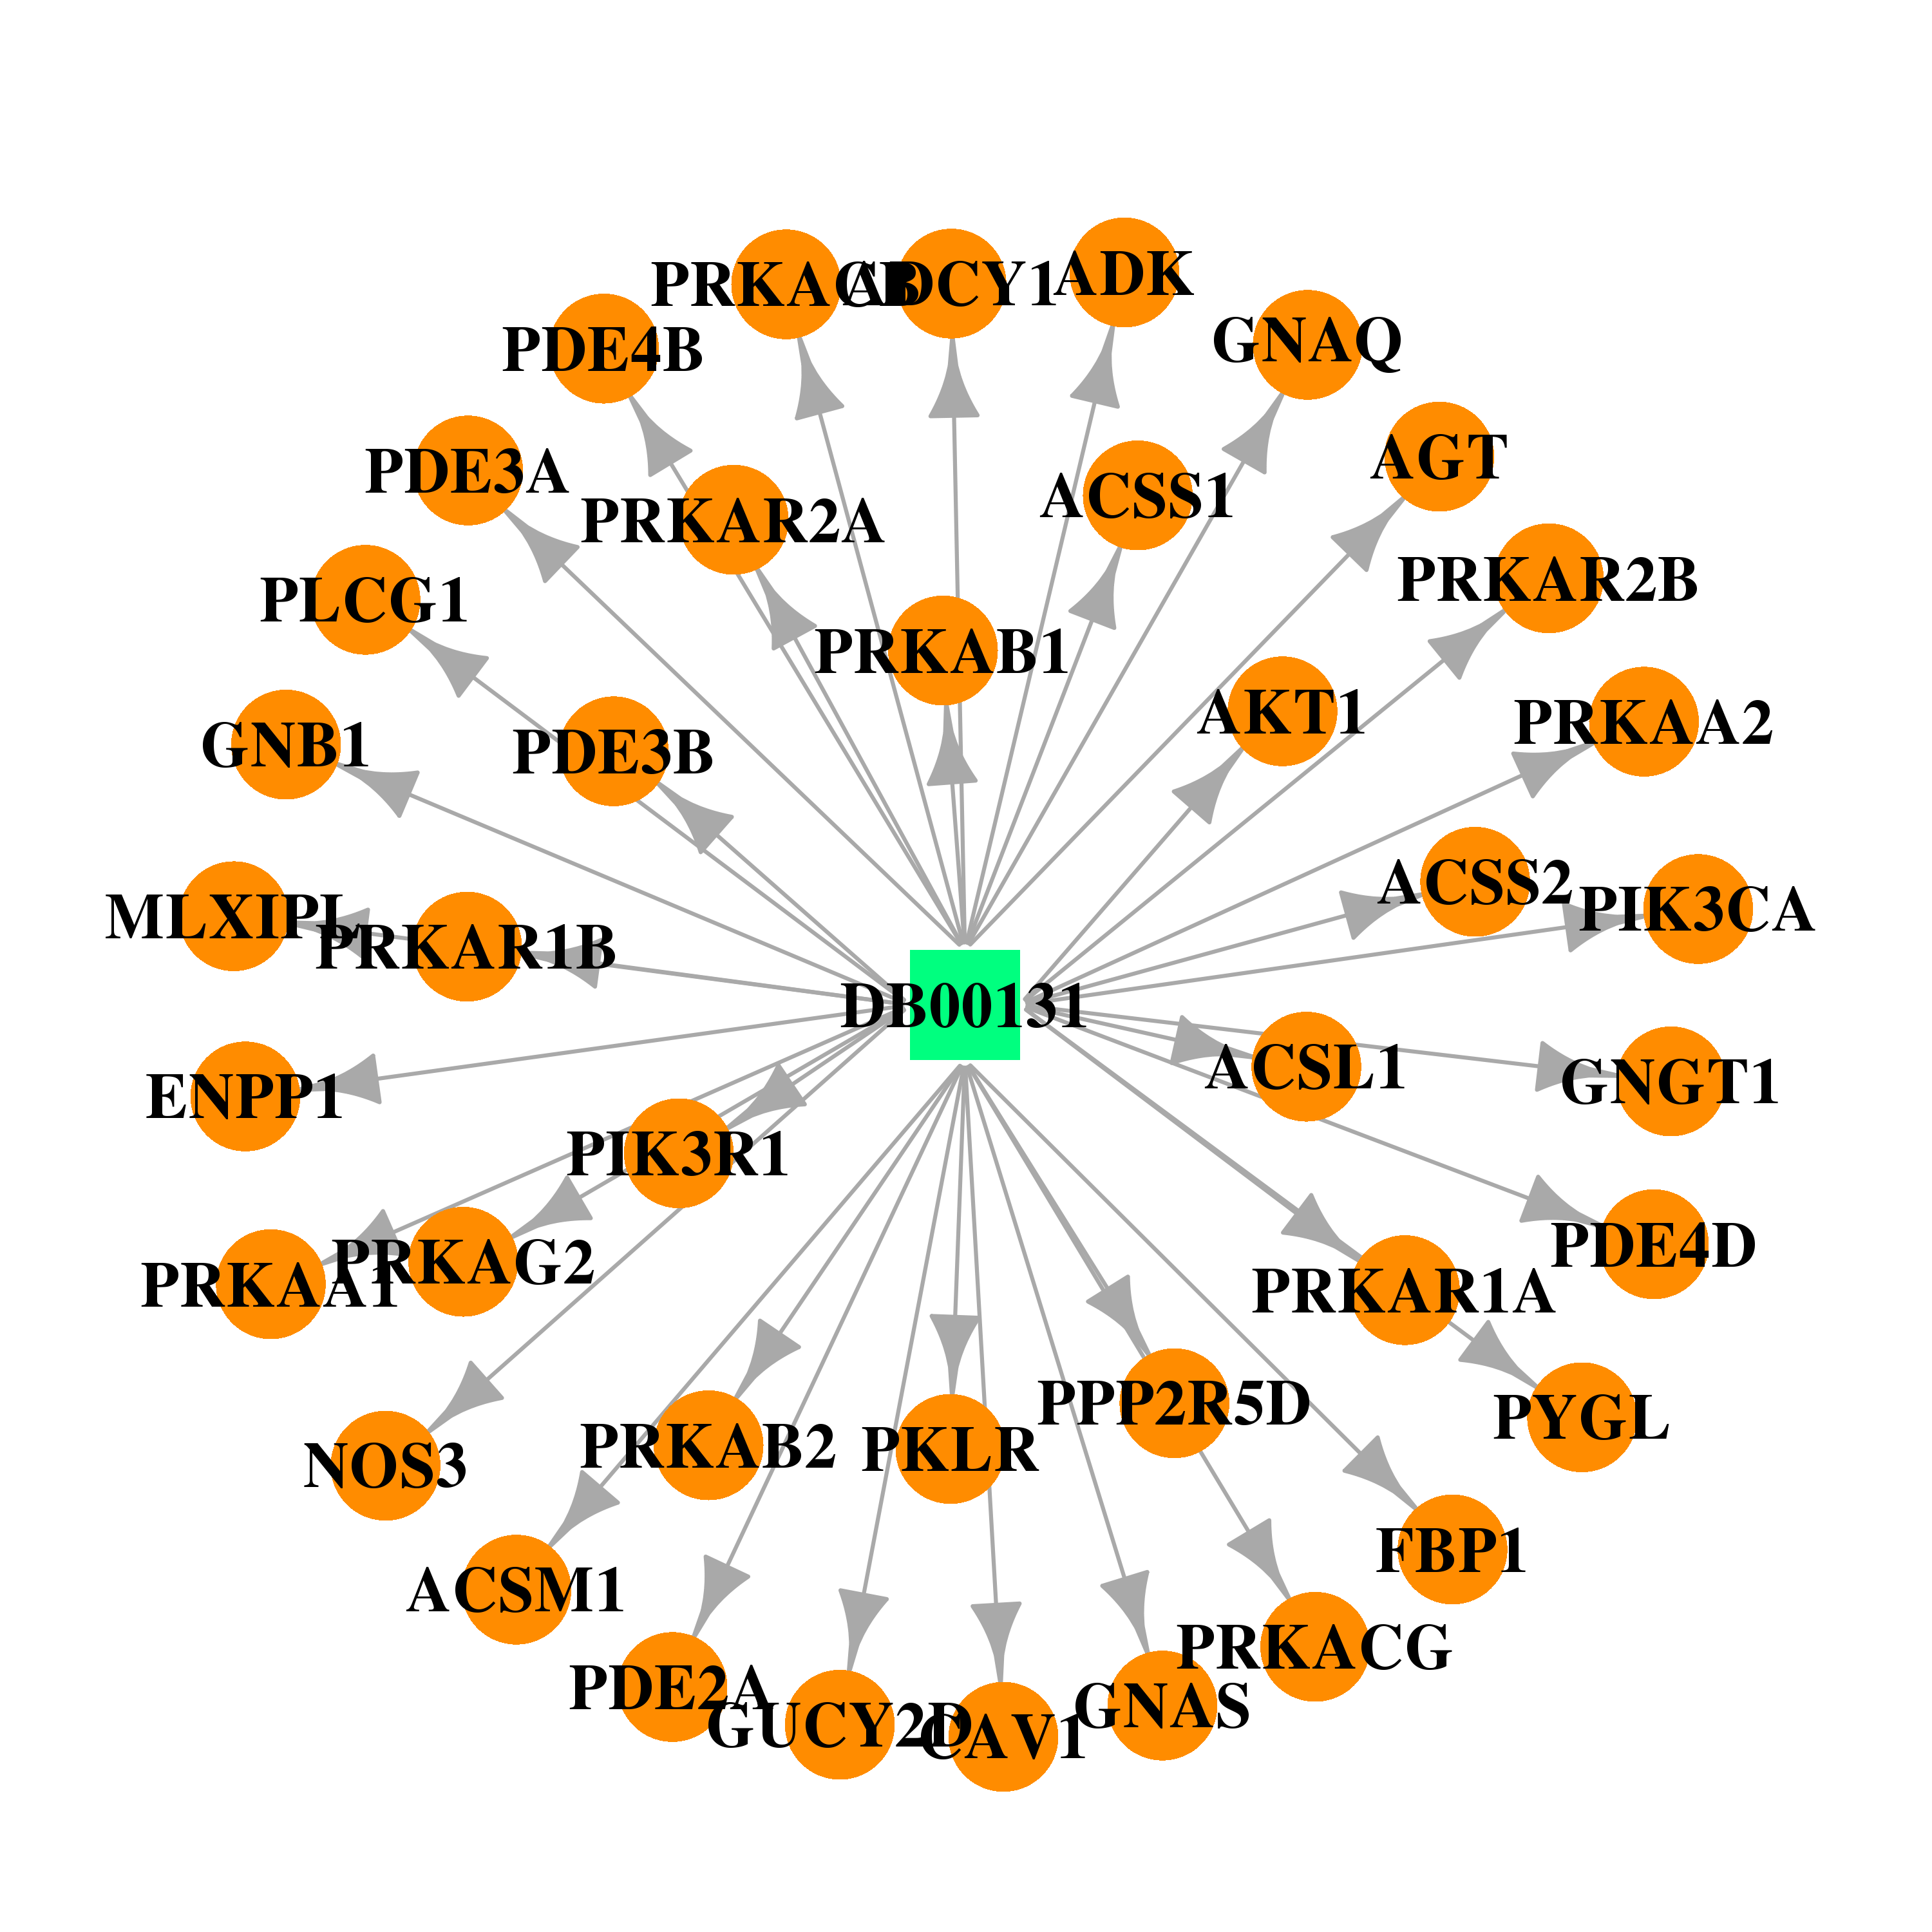 |  |
| DB00171 | ectonucleotide pyrophosphatase/phosphodiesterase 1 | approved; nutraceutical | Adenosine triphosphate |  |  |
| Top |
| Cross referenced IDs for ENPP1 |
| * We obtained these cross-references from Uniprot database. It covers 150 different DBs, 18 categories. http://www.uniprot.org/help/cross_references_section |
: Open all cross reference information
|
Copyright © 2016-Present - The Univsersity of Texas Health Science Center at Houston @ |