|
||||||||||||||||||||||||||||||||||||||||||||||||||||||||||||||||||||||||||||||||||||||||||||||||||||||||||||||||||||||||||||||||||||||||||||||||||||||||||||||||||||||||||||||||||||||||||||||||||||||||||||||||||||||||||||||||||||||||||||||||||||||||||||||||||||||||||||||||||||||||||||||||||||||||||||||||||||||||||
| |
| Phenotypic Information (metabolism pathway, cancer, disease, phenome) |
| |
| |
| Gene-Gene Network Information: Co-Expression Network, Interacting Genes & KEGG |
| |
|


| Gene Summary for ENPP3 |
| Basic gene info. | Gene symbol | ENPP3 |
| Gene name | ectonucleotide pyrophosphatase/phosphodiesterase 3 | |
| Synonyms | B10|CD203c|NPP3|PD-IBETA|PDNP3 | |
| Cytomap | UCSC genome browser: 6q22 | |
| Genomic location | chr6 :131958441-132068550 | |
| Type of gene | protein-coding | |
| RefGenes | NM_005021.3, | |
| Ensembl id | ENSG00000154269 | |
| Description | dJ1005H11.3 (phosphodiesterase I/nucleotide pyrophosphatase 3)dJ914N13.3 (phosphodiesterase I/nucleotide pyrophosphatase 3)ectonucleotide pyrophosphatase/phosphodiesterase family member 3gp130RB13-6phosphodiesterase I/nucleotide pyrophosphatase 3phos | |
| Modification date | 20141222 | |
| dbXrefs | MIM : 602182 | |
| HGNC : HGNC | ||
| Ensembl : ENSG00000154269 | ||
| HPRD : 03715 | ||
| Vega : OTTHUMG00000016292 | ||
| Protein | UniProt: go to UniProt's Cross Reference DB Table | |
| Expression | CleanEX: HS_ENPP3 | |
| BioGPS: 5169 | ||
| Gene Expression Atlas: ENSG00000154269 | ||
| The Human Protein Atlas: ENSG00000154269 | ||
| Pathway | NCI Pathway Interaction Database: ENPP3 | |
| KEGG: ENPP3 | ||
| REACTOME: ENPP3 | ||
| ConsensusPathDB | ||
| Pathway Commons: ENPP3 | ||
| Metabolism | MetaCyc: ENPP3 | |
| HUMANCyc: ENPP3 | ||
| Regulation | Ensembl's Regulation: ENSG00000154269 | |
| miRBase: chr6 :131,958,441-132,068,550 | ||
| TargetScan: NM_005021 | ||
| cisRED: ENSG00000154269 | ||
| Context | iHOP: ENPP3 | |
| cancer metabolism search in PubMed: ENPP3 | ||
| UCL Cancer Institute: ENPP3 | ||
| Assigned class in ccmGDB | C | |
| Top |
| Phenotypic Information for ENPP3(metabolism pathway, cancer, disease, phenome) |
| Cancer | CGAP: ENPP3 |
| Familial Cancer Database: ENPP3 | |
| * This gene is included in those cancer gene databases. |
|
|
|
|
|
|
| ||||||||||||||||||||||||||||||||||||||||||||||||||||||||||||||||||||||||||||||||||||||||||||||||||||||||||||||||||||||||||||||||||||||||||||||||||||||||||||||||||||||||||||||||||||||||||||||||||||||||||||||||||||||||||||||||||||||||||||||||||||||||||||||||||||||||||||||||||||||||||||||||||||||||||||||||||||
Oncogene 1 | Significant driver gene in | |||||||||||||||||||||||||||||||||||||||||||||||||||||||||||||||||||||||||||||||||||||||||||||||||||||||||||||||||||||||||||||||||||||||||||||||||||||||||||||||||||||||||||||||||||||||||||||||||||||||||||||||||||||||||||||||||||||||||||||||||||||||||||||||||||||||||||||||||||||||||||||||||||||||||||||||||||||||||
| cf) number; DB name 1 Oncogene; http://nar.oxfordjournals.org/content/35/suppl_1/D721.long, 2 Tumor Suppressor gene; https://bioinfo.uth.edu/TSGene/, 3 Cancer Gene Census; http://www.nature.com/nrc/journal/v4/n3/abs/nrc1299.html, 4 CancerGenes; http://nar.oxfordjournals.org/content/35/suppl_1/D721.long, 5 Network of Cancer Gene; http://ncg.kcl.ac.uk/index.php, 1Therapeutic Vulnerabilities in Cancer; http://cbio.mskcc.org/cancergenomics/statius/ |
| KEGG_PURINE_METABOLISM KEGG_STARCH_AND_SUCROSE_METABOLISM KEGG_RIBOFLAVIN_METABOLISM KEGG_NICOTINATE_AND_NICOTINAMIDE_METABOLISM | |
| OMIM | |
| Orphanet | |
| Disease | KEGG Disease: ENPP3 |
| MedGen: ENPP3 (Human Medical Genetics with Condition) | |
| ClinVar: ENPP3 | |
| Phenotype | MGI: ENPP3 (International Mouse Phenotyping Consortium) |
| PhenomicDB: ENPP3 | |
| Mutations for ENPP3 |
| * Under tables are showing count per each tissue to give us broad intuition about tissue specific mutation patterns.You can go to the detailed page for each mutation database's web site. |
| - Statistics for Tissue and Mutation type | Top |
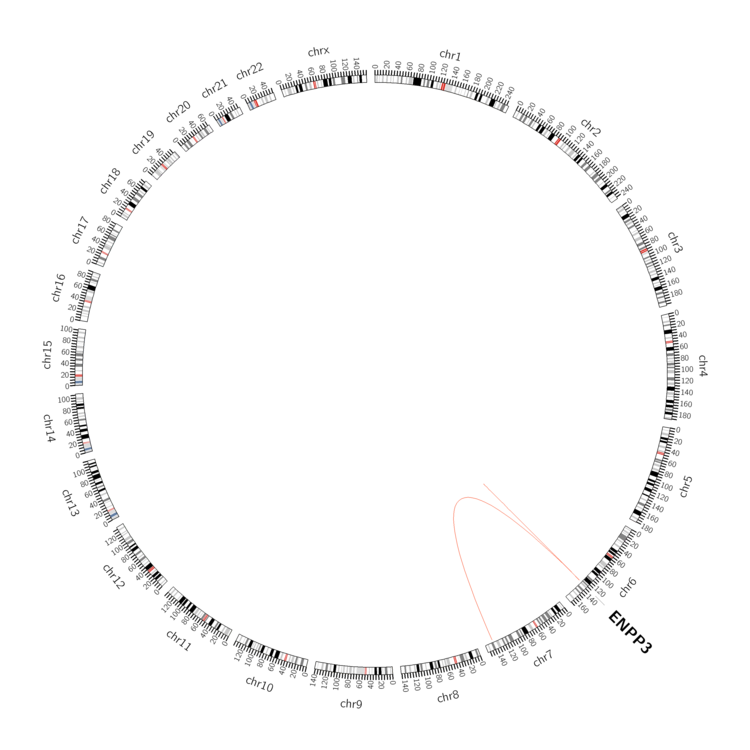 |
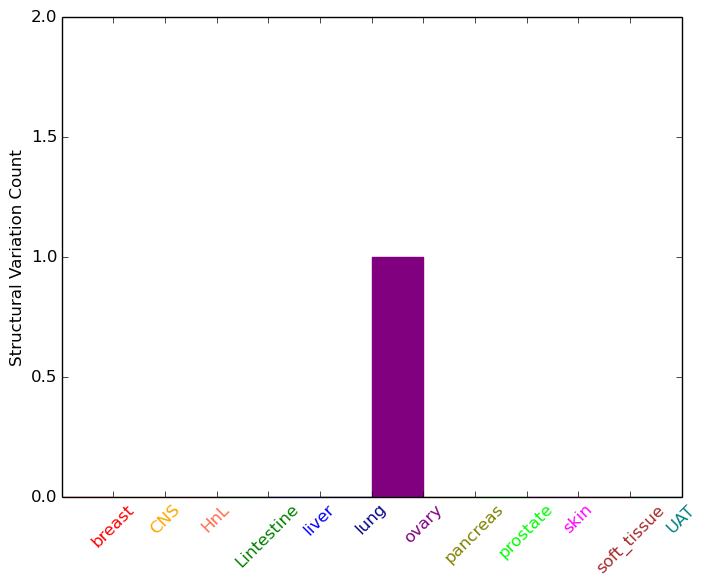
| - For Inter-chromosomal Variations |
| * Inter-chromosomal variantions includes 'interchromosomal amplicon to amplicon', 'interchromosomal amplicon to non-amplified dna', 'interchromosomal insertion', 'Interchromosomal unknown type'. |
 |
| - For Intra-chromosomal Variations |
| * Intra-chromosomal variantions includes 'intrachromosomal amplicon to amplicon', 'intrachromosomal amplicon to non-amplified dna', 'intrachromosomal deletion', 'intrachromosomal fold-back inversion', 'intrachromosomal inversion', 'intrachromosomal tandem duplication', 'Intrachromosomal unknown type', 'intrachromosomal with inverted orientation', 'intrachromosomal with non-inverted orientation'. |
 |
| Sample | Symbol_a | Chr_a | Start_a | End_a | Symbol_b | Chr_b | Start_b | End_b |
| ovary | ENPP3 | chr6 | 132014038 | 132014238 | ENPP3 | chr6 | 132013900 | 132014100 |
| ovary | ENPP3 | chr6 | 132036863 | 132037063 | chr7 | 143442572 | 143442772 |
| cf) Tissue number; Tissue name (1;Breast, 2;Central_nervous_system, 3;Haematopoietic_and_lymphoid_tissue, 4;Large_intestine, 5;Liver, 6;Lung, 7;Ovary, 8;Pancreas, 9;Prostate, 10;Skin, 11;Soft_tissue, 12;Upper_aerodigestive_tract) |
| * From mRNA Sanger sequences, Chitars2.0 arranged chimeric transcripts. This table shows ENPP3 related fusion information. |
| ID | Head Gene | Tail Gene | Accession | Gene_a | qStart_a | qEnd_a | Chromosome_a | tStart_a | tEnd_a | Gene_a | qStart_a | qEnd_a | Chromosome_a | tStart_a | tEnd_a |
| BF361277 | YWHAQ | 7 | 404 | 2 | 9725010 | 9725406 | ENPP3 | 386 | 488 | 6 | 132062737 | 132062839 | |
| BE936958 | YWHAQ | 1 | 364 | 2 | 9725010 | 9725373 | ENPP3 | 346 | 448 | 6 | 132062737 | 132062839 | |
| Top |
| Mutation type/ Tissue ID | brca | cns | cerv | endome | haematopo | kidn | Lintest | liver | lung | ns | ovary | pancre | prost | skin | stoma | thyro | urina | |||
| Total # sample | 1 | 1 | ||||||||||||||||||
| GAIN (# sample) | 1 | |||||||||||||||||||
| LOSS (# sample) | 1 |
| cf) Tissue ID; Tissue type (1; Breast, 2; Central_nervous_system, 3; Cervix, 4; Endometrium, 5; Haematopoietic_and_lymphoid_tissue, 6; Kidney, 7; Large_intestine, 8; Liver, 9; Lung, 10; NS, 11; Ovary, 12; Pancreas, 13; Prostate, 14; Skin, 15; Stomach, 16; Thyroid, 17; Urinary_tract) |
| Top |
|
 |
| Top |
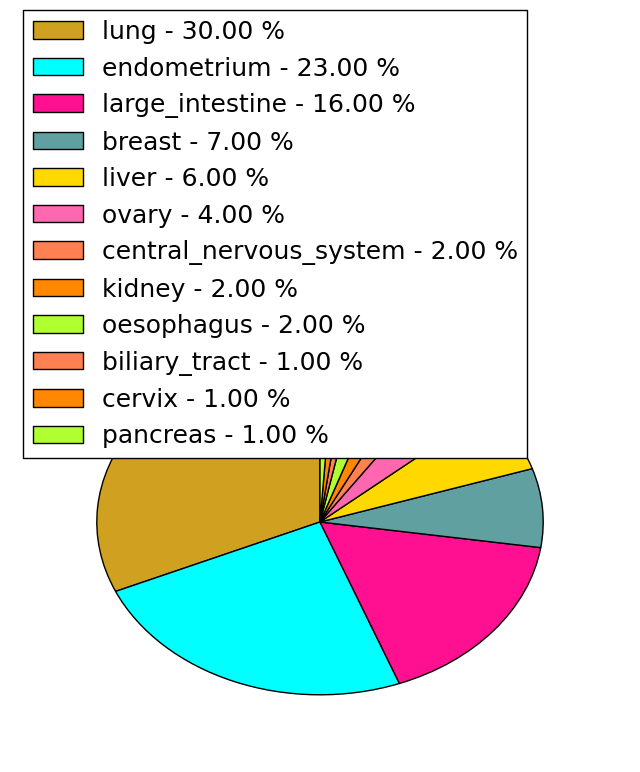
| Stat. for Non-Synonymous SNVs (# total SNVs=81) | (# total SNVs=22) |
 | 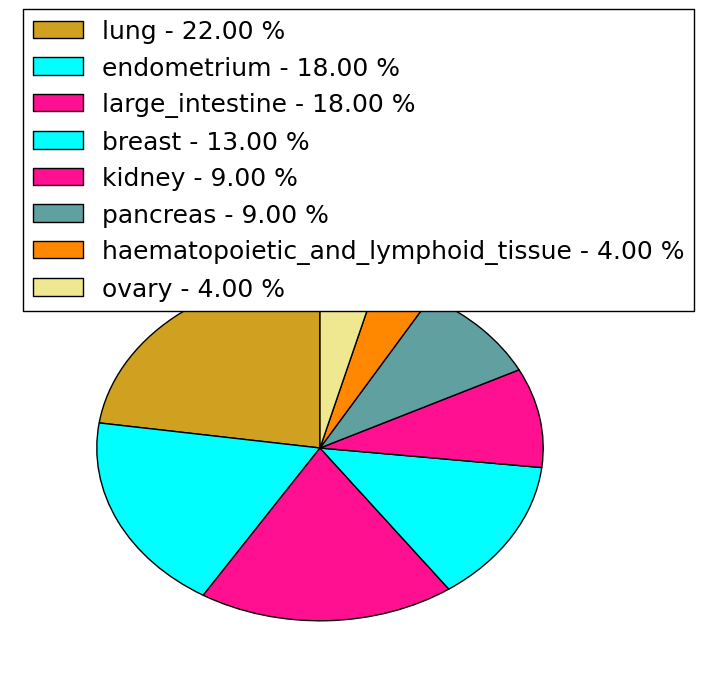 |
(# total SNVs=4) | (# total SNVs=0) |
 |
| Top |
| * When you move the cursor on each content, you can see more deailed mutation information on the Tooltip. Those are primary_site,primary_histology,mutation(aa),pubmedID. |
| GRCh37 position | Mutation(aa) | Unique sampleID count |
| chr6:131973708-131973708 | p.R102C | 4 |
| chr6:132014722-132014722 | p.D457G | 3 |
| chr6:131995408-131995408 | p.W250* | 3 |
| chr6:132014640-132014640 | p.R430* | 3 |
| chr6:131973687-131973687 | p.I95V | 2 |
| chr6:132014691-132014691 | p.R447* | 2 |
| chr6:132047338-132047338 | p.L651L | 2 |
| chr6:132061495-132061495 | p.R811L | 2 |
| chr6:132059248-132059248 | p.P749T | 2 |
| chr6:132006591-132006591 | p.R405fs*36 | 2 |
| Top |
|
 |
| Point Mutation/ Tissue ID | 1 | 2 | 3 | 4 | 5 | 6 | 7 | 8 | 9 | 10 | 11 | 12 | 13 | 14 | 15 | 16 | 17 | 18 | 19 | 20 |
| # sample | 3 | 3 | 1 | 9 | 7 | 3 | 14 | 7 | 2 | 2 | 15 | 5 | 14 | |||||||
| # mutation | 3 | 3 | 1 | 9 | 7 | 3 | 16 | 7 | 2 | 2 | 13 | 5 | 22 | |||||||
| nonsynonymous SNV | 1 | 2 | 1 | 6 | 5 | 1 | 14 | 4 | 1 | 2 | 11 | 4 | 18 | |||||||
| synonymous SNV | 2 | 1 | 3 | 2 | 2 | 2 | 3 | 1 | 2 | 1 | 4 |
| cf) Tissue ID; Tissue type (1; BLCA[Bladder Urothelial Carcinoma], 2; BRCA[Breast invasive carcinoma], 3; CESC[Cervical squamous cell carcinoma and endocervical adenocarcinoma], 4; COAD[Colon adenocarcinoma], 5; GBM[Glioblastoma multiforme], 6; Glioma Low Grade, 7; HNSC[Head and Neck squamous cell carcinoma], 8; KICH[Kidney Chromophobe], 9; KIRC[Kidney renal clear cell carcinoma], 10; KIRP[Kidney renal papillary cell carcinoma], 11; LAML[Acute Myeloid Leukemia], 12; LUAD[Lung adenocarcinoma], 13; LUSC[Lung squamous cell carcinoma], 14; OV[Ovarian serous cystadenocarcinoma ], 15; PAAD[Pancreatic adenocarcinoma], 16; PRAD[Prostate adenocarcinoma], 17; SKCM[Skin Cutaneous Melanoma], 18:STAD[Stomach adenocarcinoma], 19:THCA[Thyroid carcinoma], 20:UCEC[Uterine Corpus Endometrial Carcinoma]) |
| Top |
| * We represented just top 10 SNVs. When you move the cursor on each content, you can see more deailed mutation information on the Tooltip. Those are primary_site, primary_histology, mutation(aa), pubmedID. |
| Genomic Position | Mutation(aa) | Unique sampleID count |
| chr6:131973708 | p.R102C | 3 |
| chr6:132047338 | p.L651L | 2 |
| chr6:131995407 | p.W250R | 2 |
| chr6:131996253 | p.M197V | 1 |
| chr6:132043403 | p.P294S | 1 |
| chr6:131962629 | p.F436S | 1 |
| chr6:132006568 | p.K618N | 1 |
| chr6:132058512 | p.R838G | 1 |
| chr6:131973729 | p.S53R | 1 |
| chr6:131995305 | p.F206F | 1 |
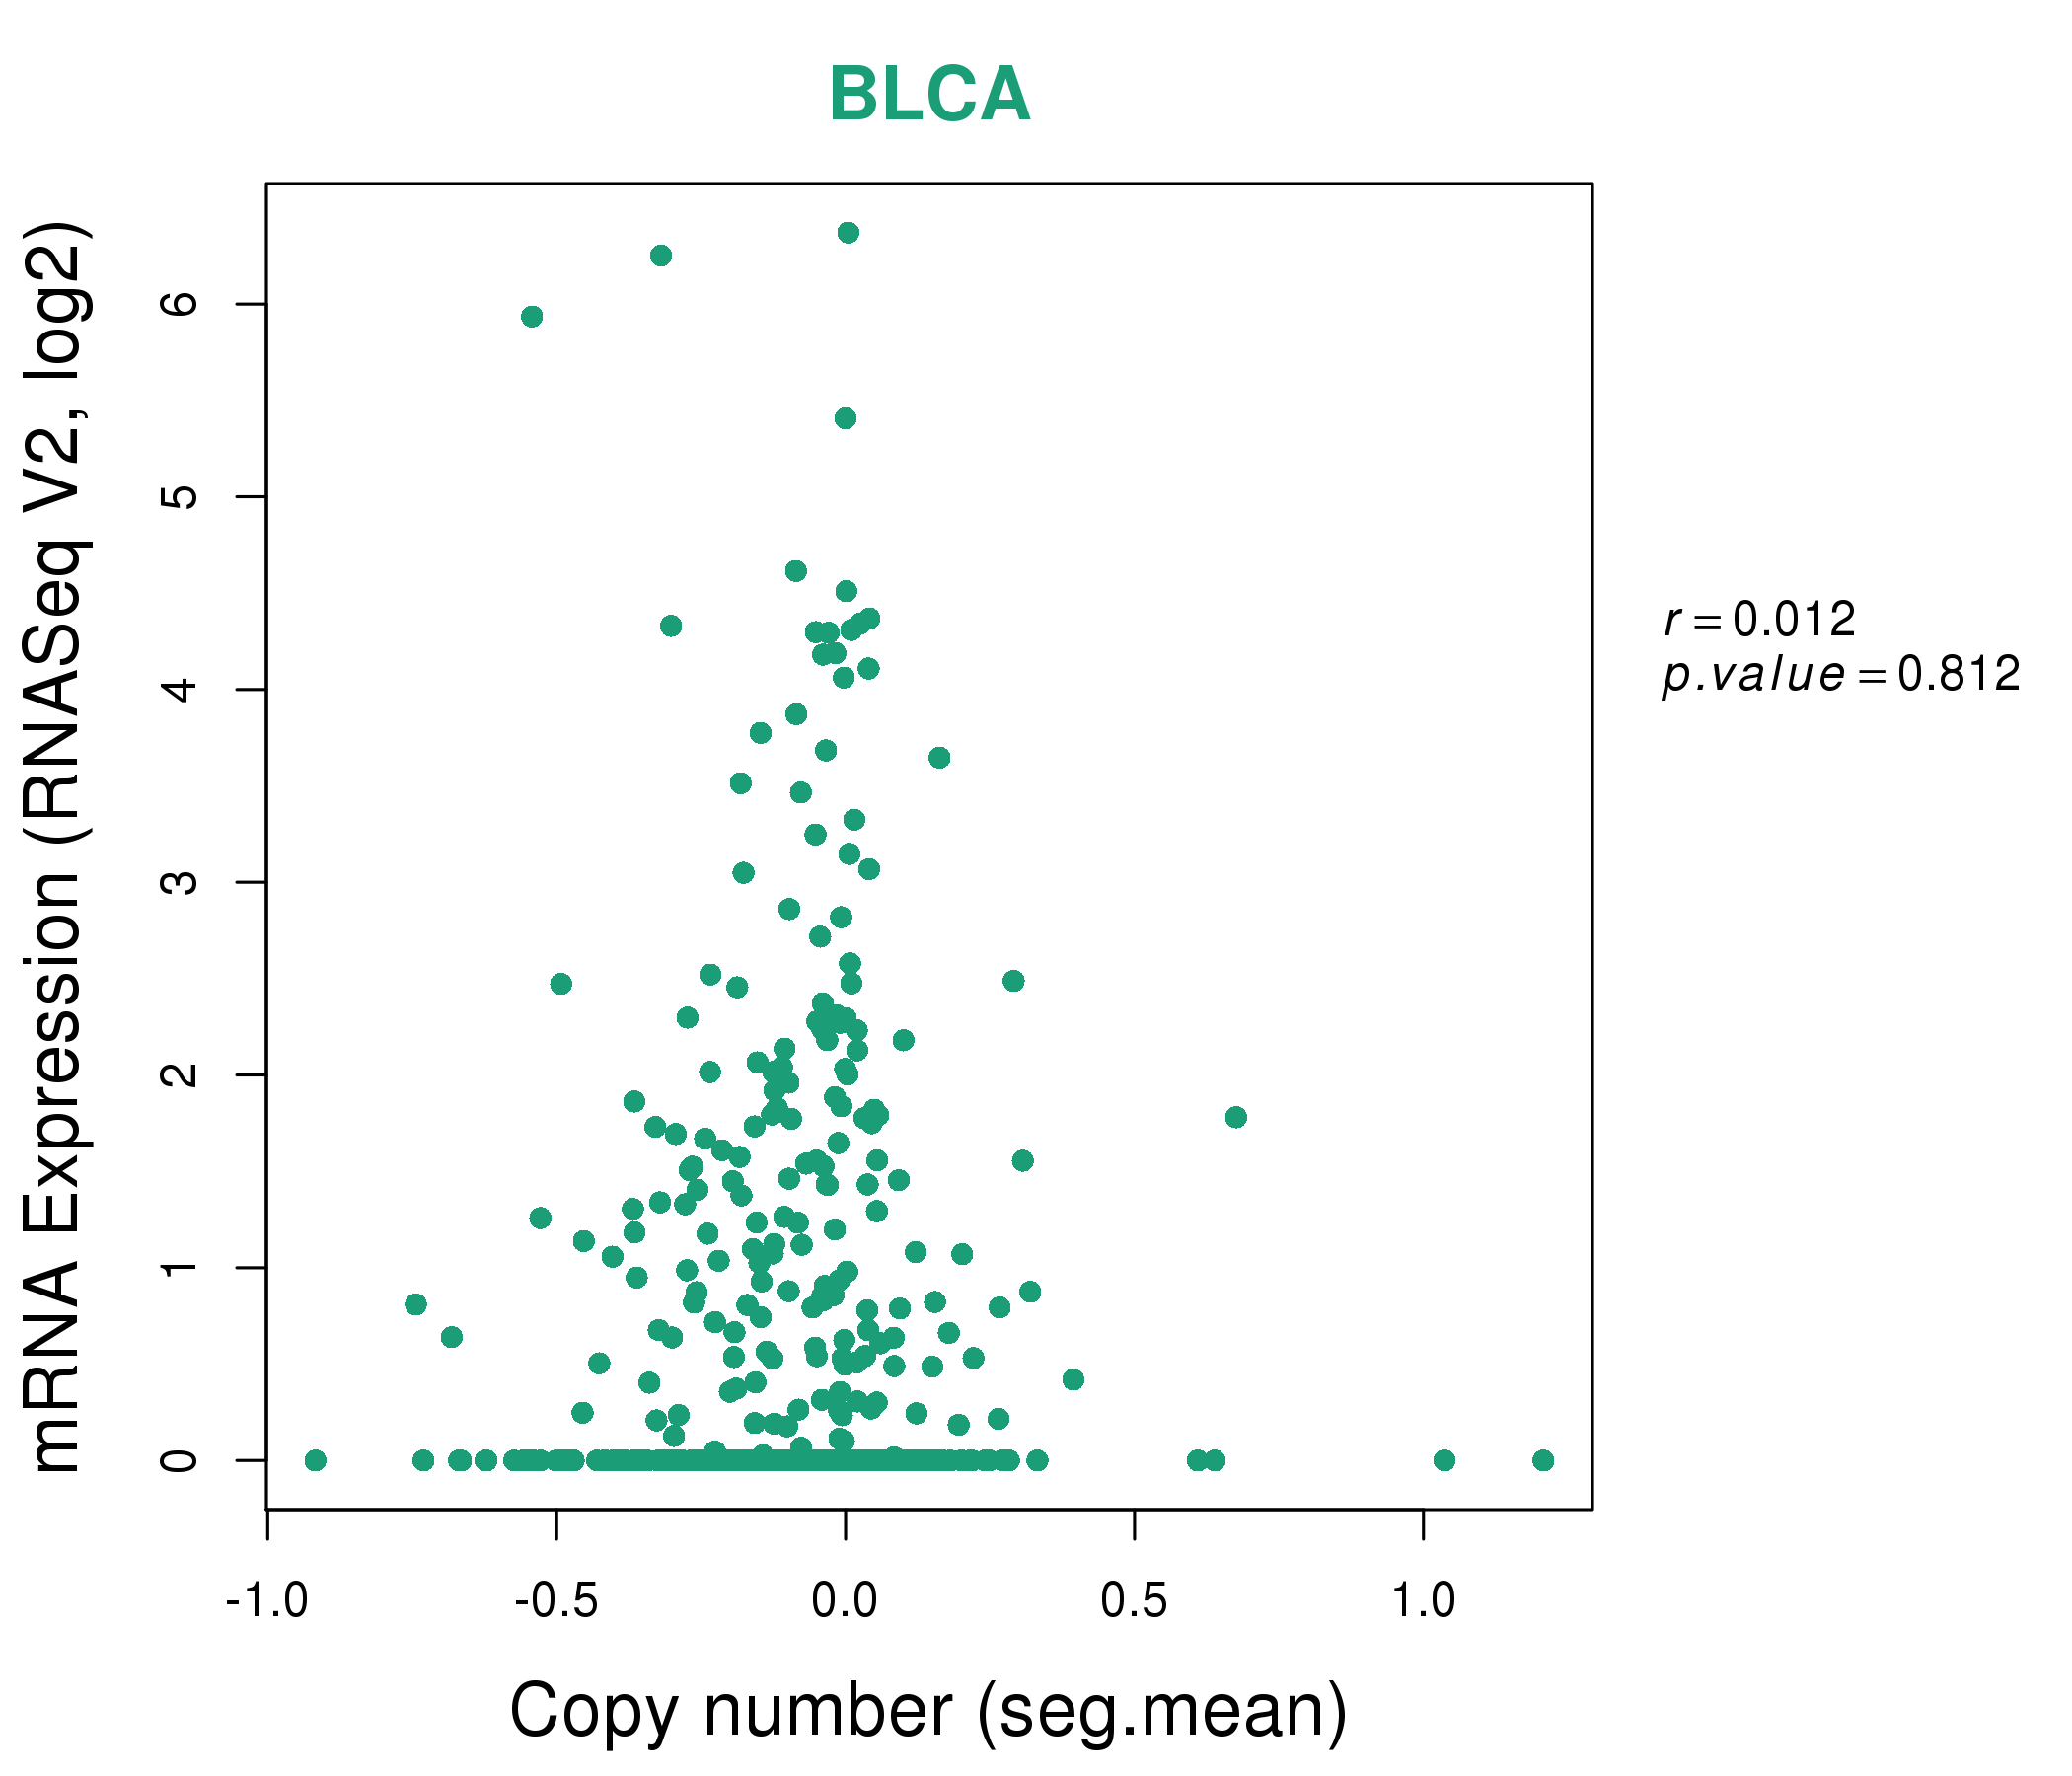
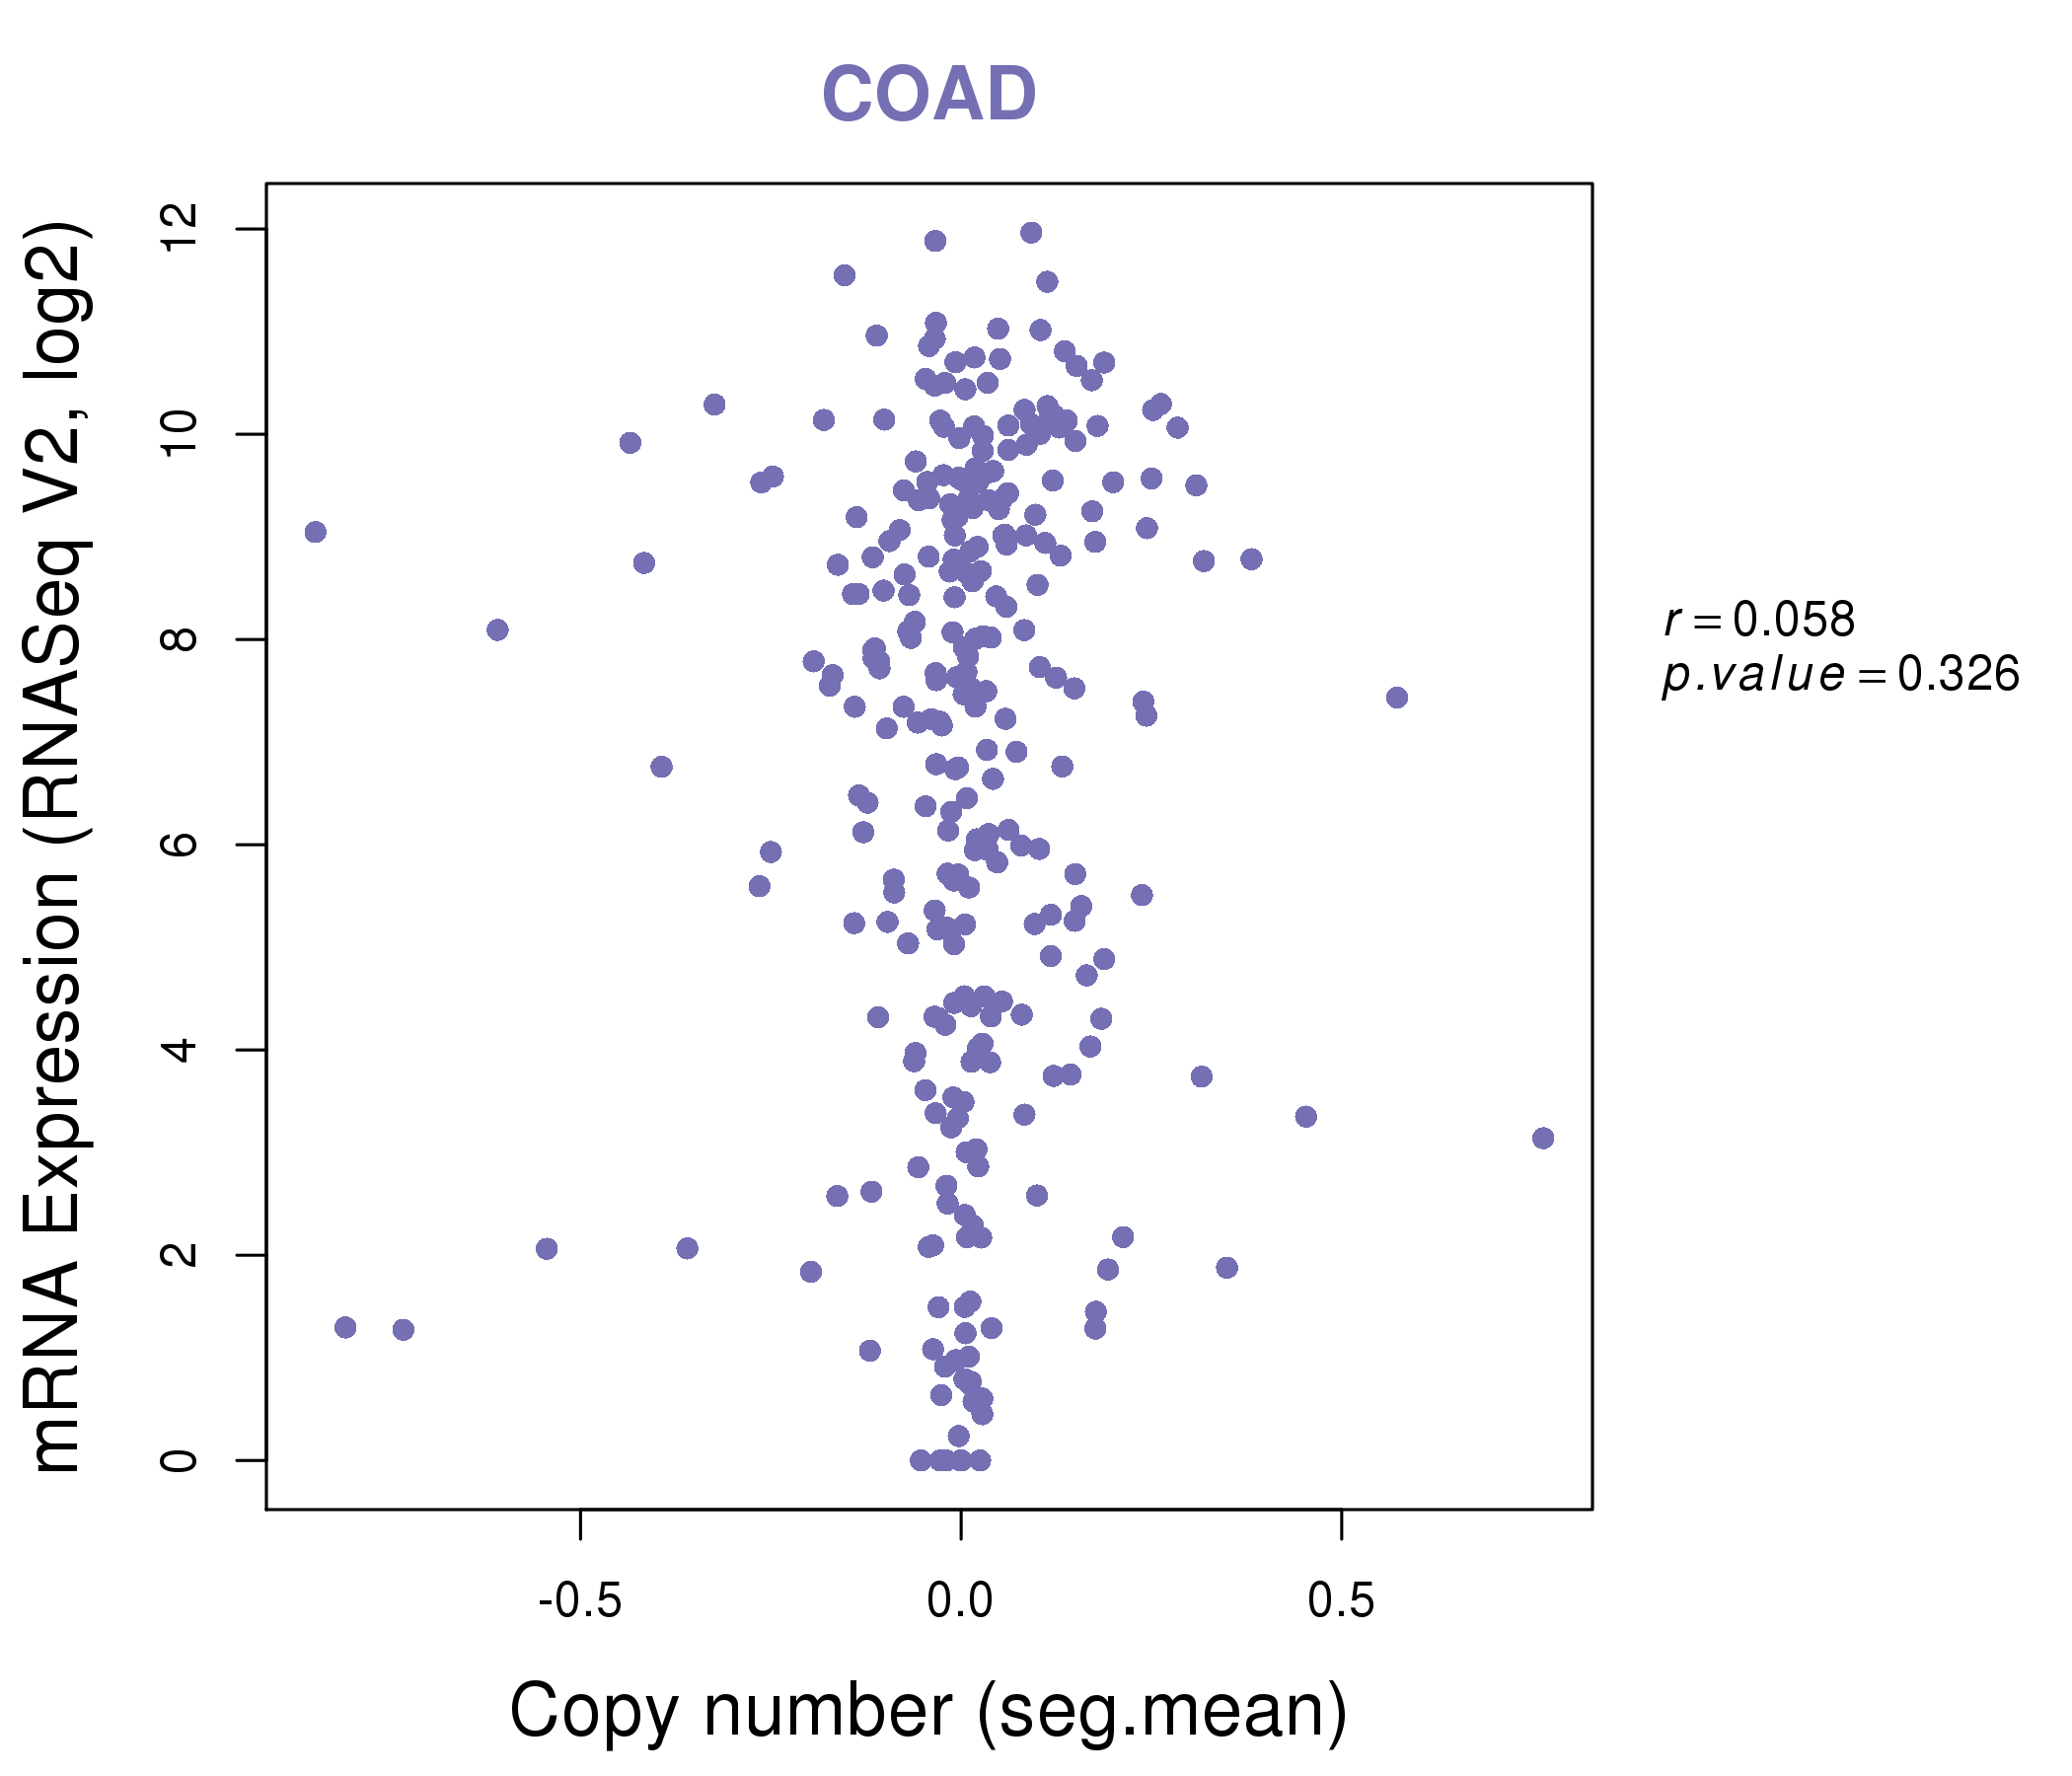
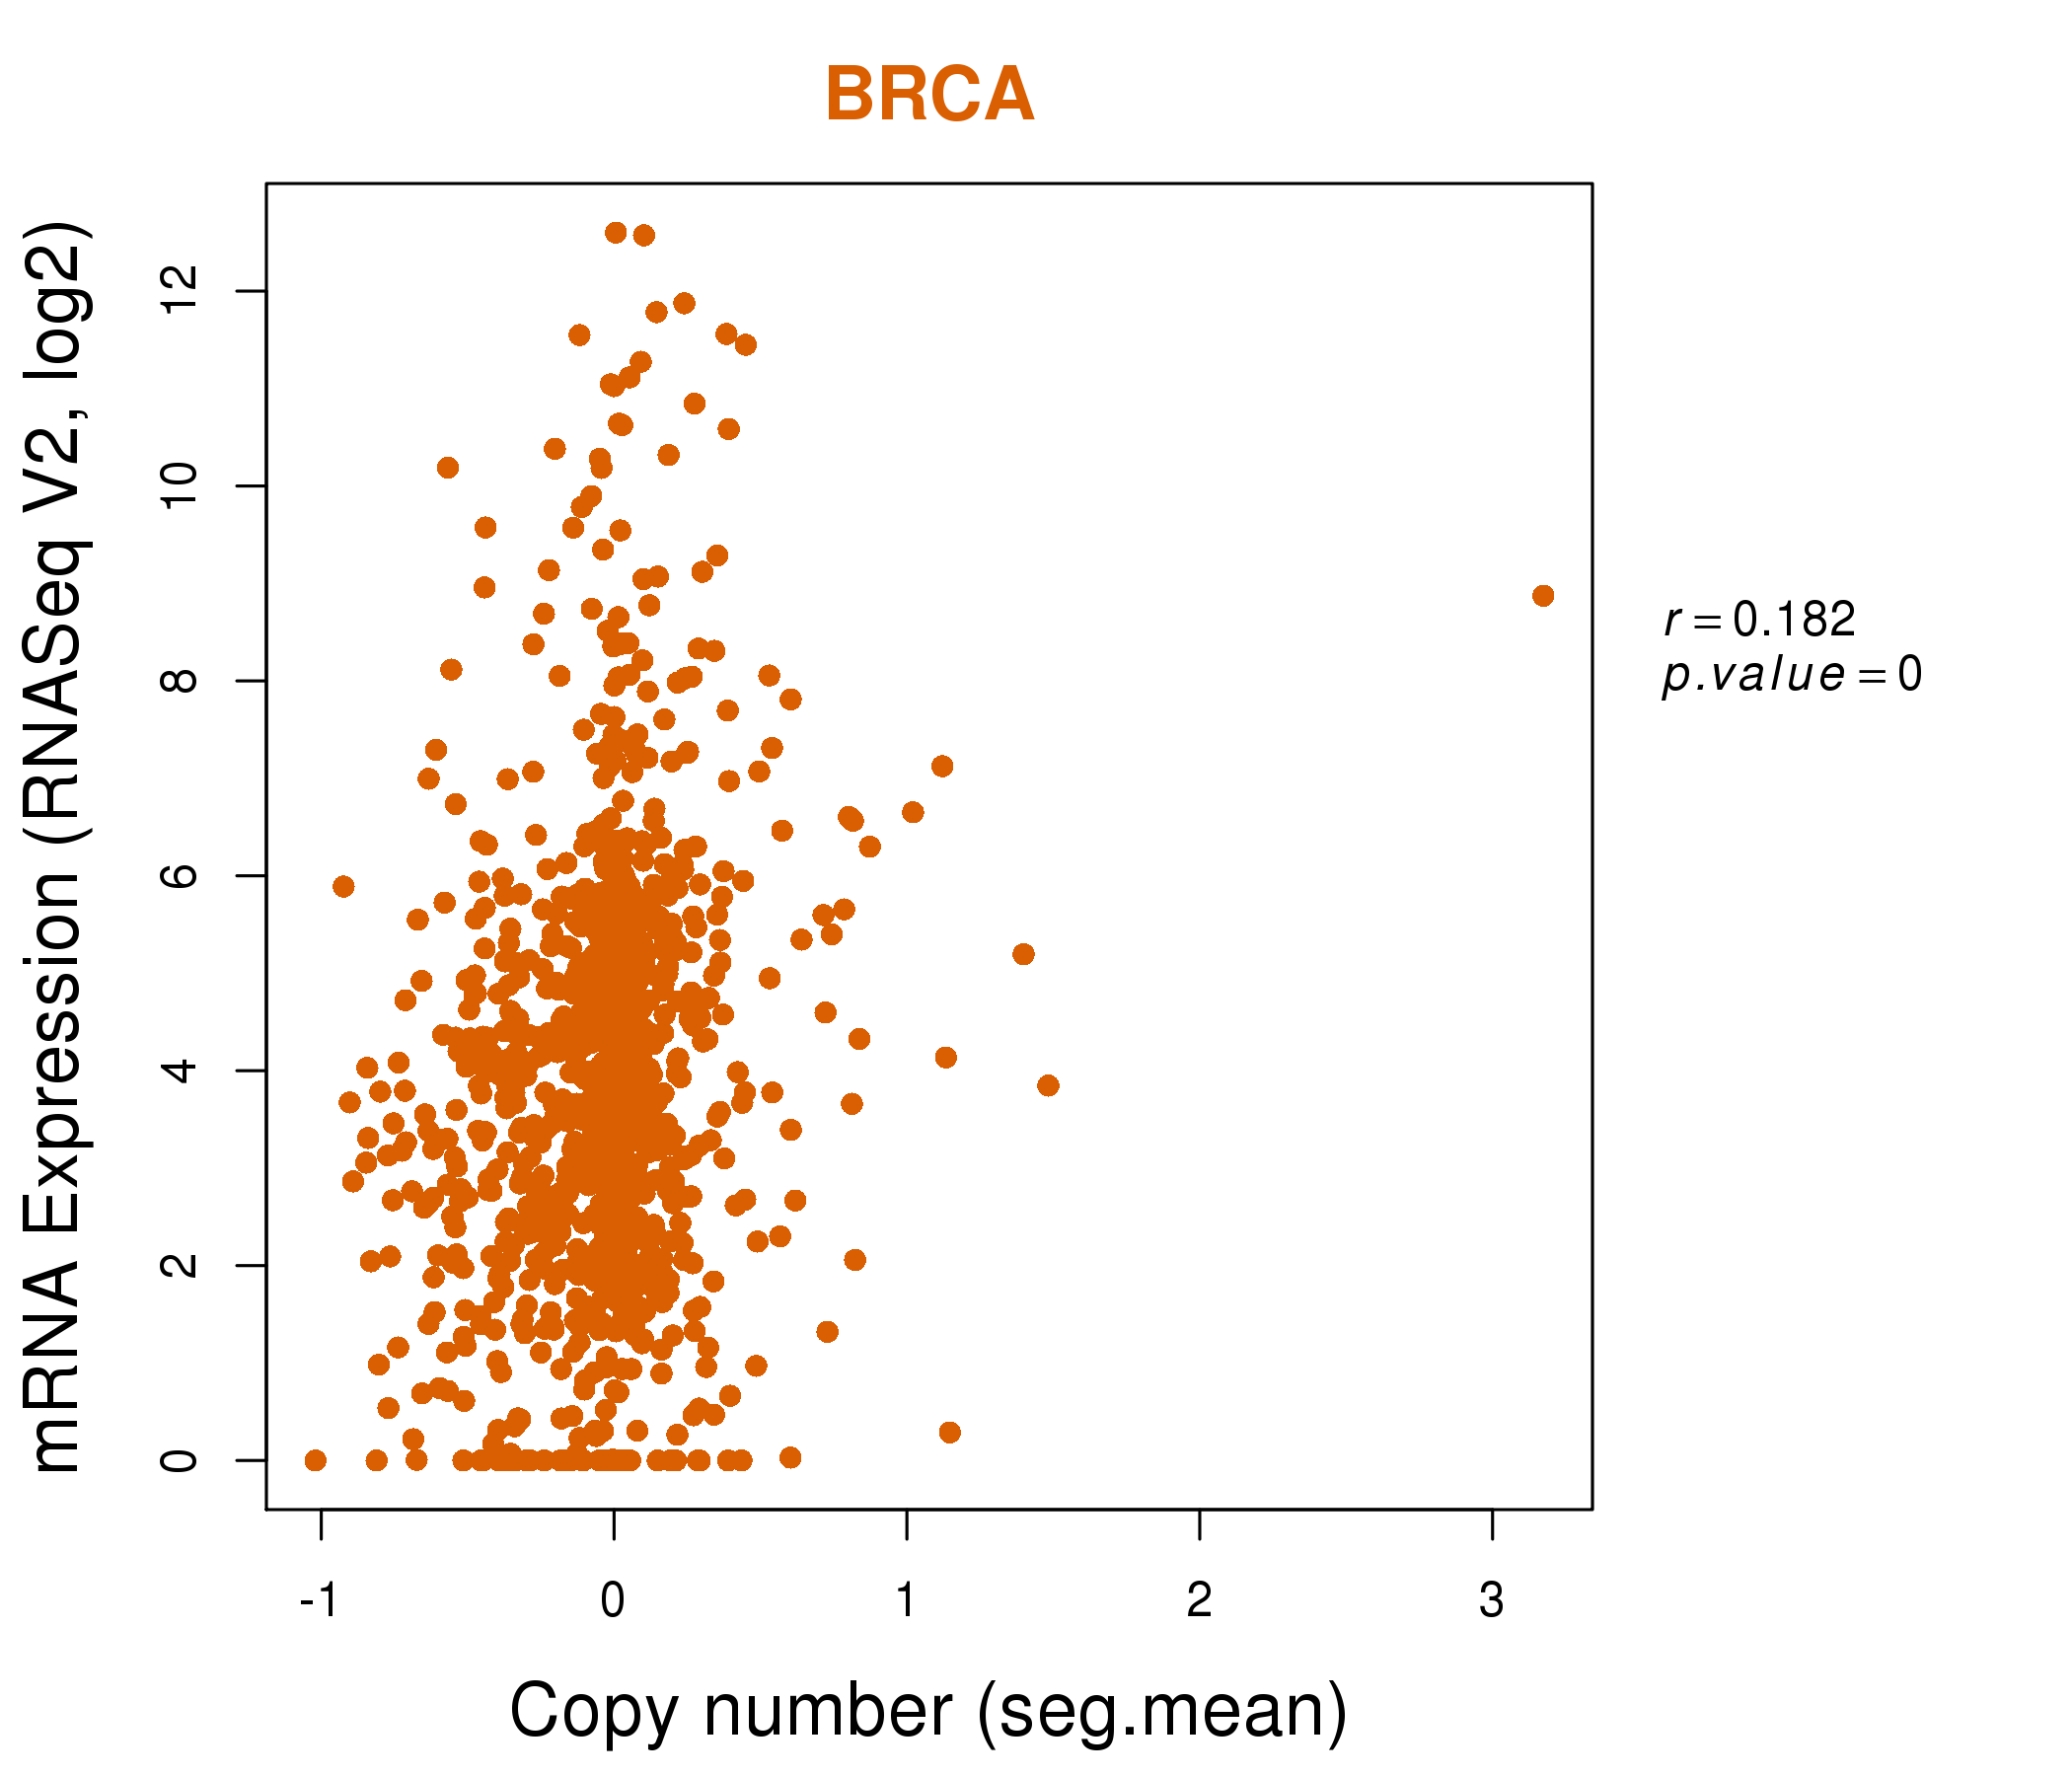
| * Copy number data were extracted from TCGA using R package TCGA-Assembler. The URLs of all public data files on TCGA DCC data server were gathered on Jan-05-2015. Function ProcessCNAData in TCGA-Assembler package was used to obtain gene-level copy number value which is calculated as the average copy number of the genomic region of a gene. |
 |
| cf) Tissue ID[Tissue type]: BLCA[Bladder Urothelial Carcinoma], BRCA[Breast invasive carcinoma], CESC[Cervical squamous cell carcinoma and endocervical adenocarcinoma], COAD[Colon adenocarcinoma], GBM[Glioblastoma multiforme], Glioma Low Grade, HNSC[Head and Neck squamous cell carcinoma], KICH[Kidney Chromophobe], KIRC[Kidney renal clear cell carcinoma], KIRP[Kidney renal papillary cell carcinoma], LAML[Acute Myeloid Leukemia], LUAD[Lung adenocarcinoma], LUSC[Lung squamous cell carcinoma], OV[Ovarian serous cystadenocarcinoma ], PAAD[Pancreatic adenocarcinoma], PRAD[Prostate adenocarcinoma], SKCM[Skin Cutaneous Melanoma], STAD[Stomach adenocarcinoma], THCA[Thyroid carcinoma], UCEC[Uterine Corpus Endometrial Carcinoma] |
| Top |
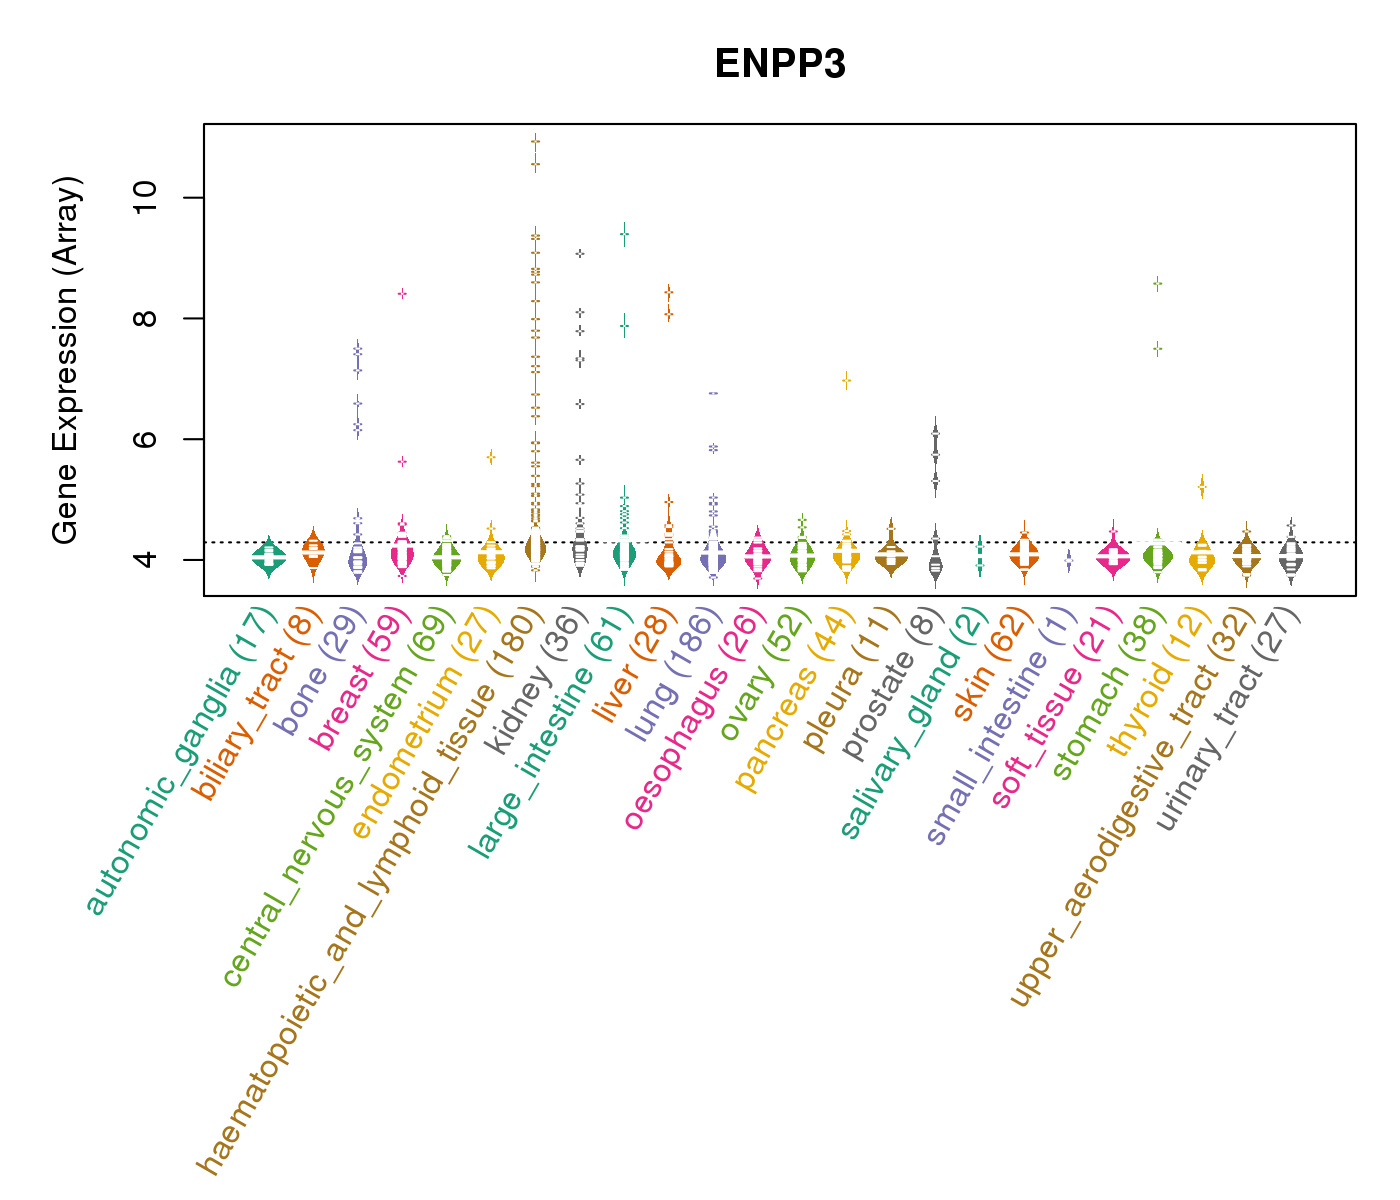
| Gene Expression for ENPP3 |
| * CCLE gene expression data were extracted from CCLE_Expression_Entrez_2012-10-18.res: Gene-centric RMA-normalized mRNA expression data. |
 |
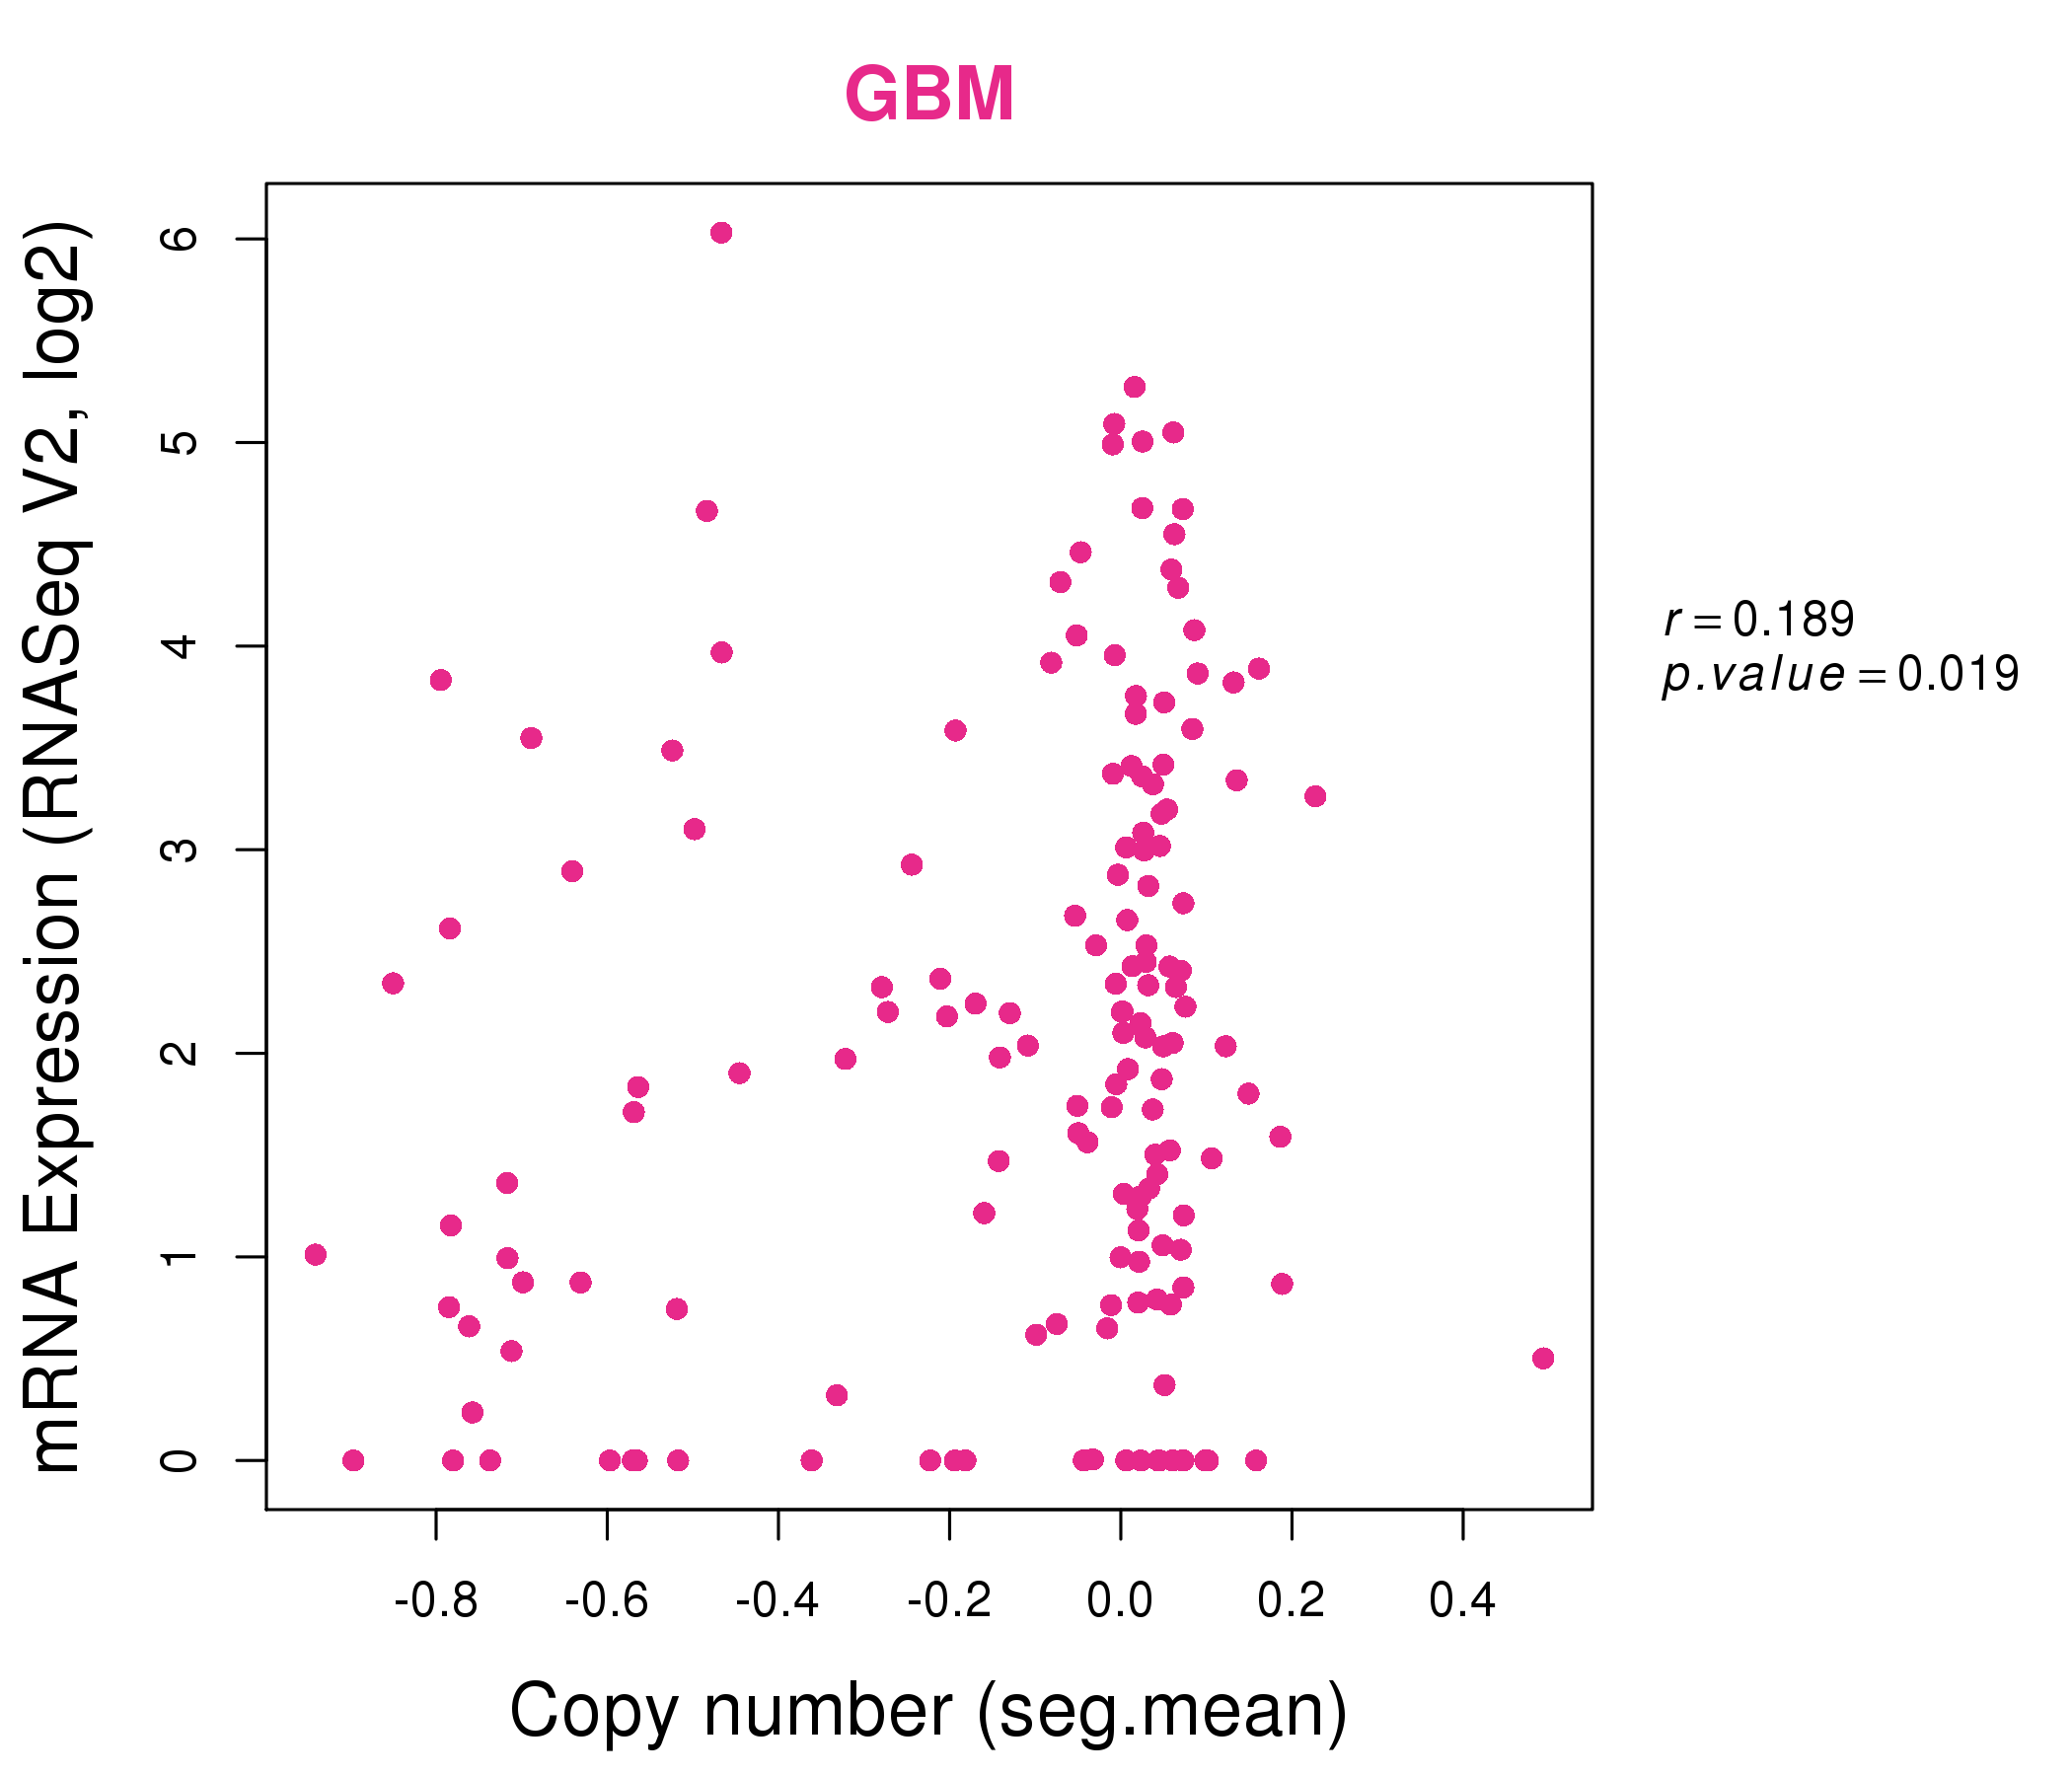
| * Normalized gene expression data of RNASeqV2 was extracted from TCGA using R package TCGA-Assembler. The URLs of all public data files on TCGA DCC data server were gathered at Jan-05-2015. Only eight cancer types have enough normal control samples for differential expression analysis. (t test, adjusted p<0.05 (using Benjamini-Hochberg FDR)) |
 |
| Top |
| * This plots show the correlation between CNV and gene expression. |
: Open all plots for all cancer types
 |
|
 |
|
| Top |
| Gene-Gene Network Information |
| * Co-Expression network figures were drawn using R package igraph. Only the top 20 genes with the highest correlations were shown. Red circle: input gene, orange circle: cell metabolism gene, sky circle: other gene |
: Open all plots for all cancer types
 |
|
| ACSM1,C15orf43,LINC00589,ENPP3,GGT1,GJB1,ISX, MAP10,KRT40,KRTAP1-3,KRTAP1-5,KRTAP3-2,KRTAP3-3,NPY6R, OXER1,SCP2,SIPA1L2,SLC38A4,TMIGD1,UGT3A2,ZNRF3 | ACSL3,ADAM2,ALOX15B,APOD,DHRS2,ENPP3,F9, GUSB,HAAO,HIST1H3D,HIST1H4H,IDI1,NANOG,NAT2, PLA2G4E,PPEF1,RNASE12,SERHL,SPINK8,SULT1C3,UGT2B11 |
 |
|
| APOLD1,BCL11A,TEX43,CD46,CEP68,CFTR,ENPP3, GPSM2,MYO10,NAALADL2,OXGR1,PLCB4,RGR,RNF43, SATB2,SH3BP4,SRGAP3,TDGF1,TEAD2,TMEM150C,TRAF5 | SOWAHA,ANPEP,AQP11,CA13,CDHR2,CDHR5,CYP2B6, ENPP3,FLVCR1,HNF4G,ING2,LOC148709,MEP1A,MSRA, MYO1A,PCK2,PLCB3,PRAP1,SLC3A1,SLC46A3,AGMO |
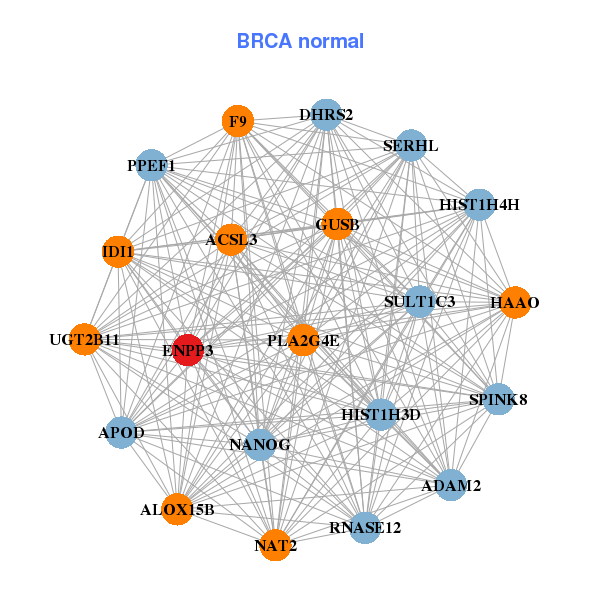
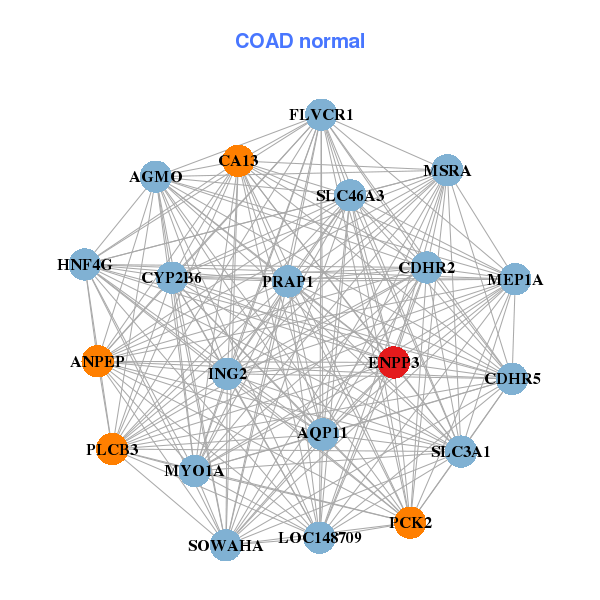
| * Co-Expression network figures were drawn using R package igraph. Only the top 20 genes with the highest correlations were shown. Red circle: input gene, orange circle: cell metabolism gene, sky circle: other gene |
: Open all plots for all cancer types
| Top |
: Open all interacting genes' information including KEGG pathway for all interacting genes from DAVID
| Top |
| Pharmacological Information for ENPP3 |
| There's no related Drug. |
| Top |
| Cross referenced IDs for ENPP3 |
| * We obtained these cross-references from Uniprot database. It covers 150 different DBs, 18 categories. http://www.uniprot.org/help/cross_references_section |
: Open all cross reference information
|
Copyright © 2016-Present - The Univsersity of Texas Health Science Center at Houston @ |