|
||||||||||||||||||||||||||||||||||||||||||||||||||||||||||||||||||||||||||||||||||||||||||||||||||||||||||||||||||||||||||||||||||||||||||||||||||||||||||||||||||||||||||||||||||||||||||||||||||||||||||||||||||||||||||||||||||||||||||||||||||||||||||||||||||||||||||||||||||||||||||||||||||||||||||||||||||||||||||
| |
| Phenotypic Information (metabolism pathway, cancer, disease, phenome) |
| |
| |
| Gene-Gene Network Information: Co-Expression Network, Interacting Genes & KEGG |
| |
|


| Gene Summary for ACSL5 |
| Basic gene info. | Gene symbol | ACSL5 |
| Gene name | acyl-CoA synthetase long-chain family member 5 | |
| Synonyms | ACS2|ACS5|FACL5 | |
| Cytomap | UCSC genome browser: 10q25.1-q25.2 | |
| Genomic location | chr10 :114135022-114188138 | |
| Type of gene | protein-coding | |
| RefGenes | NM_016234.3, NM_203379.1,NM_203380.1, | |
| Ensembl id | ENSG00000197142 | |
| Description | FACL5 for fatty acid coenzyme A ligase 5LACS 5fatty acid coenzyme A ligase 5fatty-acid-Coenzyme A ligase, long-chain 5long-chain acyl-CoA synthetase 5long-chain fatty acid coenzyme A ligase 5long-chain-fatty-acid--CoA ligase 5 | |
| Modification date | 20141207 | |
| dbXrefs | MIM : 605677 | |
| HGNC : HGNC | ||
| Ensembl : ENSG00000197142 | ||
| HPRD : 16139 | ||
| Vega : OTTHUMG00000019060 | ||
| Protein | UniProt: Q9ULC5 go to UniProt's Cross Reference DB Table | |
| Expression | CleanEX: HS_ACSL5 | |
| BioGPS: 51703 | ||
| Gene Expression Atlas: ENSG00000197142 | ||
| The Human Protein Atlas: ENSG00000197142 | ||
| Pathway | NCI Pathway Interaction Database: ACSL5 | |
| KEGG: ACSL5 | ||
| REACTOME: ACSL5 | ||
| ConsensusPathDB | ||
| Pathway Commons: ACSL5 | ||
| Metabolism | MetaCyc: ACSL5 | |
| HUMANCyc: ACSL5 | ||
| Regulation | Ensembl's Regulation: ENSG00000197142 | |
| miRBase: chr10 :114,135,022-114,188,138 | ||
| TargetScan: NM_016234 | ||
| cisRED: ENSG00000197142 | ||
| Context | iHOP: ACSL5 | |
| cancer metabolism search in PubMed: ACSL5 | ||
| UCL Cancer Institute: ACSL5 | ||
| Assigned class in ccmGDB | A - This gene has a literature evidence and it belongs to cancer gene. | |
| References showing role of ACSL5 in cancer cell metabolism | 1. Mashima T, Oh-hara T, Sato S, Mochizuki M, Sugimoto Y, et al. (2005) p53-defective tumors with a functional apoptosome-mediated pathway: a new therapeutic target. J Natl Cancer Inst 97: 765-777. doi: 10.1093/jnci/dji133. go to article 2. Mashima T, Sato S, Okabe S, Miyata S, Matsuura M, et al. (2009) Acyl-CoA synthetase as a cancer survival factor: its inhibition enhances the efficacy of etoposide. Cancer Sci 100: 1556-1562. doi: 10.1111/j.1349-7006.2009.01203.x. go to article 3. Gaisa NT, Reinartz A, Schneider U, Klaus C, Heidenreich A, et al. (2013) Levels of acyl-coenzyme A synthetase 5 in urothelial cells and corresponding neoplasias reflect cellular differentiation. Histol Histopathol 28: 353-364. go to article 4. Klaus C, Jeon MK, Kaemmerer E, Gassler N (2013) Intestinal acyl-CoA synthetase 5: activation of long chain fatty acids and behind. World J Gastroenterol 19: 7369-7373. doi: 10.3748/wjg.v19.i42.7369. pmid: 3831218. go to article | |
| Top |
| Phenotypic Information for ACSL5(metabolism pathway, cancer, disease, phenome) |
| Cancer | CGAP: ACSL5 |
| Familial Cancer Database: ACSL5 | |
| * This gene is included in those cancer gene databases. |
|
|
|
|
|
| . | ||||||||||||||||||||||||||||||||||||||||||||||||||||||||||||||||||||||||||||||||||||||||||||||||||||||||||||||||||||||||||||||||||||||||||||||||||||||||||||||||||||||||||||||||||||||||||||||||||||||||||||||||||||||||||||||||||||||||||||||||||||||||||||||||||||||||||||||||||||||||||||||||||||||||||||||||||||
Oncogene 1 | Significant driver gene in | |||||||||||||||||||||||||||||||||||||||||||||||||||||||||||||||||||||||||||||||||||||||||||||||||||||||||||||||||||||||||||||||||||||||||||||||||||||||||||||||||||||||||||||||||||||||||||||||||||||||||||||||||||||||||||||||||||||||||||||||||||||||||||||||||||||||||||||||||||||||||||||||||||||||||||||||||||||||||
| cf) number; DB name 1 Oncogene; http://nar.oxfordjournals.org/content/35/suppl_1/D721.long, 2 Tumor Suppressor gene; https://bioinfo.uth.edu/TSGene/, 3 Cancer Gene Census; http://www.nature.com/nrc/journal/v4/n3/abs/nrc1299.html, 4 CancerGenes; http://nar.oxfordjournals.org/content/35/suppl_1/D721.long, 5 Network of Cancer Gene; http://ncg.kcl.ac.uk/index.php, 1Therapeutic Vulnerabilities in Cancer; http://cbio.mskcc.org/cancergenomics/statius/ |
| KEGG_FATTY_ACID_METABOLISM REACTOME_METABOLISM_OF_LIPIDS_AND_LIPOPROTEINS | |
| OMIM | 605677; gene. |
| Orphanet | |
| Disease | KEGG Disease: ACSL5 |
| MedGen: ACSL5 (Human Medical Genetics with Condition) | |
| ClinVar: ACSL5 | |
| Phenotype | MGI: ACSL5 (International Mouse Phenotyping Consortium) |
| PhenomicDB: ACSL5 | |
| Mutations for ACSL5 |
| * Under tables are showing count per each tissue to give us broad intuition about tissue specific mutation patterns.You can go to the detailed page for each mutation database's web site. |
| - Statistics for Tissue and Mutation type | Top |
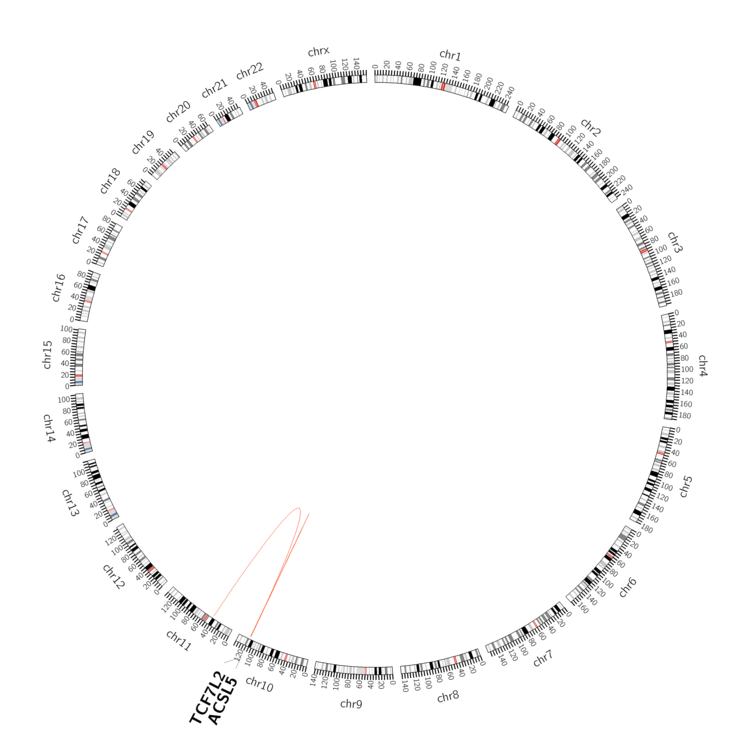 |
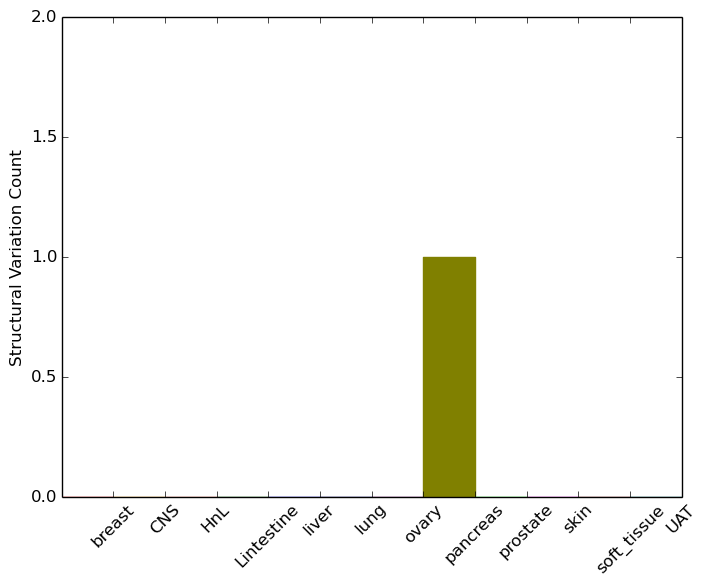
| - For Inter-chromosomal Variations |
| * Inter-chromosomal variantions includes 'interchromosomal amplicon to amplicon', 'interchromosomal amplicon to non-amplified dna', 'interchromosomal insertion', 'Interchromosomal unknown type'. |
 |
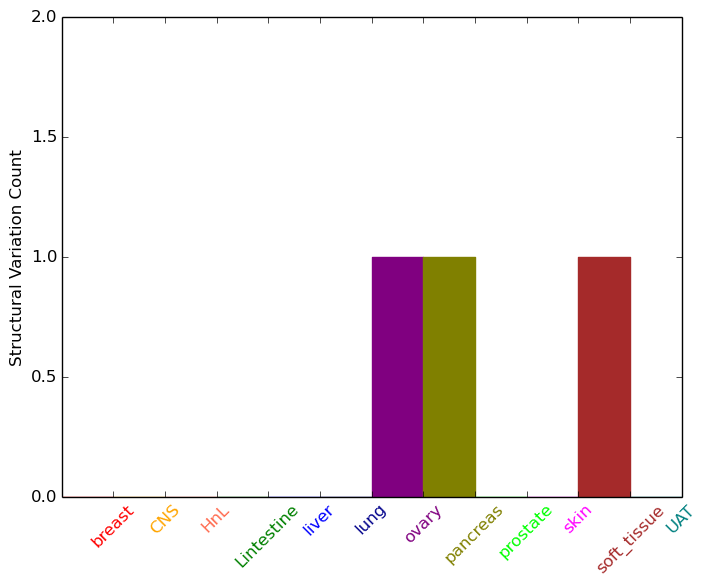
| - For Intra-chromosomal Variations |
| * Intra-chromosomal variantions includes 'intrachromosomal amplicon to amplicon', 'intrachromosomal amplicon to non-amplified dna', 'intrachromosomal deletion', 'intrachromosomal fold-back inversion', 'intrachromosomal inversion', 'intrachromosomal tandem duplication', 'Intrachromosomal unknown type', 'intrachromosomal with inverted orientation', 'intrachromosomal with non-inverted orientation'. |
 |
| Sample | Symbol_a | Chr_a | Start_a | End_a | Symbol_b | Chr_b | Start_b | End_b |
| ovary | ACSL5 | chr10 | 114176034 | 114176054 | chr10 | 114032681 | 114032701 | |
| pancreas | ACSL5 | chr10 | 114157774 | 114157794 | ACSL5 | chr10 | 114158113 | 114158133 |
| pancreas | ACSL5 | chr10 | 114169906 | 114169926 | chr11 | 42353687 | 42353707 | |
| soft_tissue | ACSL5 | chr10 | 114187973 | 114187973 | TCF7L2 | chr10 | 114730723 | 114730723 |
| cf) Tissue number; Tissue name (1;Breast, 2;Central_nervous_system, 3;Haematopoietic_and_lymphoid_tissue, 4;Large_intestine, 5;Liver, 6;Lung, 7;Ovary, 8;Pancreas, 9;Prostate, 10;Skin, 11;Soft_tissue, 12;Upper_aerodigestive_tract) |
| * From mRNA Sanger sequences, Chitars2.0 arranged chimeric transcripts. This table shows ACSL5 related fusion information. |
| ID | Head Gene | Tail Gene | Accession | Gene_a | qStart_a | qEnd_a | Chromosome_a | tStart_a | tEnd_a | Gene_a | qStart_a | qEnd_a | Chromosome_a | tStart_a | tEnd_a |
| AA573864 | ITLN1 | 1 | 75 | 1 | 160846463 | 160846537 | ACSL5 | 76 | 468 | 10 | 114171678 | 114177666 | |
| AI302586 | EIF3H | 8 | 324 | 8 | 117657074 | 117658757 | ACSL5 | 319 | 428 | 10 | 114177613 | 114181373 | |
| Top |
| Mutation type/ Tissue ID | brca | cns | cerv | endome | haematopo | kidn | Lintest | liver | lung | ns | ovary | pancre | prost | skin | stoma | thyro | urina | |||
| Total # sample | 1 | 1 | ||||||||||||||||||
| GAIN (# sample) | 1 | |||||||||||||||||||
| LOSS (# sample) | 1 |
| cf) Tissue ID; Tissue type (1; Breast, 2; Central_nervous_system, 3; Cervix, 4; Endometrium, 5; Haematopoietic_and_lymphoid_tissue, 6; Kidney, 7; Large_intestine, 8; Liver, 9; Lung, 10; NS, 11; Ovary, 12; Pancreas, 13; Prostate, 14; Skin, 15; Stomach, 16; Thyroid, 17; Urinary_tract) |
| Top |
|
 |
| Top |
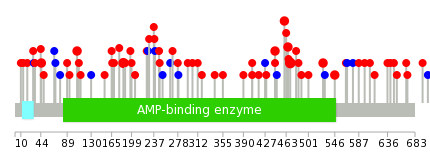
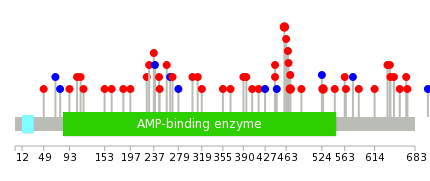
| Stat. for Non-Synonymous SNVs (# total SNVs=40) | (# total SNVs=7) |
 |  |
(# total SNVs=0) | (# total SNVs=0) |
| Top |
| * When you move the cursor on each content, you can see more deailed mutation information on the Tooltip. Those are primary_site,primary_histology,mutation(aa),pubmedID. |
| GRCh37 position | Mutation(aa) | Unique sampleID count |
| chr10:114177625-114177625 | p.R470C | 4 |
| chr10:114164518-114164518 | p.S185L | 3 |
| chr10:114154853-114154853 | p.G106E | 2 |
| chr10:114176725-114176725 | p.K444R | 2 |
| chr10:114176774-114176774 | p.K460N | 2 |
| chr10:114181725-114181725 | p.A526T | 2 |
| chr10:114136201-114136201 | p.S45L | 2 |
| chr10:114177614-114177614 | p.G466D | 2 |
| chr10:114181785-114181785 | p.E546K | 2 |
| chr10:114181350-114181350 | p.? | 2 |
| Top |
|
 |
| Point Mutation/ Tissue ID | 1 | 2 | 3 | 4 | 5 | 6 | 7 | 8 | 9 | 10 | 11 | 12 | 13 | 14 | 15 | 16 | 17 | 18 | 19 | 20 |
| # sample | 1 | 1 | 12 | 3 | 2 | 2 | 2 | 19 | 2 | 4 | ||||||||||
| # mutation | 1 | 1 | 12 | 4 | 2 | 2 | 2 | 25 | 3 | 7 | ||||||||||
| nonsynonymous SNV | 1 | 1 | 10 | 4 | 2 | 2 | 19 | 3 | 7 | |||||||||||
| synonymous SNV | 2 | 2 | 6 |
| cf) Tissue ID; Tissue type (1; BLCA[Bladder Urothelial Carcinoma], 2; BRCA[Breast invasive carcinoma], 3; CESC[Cervical squamous cell carcinoma and endocervical adenocarcinoma], 4; COAD[Colon adenocarcinoma], 5; GBM[Glioblastoma multiforme], 6; Glioma Low Grade, 7; HNSC[Head and Neck squamous cell carcinoma], 8; KICH[Kidney Chromophobe], 9; KIRC[Kidney renal clear cell carcinoma], 10; KIRP[Kidney renal papillary cell carcinoma], 11; LAML[Acute Myeloid Leukemia], 12; LUAD[Lung adenocarcinoma], 13; LUSC[Lung squamous cell carcinoma], 14; OV[Ovarian serous cystadenocarcinoma ], 15; PAAD[Pancreatic adenocarcinoma], 16; PRAD[Prostate adenocarcinoma], 17; SKCM[Skin Cutaneous Melanoma], 18:STAD[Stomach adenocarcinoma], 19:THCA[Thyroid carcinoma], 20:UCEC[Uterine Corpus Endometrial Carcinoma]) |
| Top |
| * We represented just top 10 SNVs. When you move the cursor on each content, you can see more deailed mutation information on the Tooltip. Those are primary_site, primary_histology, mutation(aa), pubmedID. |
| Genomic Position | Mutation(aa) | Unique sampleID count |
| chr10:114177625 | p.R470S,ACSL5 | 3 |
| chr10:114181725 | p.A526T,ACSL5 | 2 |
| chr10:114176774 | p.K460N,ACSL5 | 2 |
| chr10:114169281 | p.G106E,ACSL5 | 1 |
| chr10:114182198 | p.G279G,ACSL5 | 1 |
| chr10:114171725 | p.G466D,ACSL5 | 1 |
| chr10:114154853 | p.G657W,ACSL5 | 1 |
| chr10:114177614 | p.R112Q,ACSL5 | 1 |
| chr10:114169302 | p.P303L,ACSL5 | 1 |
| chr10:114185175 | p.G467R,ACSL5 | 1 |
| * Copy number data were extracted from TCGA using R package TCGA-Assembler. The URLs of all public data files on TCGA DCC data server were gathered on Jan-05-2015. Function ProcessCNAData in TCGA-Assembler package was used to obtain gene-level copy number value which is calculated as the average copy number of the genomic region of a gene. |
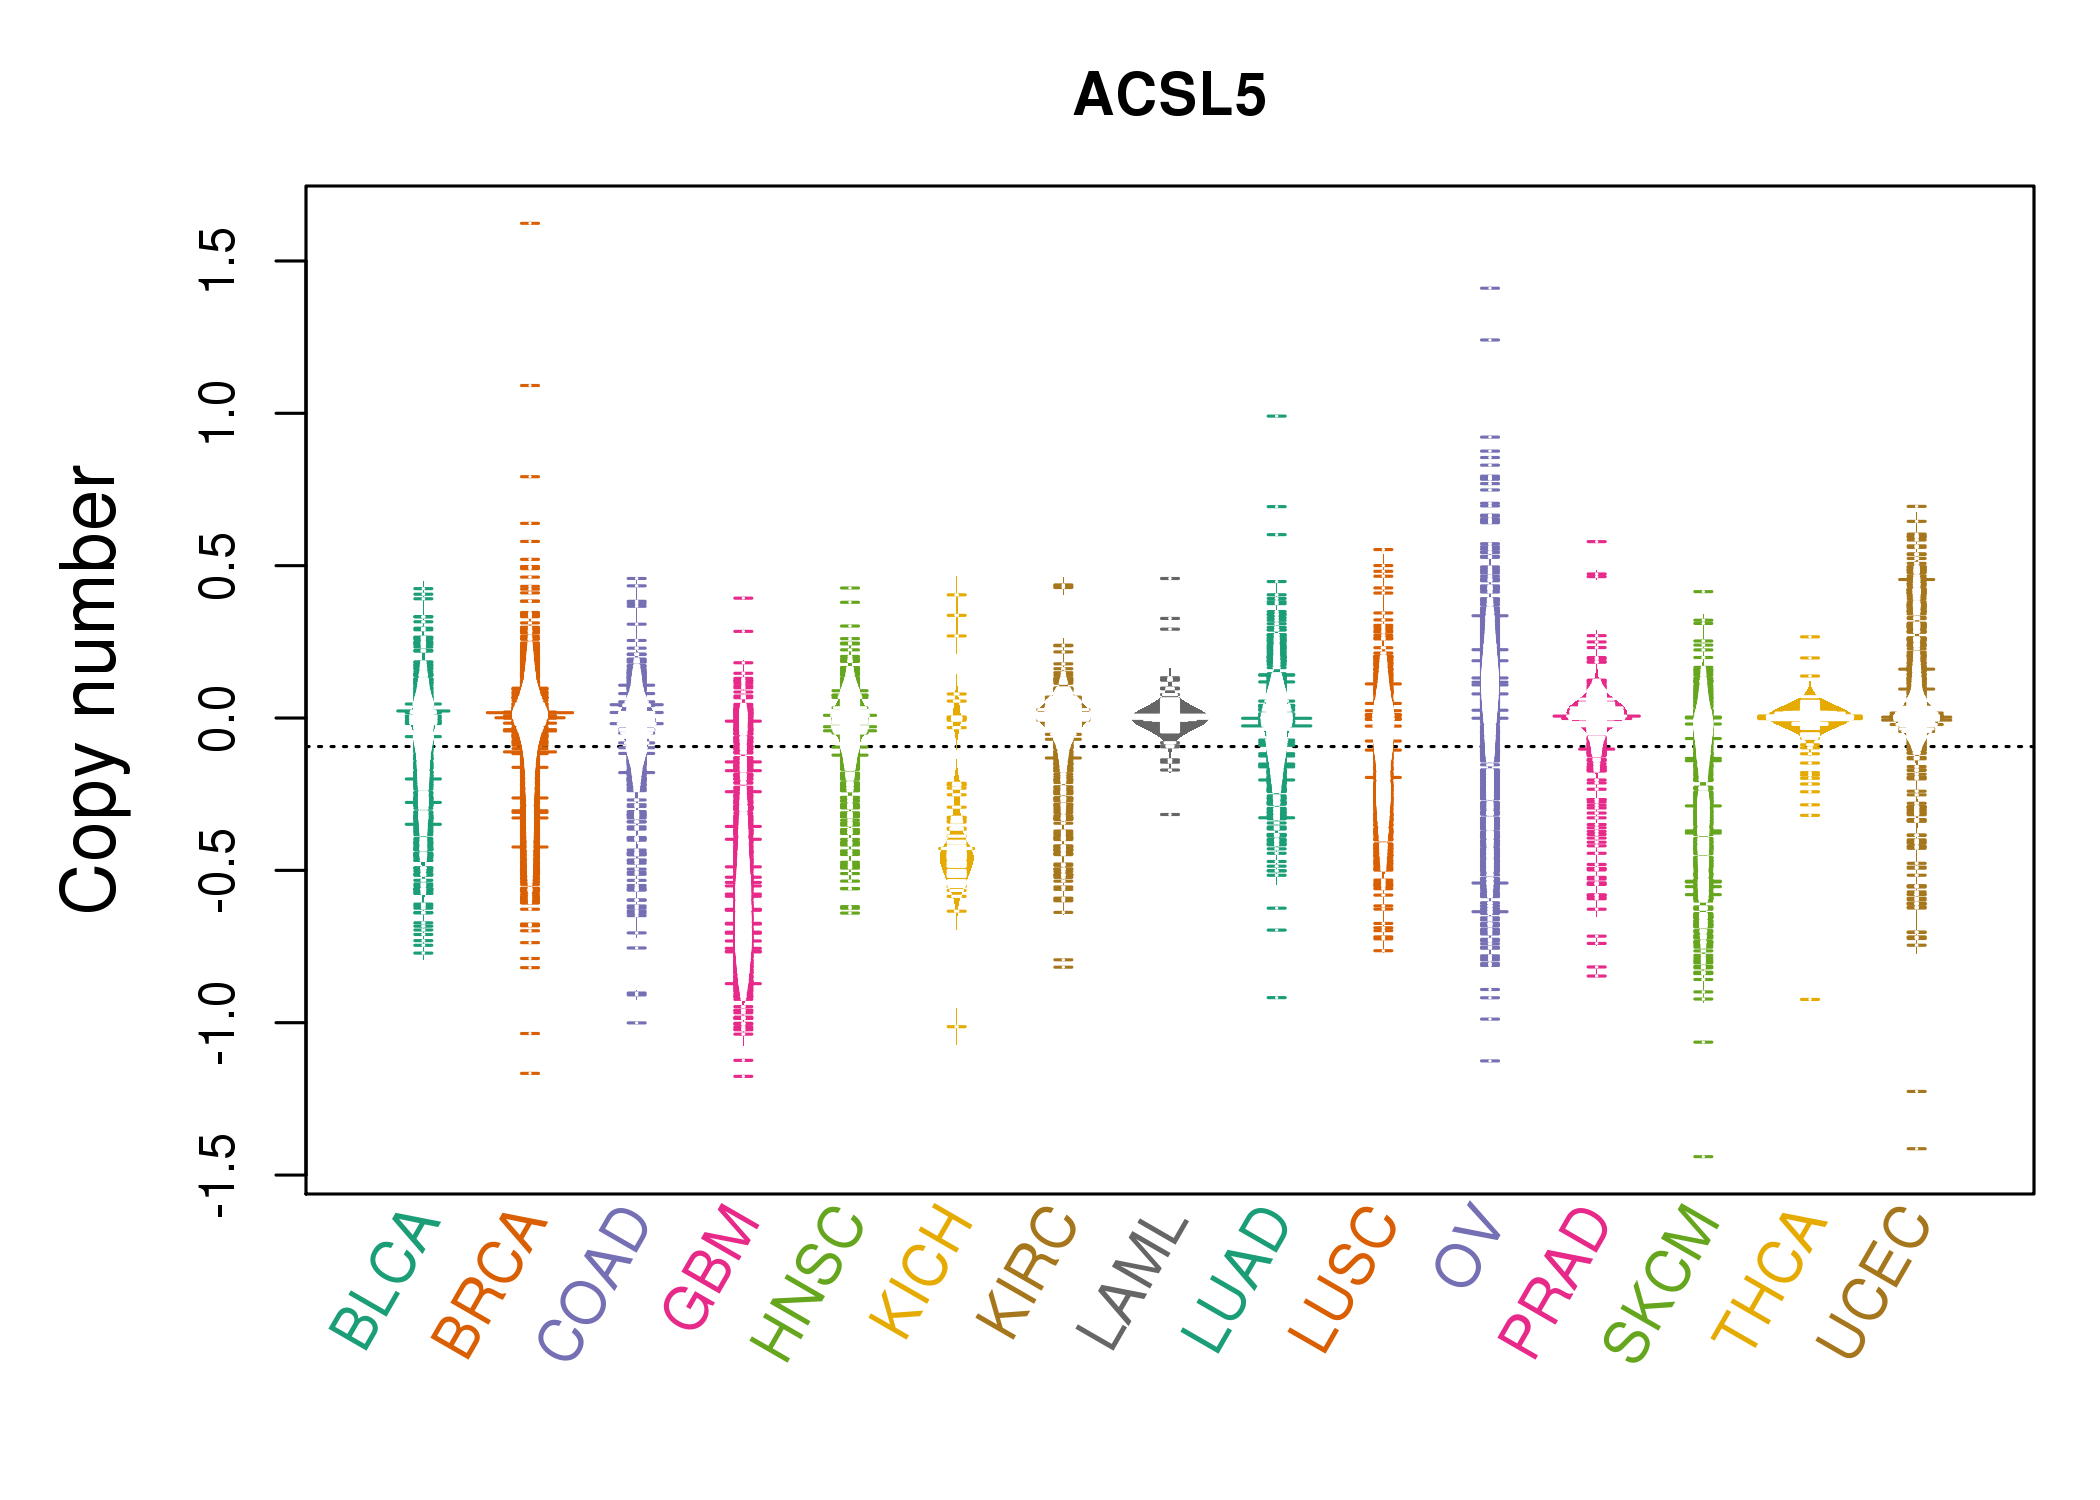 |
| cf) Tissue ID[Tissue type]: BLCA[Bladder Urothelial Carcinoma], BRCA[Breast invasive carcinoma], CESC[Cervical squamous cell carcinoma and endocervical adenocarcinoma], COAD[Colon adenocarcinoma], GBM[Glioblastoma multiforme], Glioma Low Grade, HNSC[Head and Neck squamous cell carcinoma], KICH[Kidney Chromophobe], KIRC[Kidney renal clear cell carcinoma], KIRP[Kidney renal papillary cell carcinoma], LAML[Acute Myeloid Leukemia], LUAD[Lung adenocarcinoma], LUSC[Lung squamous cell carcinoma], OV[Ovarian serous cystadenocarcinoma ], PAAD[Pancreatic adenocarcinoma], PRAD[Prostate adenocarcinoma], SKCM[Skin Cutaneous Melanoma], STAD[Stomach adenocarcinoma], THCA[Thyroid carcinoma], UCEC[Uterine Corpus Endometrial Carcinoma] |
| Top |
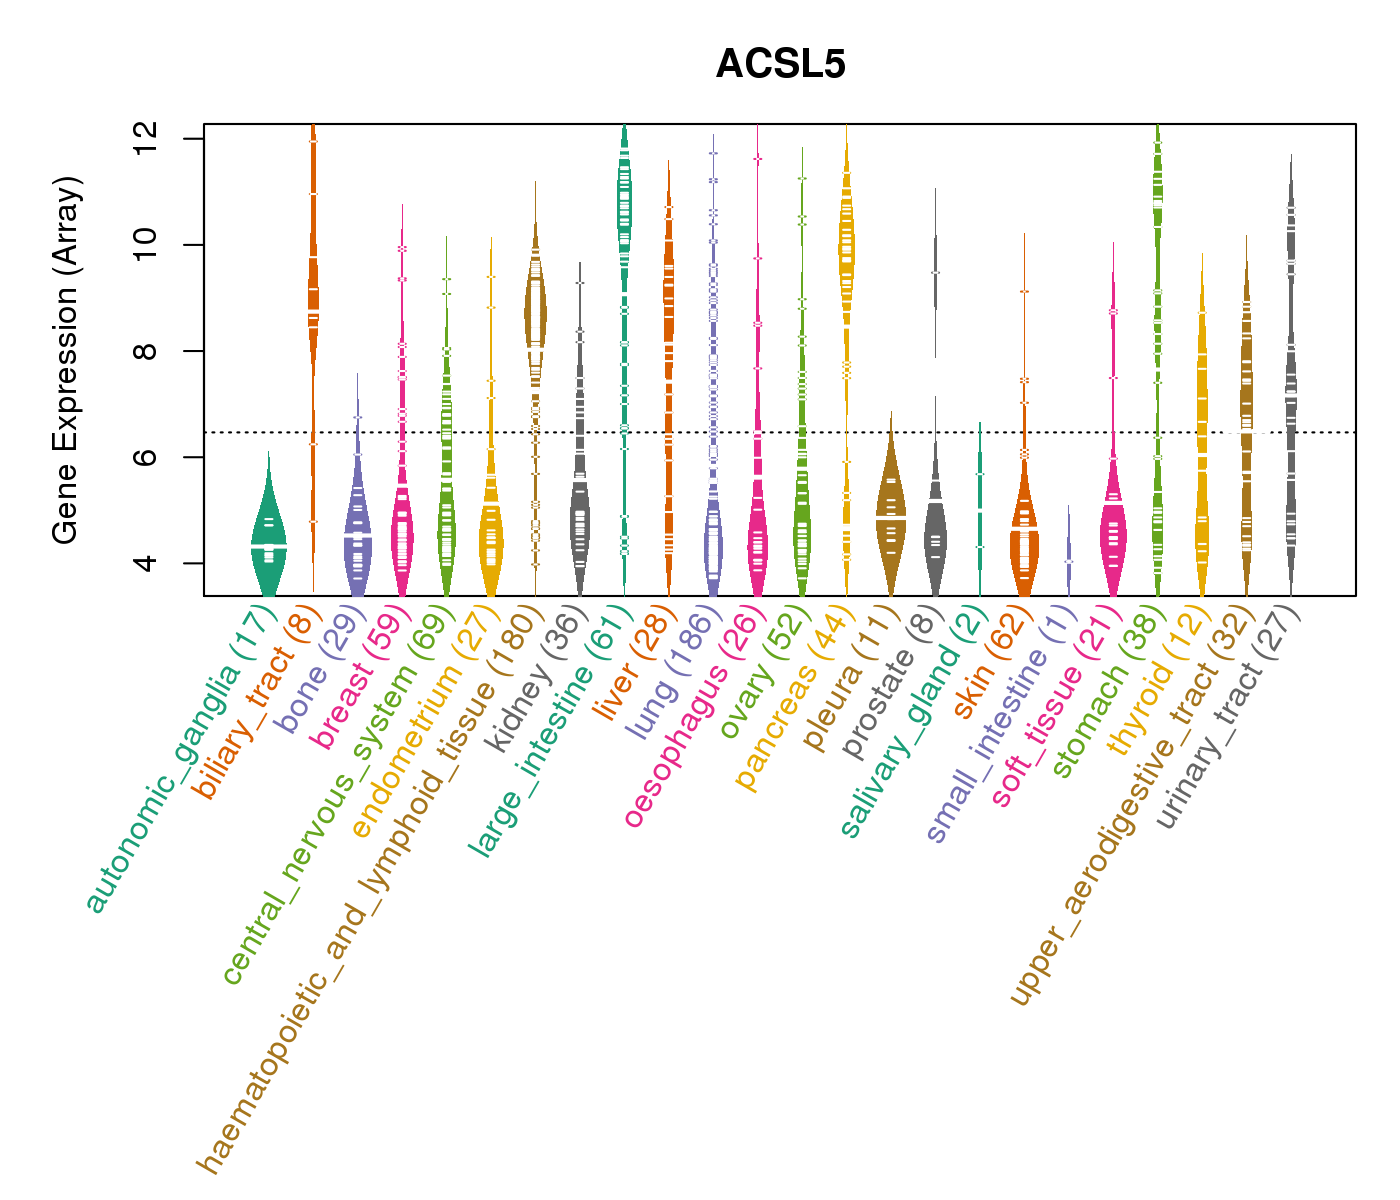
| Gene Expression for ACSL5 |
| * CCLE gene expression data were extracted from CCLE_Expression_Entrez_2012-10-18.res: Gene-centric RMA-normalized mRNA expression data. |
 |
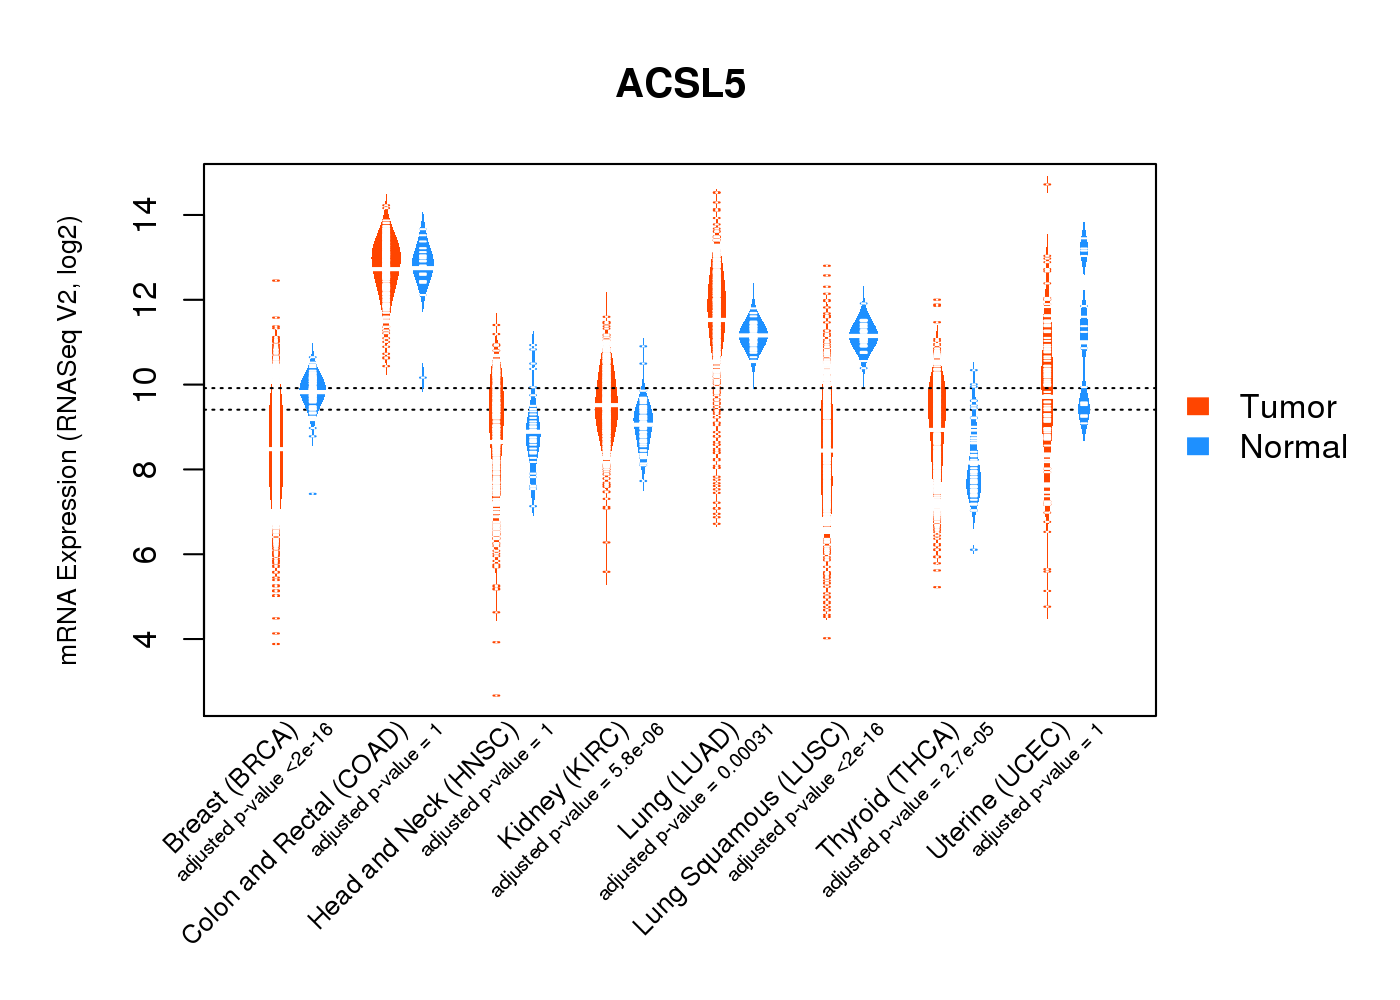
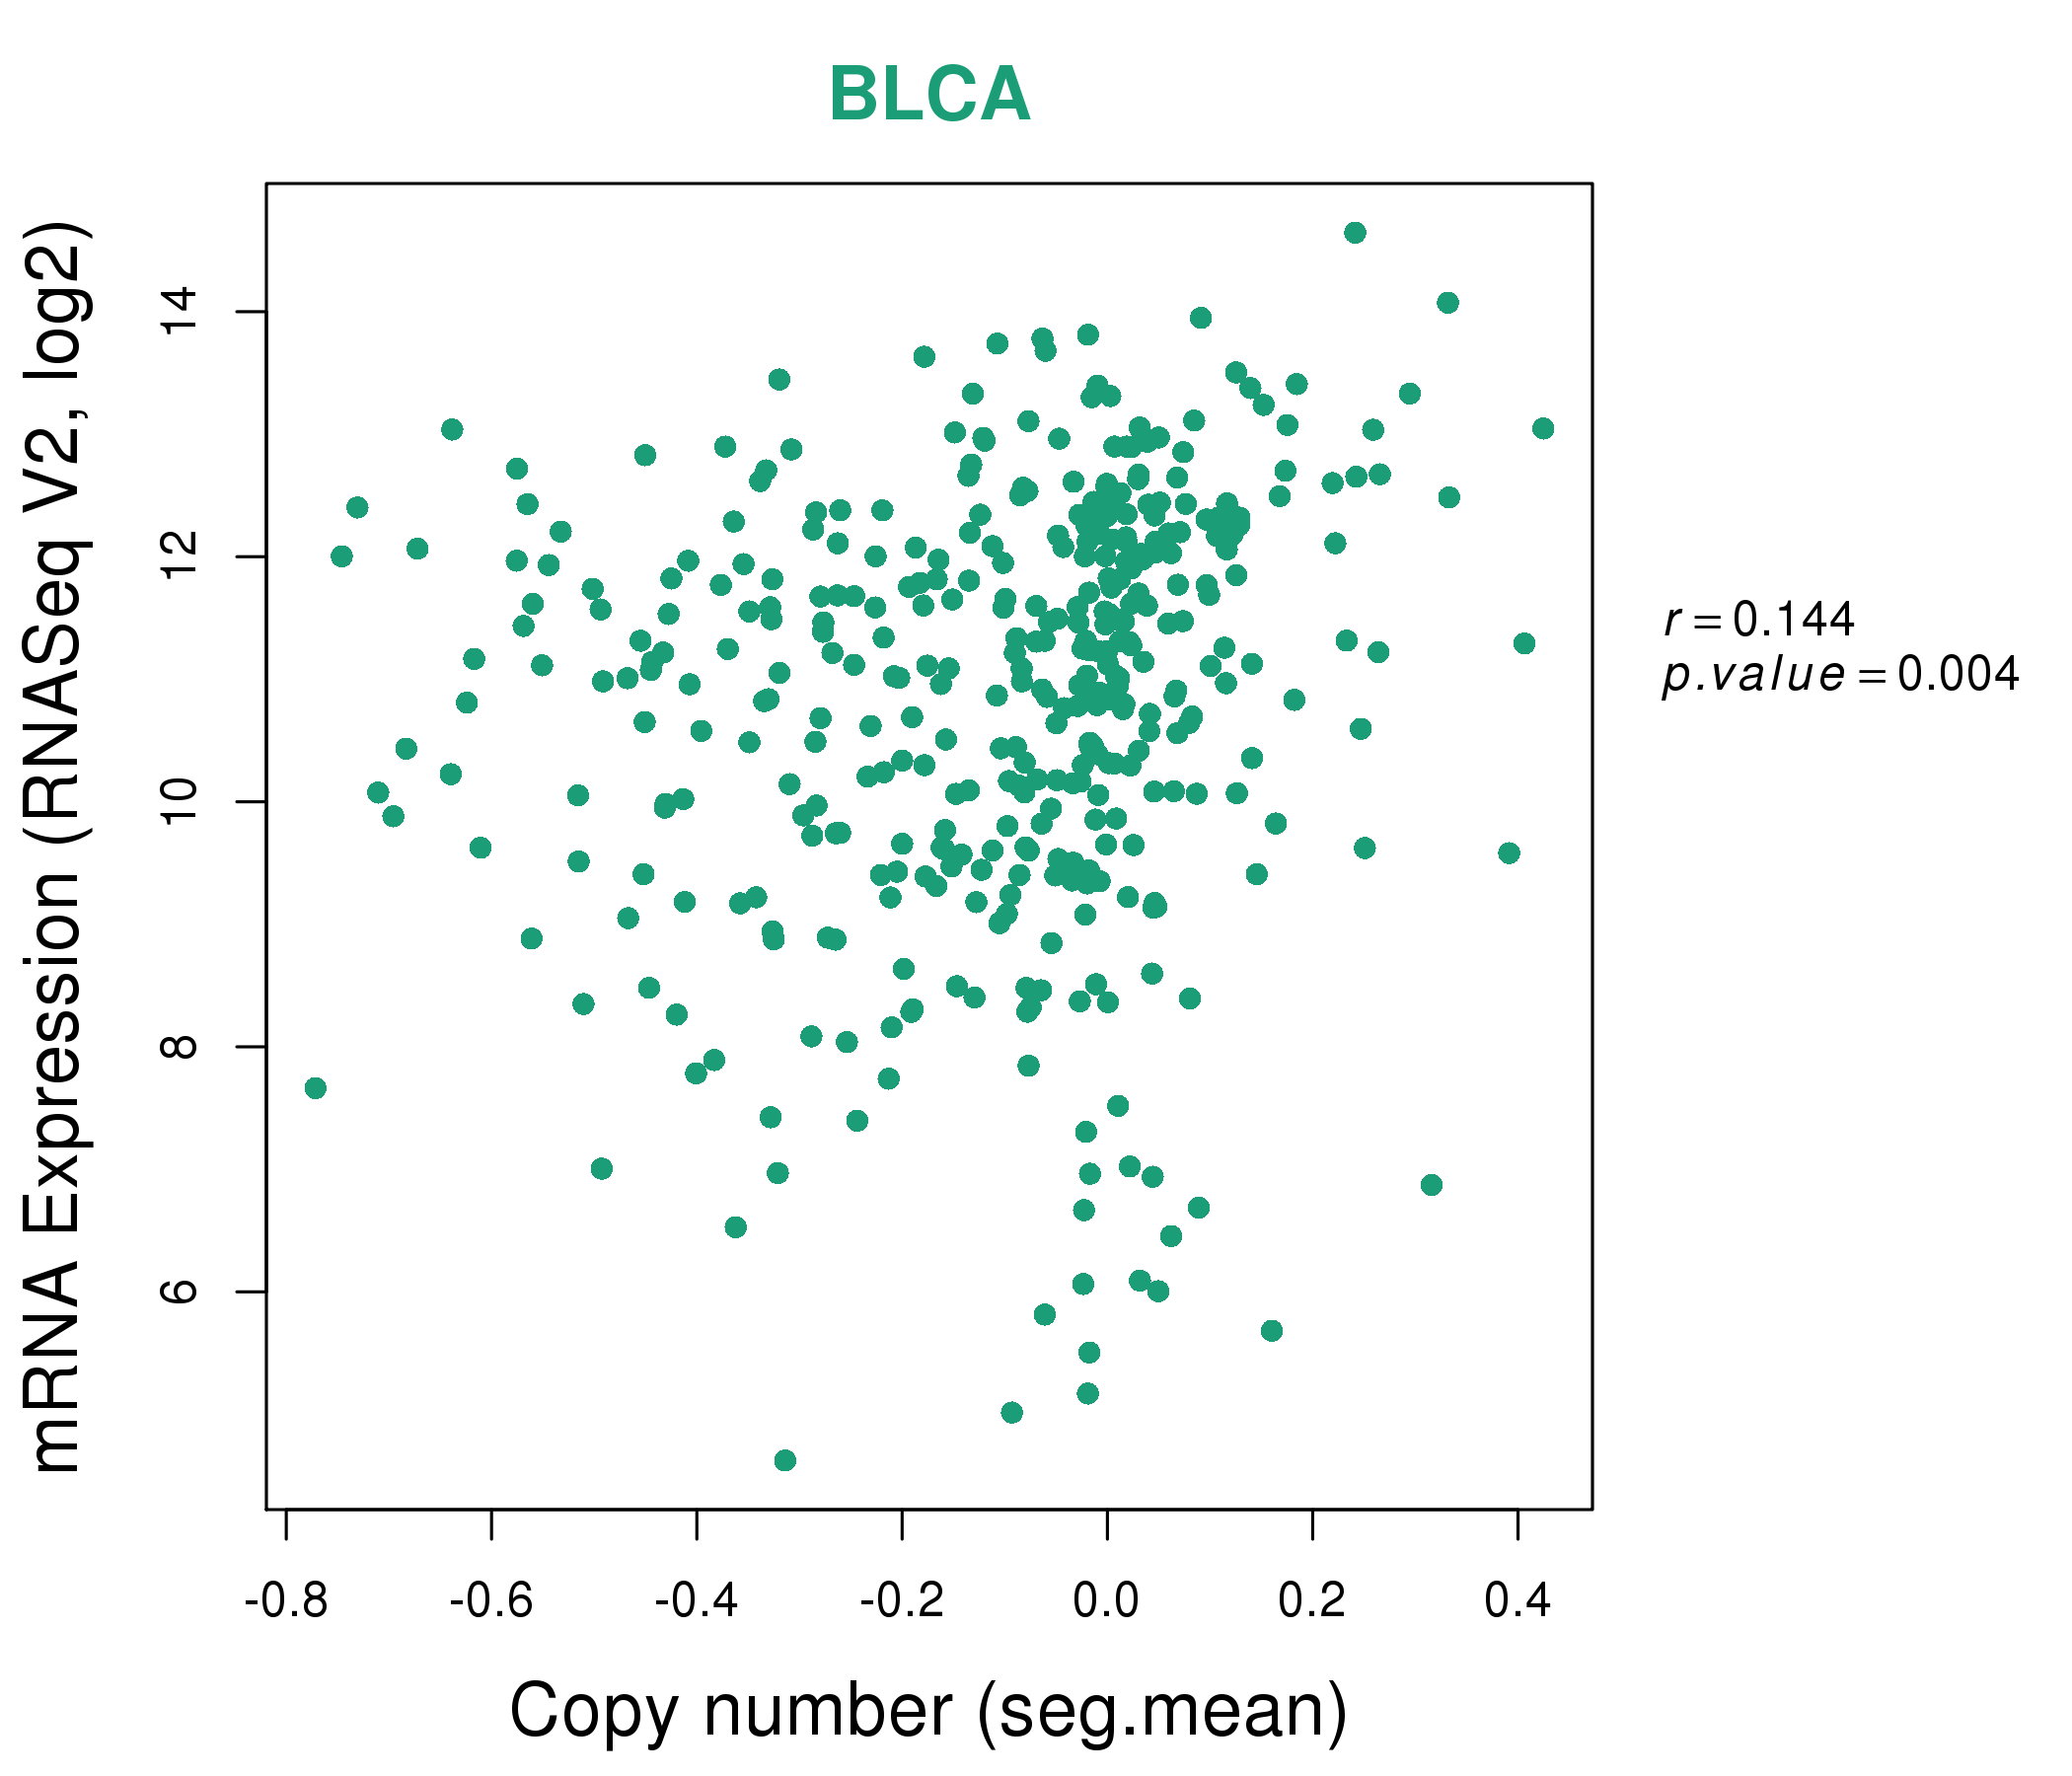
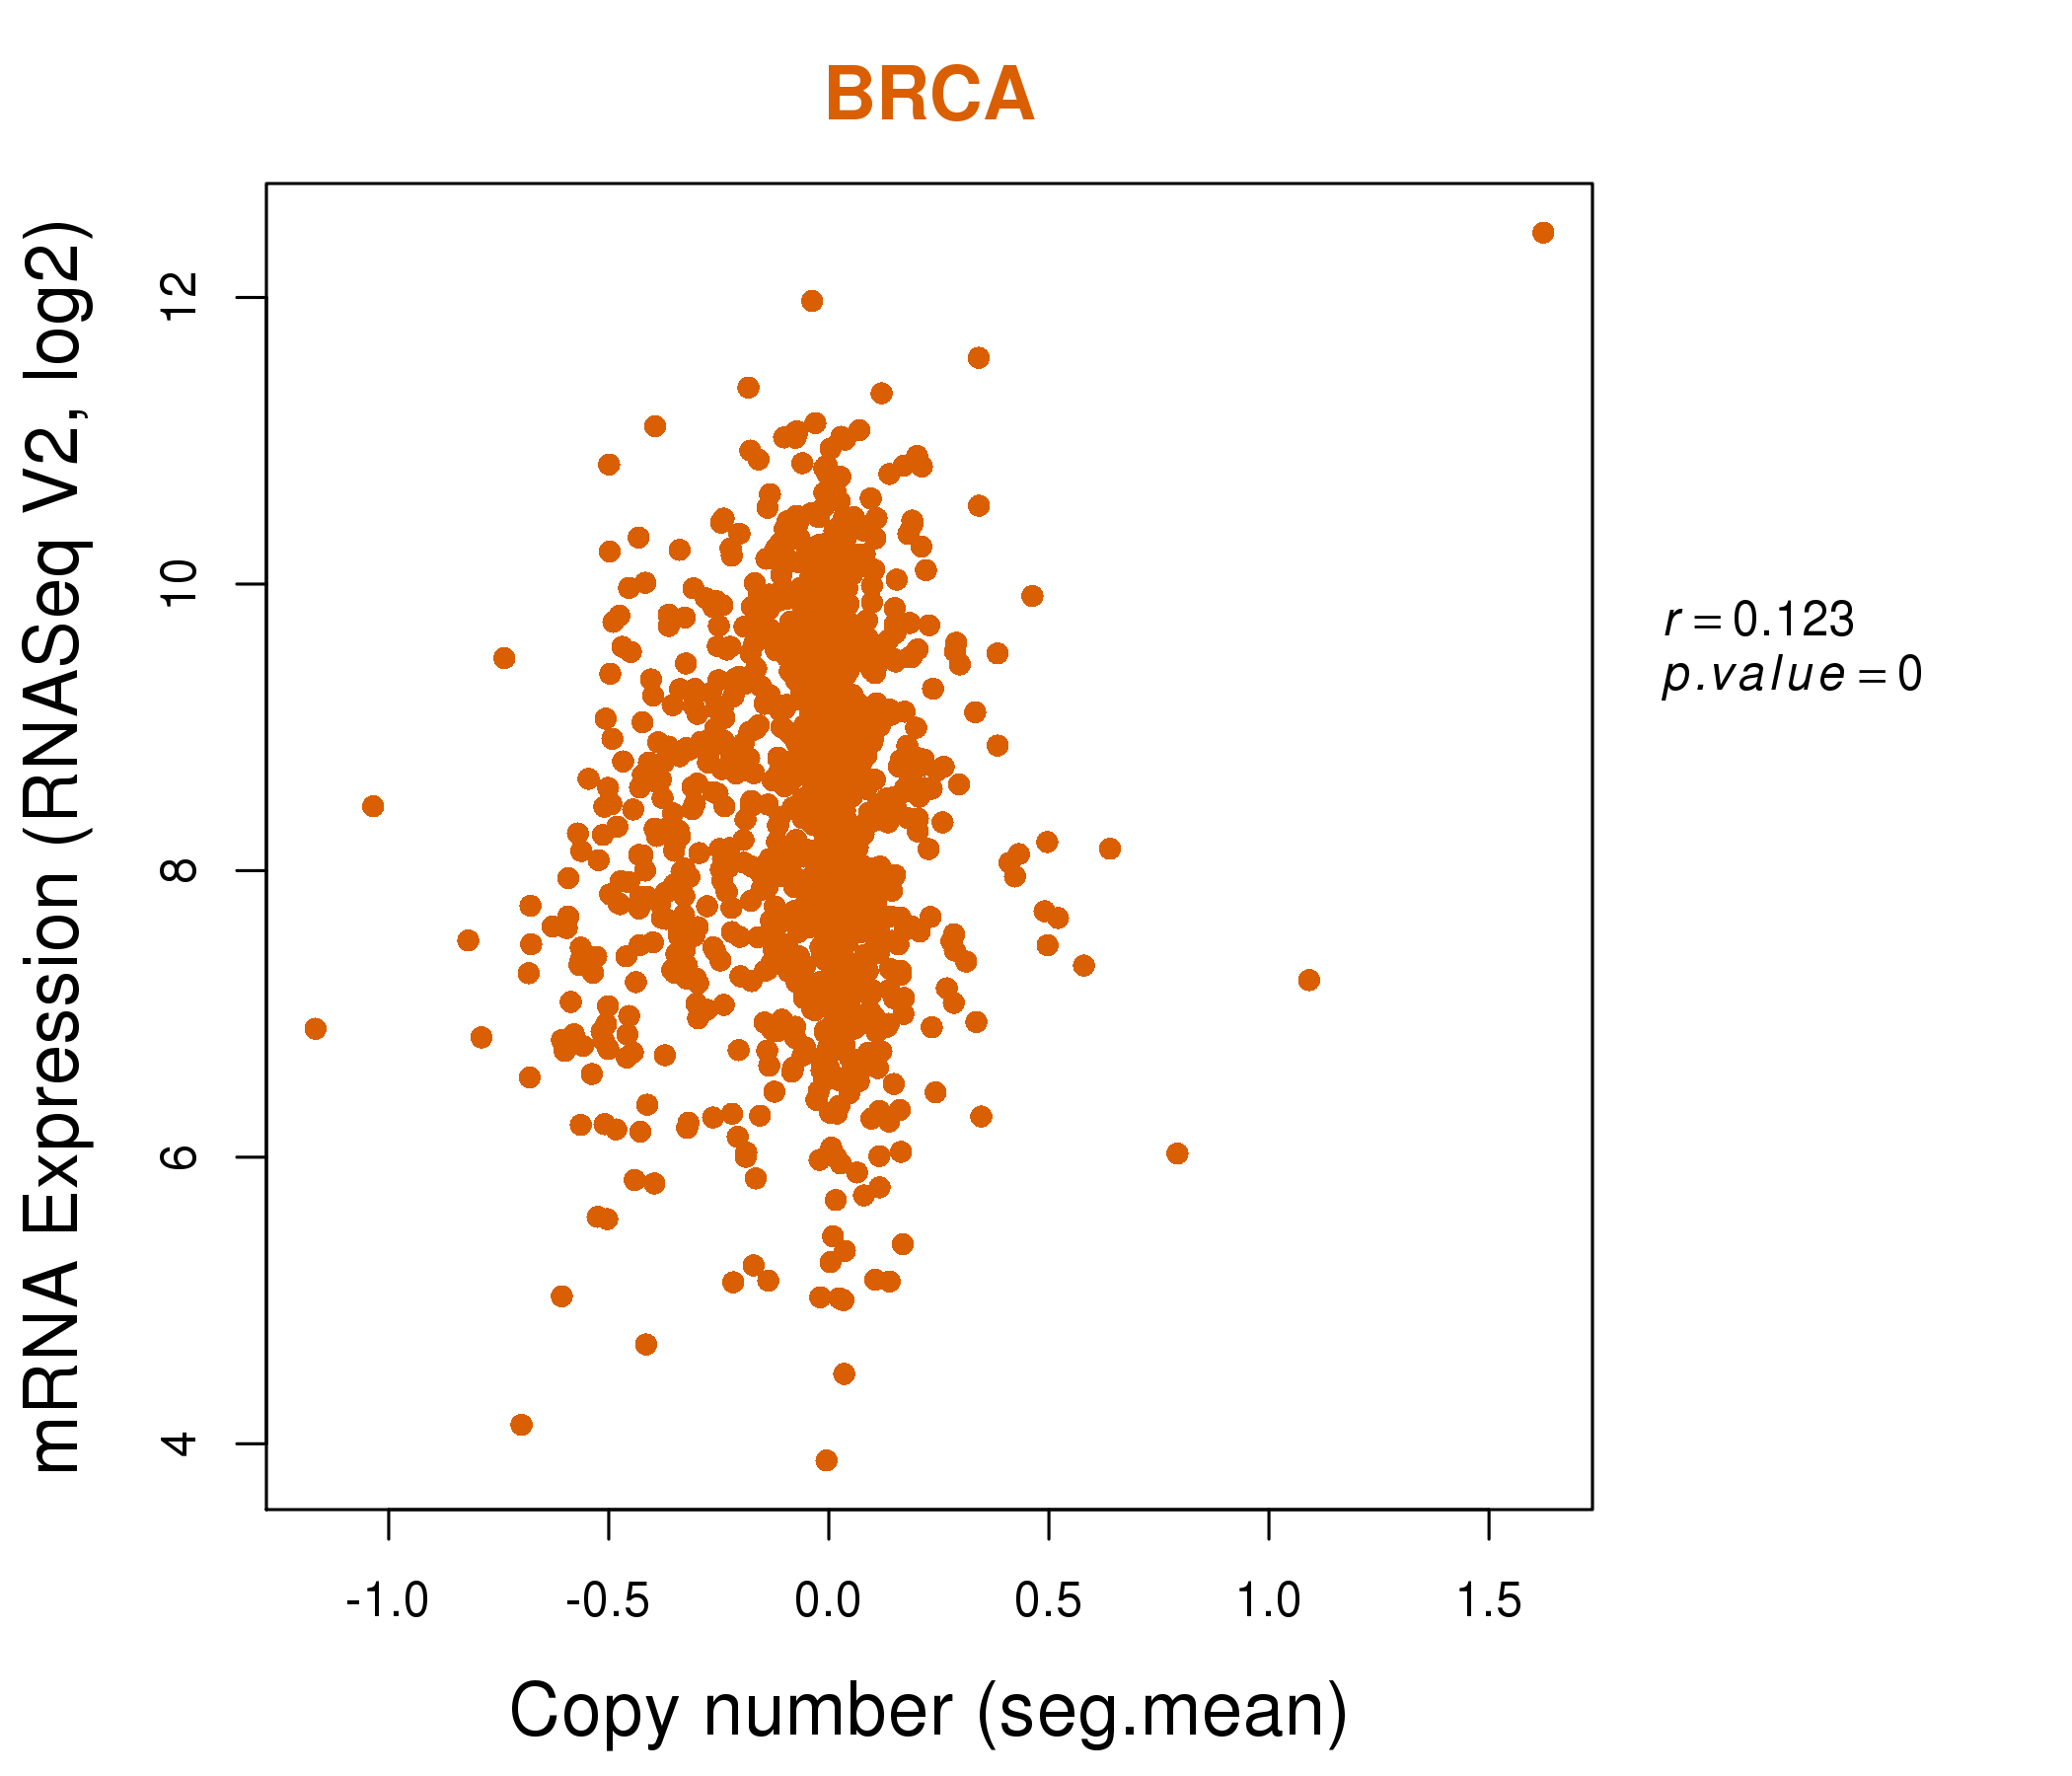
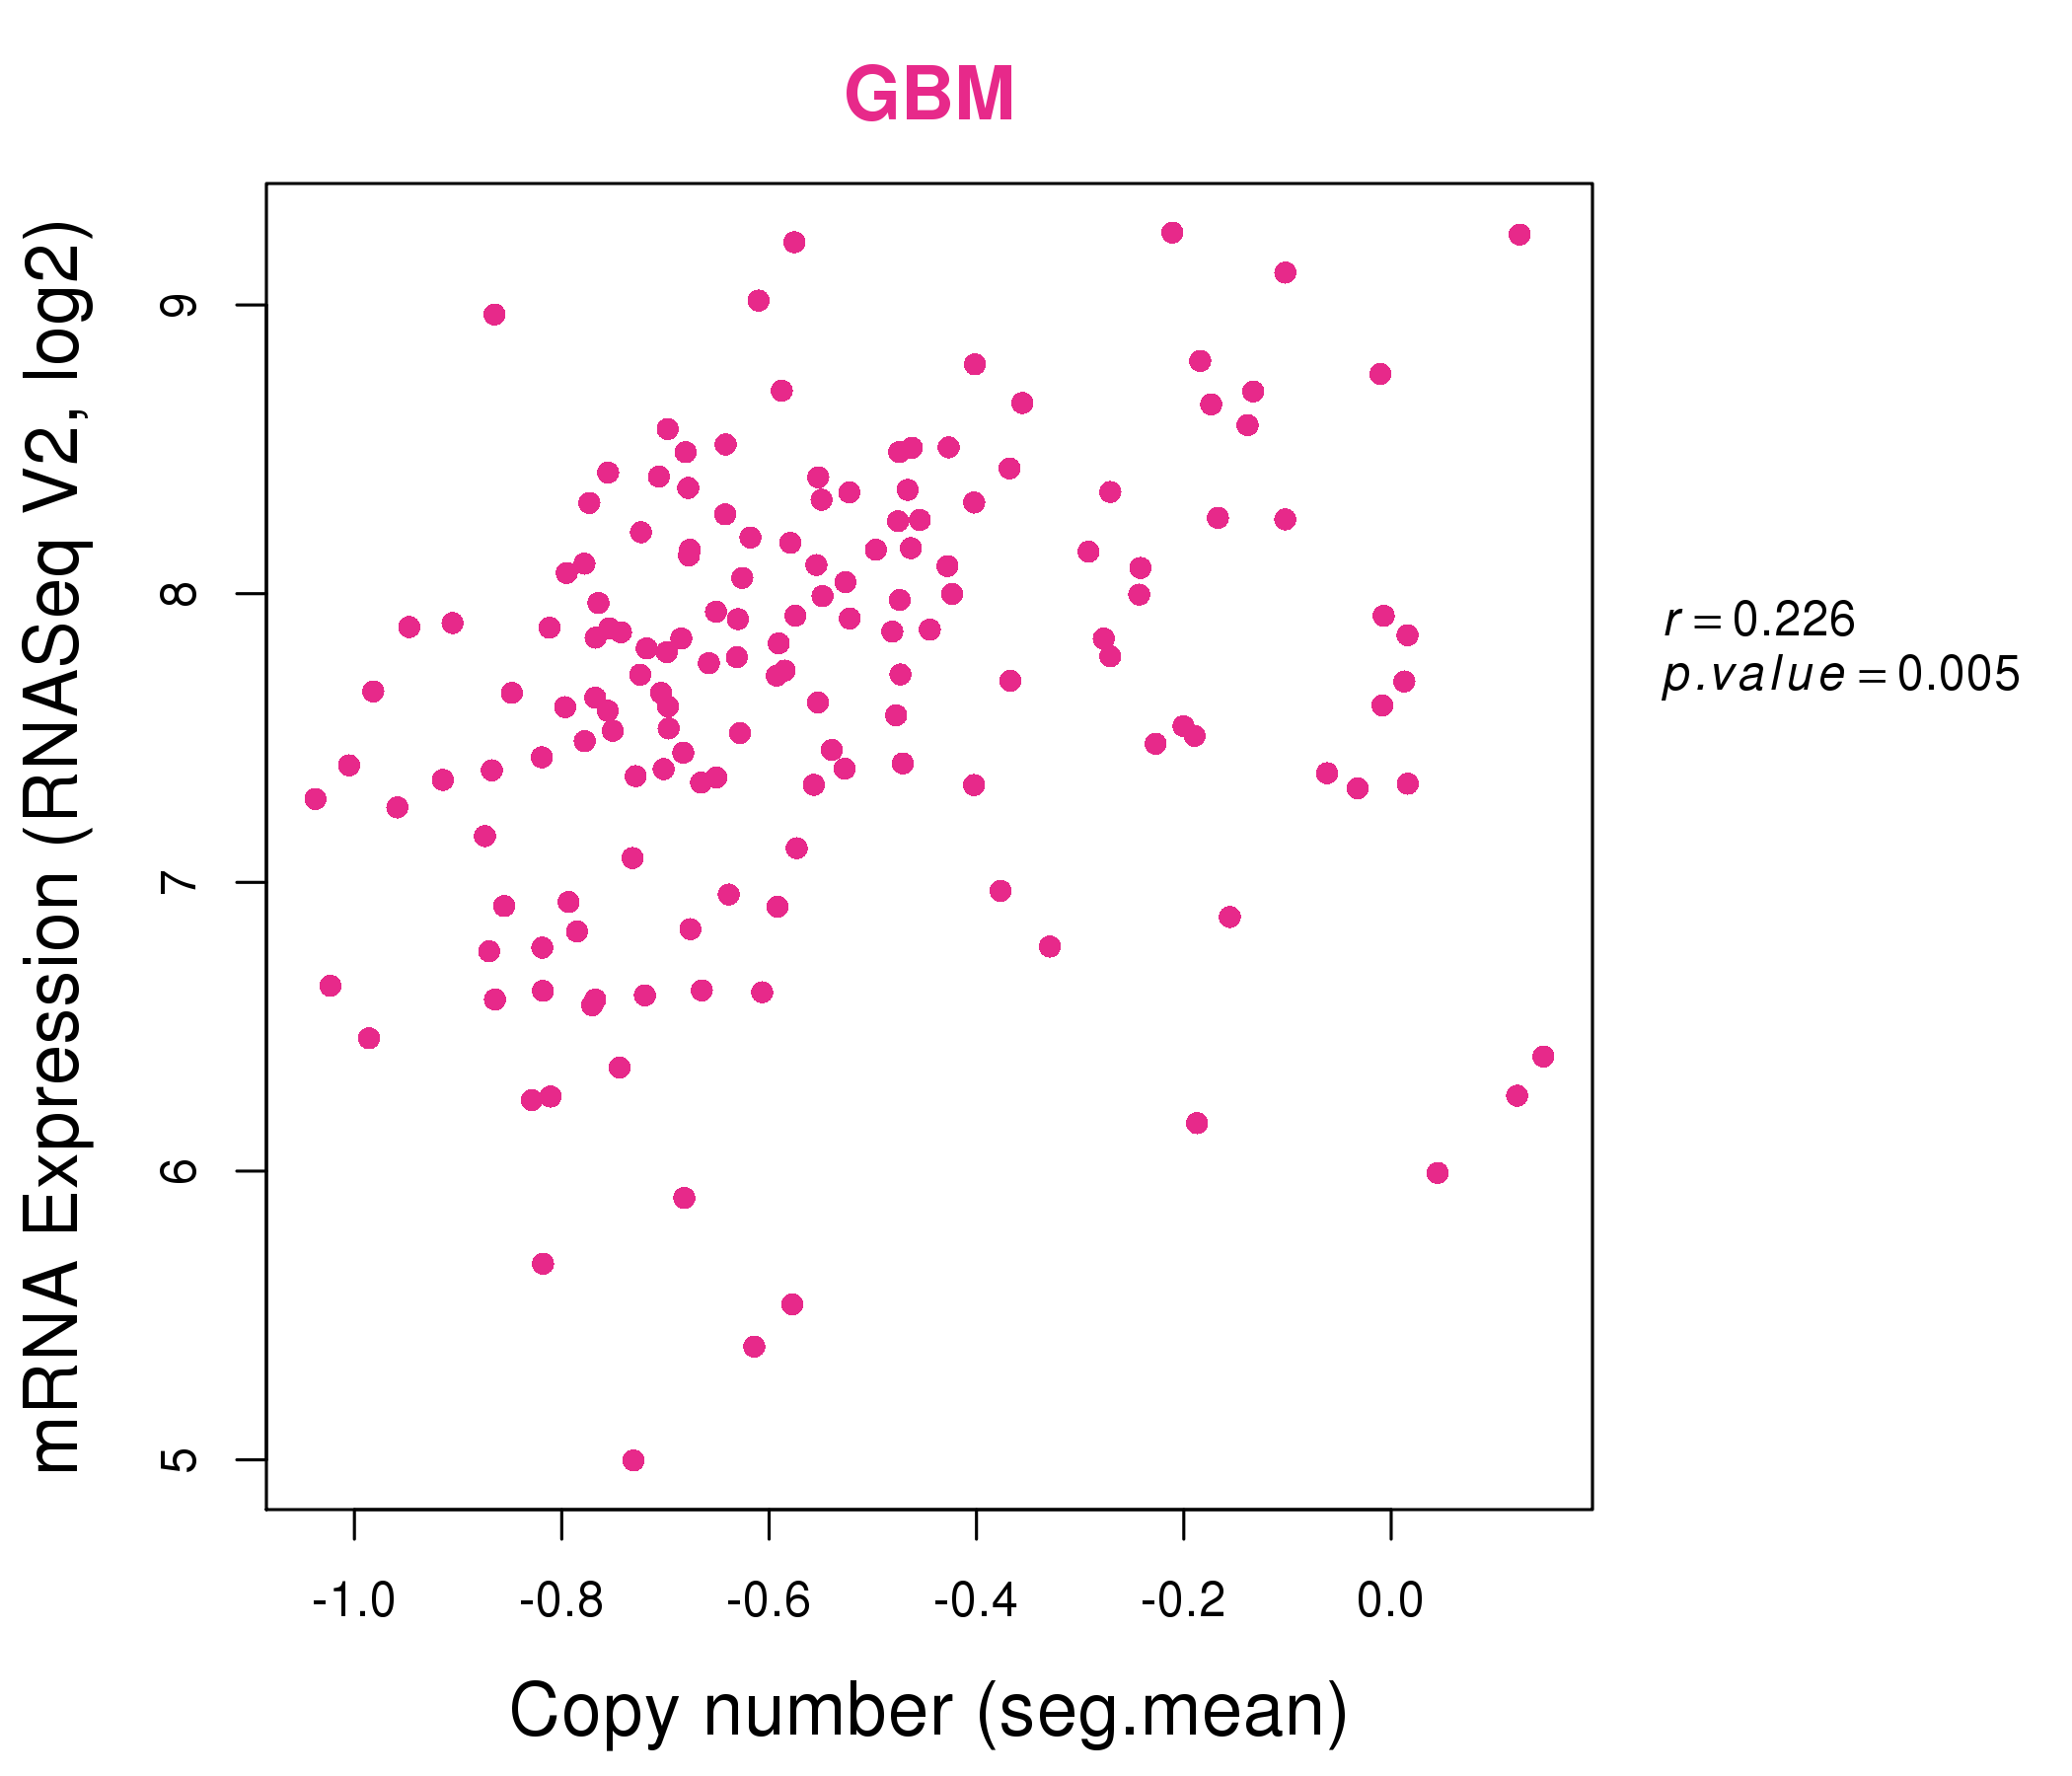
| * Normalized gene expression data of RNASeqV2 was extracted from TCGA using R package TCGA-Assembler. The URLs of all public data files on TCGA DCC data server were gathered at Jan-05-2015. Only eight cancer types have enough normal control samples for differential expression analysis. (t test, adjusted p<0.05 (using Benjamini-Hochberg FDR)) |
 |
| Top |
| * This plots show the correlation between CNV and gene expression. |
: Open all plots for all cancer types
 |
|
 |
|
| Top |
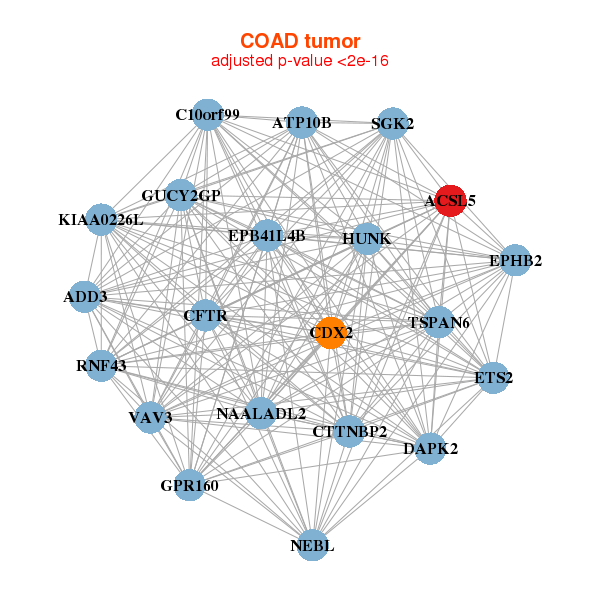
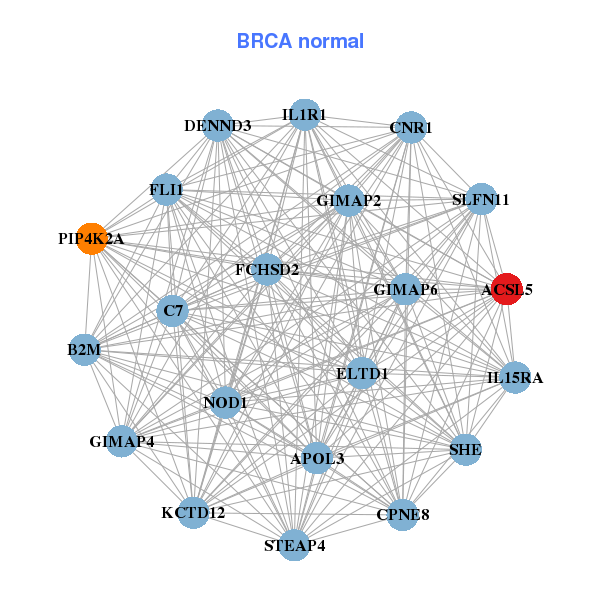
| Gene-Gene Network Information |
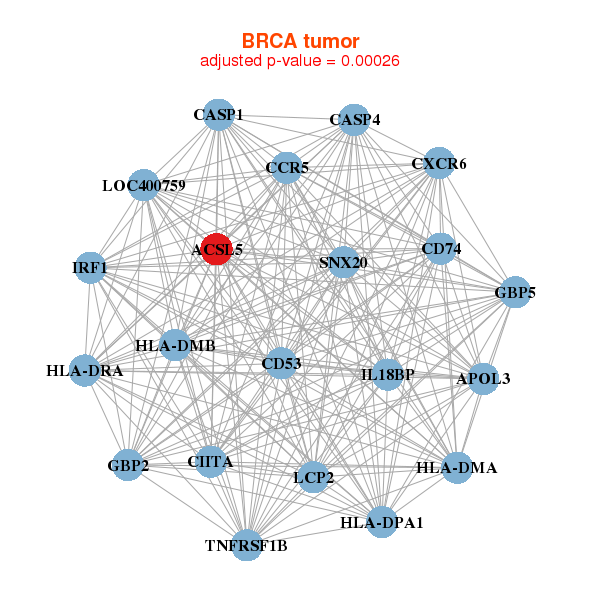
| * Co-Expression network figures were drawn using R package igraph. Only the top 20 genes with the highest correlations were shown. Red circle: input gene, orange circle: cell metabolism gene, sky circle: other gene |
: Open all plots for all cancer types
 |
|
| ACSL5,APOL3,CASP1,CASP4,CCR5,CD53,CD74, CIITA,CXCR6,GBP2,GBP5,HLA-DMA,HLA-DMB,HLA-DPA1, HLA-DRA,IL18BP,IRF1,LCP2,LOC400759,SNX20,TNFRSF1B | ACSL5,APOL3,B2M,C7,CNR1,CPNE8,DENND3, ELTD1,FCHSD2,FLI1,GIMAP2,GIMAP4,GIMAP6,IL15RA, IL1R1,KCTD12,NOD1,PIP4K2A,SHE,SLFN11,STEAP4 |
 |
|
| ACSL5,ADD3,ATP10B,C10orf99,KIAA0226L,CDX2,CFTR, CTTNBP2,DAPK2,EPB41L4B,EPHB2,ETS2,GPR160,GUCY2GP, HUNK,NAALADL2,NEBL,RNF43,SGK2,TSPAN6,VAV3 | ABHD12,ACSL5,ANKS4B,BTNL8,C1orf115,CXADR,DAPK2, DCAF11,GDPD2,HADHA,LASP1,LOC151534,MEP1A,MGAT4A, PBLD,SCIN,SLC9A3R1,SNX24,TMBIM6,TMEM82,USH1C |

| * Co-Expression network figures were drawn using R package igraph. Only the top 20 genes with the highest correlations were shown. Red circle: input gene, orange circle: cell metabolism gene, sky circle: other gene |
: Open all plots for all cancer types
| Top |
: Open all interacting genes' information including KEGG pathway for all interacting genes from DAVID
| Top |
| Pharmacological Information for ACSL5 |
| There's no related Drug. |
| Top |
| Cross referenced IDs for ACSL5 |
| * We obtained these cross-references from Uniprot database. It covers 150 different DBs, 18 categories. http://www.uniprot.org/help/cross_references_section |
: Open all cross reference information
|
Copyright © 2016-Present - The Univsersity of Texas Health Science Center at Houston @ |