|
||||||||||||||||||||||||||||||||||||||||||||||||||||||||||||||||||||||||||||||||||||||||||||||||||||||||||||||||||||||||||||||||||||||||||||||||||||||||||||||||||||||||||||||||||||||||||||||||||||||||||||||||||||||||||||||||||||||||||||||||||||||||||||||||||||||||||||||||||||||||||||||||||||||||||||||||||||||||||
| |
| Phenotypic Information (metabolism pathway, cancer, disease, phenome) |
| |
| |
| Gene-Gene Network Information: Co-Expression Network, Interacting Genes & KEGG |
| |
|


| Gene Summary for PHAX |
| Basic gene info. | Gene symbol | PHAX |
| Gene name | phosphorylated adaptor for RNA export | |
| Synonyms | RNUXA | |
| Cytomap | UCSC genome browser: 5q23.2 | |
| Genomic location | chr5 :125936606-125962944 | |
| Type of gene | protein-coding | |
| RefGenes | NM_032177.3, | |
| Ensembl id | ENSG00000164902 | |
| Description | RNA U small nuclear RNA export adapter proteinRNA U, small nuclear RNA export adapter (phosphorylation regulated)RNA U, small nuclear RNA export adaptor (phosphorylation regulated)phosphorylated adapter RNA export protein | |
| Modification date | 20141207 | |
| dbXrefs | MIM : 604924 | |
| HGNC : HGNC | ||
| Ensembl : ENSG00000164902 | ||
| HPRD : 15122 | ||
| Vega : OTTHUMG00000163273 | ||
| Protein | UniProt: go to UniProt's Cross Reference DB Table | |
| Expression | CleanEX: HS_PHAX | |
| BioGPS: 51808 | ||
| Gene Expression Atlas: ENSG00000164902 | ||
| The Human Protein Atlas: ENSG00000164902 | ||
| Pathway | NCI Pathway Interaction Database: PHAX | |
| KEGG: PHAX | ||
| REACTOME: PHAX | ||
| ConsensusPathDB | ||
| Pathway Commons: PHAX | ||
| Metabolism | MetaCyc: PHAX | |
| HUMANCyc: PHAX | ||
| Regulation | Ensembl's Regulation: ENSG00000164902 | |
| miRBase: chr5 :125,936,606-125,962,944 | ||
| TargetScan: NM_032177 | ||
| cisRED: ENSG00000164902 | ||
| Context | iHOP: PHAX | |
| cancer metabolism search in PubMed: PHAX | ||
| UCL Cancer Institute: PHAX | ||
| Assigned class in ccmGDB | C | |
| Top |
| Phenotypic Information for PHAX(metabolism pathway, cancer, disease, phenome) |
| Cancer | CGAP: PHAX |
| Familial Cancer Database: PHAX | |
| * This gene is included in those cancer gene databases. |
|
|
|
|
|
| . | ||||||||||||||||||||||||||||||||||||||||||||||||||||||||||||||||||||||||||||||||||||||||||||||||||||||||||||||||||||||||||||||||||||||||||||||||||||||||||||||||||||||||||||||||||||||||||||||||||||||||||||||||||||||||||||||||||||||||||||||||||||||||||||||||||||||||||||||||||||||||||||||||||||||||||||||||||||
Oncogene 1 | Significant driver gene in | |||||||||||||||||||||||||||||||||||||||||||||||||||||||||||||||||||||||||||||||||||||||||||||||||||||||||||||||||||||||||||||||||||||||||||||||||||||||||||||||||||||||||||||||||||||||||||||||||||||||||||||||||||||||||||||||||||||||||||||||||||||||||||||||||||||||||||||||||||||||||||||||||||||||||||||||||||||||||
| cf) number; DB name 1 Oncogene; http://nar.oxfordjournals.org/content/35/suppl_1/D721.long, 2 Tumor Suppressor gene; https://bioinfo.uth.edu/TSGene/, 3 Cancer Gene Census; http://www.nature.com/nrc/journal/v4/n3/abs/nrc1299.html, 4 CancerGenes; http://nar.oxfordjournals.org/content/35/suppl_1/D721.long, 5 Network of Cancer Gene; http://ncg.kcl.ac.uk/index.php, 1Therapeutic Vulnerabilities in Cancer; http://cbio.mskcc.org/cancergenomics/statius/ |
| REACTOME_METABOLISM_OF_NON_CODING_RNA REACTOME_METABOLISM_OF_RNA | |
| OMIM | |
| Orphanet | |
| Disease | KEGG Disease: PHAX |
| MedGen: PHAX (Human Medical Genetics with Condition) | |
| ClinVar: PHAX | |
| Phenotype | MGI: PHAX (International Mouse Phenotyping Consortium) |
| PhenomicDB: PHAX | |
| Mutations for PHAX |
| * Under tables are showing count per each tissue to give us broad intuition about tissue specific mutation patterns.You can go to the detailed page for each mutation database's web site. |
| - Statistics for Tissue and Mutation type | Top |
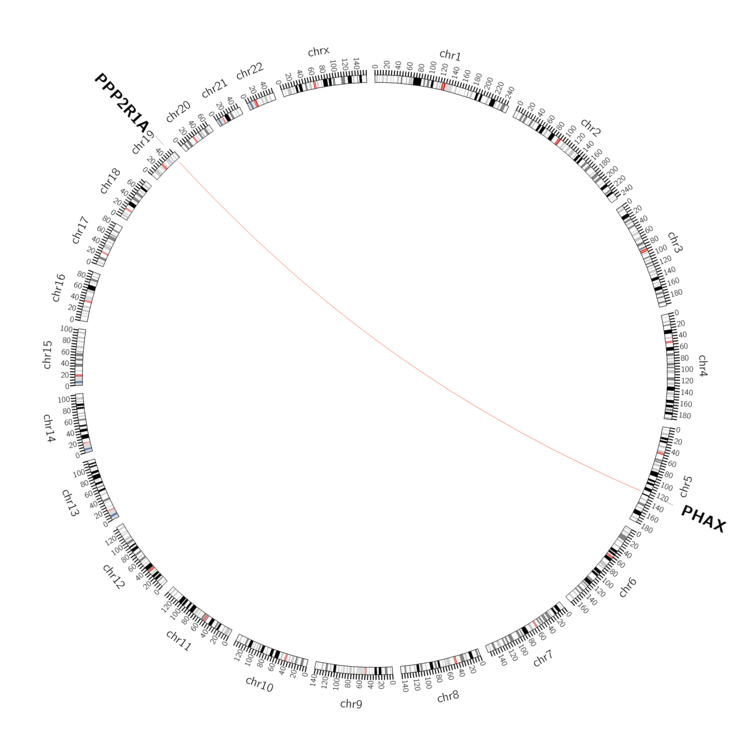 |
| - For Inter-chromosomal Variations |
| There's no inter-chromosomal structural variation. |
| - For Intra-chromosomal Variations |
| There's no intra-chromosomal structural variation. |
| Sample | Symbol_a | Chr_a | Start_a | End_a | Symbol_b | Chr_b | Start_b | End_b |
| prostate | PHAX | chr5 | 125938600 | 125940600 | PPP2R1A | chr19 | 52704860 | 52706860 |
| cf) Tissue number; Tissue name (1;Breast, 2;Central_nervous_system, 3;Haematopoietic_and_lymphoid_tissue, 4;Large_intestine, 5;Liver, 6;Lung, 7;Ovary, 8;Pancreas, 9;Prostate, 10;Skin, 11;Soft_tissue, 12;Upper_aerodigestive_tract) |
| * From mRNA Sanger sequences, Chitars2.0 arranged chimeric transcripts. This table shows PHAX related fusion information. |
| ID | Head Gene | Tail Gene | Accession | Gene_a | qStart_a | qEnd_a | Chromosome_a | tStart_a | tEnd_a | Gene_a | qStart_a | qEnd_a | Chromosome_a | tStart_a | tEnd_a |
| AI808197 | PHAX | 1 | 285 | 5 | 125961633 | 125961916 | PHAX | 283 | 507 | 5 | 125961944 | 125962168 | |
| AI766928 | FAM63B | 10 | 204 | 15 | 59117088 | 59117282 | PHAX | 204 | 370 | 5 | 125960833 | 125960999 | |
| Top |
| Mutation type/ Tissue ID | brca | cns | cerv | endome | haematopo | kidn | Lintest | liver | lung | ns | ovary | pancre | prost | skin | stoma | thyro | urina | |||
| Total # sample | 1 | |||||||||||||||||||
| GAIN (# sample) | ||||||||||||||||||||
| LOSS (# sample) | 1 |
| cf) Tissue ID; Tissue type (1; Breast, 2; Central_nervous_system, 3; Cervix, 4; Endometrium, 5; Haematopoietic_and_lymphoid_tissue, 6; Kidney, 7; Large_intestine, 8; Liver, 9; Lung, 10; NS, 11; Ovary, 12; Pancreas, 13; Prostate, 14; Skin, 15; Stomach, 16; Thyroid, 17; Urinary_tract) |
| Top |
|
 |
| Top |
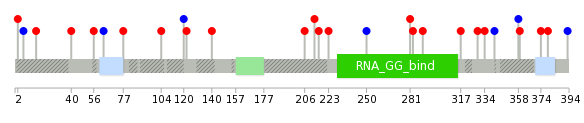
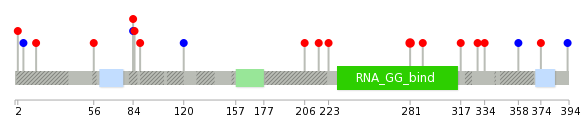
| Stat. for Non-Synonymous SNVs (# total SNVs=17) | (# total SNVs=5) |
 |  |
(# total SNVs=2) | (# total SNVs=0) |
 |
| Top |
| * When you move the cursor on each content, you can see more deailed mutation information on the Tooltip. Those are primary_site,primary_histology,mutation(aa),pubmedID. |
| GRCh37 position | Mutation(aa) | Unique sampleID count |
| chr5:125939712-125939712 | p.M185fs*23 | 2 |
| chr5:125939804-125939804 | p.M213I | 1 |
| chr5:125960425-125960425 | p.T358T | 1 |
| chr5:125939331-125939331 | p.H56Y | 1 |
| chr5:125939811-125939811 | p.K216Q | 1 |
| chr5:125960427-125960427 | p.N359S | 1 |
| chr5:125939354-125939354 | p.V63V | 1 |
| chr5:125939833-125939833 | p.A223V | 1 |
| chr5:125960471-125960471 | p.E374K | 1 |
| chr5:125939395-125939395 | p.S77N | 1 |
| Top |
|
 |
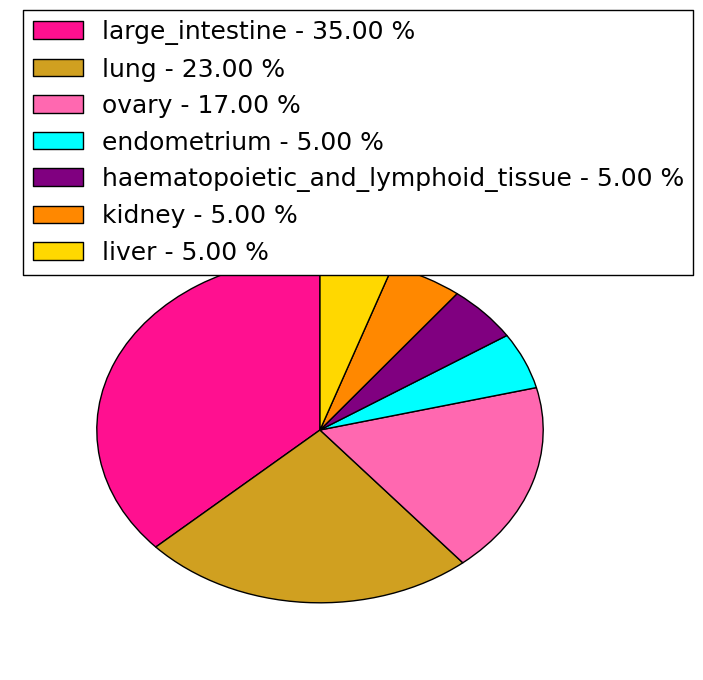
| Point Mutation/ Tissue ID | 1 | 2 | 3 | 4 | 5 | 6 | 7 | 8 | 9 | 10 | 11 | 12 | 13 | 14 | 15 | 16 | 17 | 18 | 19 | 20 |
| # sample | 7 | 1 | 1 | 2 | 1 | 1 | 4 | 1 | ||||||||||||
| # mutation | 8 | 1 | 1 | 2 | 1 | 1 | 4 | 1 | ||||||||||||
| nonsynonymous SNV | 5 | 1 | 1 | 2 | 1 | 1 | 2 | 1 | ||||||||||||
| synonymous SNV | 3 | 2 |
| cf) Tissue ID; Tissue type (1; BLCA[Bladder Urothelial Carcinoma], 2; BRCA[Breast invasive carcinoma], 3; CESC[Cervical squamous cell carcinoma and endocervical adenocarcinoma], 4; COAD[Colon adenocarcinoma], 5; GBM[Glioblastoma multiforme], 6; Glioma Low Grade, 7; HNSC[Head and Neck squamous cell carcinoma], 8; KICH[Kidney Chromophobe], 9; KIRC[Kidney renal clear cell carcinoma], 10; KIRP[Kidney renal papillary cell carcinoma], 11; LAML[Acute Myeloid Leukemia], 12; LUAD[Lung adenocarcinoma], 13; LUSC[Lung squamous cell carcinoma], 14; OV[Ovarian serous cystadenocarcinoma ], 15; PAAD[Pancreatic adenocarcinoma], 16; PRAD[Prostate adenocarcinoma], 17; SKCM[Skin Cutaneous Melanoma], 18:STAD[Stomach adenocarcinoma], 19:THCA[Thyroid carcinoma], 20:UCEC[Uterine Corpus Endometrial Carcinoma]) |
| Top |
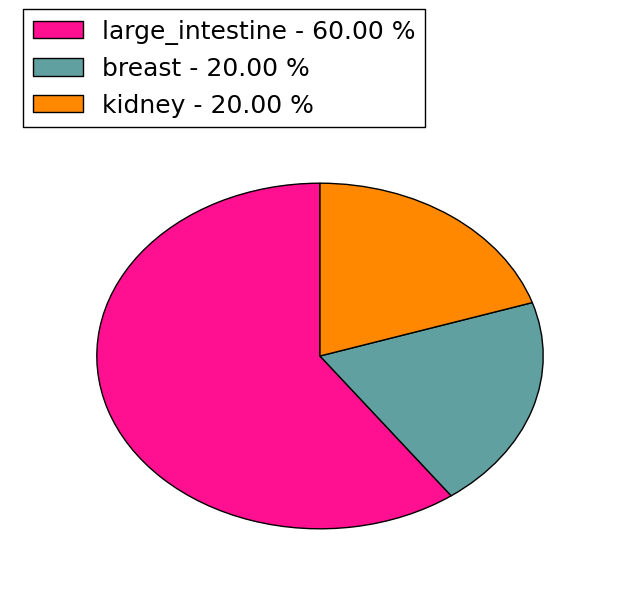
| * We represented just top 10 SNVs. When you move the cursor on each content, you can see more deailed mutation information on the Tooltip. Those are primary_site, primary_histology, mutation(aa), pubmedID. |
| Genomic Position | Mutation(aa) | Unique sampleID count |
| chr5:125952952 | p.R281Q | 2 |
| chr5:125960302 | p.A2V | 1 |
| chr5:125939416 | p.M334I | 1 |
| chr5:125960337 | p.G6G | 1 |
| chr5:125939417 | p.T358T | 1 |
| chr5:125960353 | p.D15Y | 1 |
| chr5:125939420 | p.E374K | 1 |
| chr5:125960425 | p.H56Y | 1 |
| chr5:125939431 | p.I393I | 1 |
| chr5:125960471 | p.R84P | 1 |
| * Copy number data were extracted from TCGA using R package TCGA-Assembler. The URLs of all public data files on TCGA DCC data server were gathered on Jan-05-2015. Function ProcessCNAData in TCGA-Assembler package was used to obtain gene-level copy number value which is calculated as the average copy number of the genomic region of a gene. |
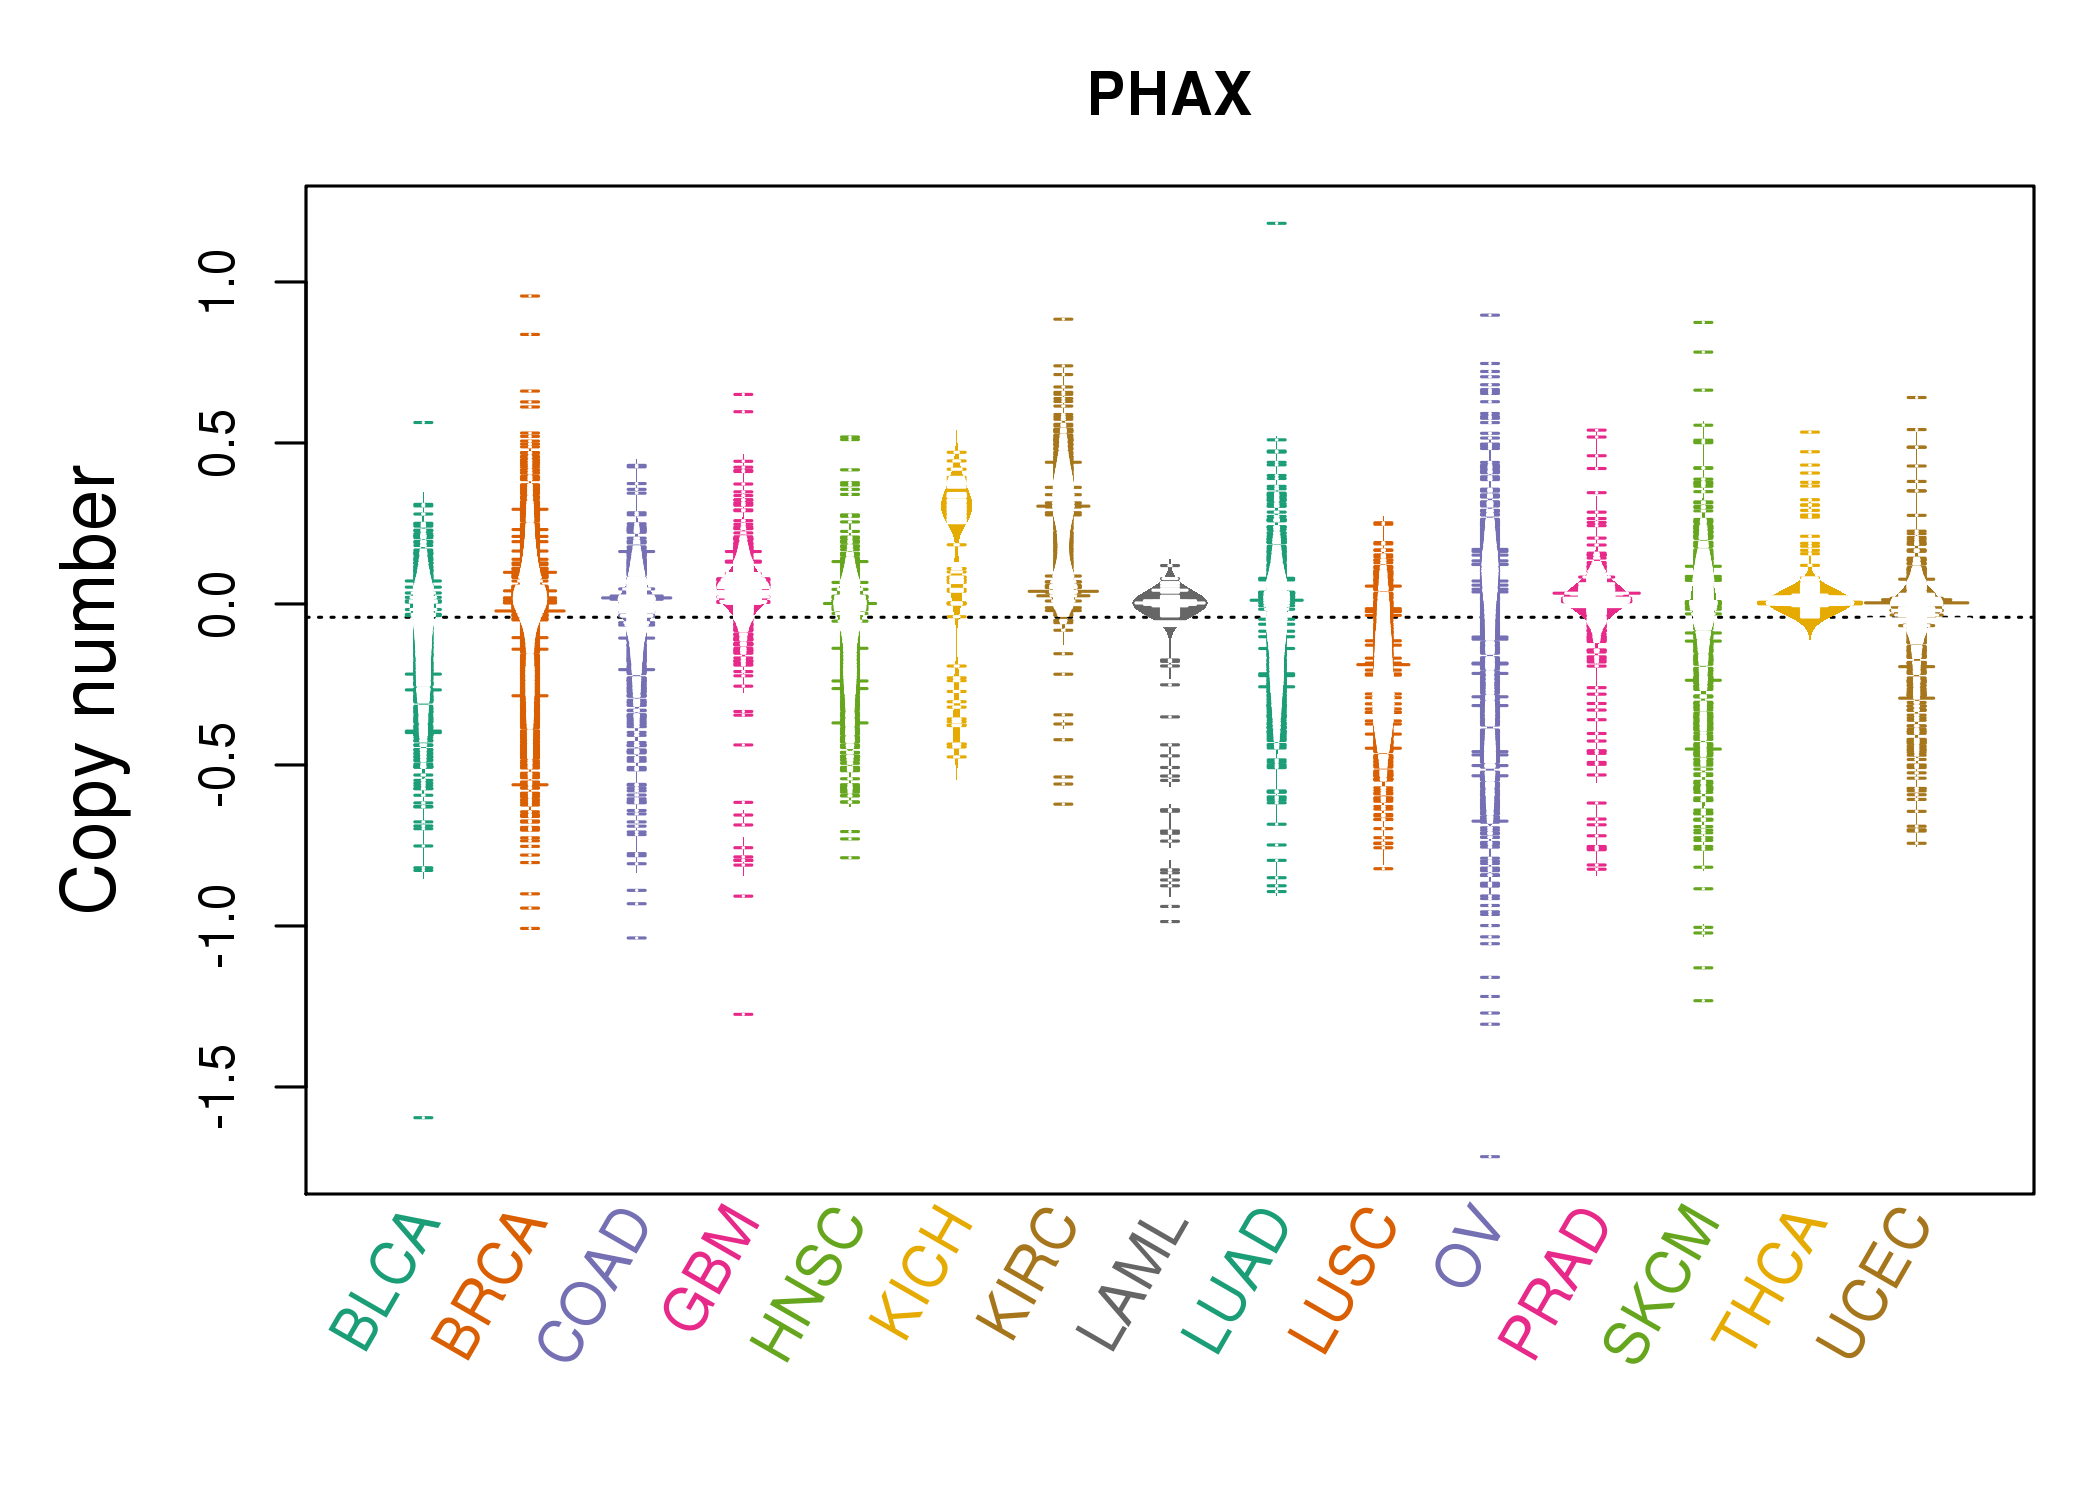 |
| cf) Tissue ID[Tissue type]: BLCA[Bladder Urothelial Carcinoma], BRCA[Breast invasive carcinoma], CESC[Cervical squamous cell carcinoma and endocervical adenocarcinoma], COAD[Colon adenocarcinoma], GBM[Glioblastoma multiforme], Glioma Low Grade, HNSC[Head and Neck squamous cell carcinoma], KICH[Kidney Chromophobe], KIRC[Kidney renal clear cell carcinoma], KIRP[Kidney renal papillary cell carcinoma], LAML[Acute Myeloid Leukemia], LUAD[Lung adenocarcinoma], LUSC[Lung squamous cell carcinoma], OV[Ovarian serous cystadenocarcinoma ], PAAD[Pancreatic adenocarcinoma], PRAD[Prostate adenocarcinoma], SKCM[Skin Cutaneous Melanoma], STAD[Stomach adenocarcinoma], THCA[Thyroid carcinoma], UCEC[Uterine Corpus Endometrial Carcinoma] |
| Top |
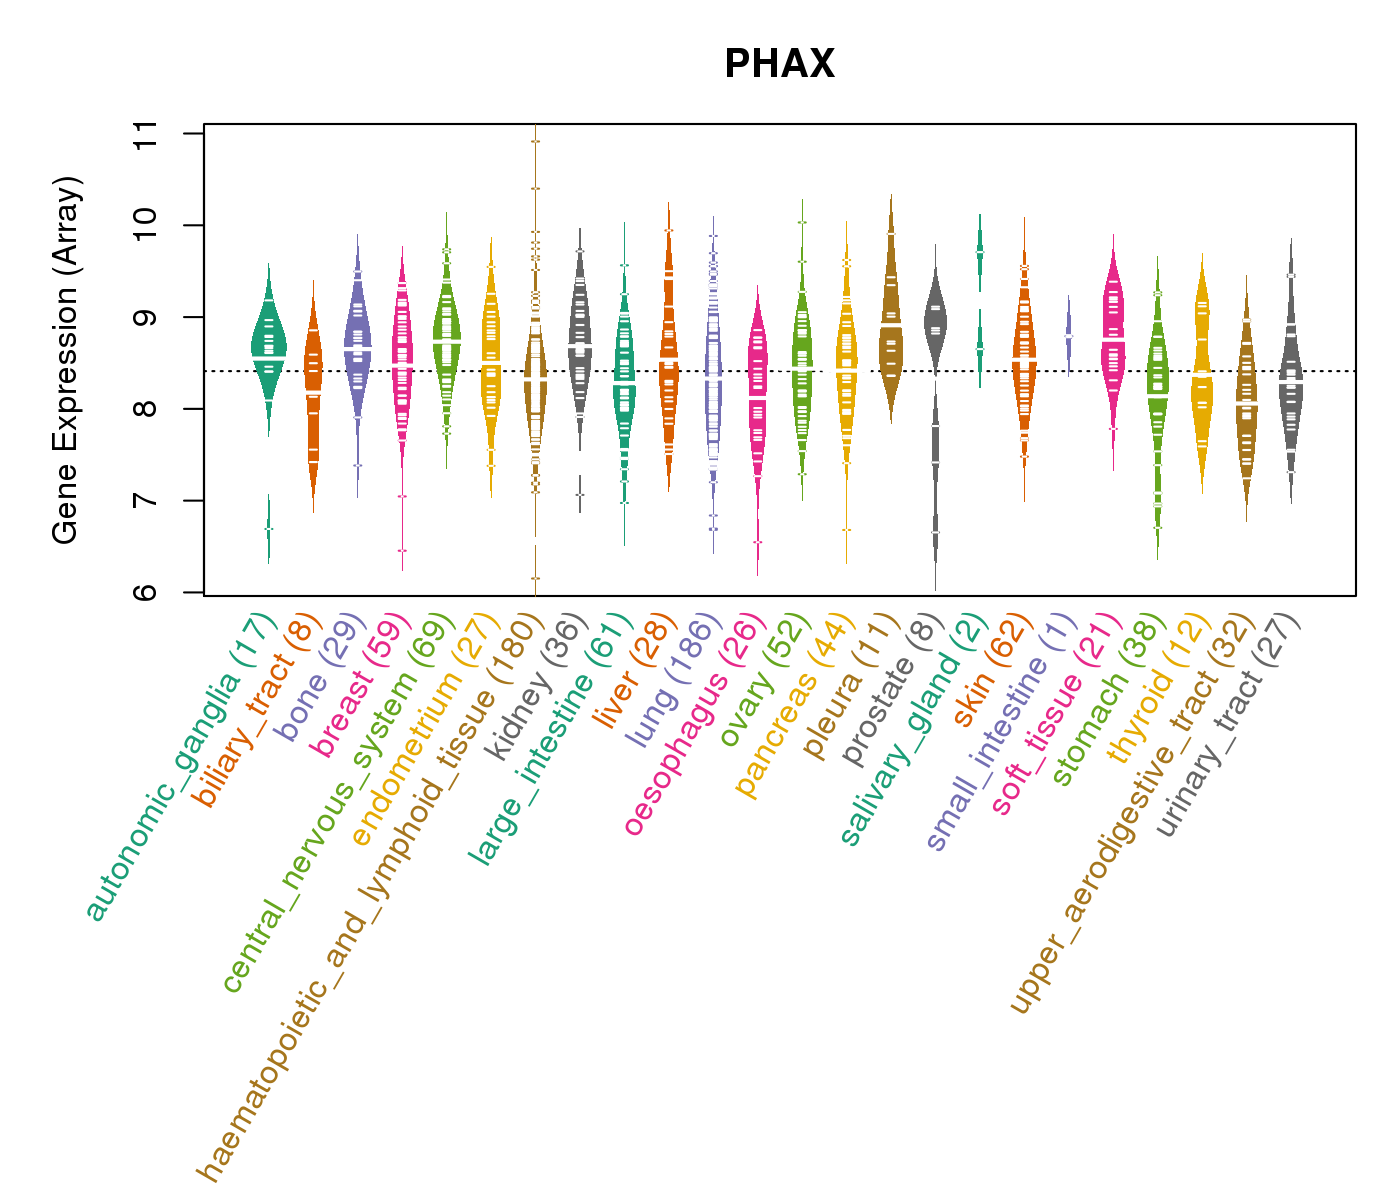
| Gene Expression for PHAX |
| * CCLE gene expression data were extracted from CCLE_Expression_Entrez_2012-10-18.res: Gene-centric RMA-normalized mRNA expression data. |
 |
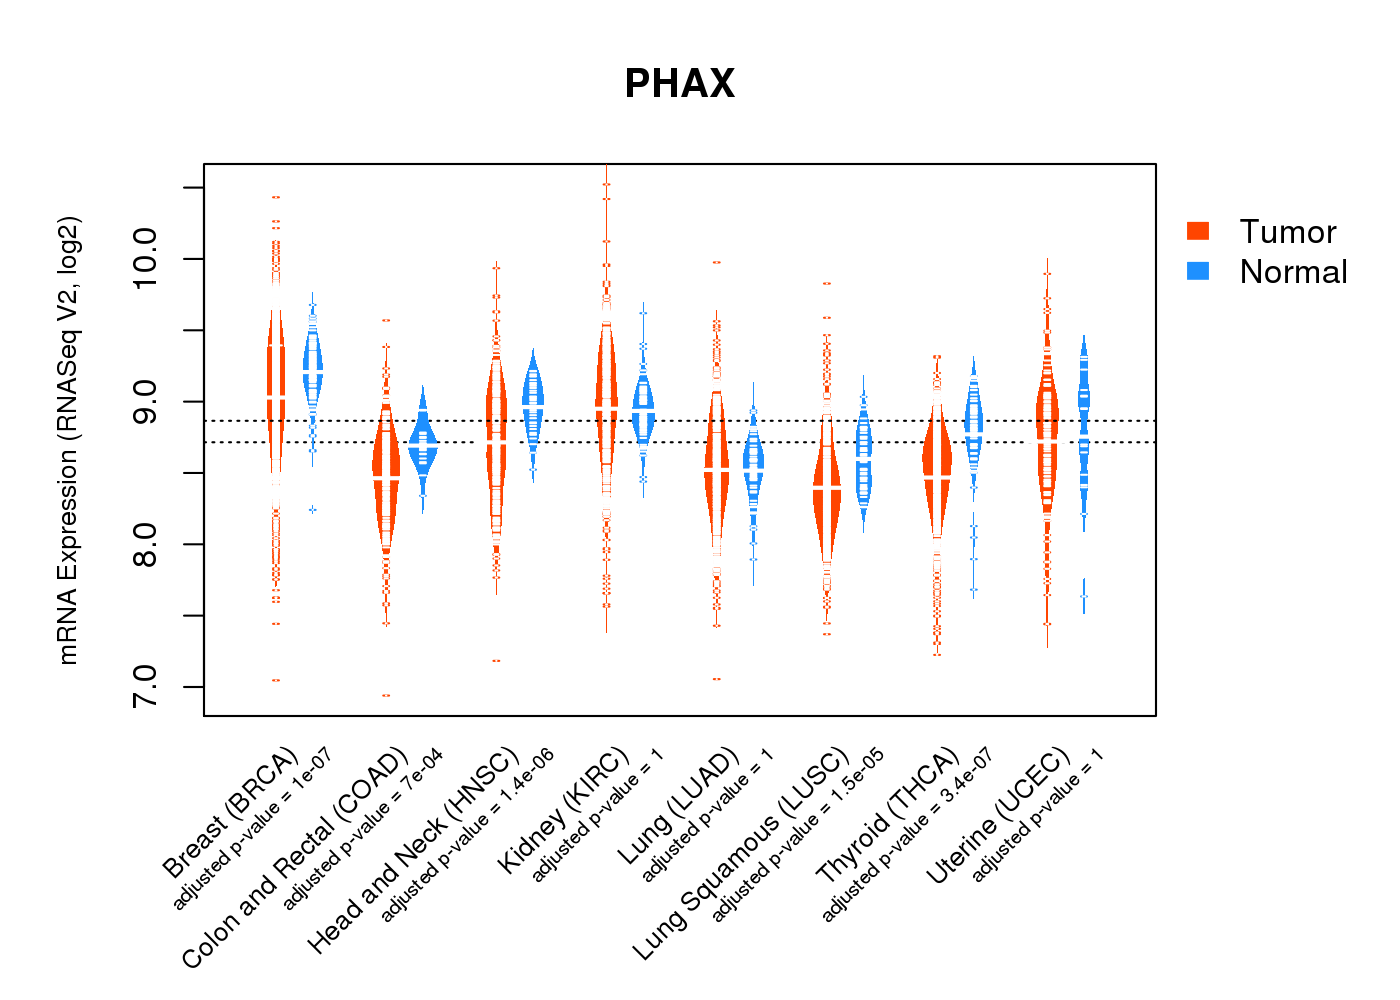
| * Normalized gene expression data of RNASeqV2 was extracted from TCGA using R package TCGA-Assembler. The URLs of all public data files on TCGA DCC data server were gathered at Jan-05-2015. Only eight cancer types have enough normal control samples for differential expression analysis. (t test, adjusted p<0.05 (using Benjamini-Hochberg FDR)) |
 |
| Top |
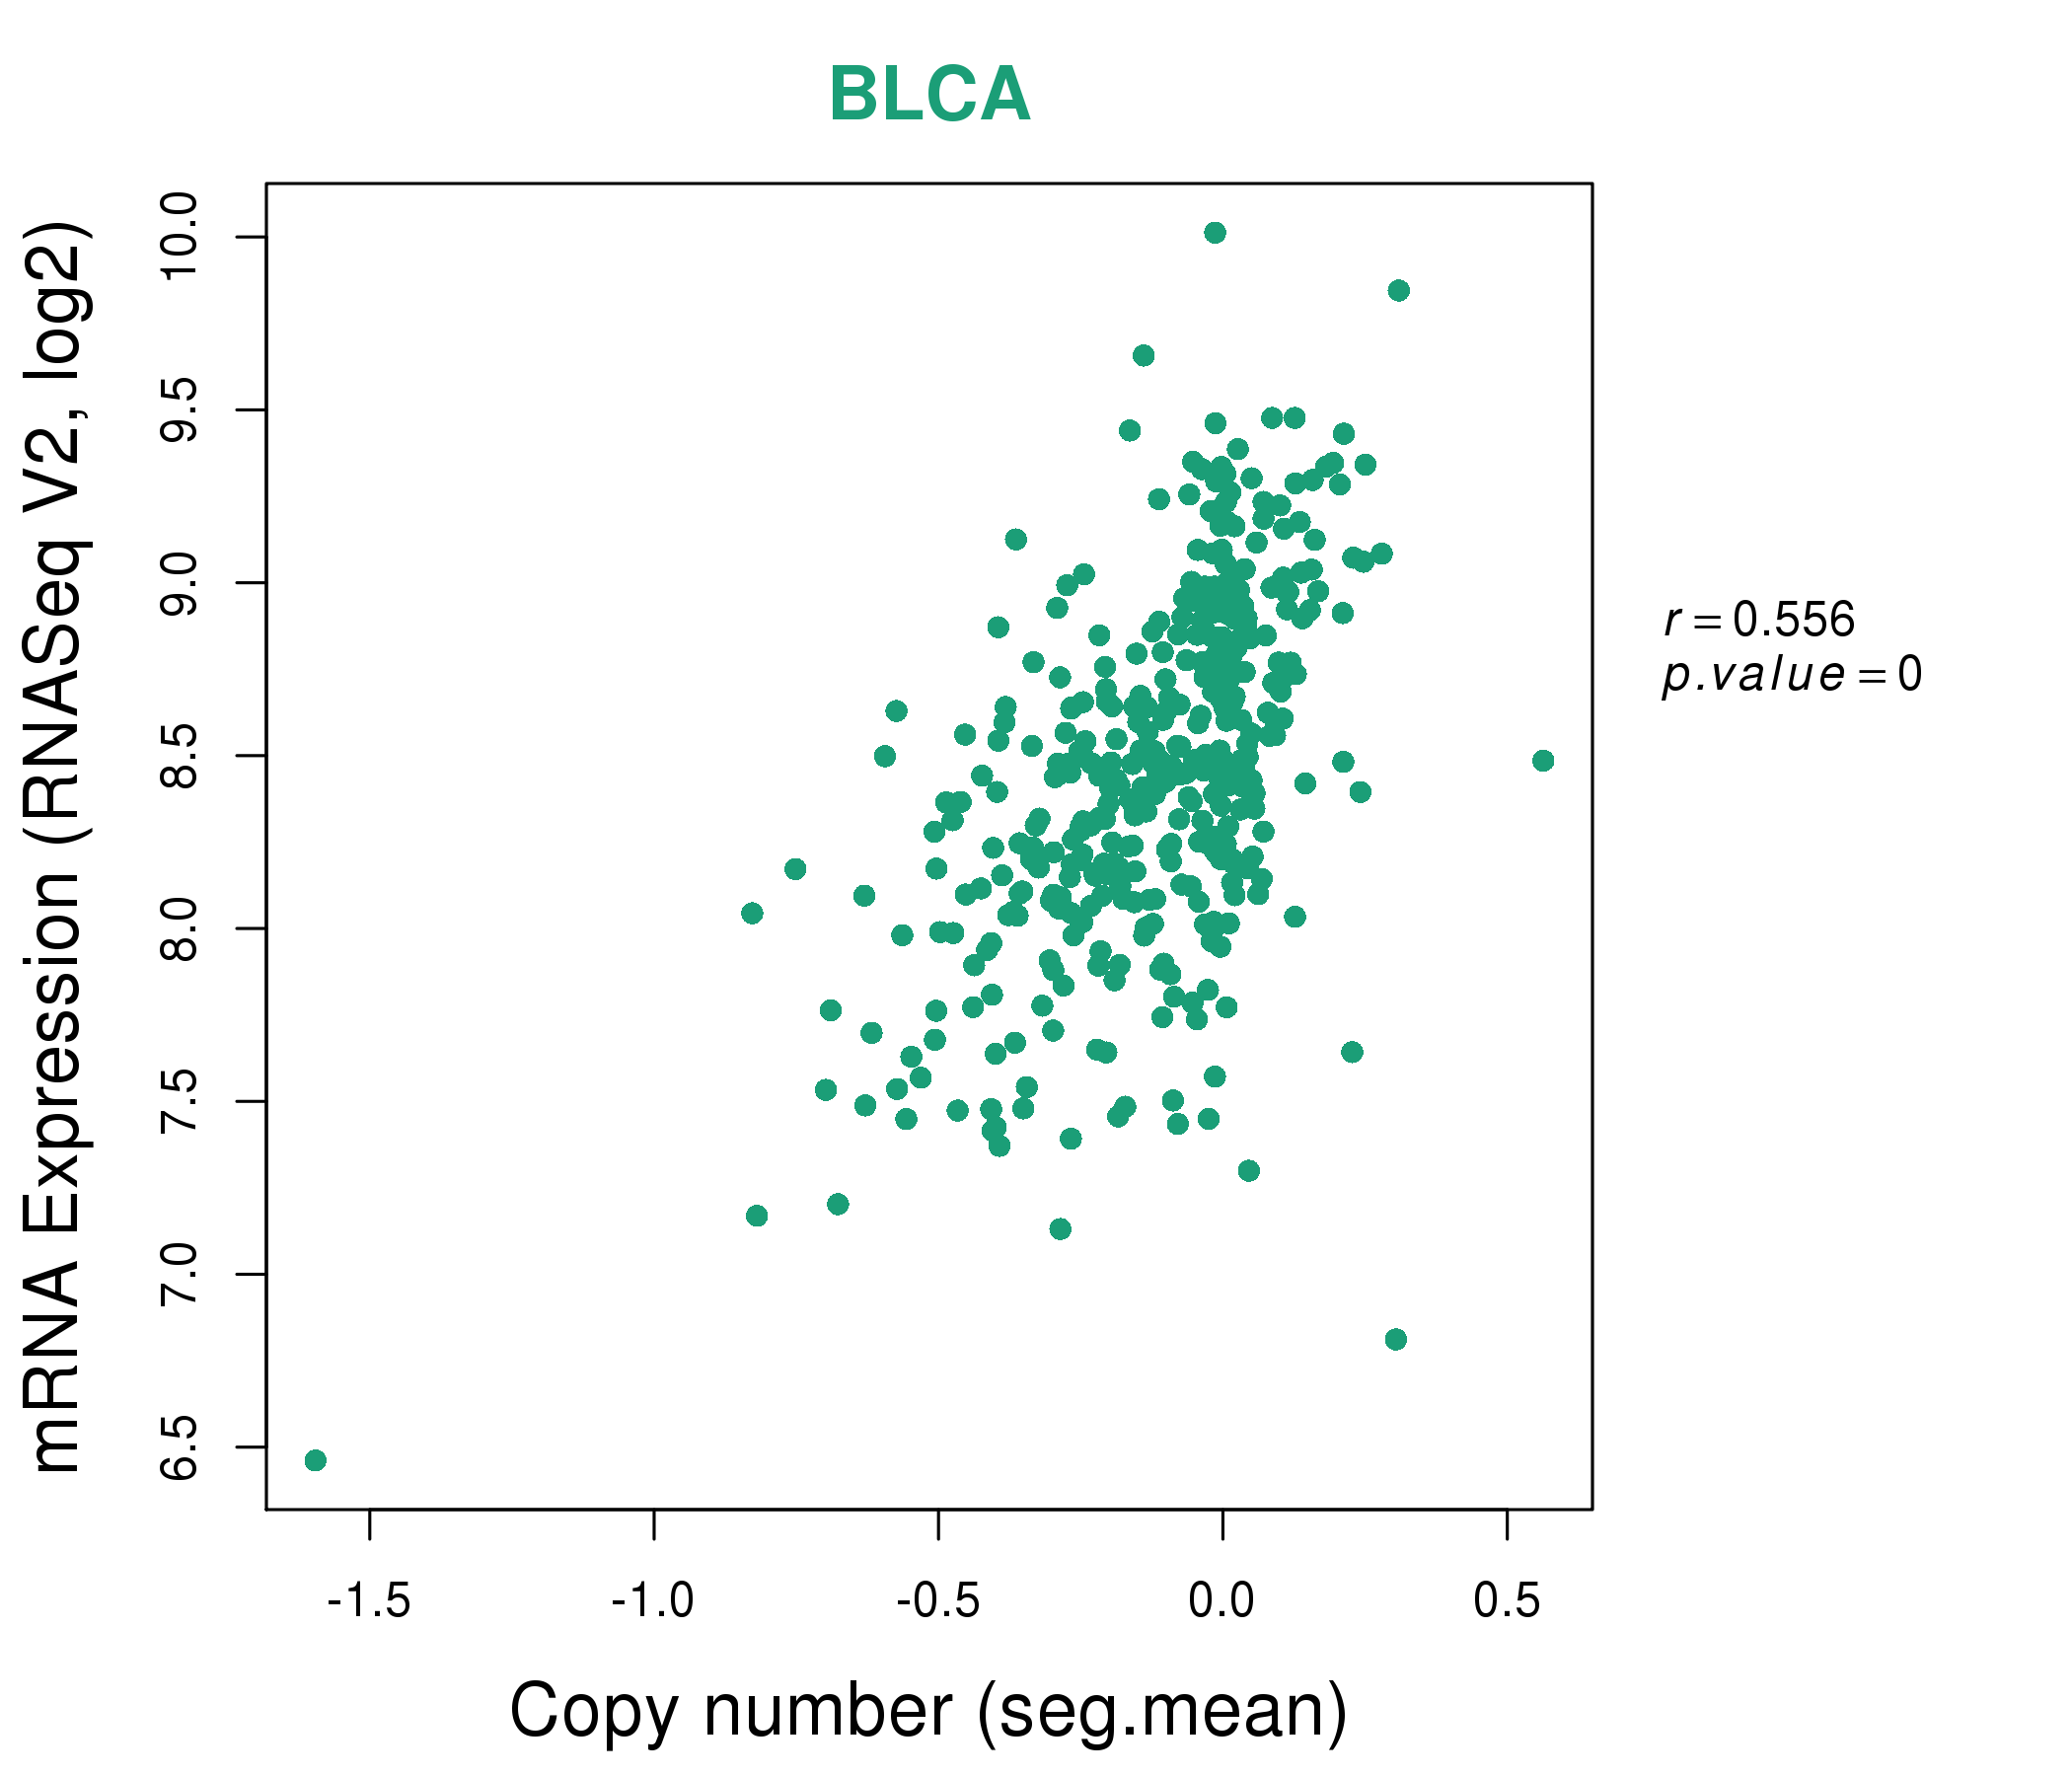
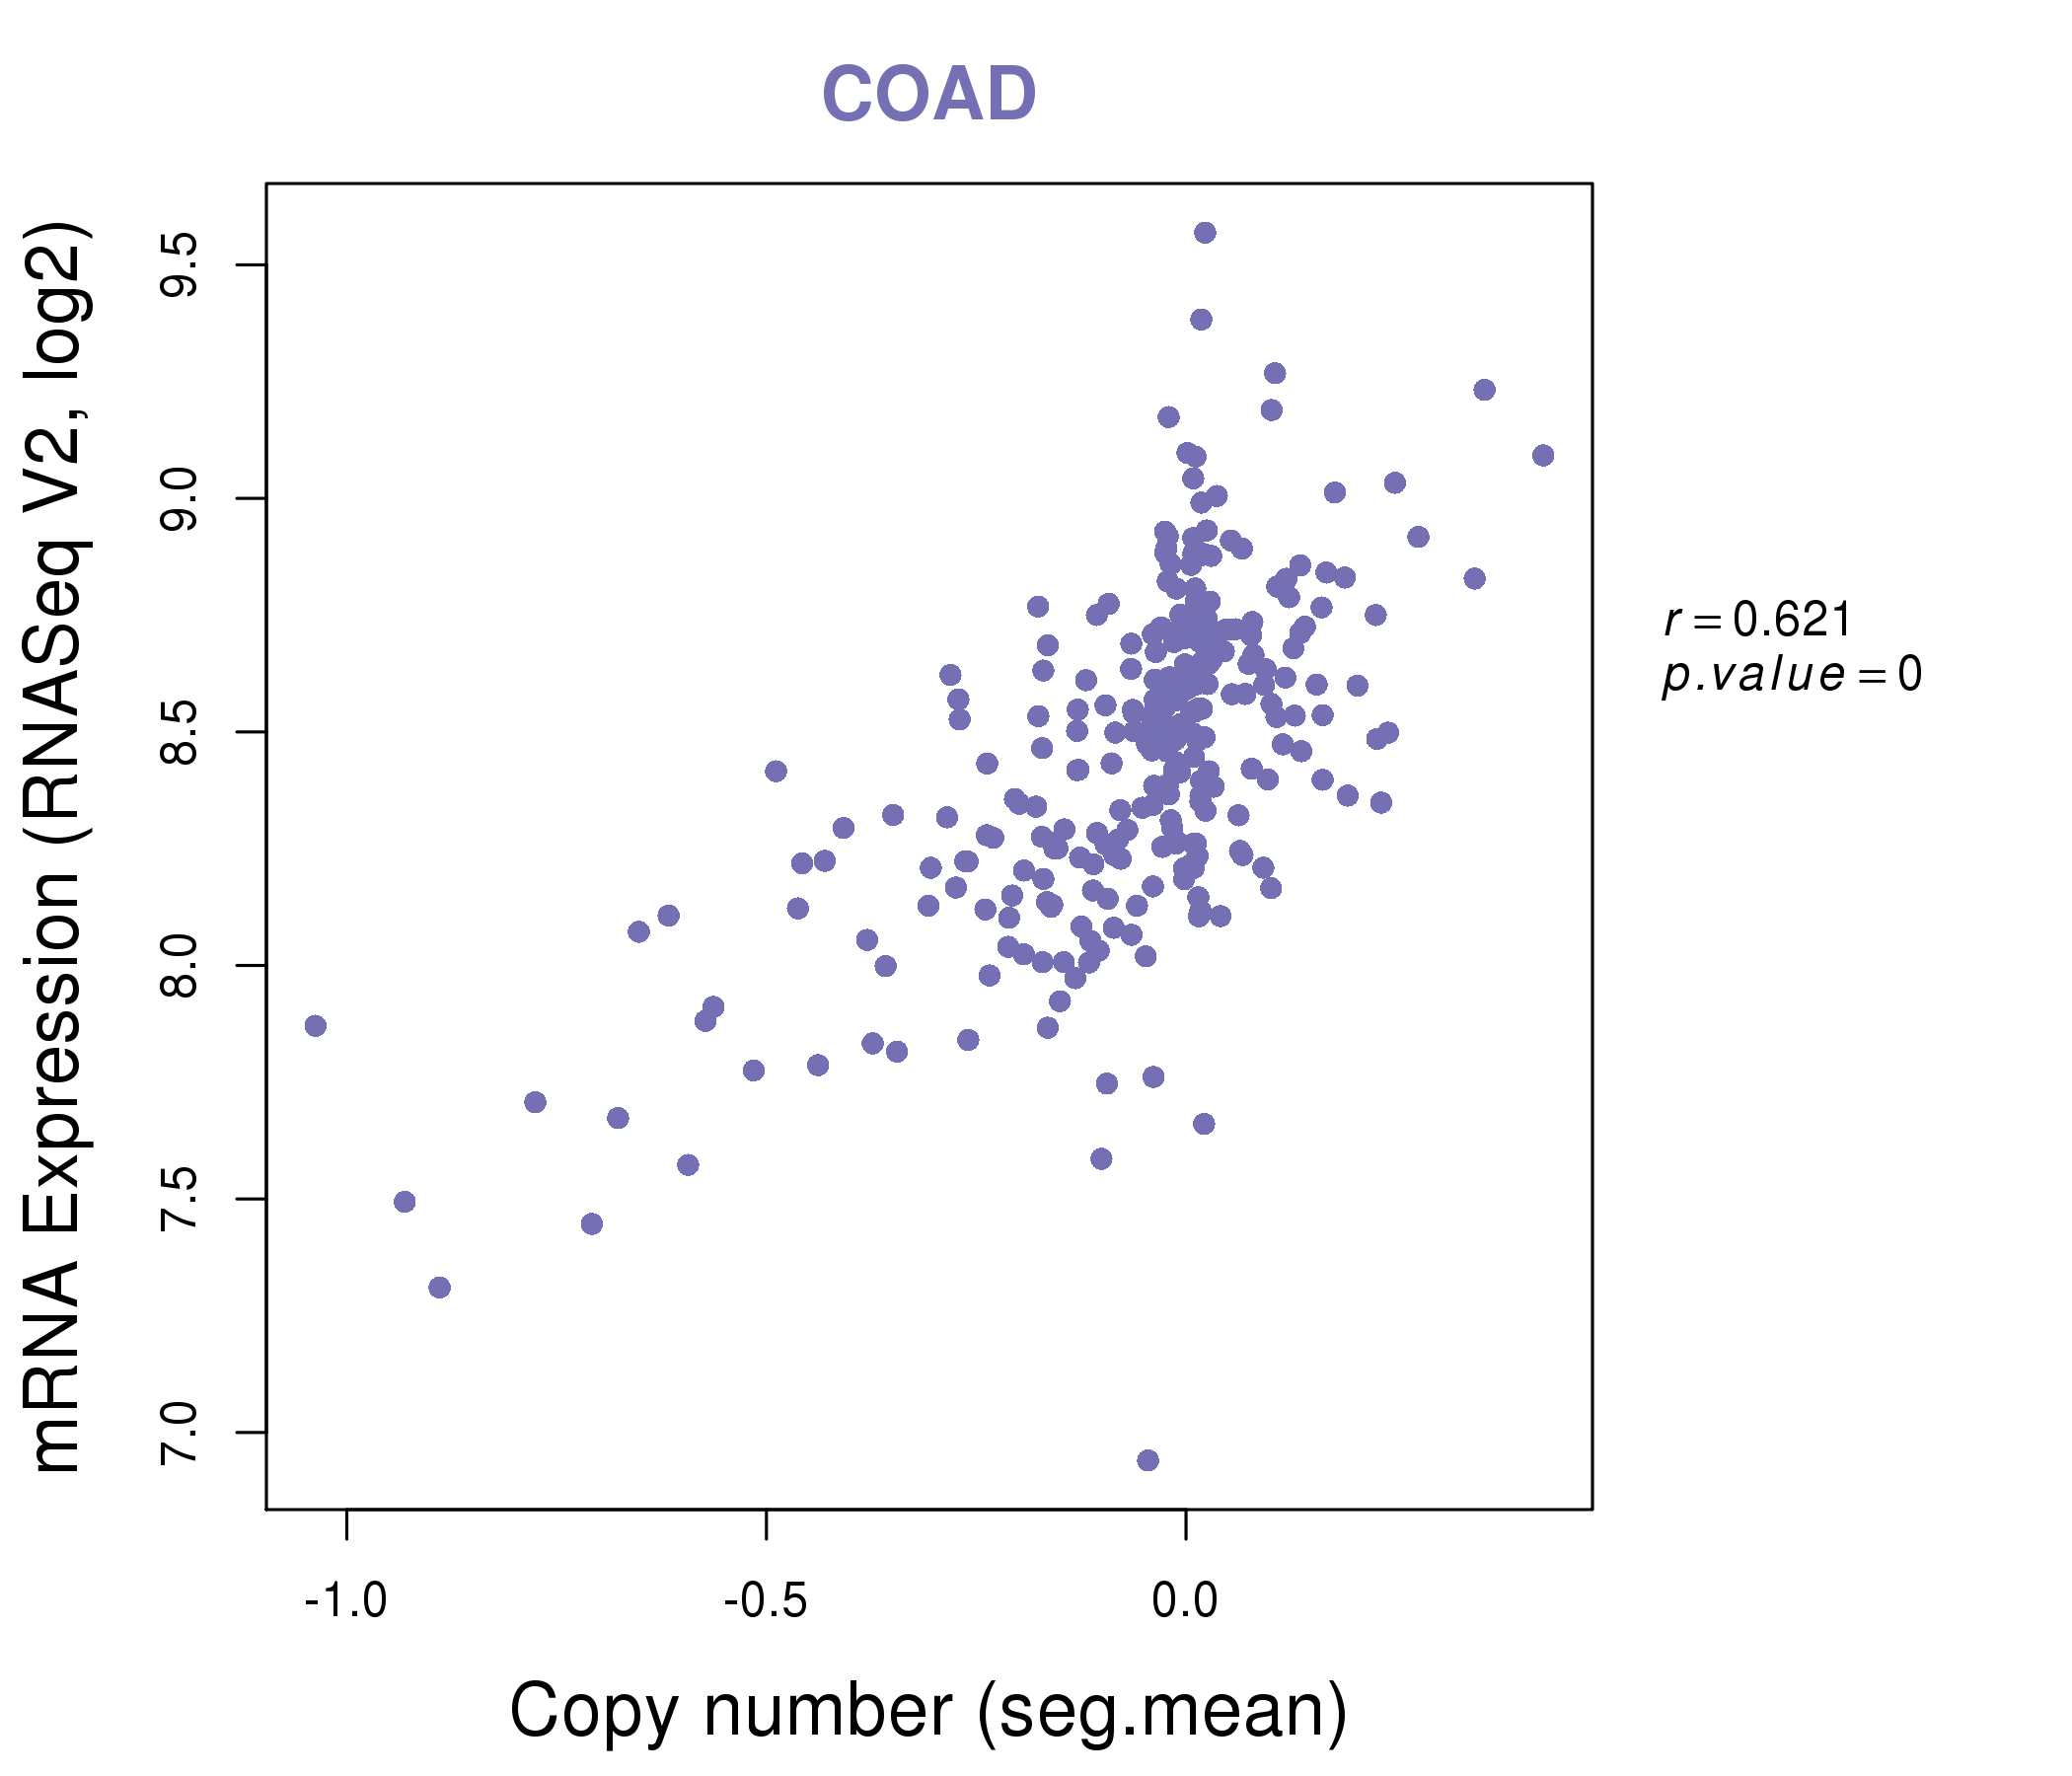
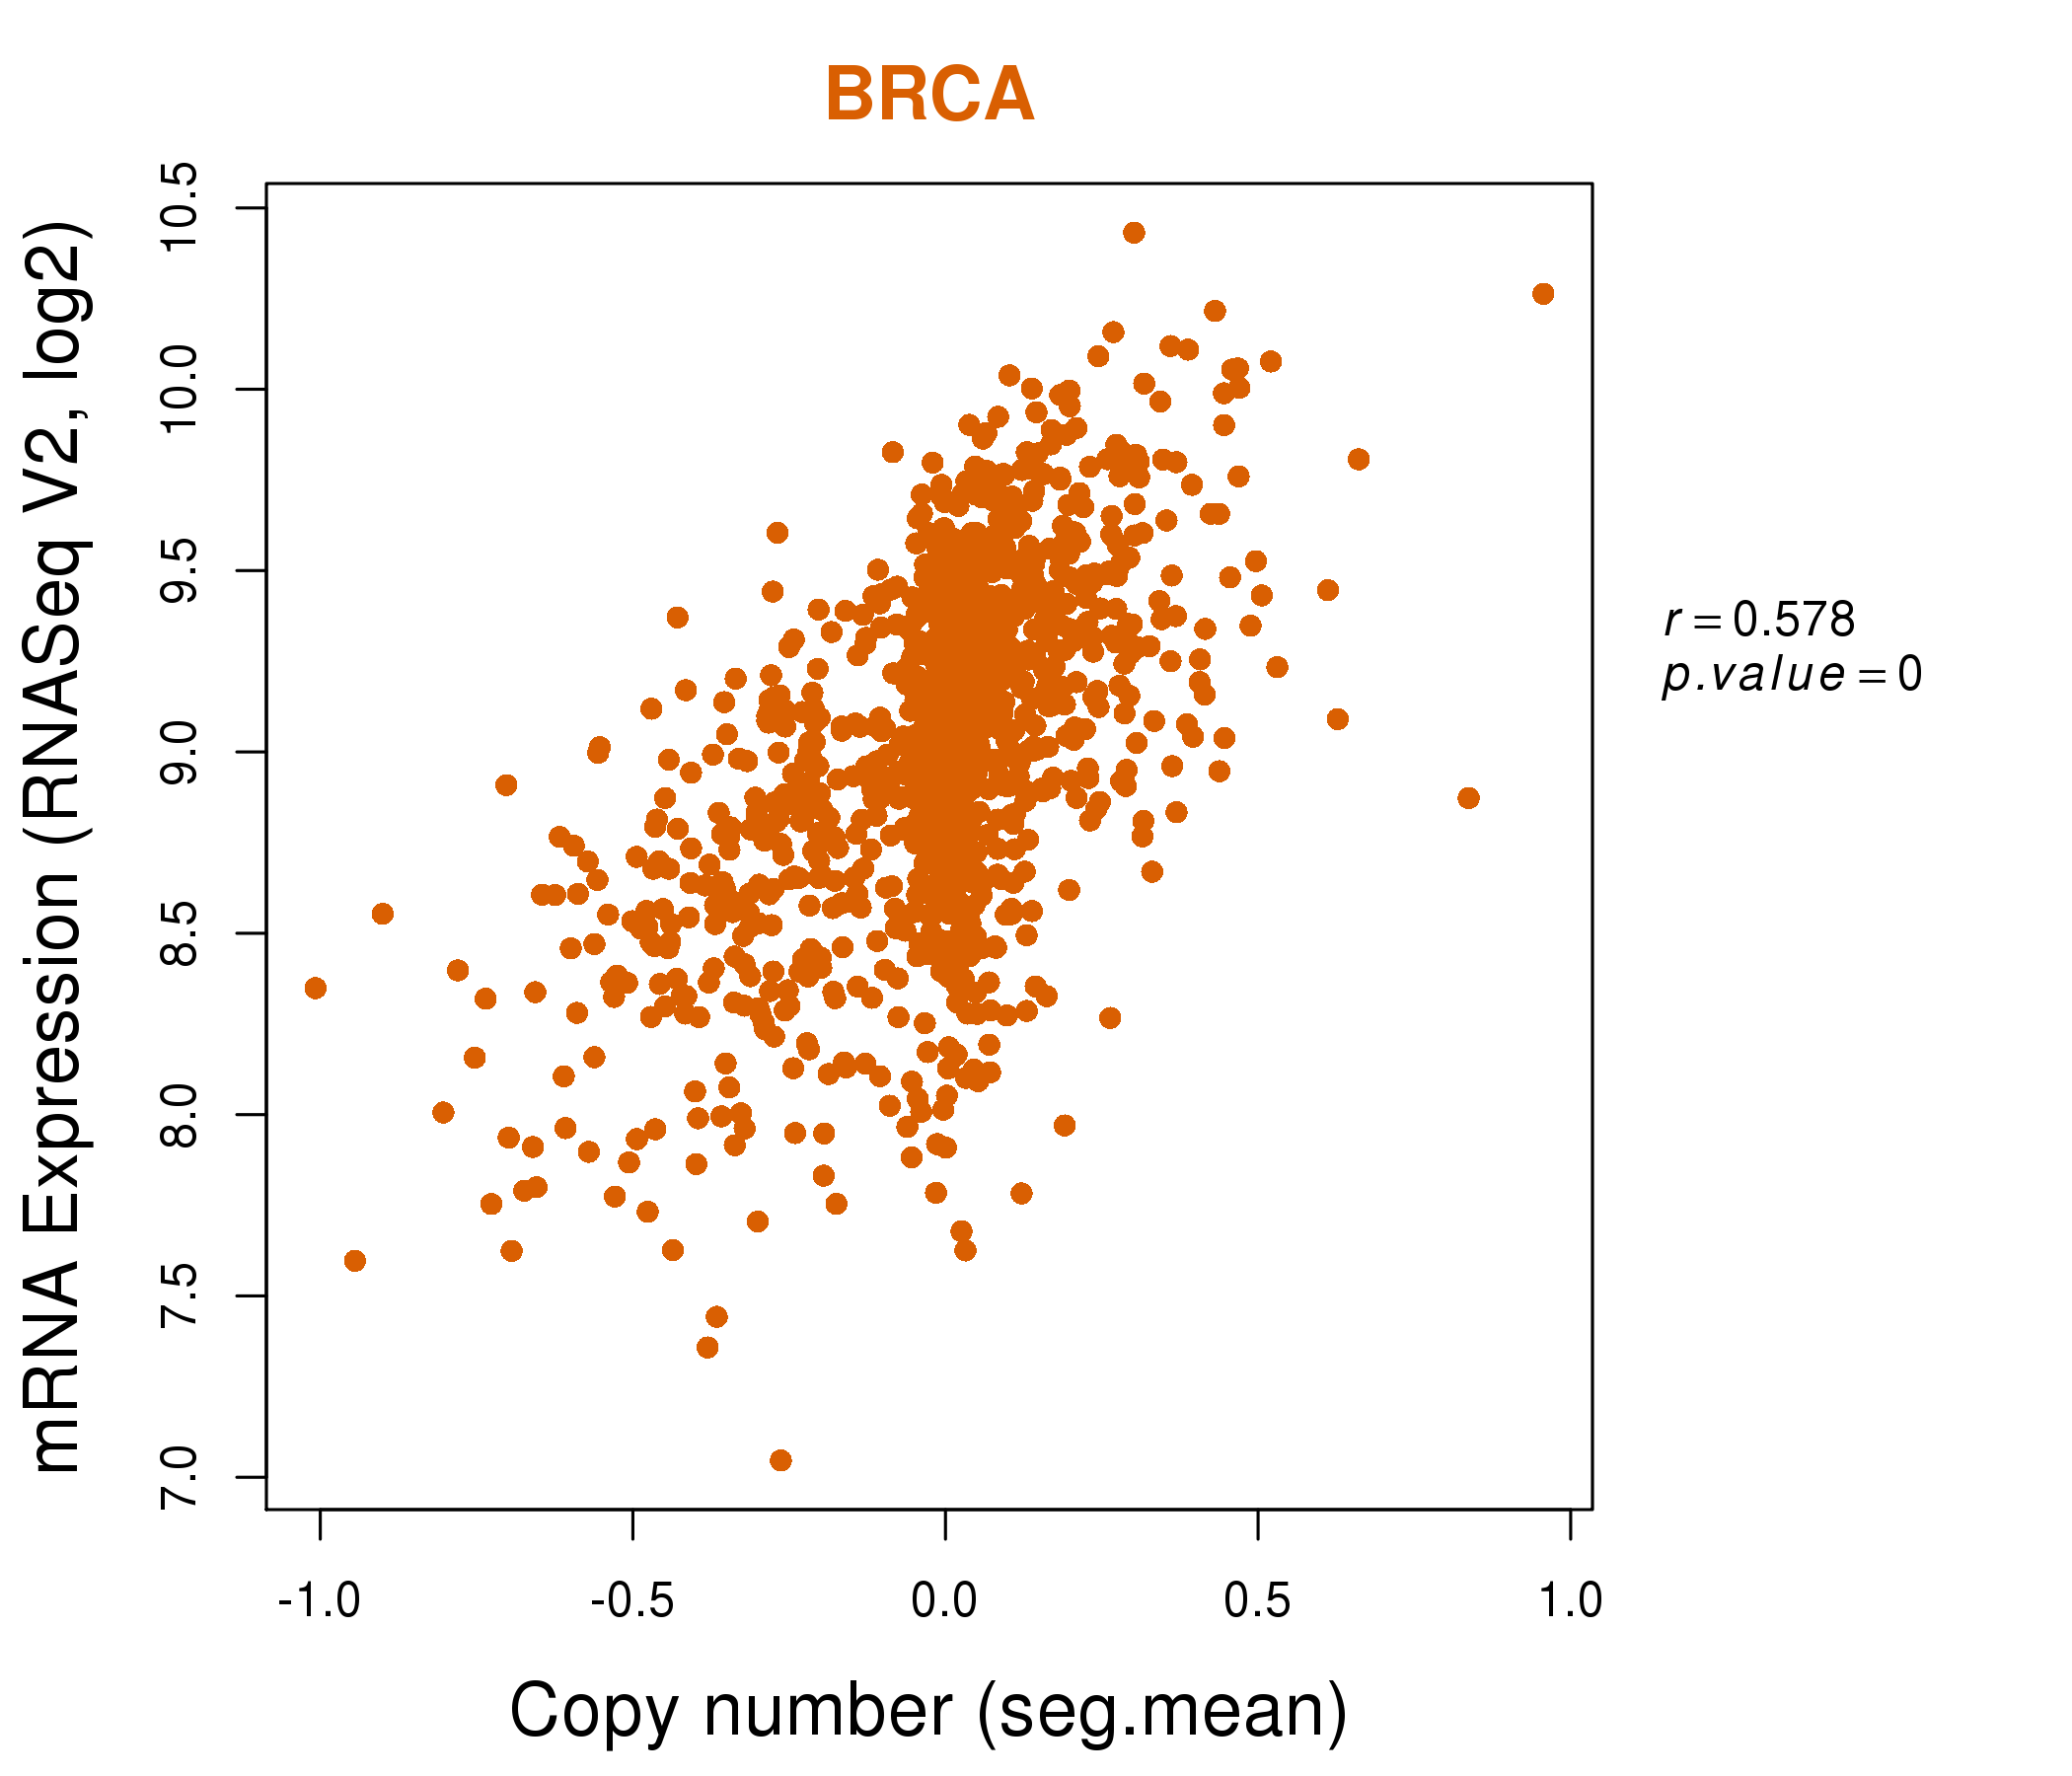
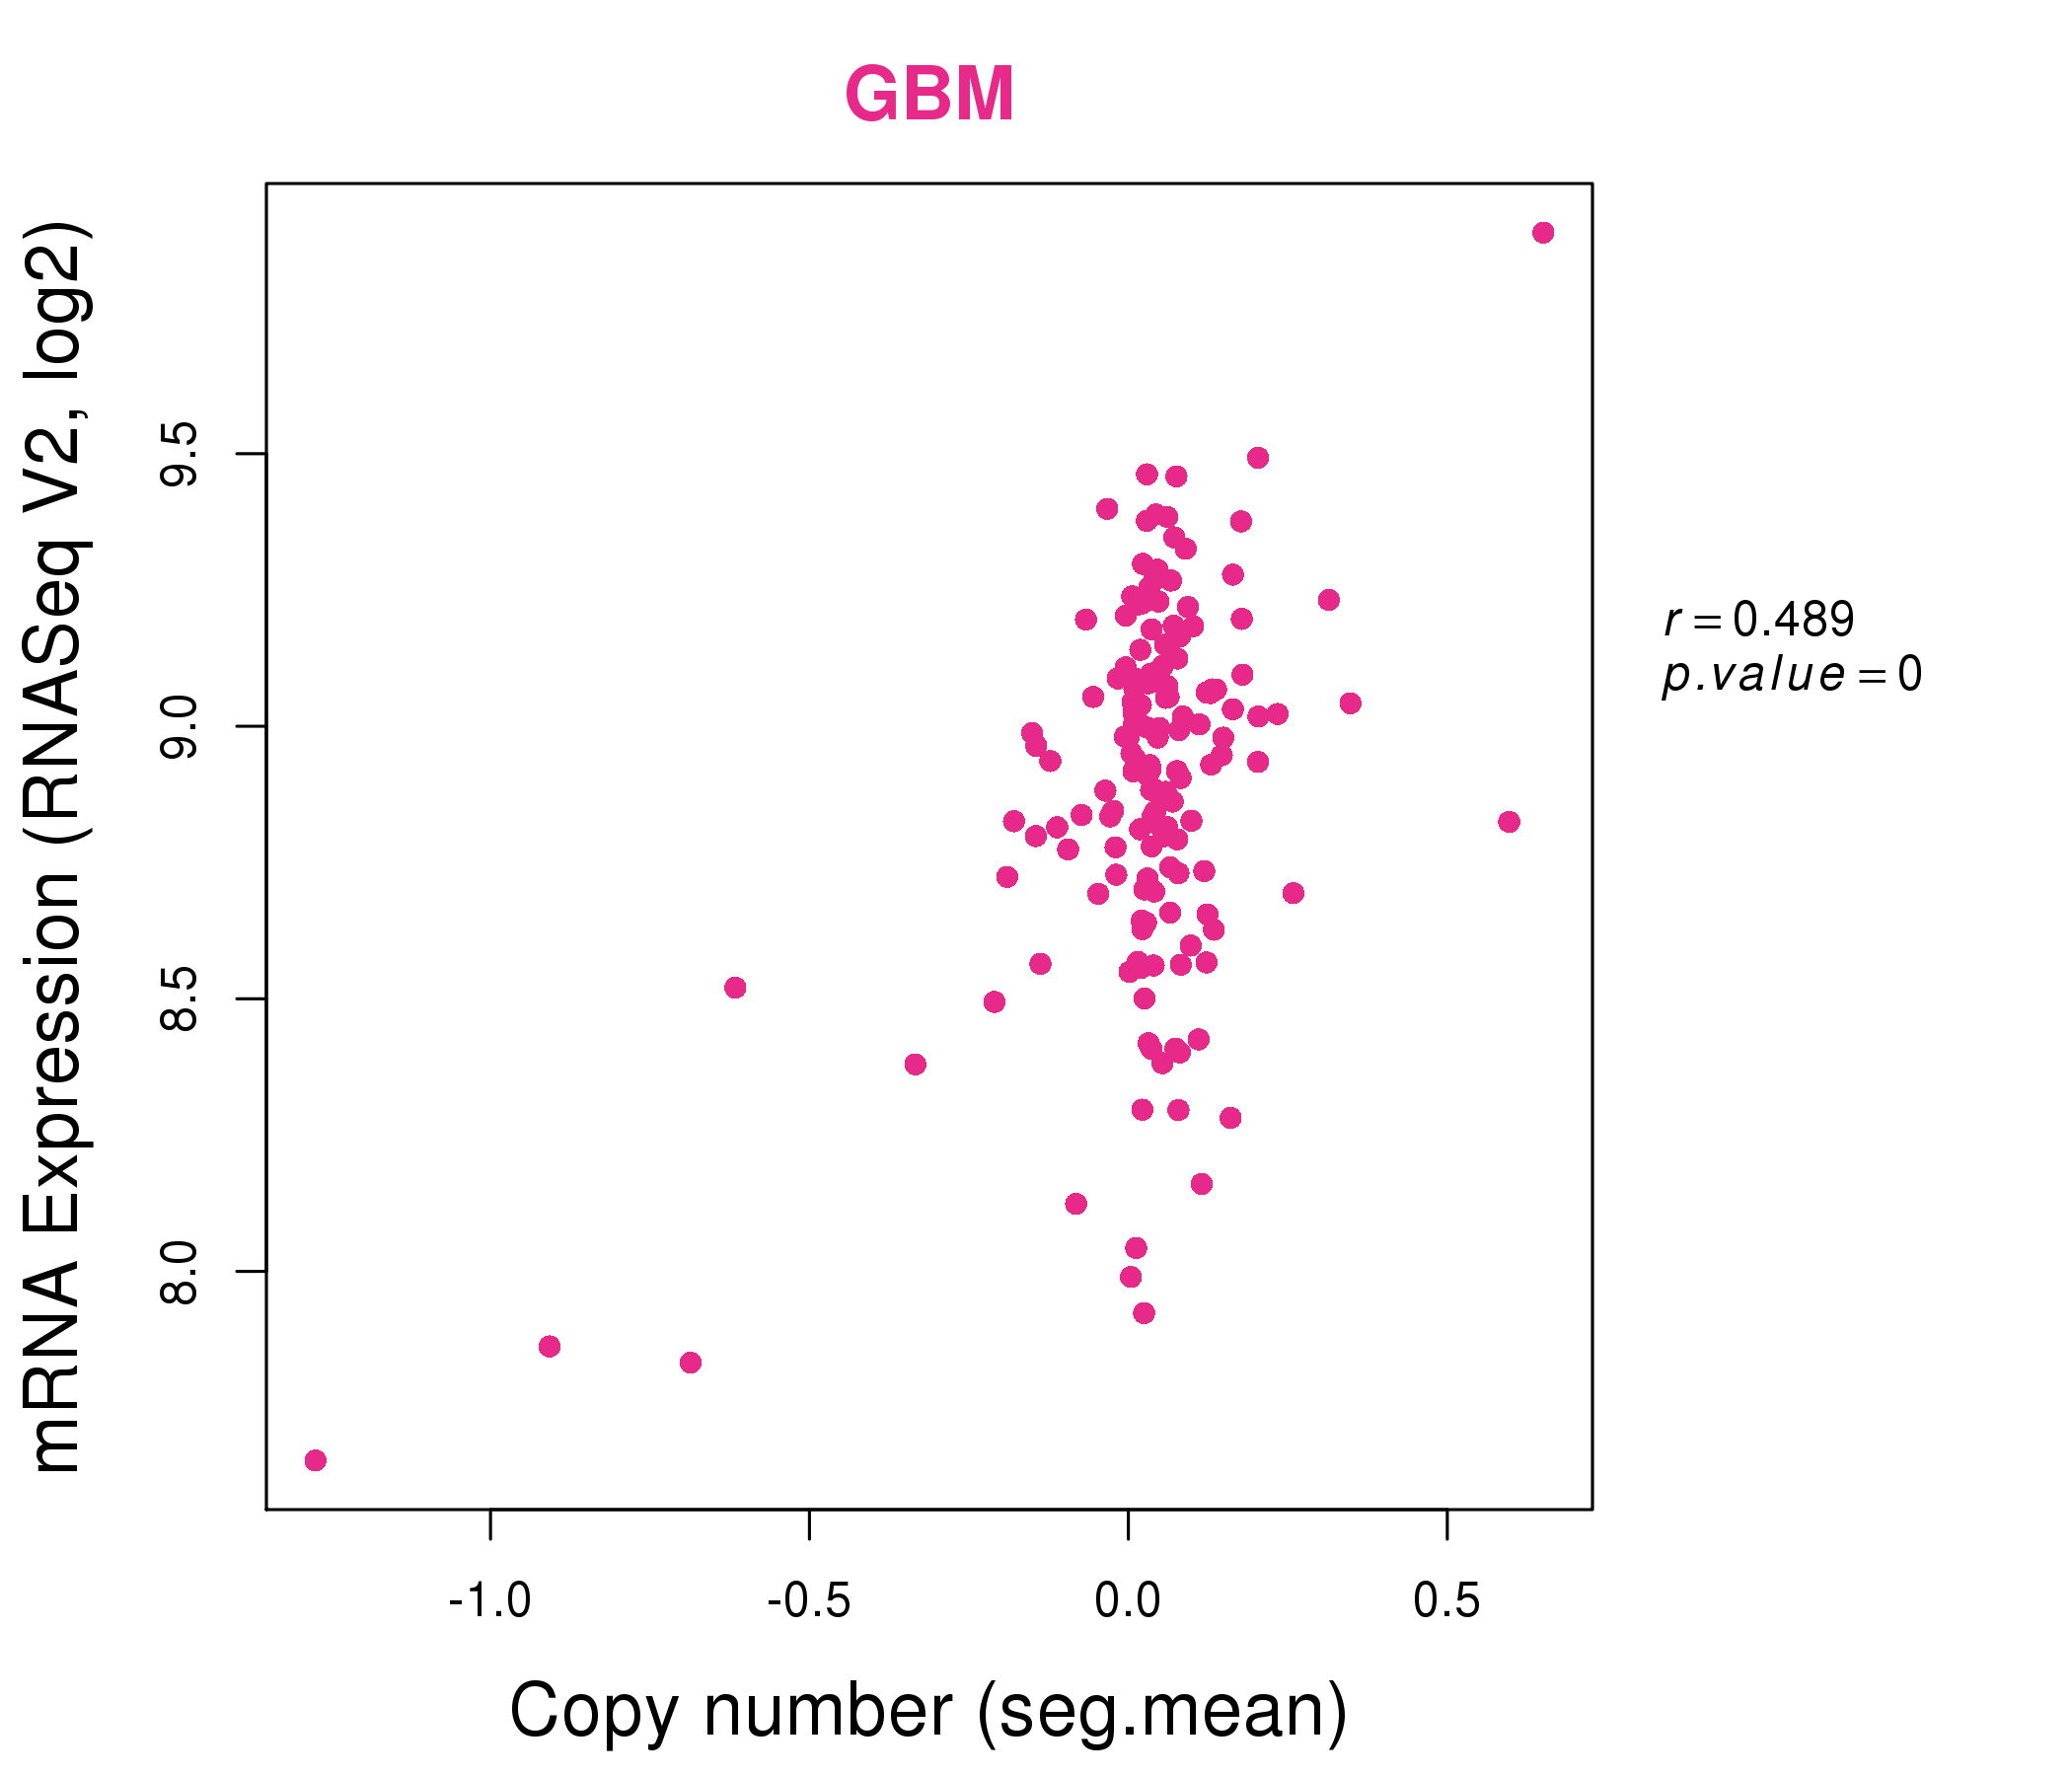
| * This plots show the correlation between CNV and gene expression. |
: Open all plots for all cancer types
 |
|
 |
|
| Top |
| Gene-Gene Network Information |
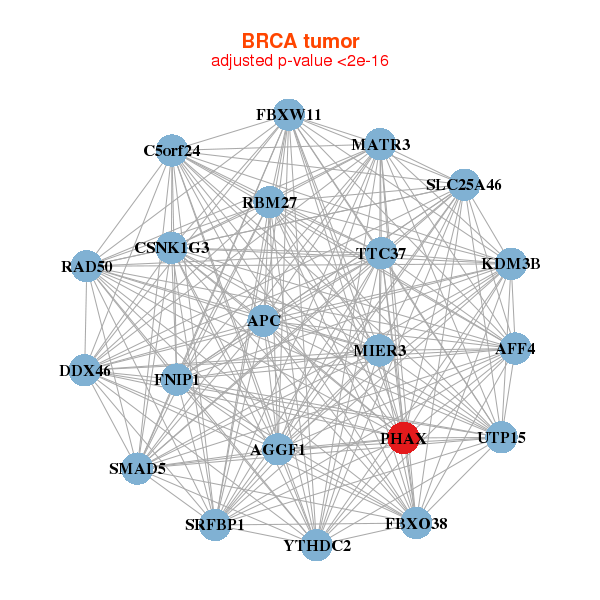
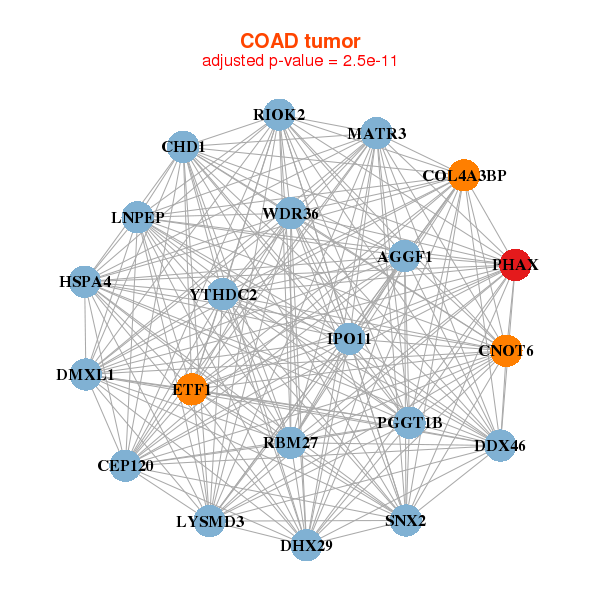
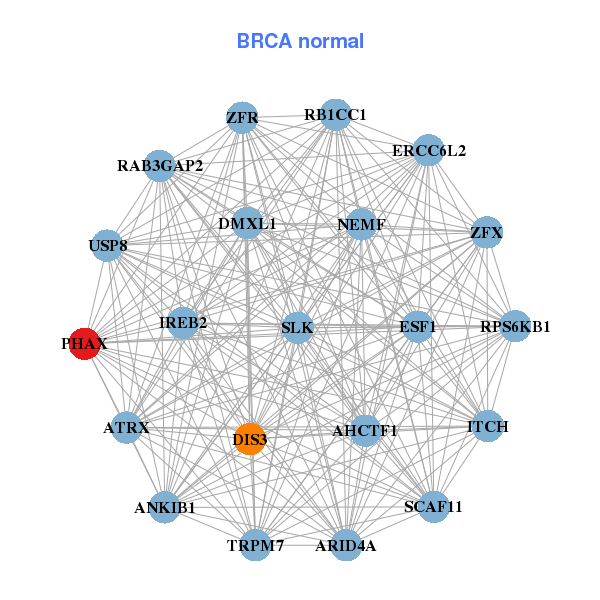
| * Co-Expression network figures were drawn using R package igraph. Only the top 20 genes with the highest correlations were shown. Red circle: input gene, orange circle: cell metabolism gene, sky circle: other gene |
: Open all plots for all cancer types
 |
|
| AFF4,AGGF1,APC,C5orf24,CSNK1G3,DDX46,FBXO38, FBXW11,FNIP1,KDM3B,MATR3,MIER3,PHAX,RAD50, RBM27,SLC25A46,SMAD5,SRFBP1,TTC37,UTP15,YTHDC2 | AHCTF1,ANKIB1,ARID4A,ATRX,ERCC6L2,DIS3,DMXL1, ESF1,IREB2,ITCH,PHAX,RAB3GAP2,RB1CC1,RPS6KB1, NEMF,SCAF11,SLK,TRPM7,USP8,ZFR,ZFX |
 |
|
| AGGF1,CEP120,CHD1,CNOT6,COL4A3BP,DDX46,DHX29, DMXL1,ETF1,HSPA4,IPO11,LNPEP,LYSMD3,MATR3, PGGT1B,PHAX,RBM27,RIOK2,SNX2,WDR36,YTHDC2 | ATAD1,C6orf203,CCDC117,CCDC132,GSPT2,HSDL2,IFT74, MED20,METAP1,MPP7,STK26,MTMR2,NCK1,PCCA, PHAX,PPID,PTGES3,SDR42E1,UBE2D1,UBE2E1,XRN2 |
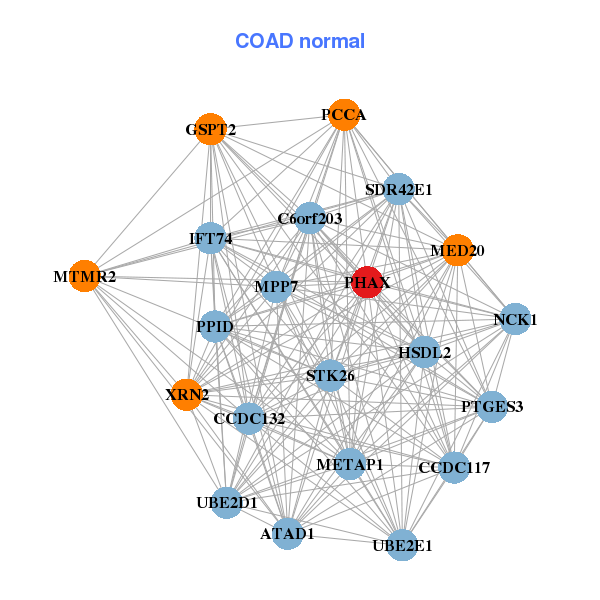
| * Co-Expression network figures were drawn using R package igraph. Only the top 20 genes with the highest correlations were shown. Red circle: input gene, orange circle: cell metabolism gene, sky circle: other gene |
: Open all plots for all cancer types
| Top |
: Open all interacting genes' information including KEGG pathway for all interacting genes from DAVID
| Top |
| Pharmacological Information for PHAX |
| There's no related Drug. |
| Top |
| Cross referenced IDs for PHAX |
| * We obtained these cross-references from Uniprot database. It covers 150 different DBs, 18 categories. http://www.uniprot.org/help/cross_references_section |
: Open all cross reference information
|
Copyright © 2016-Present - The Univsersity of Texas Health Science Center at Houston @ |