|
||||||||||||||||||||||||||||||||||||||||||||||||||||||||||||||||||||||||||||||||||||||||||||||||||||||||||||||||||||||||||||||||||||||||||||||||||||||||||||||||||||||||||||||||||||||||||||||||||||||||||||||||||||||||||||||||||||||||||||||||||||||||||||||||||||||||||||||||||||||||||||||||||||||||||||||||||||||||||
| |
| Phenotypic Information (metabolism pathway, cancer, disease, phenome) |
| |
| |
| Gene-Gene Network Information: Co-Expression Network, Interacting Genes & KEGG |
| |
|


| Gene Summary for PFKFB2 |
| Basic gene info. | Gene symbol | PFKFB2 |
| Gene name | 6-phosphofructo-2-kinase/fructose-2,6-biphosphatase 2 | |
| Synonyms | PFK-2/FBPase-2 | |
| Cytomap | UCSC genome browser: 1q31 | |
| Genomic location | chr1 :207226619-207254368 | |
| Type of gene | protein-coding | |
| RefGenes | NM_001018053.1, NM_006212.2, | |
| Ensembl id | ENSG00000123836 | |
| Description | 6-phosphofructo-2-kinase/fructose-2,6-bisphosphatase 26PF-2-K/Fru-2,6-P2ASE heart-type isozyme6PF-2-K/Fru-2,6-P2ase 2PFK/FBPase 2PFKFB, cardiacfructose-2,6-bisphosphatase, cardiac isozyme | |
| Modification date | 20141207 | |
| dbXrefs | MIM : 171835 | |
| HGNC : HGNC | ||
| Ensembl : ENSG00000123836 | ||
| HPRD : 01383 | ||
| Vega : OTTHUMG00000036033 | ||
| Protein | UniProt: go to UniProt's Cross Reference DB Table | |
| Expression | CleanEX: HS_PFKFB2 | |
| BioGPS: 5208 | ||
| Gene Expression Atlas: ENSG00000123836 | ||
| The Human Protein Atlas: ENSG00000123836 | ||
| Pathway | NCI Pathway Interaction Database: PFKFB2 | |
| KEGG: PFKFB2 | ||
| REACTOME: PFKFB2 | ||
| ConsensusPathDB | ||
| Pathway Commons: PFKFB2 | ||
| Metabolism | MetaCyc: PFKFB2 | |
| HUMANCyc: PFKFB2 | ||
| Regulation | Ensembl's Regulation: ENSG00000123836 | |
| miRBase: chr1 :207,226,619-207,254,368 | ||
| TargetScan: NM_001018053 | ||
| cisRED: ENSG00000123836 | ||
| Context | iHOP: PFKFB2 | |
| cancer metabolism search in PubMed: PFKFB2 | ||
| UCL Cancer Institute: PFKFB2 | ||
| Assigned class in ccmGDB | C | |
| Top |
| Phenotypic Information for PFKFB2(metabolism pathway, cancer, disease, phenome) |
| Cancer | CGAP: PFKFB2 |
| Familial Cancer Database: PFKFB2 | |
| * This gene is included in those cancer gene databases. |
|
|
|
|
|
|
| ||||||||||||||||||||||||||||||||||||||||||||||||||||||||||||||||||||||||||||||||||||||||||||||||||||||||||||||||||||||||||||||||||||||||||||||||||||||||||||||||||||||||||||||||||||||||||||||||||||||||||||||||||||||||||||||||||||||||||||||||||||||||||||||||||||||||||||||||||||||||||||||||||||||||||||||||||||
Oncogene 1 | Significant driver gene in | |||||||||||||||||||||||||||||||||||||||||||||||||||||||||||||||||||||||||||||||||||||||||||||||||||||||||||||||||||||||||||||||||||||||||||||||||||||||||||||||||||||||||||||||||||||||||||||||||||||||||||||||||||||||||||||||||||||||||||||||||||||||||||||||||||||||||||||||||||||||||||||||||||||||||||||||||||||||||
| cf) number; DB name 1 Oncogene; http://nar.oxfordjournals.org/content/35/suppl_1/D721.long, 2 Tumor Suppressor gene; https://bioinfo.uth.edu/TSGene/, 3 Cancer Gene Census; http://www.nature.com/nrc/journal/v4/n3/abs/nrc1299.html, 4 CancerGenes; http://nar.oxfordjournals.org/content/35/suppl_1/D721.long, 5 Network of Cancer Gene; http://ncg.kcl.ac.uk/index.php, 1Therapeutic Vulnerabilities in Cancer; http://cbio.mskcc.org/cancergenomics/statius/ |
| KEGG_FRUCTOSE_AND_MANNOSE_METABOLISM REACTOME_METABOLISM_OF_CARBOHYDRATES REACTOME_GLUCOSE_METABOLISM | |
| OMIM | |
| Orphanet | |
| Disease | KEGG Disease: PFKFB2 |
| MedGen: PFKFB2 (Human Medical Genetics with Condition) | |
| ClinVar: PFKFB2 | |
| Phenotype | MGI: PFKFB2 (International Mouse Phenotyping Consortium) |
| PhenomicDB: PFKFB2 | |
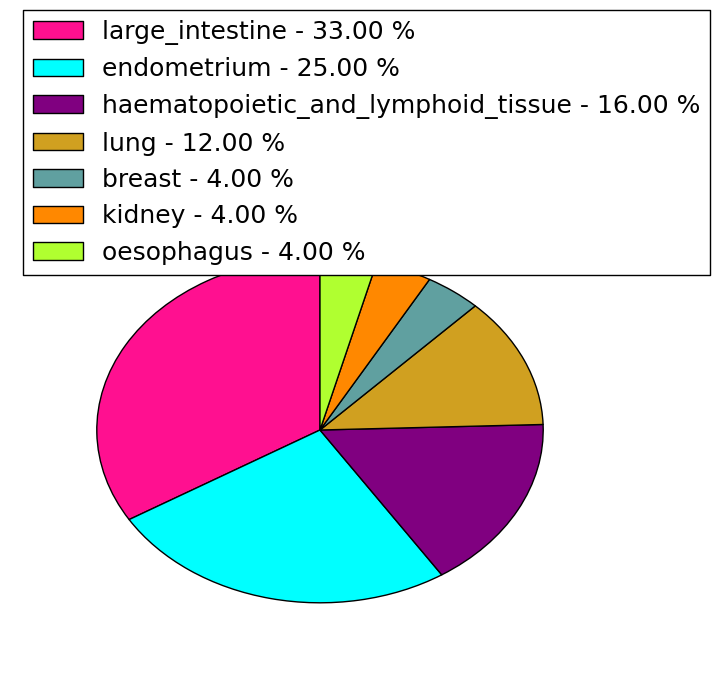
| Mutations for PFKFB2 |
| * Under tables are showing count per each tissue to give us broad intuition about tissue specific mutation patterns.You can go to the detailed page for each mutation database's web site. |
| There's no structural variation information in COSMIC data for this gene. |
| * From mRNA Sanger sequences, Chitars2.0 arranged chimeric transcripts. This table shows PFKFB2 related fusion information. |
| ID | Head Gene | Tail Gene | Accession | Gene_a | qStart_a | qEnd_a | Chromosome_a | tStart_a | tEnd_a | Gene_a | qStart_a | qEnd_a | Chromosome_a | tStart_a | tEnd_a |
| AF063569 | APOA2 | 20 | 274 | 1 | 161192082 | 161192731 | PFKFB2 | 267 | 604 | 1 | 207221981 | 207222316 | |
| AI110694 | APOA2 | 20 | 274 | 1 | 161192082 | 161192731 | PFKFB2 | 267 | 604 | 1 | 207221981 | 207222316 | |
| AF090896 | APOA2 | 20 | 274 | 1 | 161192082 | 161192731 | PFKFB2 | 267 | 2907 | 1 | 207219676 | 207222316 | |
| W27604 | PFKFB2 | 19 | 217 | 1 | 207236026 | 207236753 | PFKFB2 | 211 | 424 | 1 | 207242791 | 207243754 | |
| BE173373 | PFKFB2 | 14 | 299 | 1 | 207250792 | 207251120 | DDHD1 | 290 | 687 | 14 | 53509685 | 53510086 | |
| Top |
| Mutation type/ Tissue ID | brca | cns | cerv | endome | haematopo | kidn | Lintest | liver | lung | ns | ovary | pancre | prost | skin | stoma | thyro | urina | |||
| Total # sample | 2 | |||||||||||||||||||
| GAIN (# sample) | 2 | |||||||||||||||||||
| LOSS (# sample) |
| cf) Tissue ID; Tissue type (1; Breast, 2; Central_nervous_system, 3; Cervix, 4; Endometrium, 5; Haematopoietic_and_lymphoid_tissue, 6; Kidney, 7; Large_intestine, 8; Liver, 9; Lung, 10; NS, 11; Ovary, 12; Pancreas, 13; Prostate, 14; Skin, 15; Stomach, 16; Thyroid, 17; Urinary_tract) |
| Top |
|
 |
| Top |
| Stat. for Non-Synonymous SNVs (# total SNVs=26) | (# total SNVs=24) |
 |  |
(# total SNVs=3) | (# total SNVs=1) |
 |  |
| Top |
| * When you move the cursor on each content, you can see more deailed mutation information on the Tooltip. Those are primary_site,primary_histology,mutation(aa),pubmedID. |
| GRCh37 position | Mutation(aa) | Unique sampleID count |
| chr1:207242789-207242789 | p.T336T | 4 |
| chr1:207245617-207245617 | p.S473S | 3 |
| chr1:207228072-207228072 | p.A4T | 2 |
| chr1:207236761-207236761 | p.F149L | 1 |
| chr1:207243670-207243670 | p.L380L | 1 |
| chr1:207228090-207228092 | p.N12delN | 1 |
| chr1:207240957-207240957 | p.P249L | 1 |
| chr1:207245685-207245685 | p.R496H | 1 |
| chr1:207235994-207235994 | p.A81S | 1 |
| chr1:207237135-207237135 | p.S156S | 1 |
| Top |
|
 |
| Point Mutation/ Tissue ID | 1 | 2 | 3 | 4 | 5 | 6 | 7 | 8 | 9 | 10 | 11 | 12 | 13 | 14 | 15 | 16 | 17 | 18 | 19 | 20 |
| # sample | 2 | 1 | 8 | 4 | 2 | 2 | 1 | 1 | 7 | 4 | 9 | |||||||||
| # mutation | 2 | 1 | 8 | 4 | 2 | 5 | 1 | 1 | 7 | 4 | 9 | |||||||||
| nonsynonymous SNV | 1 | 5 | 4 | 1 | 3 | 1 | 1 | 6 | 4 | 4 | ||||||||||
| synonymous SNV | 1 | 1 | 4 | 1 | 2 | 1 | 5 |
| cf) Tissue ID; Tissue type (1; BLCA[Bladder Urothelial Carcinoma], 2; BRCA[Breast invasive carcinoma], 3; CESC[Cervical squamous cell carcinoma and endocervical adenocarcinoma], 4; COAD[Colon adenocarcinoma], 5; GBM[Glioblastoma multiforme], 6; Glioma Low Grade, 7; HNSC[Head and Neck squamous cell carcinoma], 8; KICH[Kidney Chromophobe], 9; KIRC[Kidney renal clear cell carcinoma], 10; KIRP[Kidney renal papillary cell carcinoma], 11; LAML[Acute Myeloid Leukemia], 12; LUAD[Lung adenocarcinoma], 13; LUSC[Lung squamous cell carcinoma], 14; OV[Ovarian serous cystadenocarcinoma ], 15; PAAD[Pancreatic adenocarcinoma], 16; PRAD[Prostate adenocarcinoma], 17; SKCM[Skin Cutaneous Melanoma], 18:STAD[Stomach adenocarcinoma], 19:THCA[Thyroid carcinoma], 20:UCEC[Uterine Corpus Endometrial Carcinoma]) |
| Top |
| * We represented just top 10 SNVs. When you move the cursor on each content, you can see more deailed mutation information on the Tooltip. Those are primary_site, primary_histology, mutation(aa), pubmedID. |
| Genomic Position | Mutation(aa) | Unique sampleID count |
| chr1:207245617 | p.Q248Q,PFKFB2 | 2 |
| chr1:207237135 | p.S473S | 2 |
| chr1:207242833 | p.R102S,PFKFB2 | 2 |
| chr1:207236057 | p.R351Q,PFKFB2 | 2 |
| chr1:207240955 | p.S156S,PFKFB2 | 2 |
| chr1:207241006 | p.W30L,PFKFB2 | 1 |
| chr1:207235301 | p.F215F,PFKFB2 | 1 |
| chr1:207243648 | p.R372R,PFKFB2 | 1 |
| chr1:207236550 | p.R49W,PFKFB2 | 1 |
| chr1:207241025 | p.V218A,PFKFB2 | 1 |
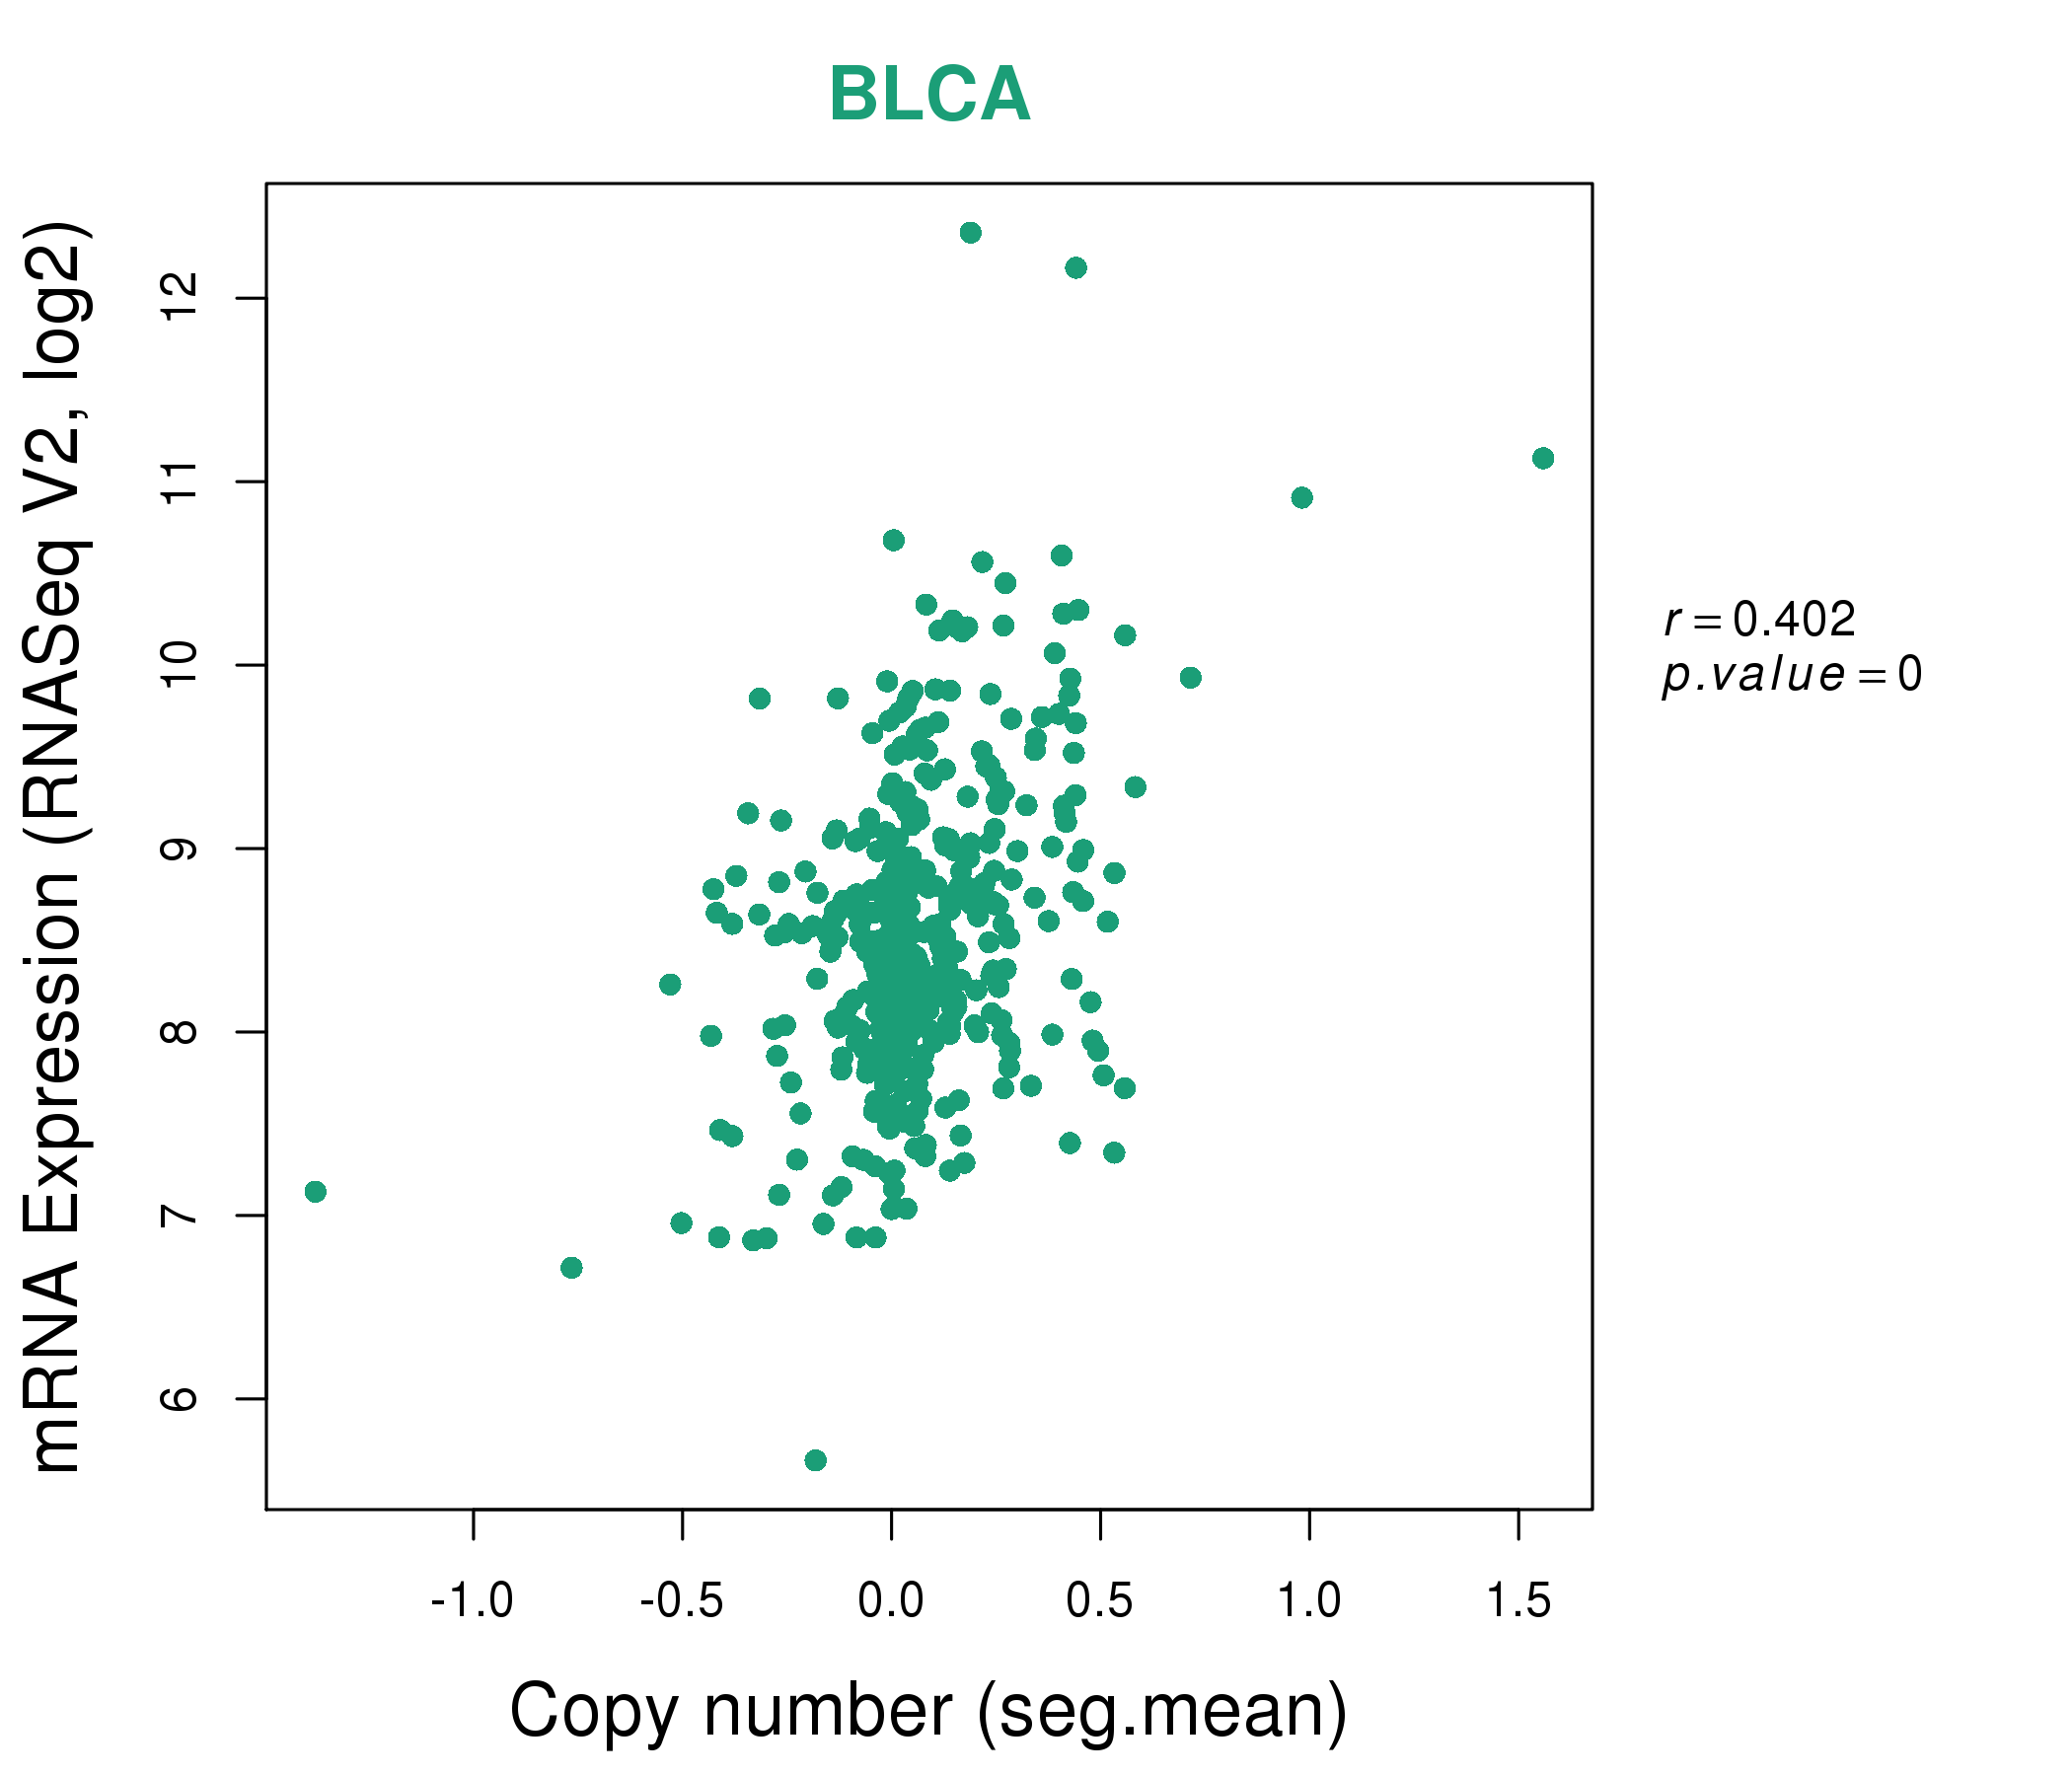
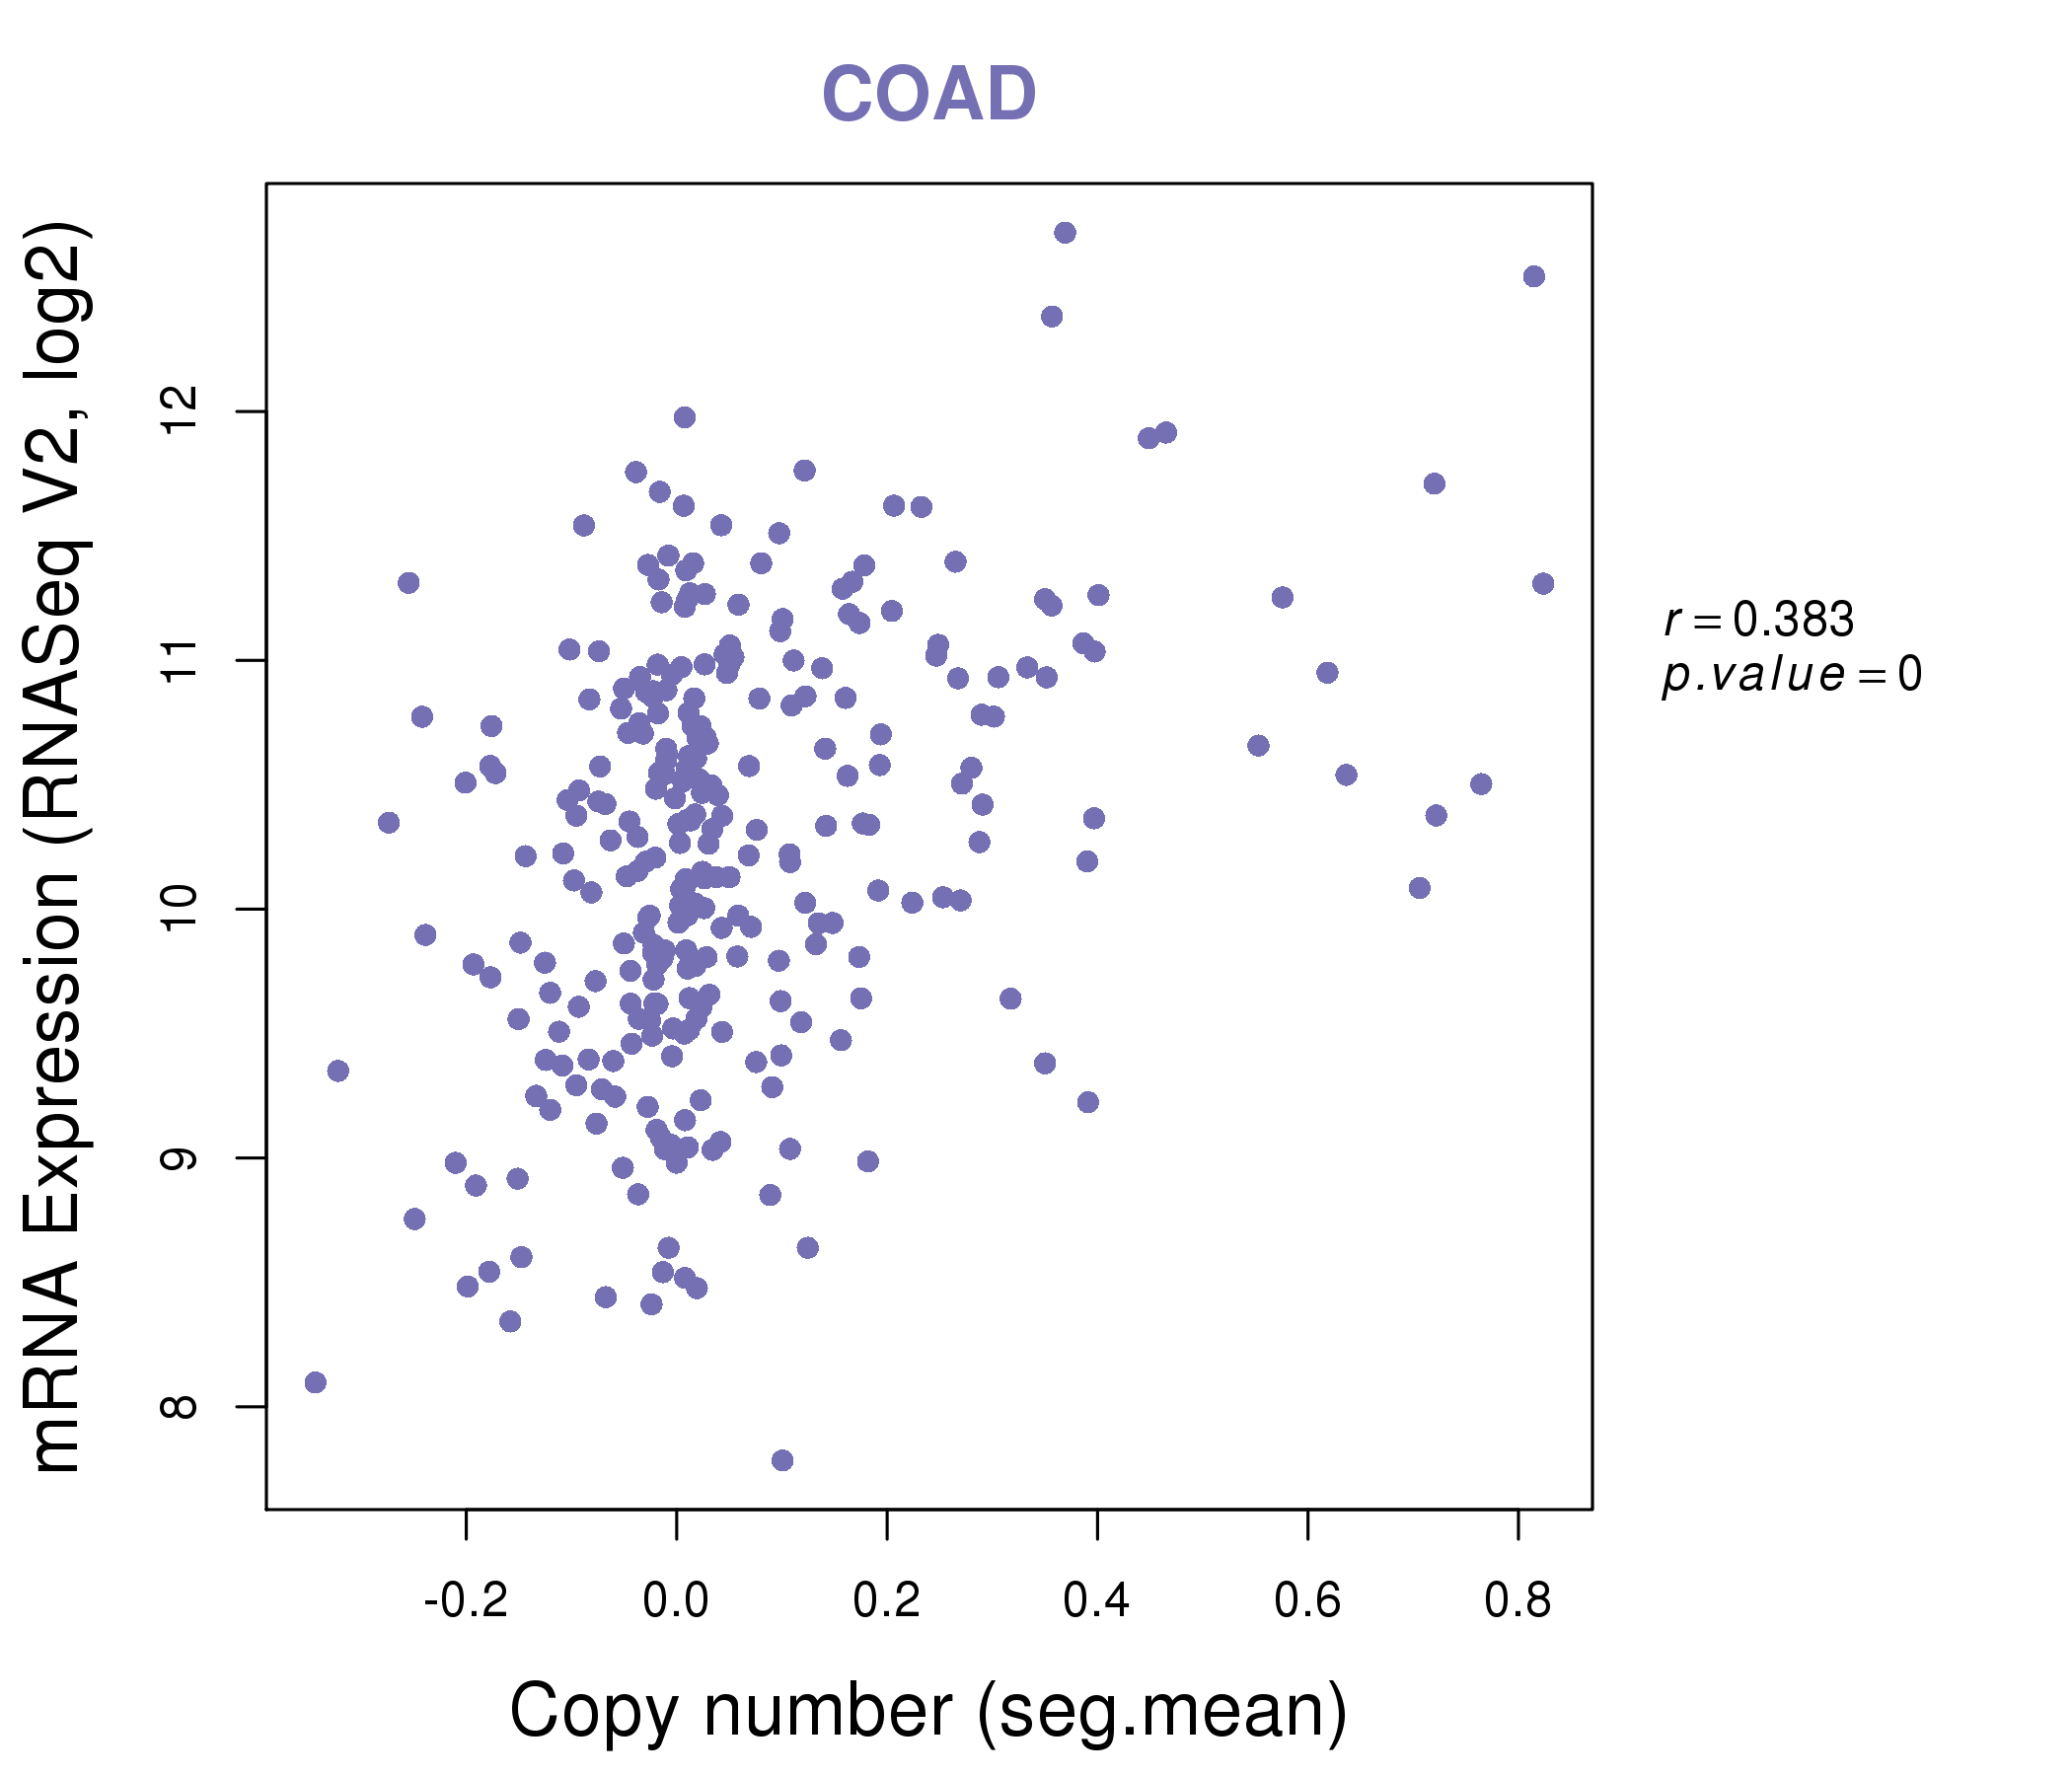
| * Copy number data were extracted from TCGA using R package TCGA-Assembler. The URLs of all public data files on TCGA DCC data server were gathered on Jan-05-2015. Function ProcessCNAData in TCGA-Assembler package was used to obtain gene-level copy number value which is calculated as the average copy number of the genomic region of a gene. |
 |
| cf) Tissue ID[Tissue type]: BLCA[Bladder Urothelial Carcinoma], BRCA[Breast invasive carcinoma], CESC[Cervical squamous cell carcinoma and endocervical adenocarcinoma], COAD[Colon adenocarcinoma], GBM[Glioblastoma multiforme], Glioma Low Grade, HNSC[Head and Neck squamous cell carcinoma], KICH[Kidney Chromophobe], KIRC[Kidney renal clear cell carcinoma], KIRP[Kidney renal papillary cell carcinoma], LAML[Acute Myeloid Leukemia], LUAD[Lung adenocarcinoma], LUSC[Lung squamous cell carcinoma], OV[Ovarian serous cystadenocarcinoma ], PAAD[Pancreatic adenocarcinoma], PRAD[Prostate adenocarcinoma], SKCM[Skin Cutaneous Melanoma], STAD[Stomach adenocarcinoma], THCA[Thyroid carcinoma], UCEC[Uterine Corpus Endometrial Carcinoma] |
| Top |
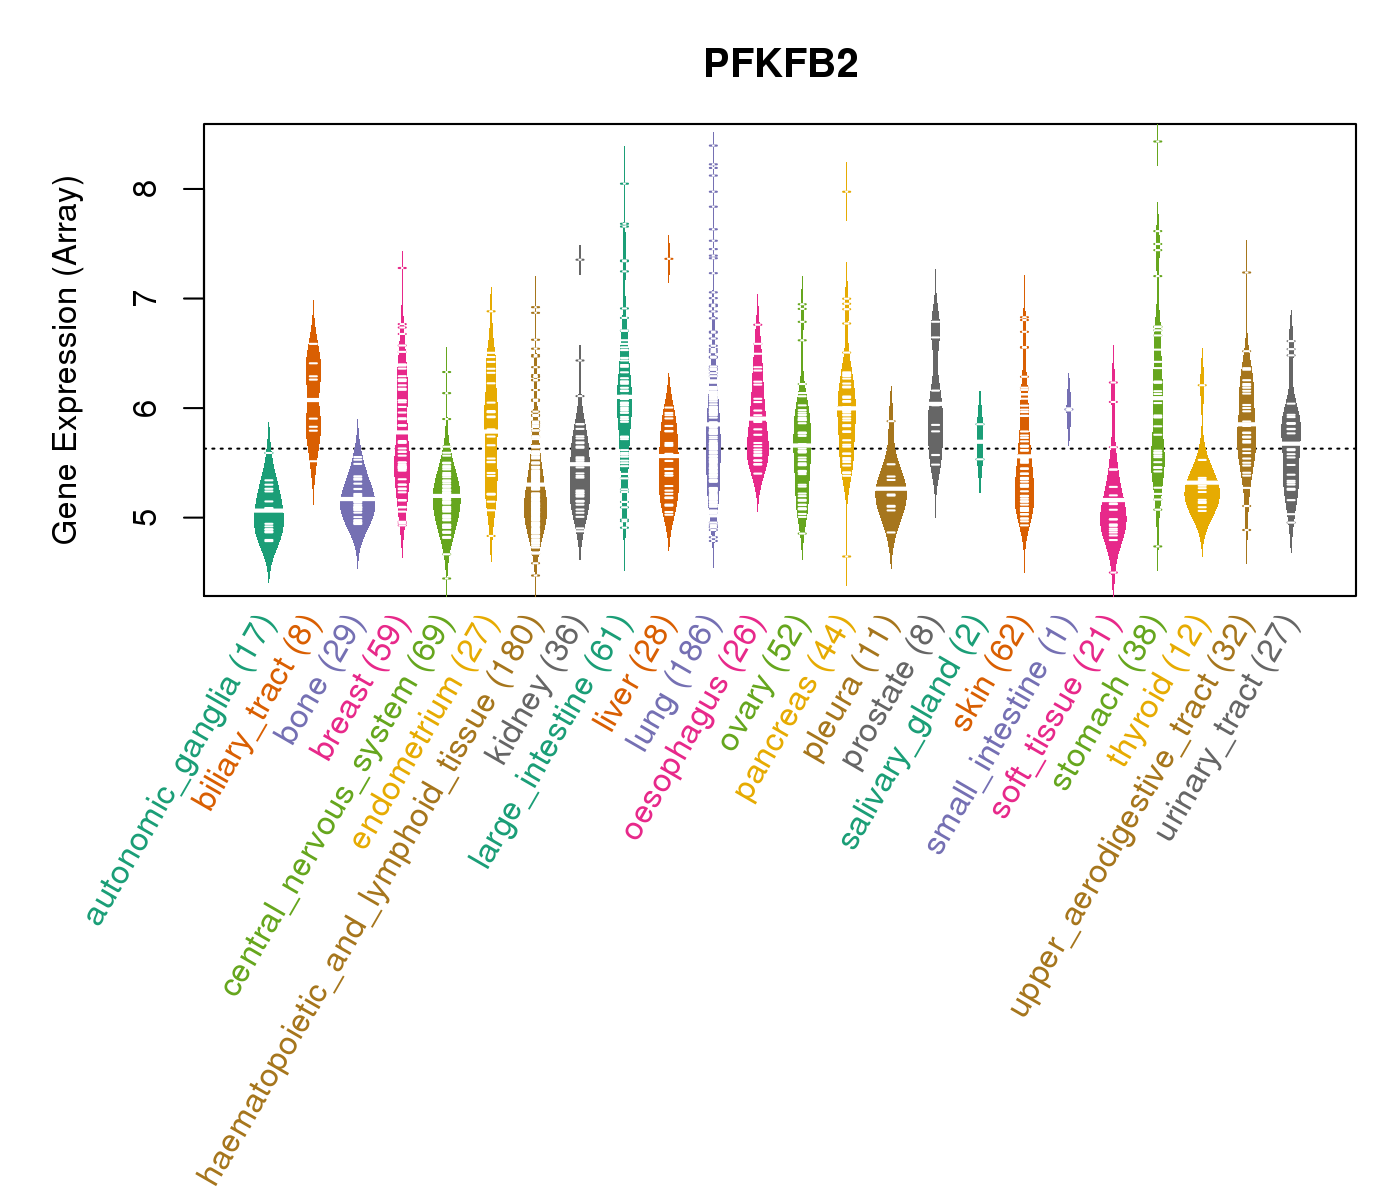
| Gene Expression for PFKFB2 |
| * CCLE gene expression data were extracted from CCLE_Expression_Entrez_2012-10-18.res: Gene-centric RMA-normalized mRNA expression data. |
 |
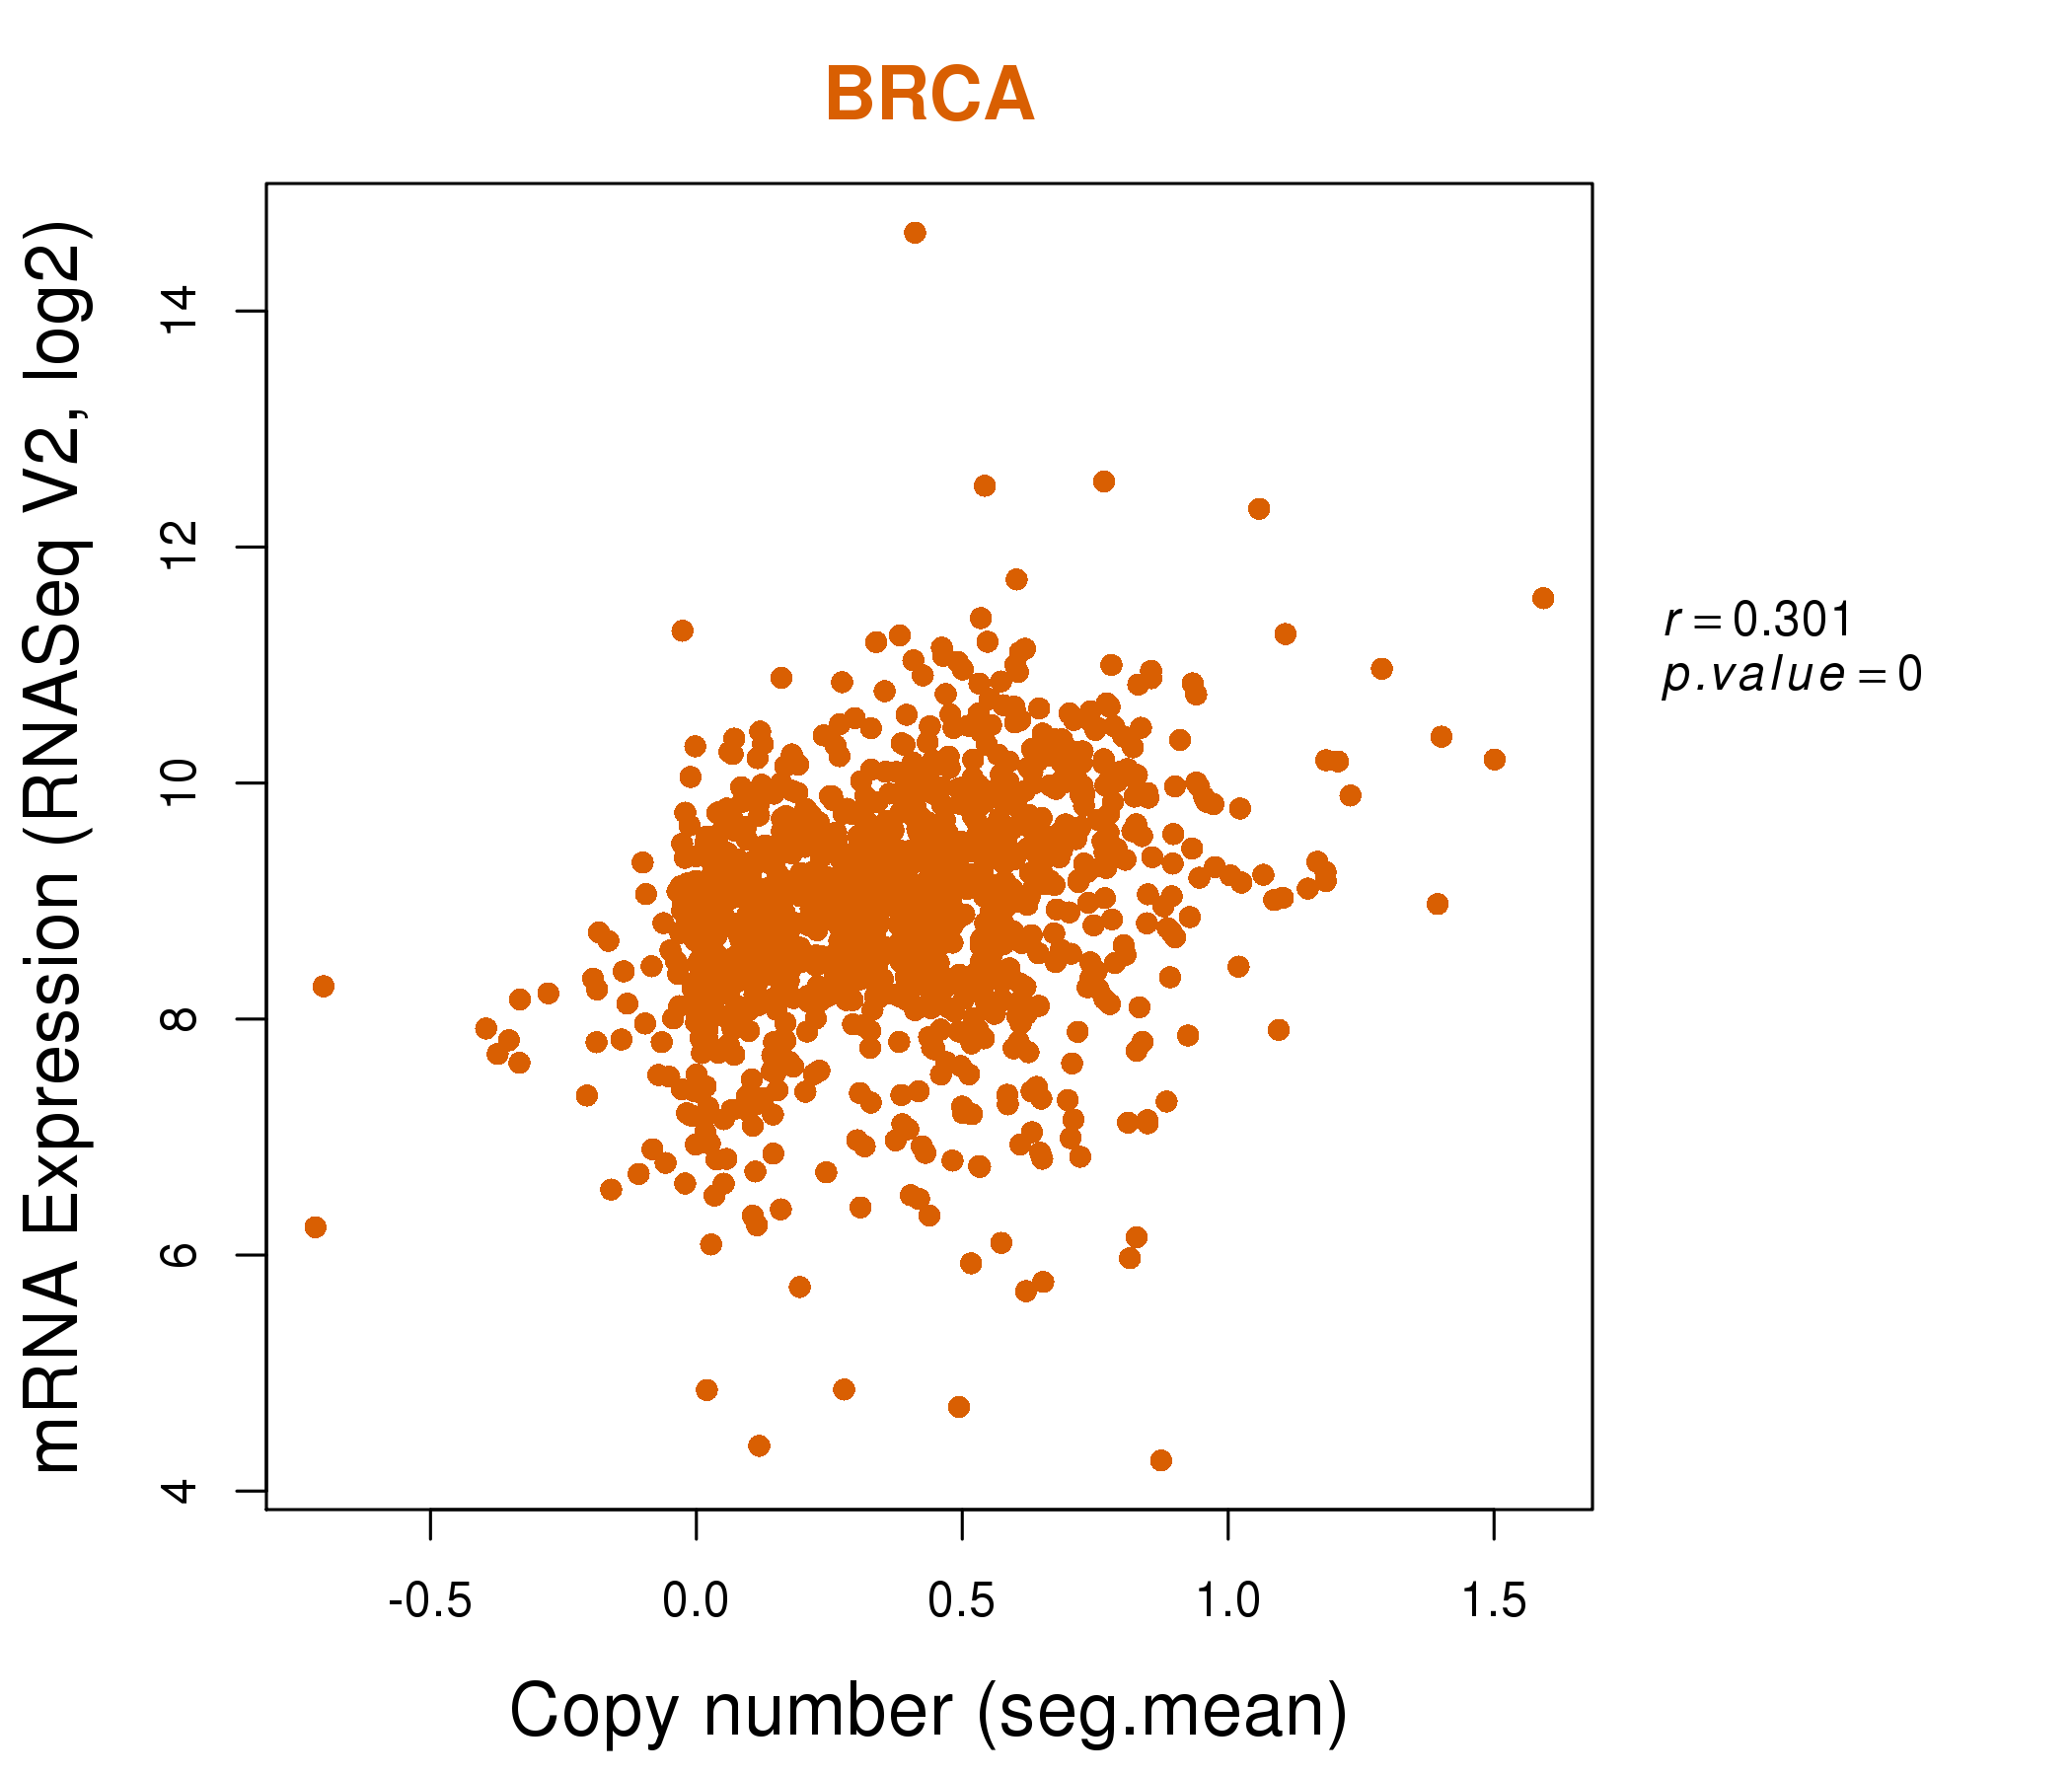
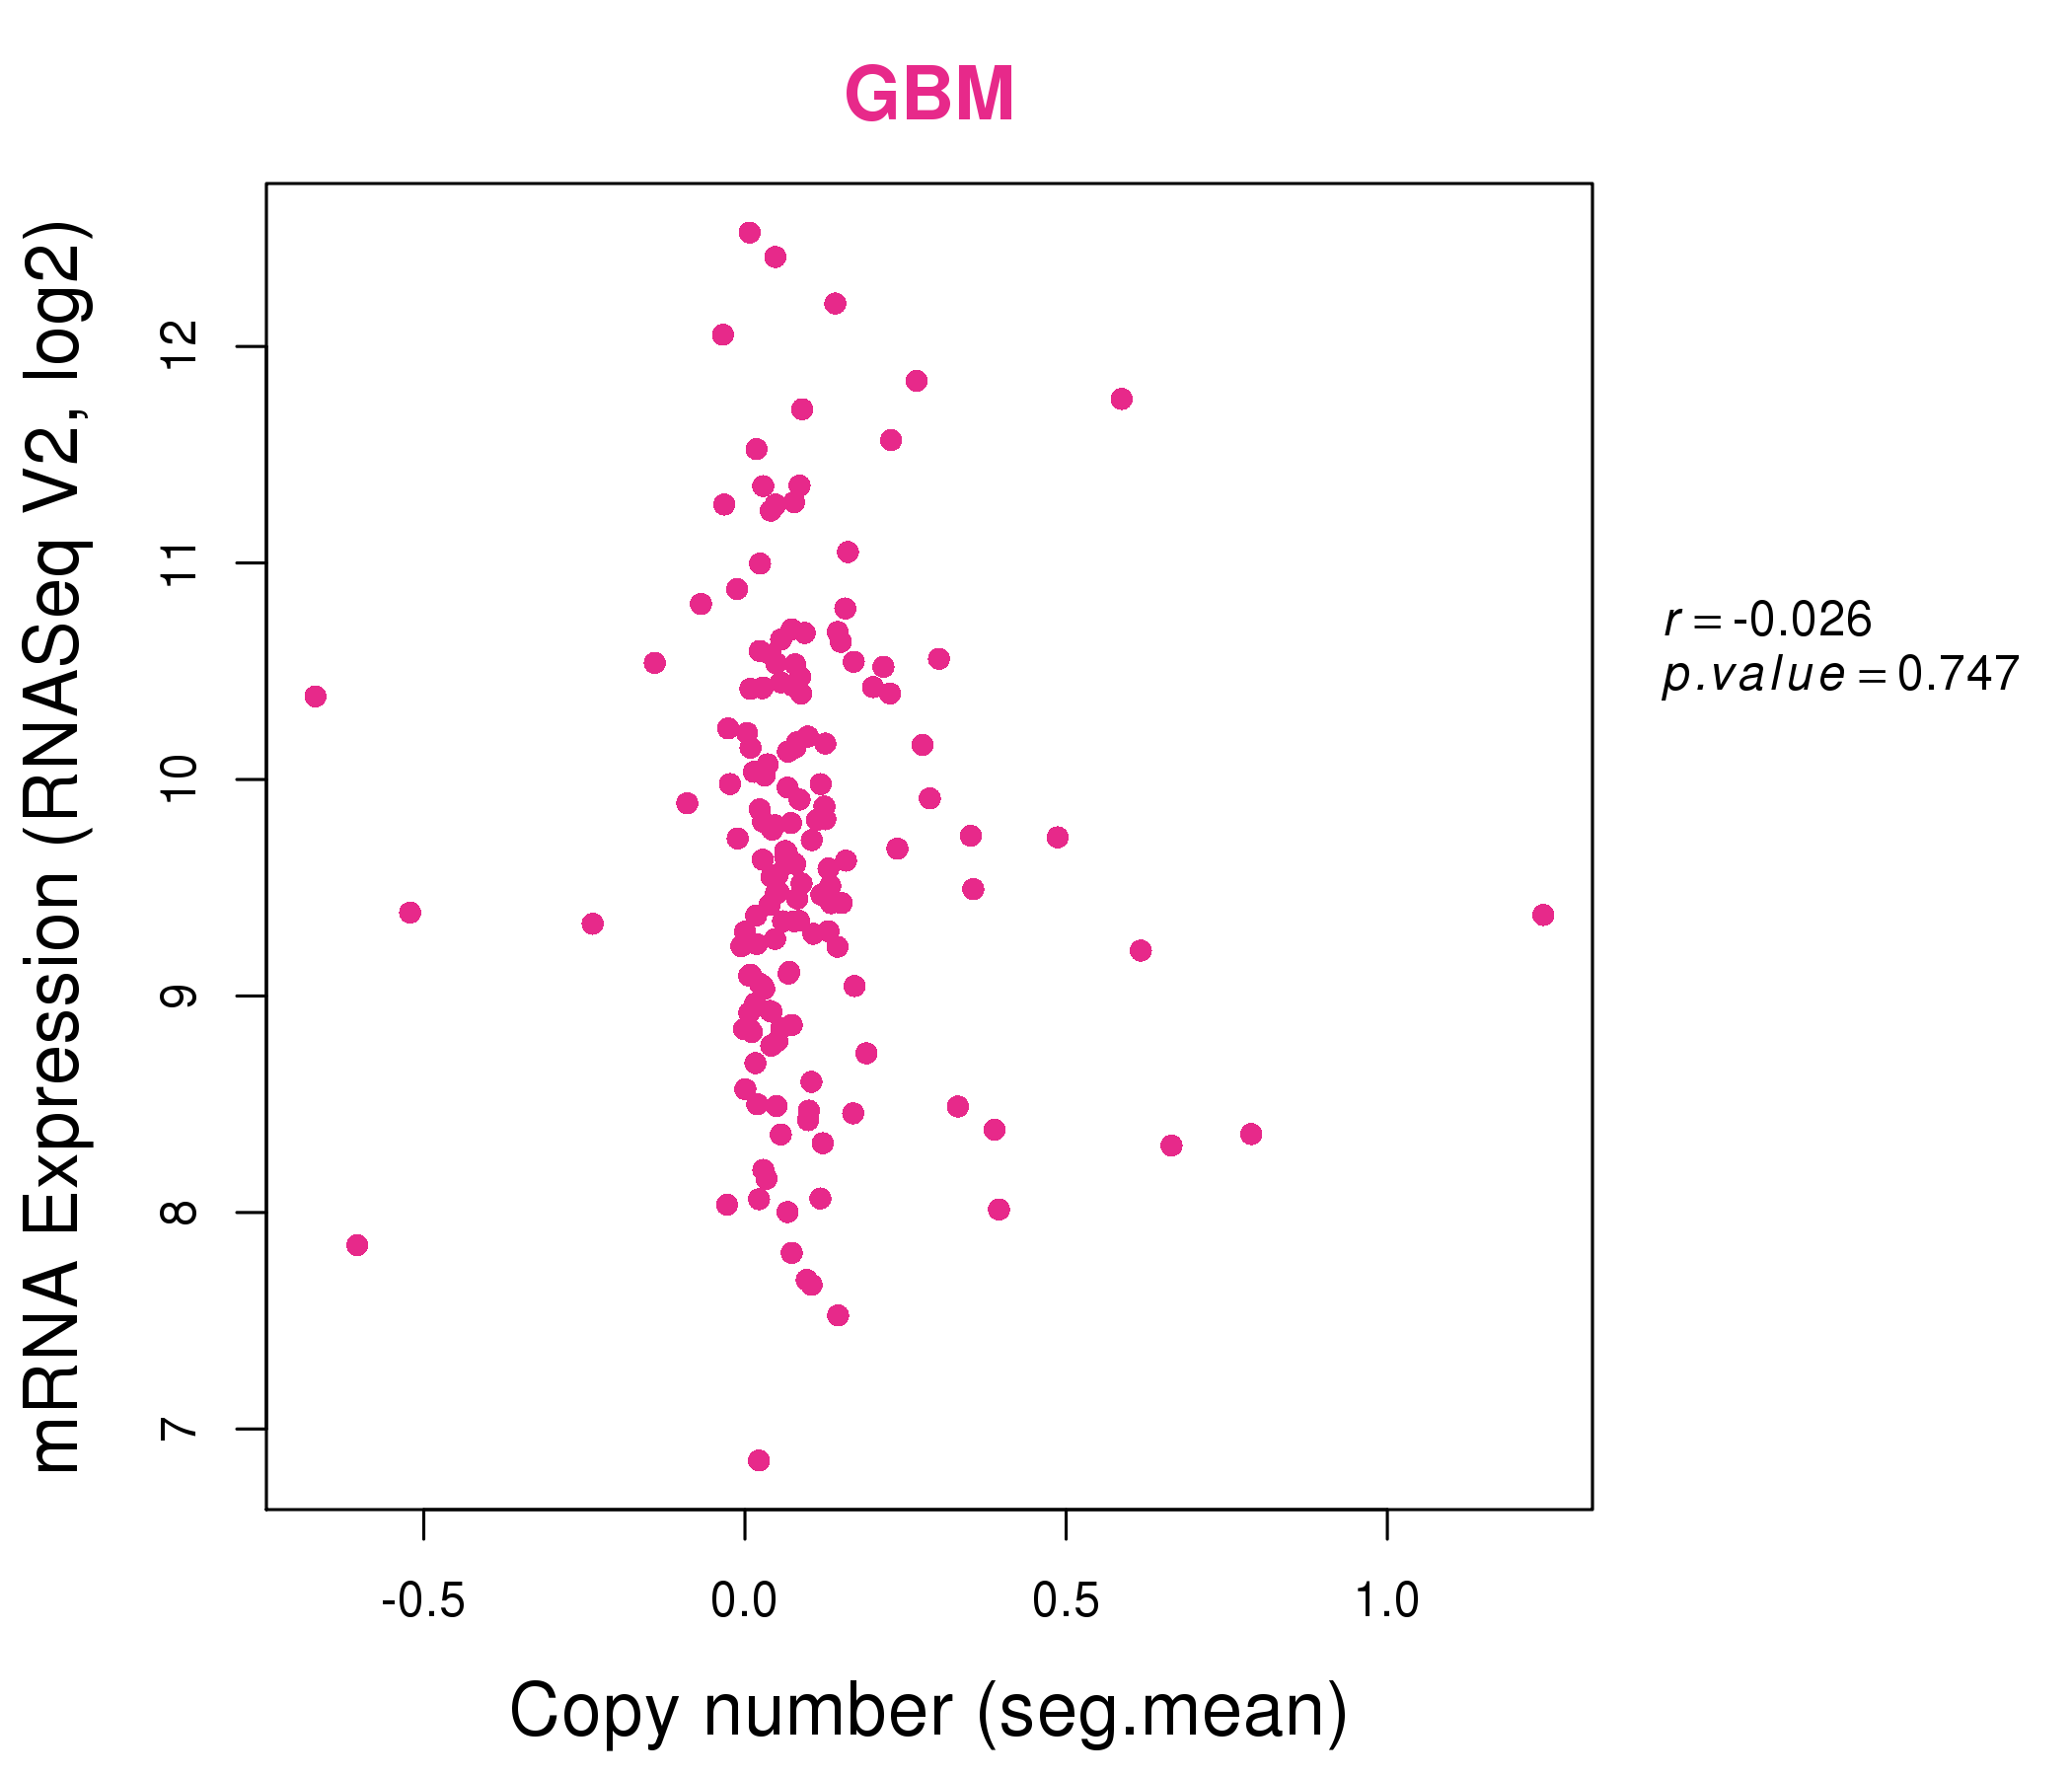
| * Normalized gene expression data of RNASeqV2 was extracted from TCGA using R package TCGA-Assembler. The URLs of all public data files on TCGA DCC data server were gathered at Jan-05-2015. Only eight cancer types have enough normal control samples for differential expression analysis. (t test, adjusted p<0.05 (using Benjamini-Hochberg FDR)) |
 |
| Top |
| * This plots show the correlation between CNV and gene expression. |
: Open all plots for all cancer types
 |
|
 |
|
| Top |
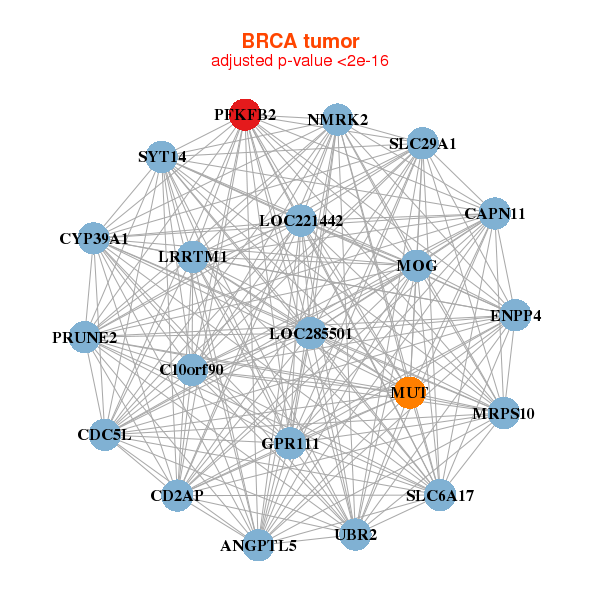
| Gene-Gene Network Information |
| * Co-Expression network figures were drawn using R package igraph. Only the top 20 genes with the highest correlations were shown. Red circle: input gene, orange circle: cell metabolism gene, sky circle: other gene |
: Open all plots for all cancer types
 |
|
| ANGPTL5,C10orf90,CAPN11,CD2AP,CDC5L,CYP39A1,ENPP4, GPR111,NMRK2,LOC221442,LOC285501,LRRTM1,MOG,MRPS10, MUT,PFKFB2,PRUNE2,SLC29A1,SLC6A17,SYT14,UBR2 | ALCAM,ATP13A4,CEP128,CCDC57,CROT,DOPEY2,EML5, ESRRG,HMGCR,ITPR3,KIAA1244,LOC646471,MBOAT2,MOGAT2, NSUN2,PFKFB2,PXMP4,SLC38A1,STYK1,TMEM63C,ZCCHC6 |
 |
|
| ARHGEF11,RUSC1-AS1,CC2D1A,CES3,ENTPD5,GOLPH3L,KIAA1804, PFKFB2,PIK3C2B,PLEKHA6,PPARA,PPARGC1B,PPP1R15B,SEC16B, SGK2,SLC25A44,SULT1B1,TAF5L,TARS2,VPS45,ZNF774 | ABCC3,AFG3L2,ARFGEF2,ATP7B,ATP8A1,DNAJC16,ENTPD5, FRYL,GUF1,KDM7A,MED14,NBEAL1,PFKFB2,PLCE1, PLEKHH1,PRSS12,SAMD12,TET3,TMEM131,ZDHHC23,ZNF808 |


| * Co-Expression network figures were drawn using R package igraph. Only the top 20 genes with the highest correlations were shown. Red circle: input gene, orange circle: cell metabolism gene, sky circle: other gene |
: Open all plots for all cancer types
| Top |
: Open all interacting genes' information including KEGG pathway for all interacting genes from DAVID
| Top |
| Pharmacological Information for PFKFB2 |
| There's no related Drug. |
| Top |
| Cross referenced IDs for PFKFB2 |
| * We obtained these cross-references from Uniprot database. It covers 150 different DBs, 18 categories. http://www.uniprot.org/help/cross_references_section |
: Open all cross reference information
|
Copyright © 2016-Present - The Univsersity of Texas Health Science Center at Houston @ |