|
|||||||||||||||||||||||||||||||||||||||||||||||||||||||||||||||||||||||||||||||||||||||||||||||||||||||||||||||||||||||||||||||||||||||||||||||||||||||||||||||||||||||||||||||||||||||||||||||||||||||||||||||||||||||||||||||||||||||||||||||||||||||||||||||||||||||||||||||||||||||||||||||||||||||||||||||||||||||||||||||||||||||||||||||||||
| |
| Phenotypic Information (metabolism pathway, cancer, disease, phenome) |
| |
| |
| Gene-Gene Network Information: Co-Expression Network, Interacting Genes & KEGG |
| |
|


| Gene Summary for PFKM |
| Basic gene info. | Gene symbol | PFKM |
| Gene name | phosphofructokinase, muscle | |
| Synonyms | ATP-PFK|GSD7|PFK-1|PFK1|PFKA|PFKX|PPP1R122 | |
| Cytomap | UCSC genome browser: 12q13.3 | |
| Genomic location | chr12 :48513012-48540187 | |
| Type of gene | protein-coding | |
| RefGenes | NM_000289.5, NM_001166686.1,NM_001166687.1,NM_001166688.1, | |
| Ensembl id | ENSG00000152556 | |
| Description | 6-phosphofructo-1-kinase6-phosphofructokinase type A6-phosphofructokinase, muscle typeATP-PFKATP-dependent 6-phosphofructokinase, muscle typePFK-Aphosphofructo-1-kinase isozyme Aphosphofructokinase 1phosphofructokinase, polypeptide Xphosphofructo | |
| Modification date | 20141207 | |
| dbXrefs | MIM : 610681 | |
| HGNC : HGNC | ||
| Ensembl : ENSG00000152556 | ||
| HPRD : 01988 | ||
| Vega : OTTHUMG00000169898 | ||
| Protein | UniProt: go to UniProt's Cross Reference DB Table | |
| Expression | CleanEX: HS_PFKM | |
| BioGPS: 5213 | ||
| Gene Expression Atlas: ENSG00000152556 | ||
| The Human Protein Atlas: ENSG00000152556 | ||
| Pathway | NCI Pathway Interaction Database: PFKM | |
| KEGG: PFKM | ||
| REACTOME: PFKM | ||
| ConsensusPathDB | ||
| Pathway Commons: PFKM | ||
| Metabolism | MetaCyc: PFKM | |
| HUMANCyc: PFKM | ||
| Regulation | Ensembl's Regulation: ENSG00000152556 | |
| miRBase: chr12 :48,513,012-48,540,187 | ||
| TargetScan: NM_000289 | ||
| cisRED: ENSG00000152556 | ||
| Context | iHOP: PFKM | |
| cancer metabolism search in PubMed: PFKM | ||
| UCL Cancer Institute: PFKM | ||
| Assigned class in ccmGDB | C | |
| Top |
| Phenotypic Information for PFKM(metabolism pathway, cancer, disease, phenome) |
| Cancer | CGAP: PFKM |
| Familial Cancer Database: PFKM | |
| * This gene is included in those cancer gene databases. |
|
|
|
|
|
|
| |||||||||||||||||||||||||||||||||||||||||||||||||||||||||||||||||||||||||||||||||||||||||||||||||||||||||||||||||||||||||||||||||||||||||||||||||||||||||||||||||||||||||||||||||||||||||||||||||||||||||||||||||||||||||||||||||||||||||||||||||||||||||||||||||||||||||||||||||||||||||||||||||||||||||||||||||||||||||||||||||||||||||||||
Oncogene 1 | Significant driver gene in | ||||||||||||||||||||||||||||||||||||||||||||||||||||||||||||||||||||||||||||||||||||||||||||||||||||||||||||||||||||||||||||||||||||||||||||||||||||||||||||||||||||||||||||||||||||||||||||||||||||||||||||||||||||||||||||||||||||||||||||||||||||||||||||||||||||||||||||||||||||||||||||||||||||||||||||||||||||||||||||||||||||||||||||||||||
| cf) number; DB name 1 Oncogene; http://nar.oxfordjournals.org/content/35/suppl_1/D721.long, 2 Tumor Suppressor gene; https://bioinfo.uth.edu/TSGene/, 3 Cancer Gene Census; http://www.nature.com/nrc/journal/v4/n3/abs/nrc1299.html, 4 CancerGenes; http://nar.oxfordjournals.org/content/35/suppl_1/D721.long, 5 Network of Cancer Gene; http://ncg.kcl.ac.uk/index.php, 1Therapeutic Vulnerabilities in Cancer; http://cbio.mskcc.org/cancergenomics/statius/ |
| KEGG_GLYCOLYSIS_GLUCONEOGENESIS KEGG_FRUCTOSE_AND_MANNOSE_METABOLISM KEGG_GALACTOSE_METABOLISM REACTOME_METABOLISM_OF_CARBOHYDRATES REACTOME_GLUCOSE_METABOLISM | |
| OMIM | |
| Orphanet | |
| Disease | KEGG Disease: PFKM |
| MedGen: PFKM (Human Medical Genetics with Condition) | |
| ClinVar: PFKM | |
| Phenotype | MGI: PFKM (International Mouse Phenotyping Consortium) |
| PhenomicDB: PFKM | |
| Mutations for PFKM |
| * Under tables are showing count per each tissue to give us broad intuition about tissue specific mutation patterns.You can go to the detailed page for each mutation database's web site. |
| - Statistics for Tissue and Mutation type | Top |
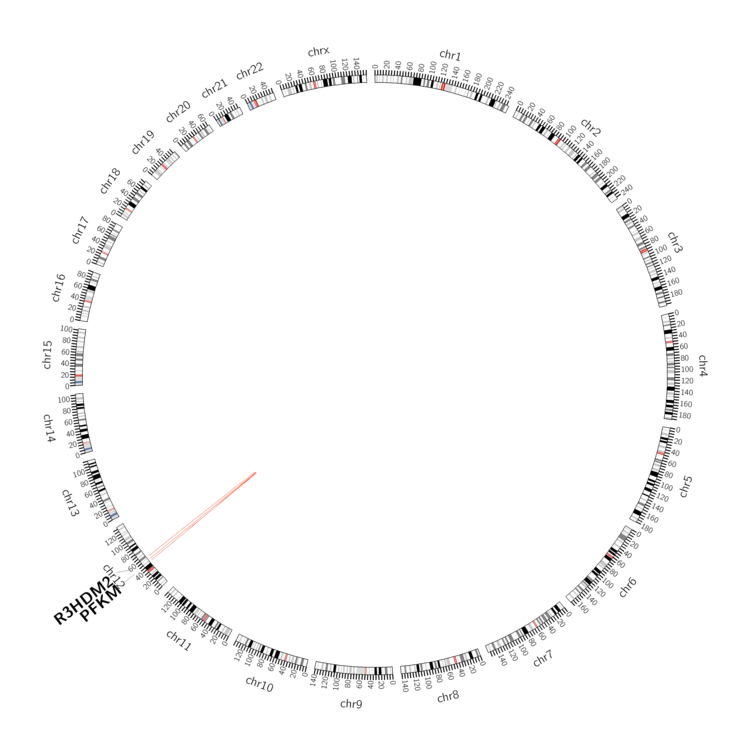 |
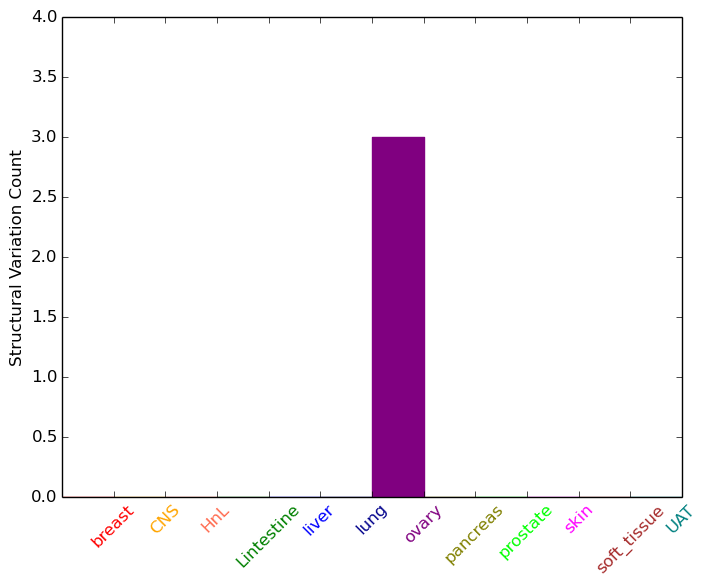
| - For Inter-chromosomal Variations |
| There's no inter-chromosomal structural variation. |
| - For Intra-chromosomal Variations |
| * Intra-chromosomal variantions includes 'intrachromosomal amplicon to amplicon', 'intrachromosomal amplicon to non-amplified dna', 'intrachromosomal deletion', 'intrachromosomal fold-back inversion', 'intrachromosomal inversion', 'intrachromosomal tandem duplication', 'Intrachromosomal unknown type', 'intrachromosomal with inverted orientation', 'intrachromosomal with non-inverted orientation'. |
 |
| Sample | Symbol_a | Chr_a | Start_a | End_a | Symbol_b | Chr_b | Start_b | End_b |
| ovary | PFKM | chr12 | 48518784 | 48518804 | PFKM | chr12 | 48520305 | 48520325 |
| ovary | PFKM | chr12 | 48532507 | 48532527 | R3HDM2 | chr12 | 57663234 | 57663254 |
| ovary | PFKM | chr12 | 48534457 | 48534477 | chr12 | 52253952 | 52253972 |
| cf) Tissue number; Tissue name (1;Breast, 2;Central_nervous_system, 3;Haematopoietic_and_lymphoid_tissue, 4;Large_intestine, 5;Liver, 6;Lung, 7;Ovary, 8;Pancreas, 9;Prostate, 10;Skin, 11;Soft_tissue, 12;Upper_aerodigestive_tract) |
| * From mRNA Sanger sequences, Chitars2.0 arranged chimeric transcripts. This table shows PFKM related fusion information. |
| ID | Head Gene | Tail Gene | Accession | Gene_a | qStart_a | qEnd_a | Chromosome_a | tStart_a | tEnd_a | Gene_a | qStart_a | qEnd_a | Chromosome_a | tStart_a | tEnd_a |
| DA077791 | TUBA1B | 1 | 99 | 12 | 49525080 | 49525178 | PFKM | 98 | 502 | 12 | 48531503 | 48534653 | |
| DA368227 | PHLDA3 | 1 | 100 | 1 | 201438246 | 201438345 | PFKM | 99 | 570 | 12 | 48533074 | 48535735 | |
| BX537703 | PFKM | 1 | 108 | 12 | 48535350 | 48535457 | PFKM | 101 | 4630 | 12 | 48535108 | 48539887 | |
| Top |
| Mutation type/ Tissue ID | brca | cns | cerv | endome | haematopo | kidn | Lintest | liver | lung | ns | ovary | pancre | prost | skin | stoma | thyro | urina | |||
| Total # sample | 2 | |||||||||||||||||||
| GAIN (# sample) | 2 | |||||||||||||||||||
| LOSS (# sample) |
| cf) Tissue ID; Tissue type (1; Breast, 2; Central_nervous_system, 3; Cervix, 4; Endometrium, 5; Haematopoietic_and_lymphoid_tissue, 6; Kidney, 7; Large_intestine, 8; Liver, 9; Lung, 10; NS, 11; Ovary, 12; Pancreas, 13; Prostate, 14; Skin, 15; Stomach, 16; Thyroid, 17; Urinary_tract) |
| Top |
|
 |
| Top |
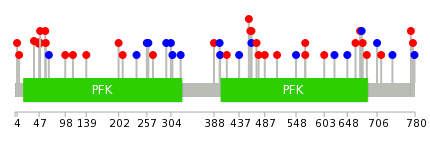
| Stat. for Non-Synonymous SNVs (# total SNVs=53) | (# total SNVs=23) |
 |  |
(# total SNVs=0) | (# total SNVs=0) |
| Top |
| * When you move the cursor on each content, you can see more deailed mutation information on the Tooltip. Those are primary_site,primary_histology,mutation(aa),pubmedID. |
| GRCh37 position | Mutation(aa) | Unique sampleID count |
| chr12:48529111-48529111 | p.T294I | 2 |
| chr12:48534513-48534513 | p.S400S | 2 |
| chr12:48529142-48529142 | p.T304T | 2 |
| chr12:48534587-48534587 | p.I425T | 2 |
| chr12:48538878-48538878 | p.W686L | 2 |
| chr12:48534623-48534623 | p.H437L | 2 |
| chr12:48538894-48538894 | p.I691M | 2 |
| chr12:48531547-48531547 | p.G327E | 2 |
| chr12:48537853-48537853 | p.Y635Y | 2 |
| chr12:48526792-48526792 | p.T127P | 2 |
| Top |
|
 |
| Point Mutation/ Tissue ID | 1 | 2 | 3 | 4 | 5 | 6 | 7 | 8 | 9 | 10 | 11 | 12 | 13 | 14 | 15 | 16 | 17 | 18 | 19 | 20 |
| # sample | 4 | 1 | 5 | 1 | 1 | 1 | 1 | 3 | 7 | 2 | 1 | 3 | 7 | 8 | ||||||
| # mutation | 4 | 1 | 7 | 1 | 1 | 1 | 1 | 3 | 7 | 2 | 1 | 3 | 7 | 12 | ||||||
| nonsynonymous SNV | 2 | 5 | 1 | 1 | 3 | 5 | 1 | 1 | 1 | 4 | 8 | |||||||||
| synonymous SNV | 2 | 1 | 2 | 1 | 1 | 2 | 1 | 2 | 3 | 4 |
| cf) Tissue ID; Tissue type (1; BLCA[Bladder Urothelial Carcinoma], 2; BRCA[Breast invasive carcinoma], 3; CESC[Cervical squamous cell carcinoma and endocervical adenocarcinoma], 4; COAD[Colon adenocarcinoma], 5; GBM[Glioblastoma multiforme], 6; Glioma Low Grade, 7; HNSC[Head and Neck squamous cell carcinoma], 8; KICH[Kidney Chromophobe], 9; KIRC[Kidney renal clear cell carcinoma], 10; KIRP[Kidney renal papillary cell carcinoma], 11; LAML[Acute Myeloid Leukemia], 12; LUAD[Lung adenocarcinoma], 13; LUSC[Lung squamous cell carcinoma], 14; OV[Ovarian serous cystadenocarcinoma ], 15; PAAD[Pancreatic adenocarcinoma], 16; PRAD[Prostate adenocarcinoma], 17; SKCM[Skin Cutaneous Melanoma], 18:STAD[Stomach adenocarcinoma], 19:THCA[Thyroid carcinoma], 20:UCEC[Uterine Corpus Endometrial Carcinoma]) |
| Top |
| * We represented just top 10 SNVs. When you move the cursor on each content, you can see more deailed mutation information on the Tooltip. Those are primary_site, primary_histology, mutation(aa), pubmedID. |
| Genomic Position | Mutation(aa) | Unique sampleID count |
| chr12:48524199 | p.R47S,PFKM | 2 |
| chr12:48536608 | p.R566L,PFKM | 2 |
| chr12:48501950 | p.A8P,PFKM | 1 |
| chr12:48536719 | p.G399G,PFKM | 1 |
| chr12:48528758 | p.G648G,PFKM | 1 |
| chr12:48539462 | p.S400S,PFKM | 1 |
| chr12:48535119 | p.Q664L,PFKM | 1 |
| chr12:48501970 | p.R98Q,PFKM | 1 |
| chr12:48537586 | p.A413T,PFKM | 1 |
| chr12:48528785 | p.R673M,PFKM | 1 |
| * Copy number data were extracted from TCGA using R package TCGA-Assembler. The URLs of all public data files on TCGA DCC data server were gathered on Jan-05-2015. Function ProcessCNAData in TCGA-Assembler package was used to obtain gene-level copy number value which is calculated as the average copy number of the genomic region of a gene. |
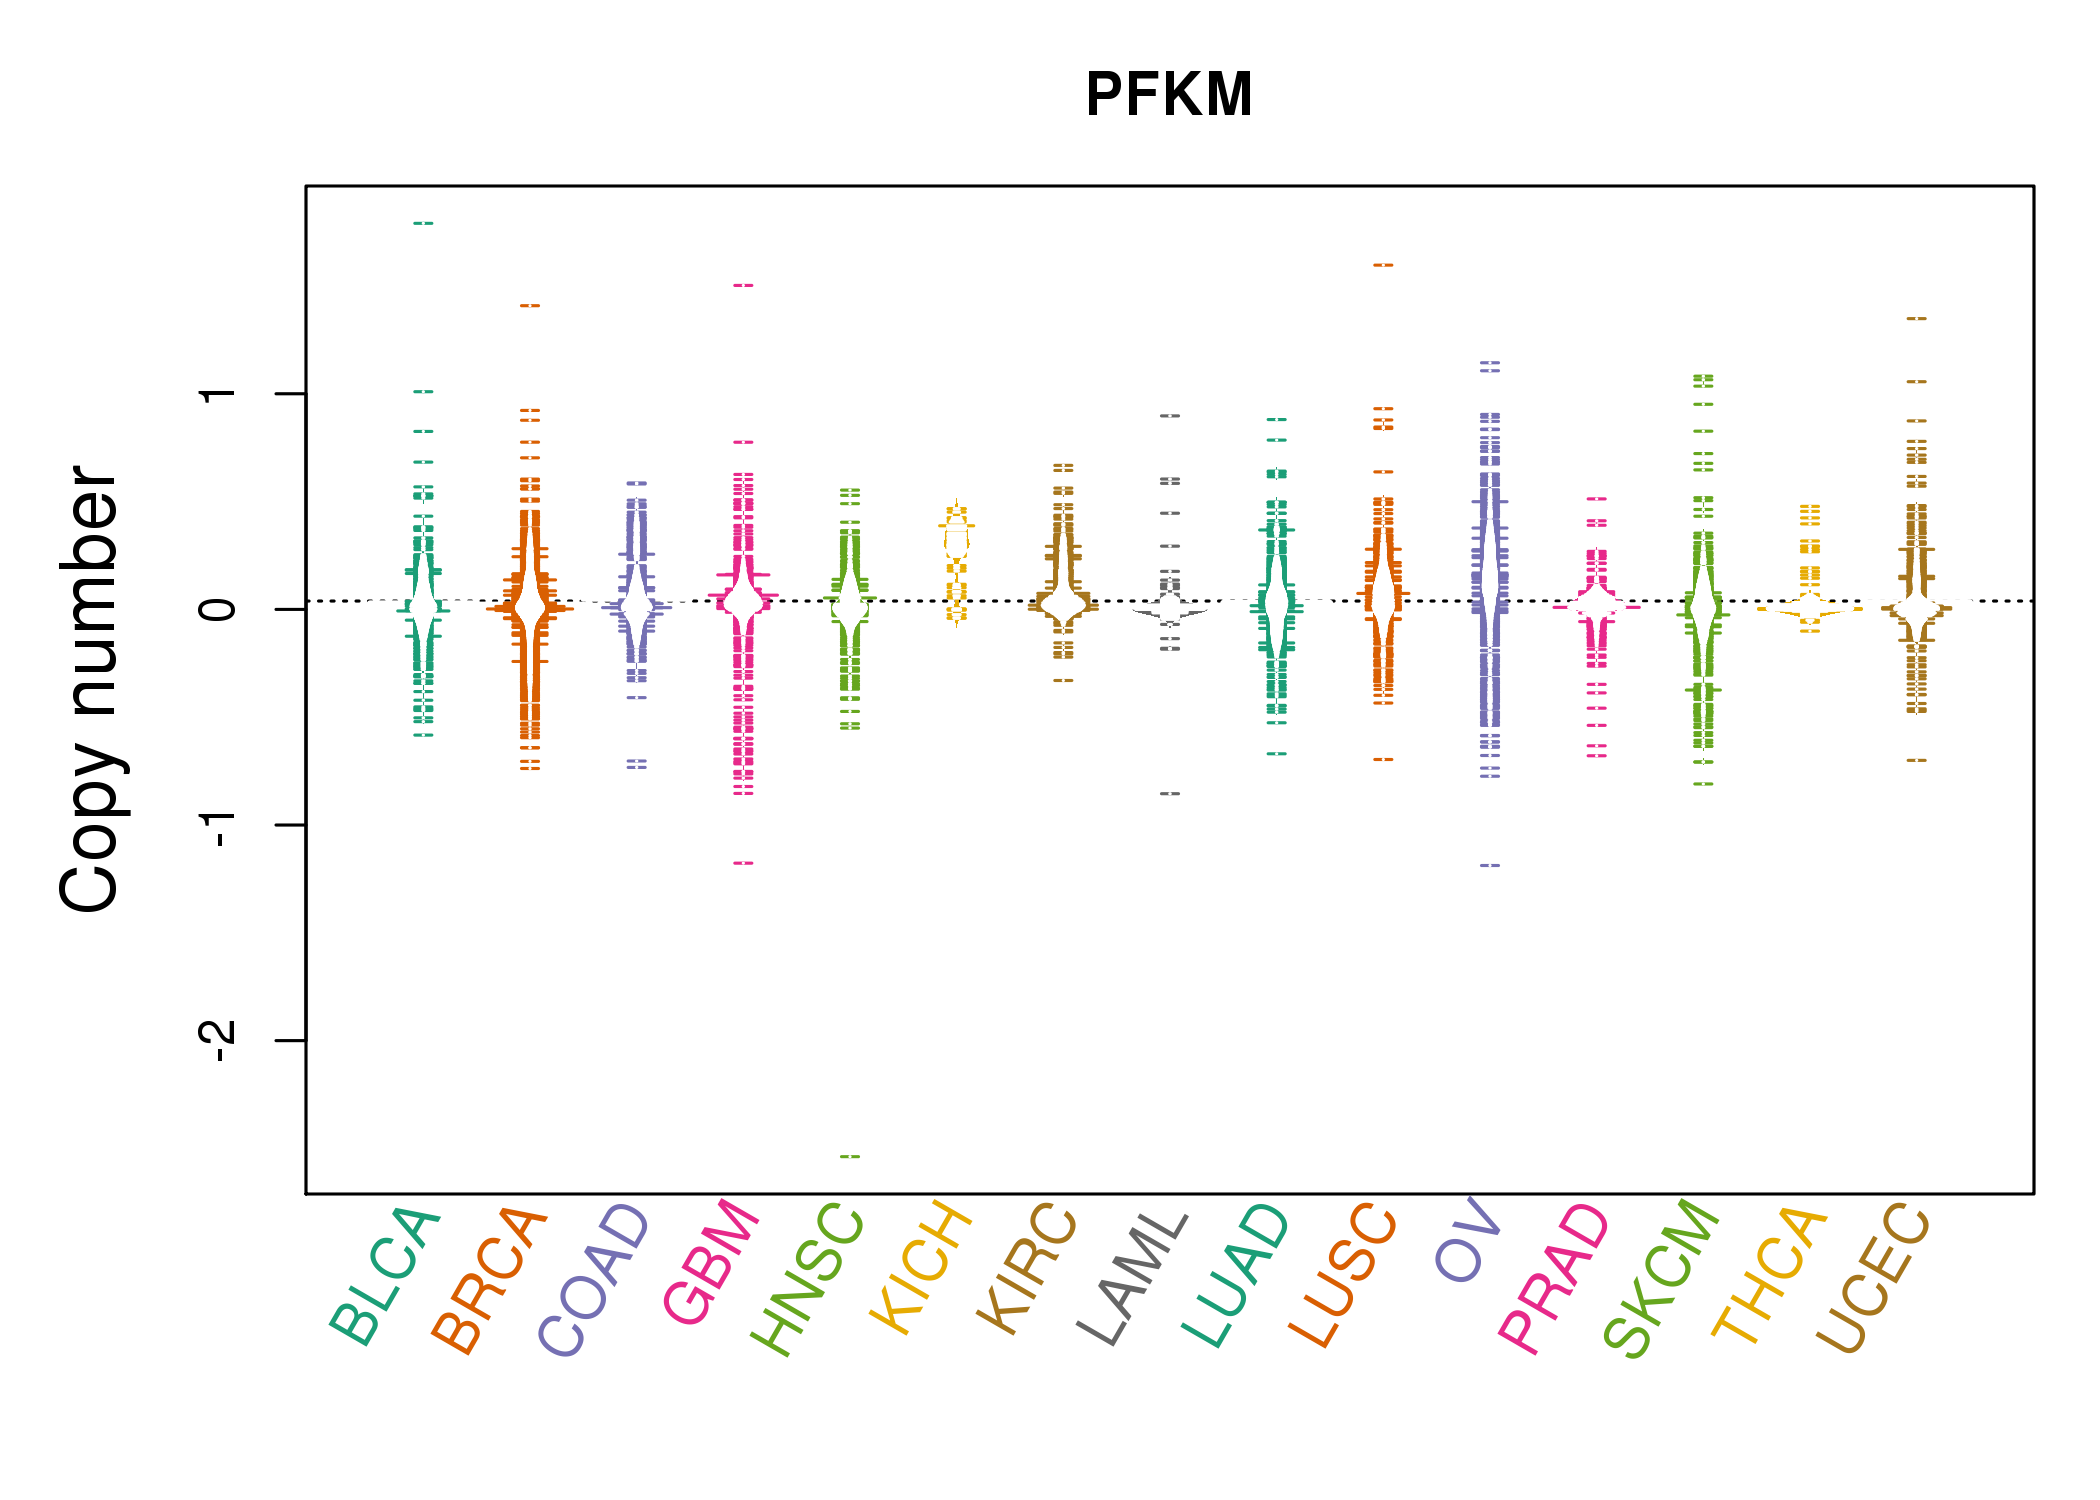 |
| cf) Tissue ID[Tissue type]: BLCA[Bladder Urothelial Carcinoma], BRCA[Breast invasive carcinoma], CESC[Cervical squamous cell carcinoma and endocervical adenocarcinoma], COAD[Colon adenocarcinoma], GBM[Glioblastoma multiforme], Glioma Low Grade, HNSC[Head and Neck squamous cell carcinoma], KICH[Kidney Chromophobe], KIRC[Kidney renal clear cell carcinoma], KIRP[Kidney renal papillary cell carcinoma], LAML[Acute Myeloid Leukemia], LUAD[Lung adenocarcinoma], LUSC[Lung squamous cell carcinoma], OV[Ovarian serous cystadenocarcinoma ], PAAD[Pancreatic adenocarcinoma], PRAD[Prostate adenocarcinoma], SKCM[Skin Cutaneous Melanoma], STAD[Stomach adenocarcinoma], THCA[Thyroid carcinoma], UCEC[Uterine Corpus Endometrial Carcinoma] |
| Top |
| Gene Expression for PFKM |
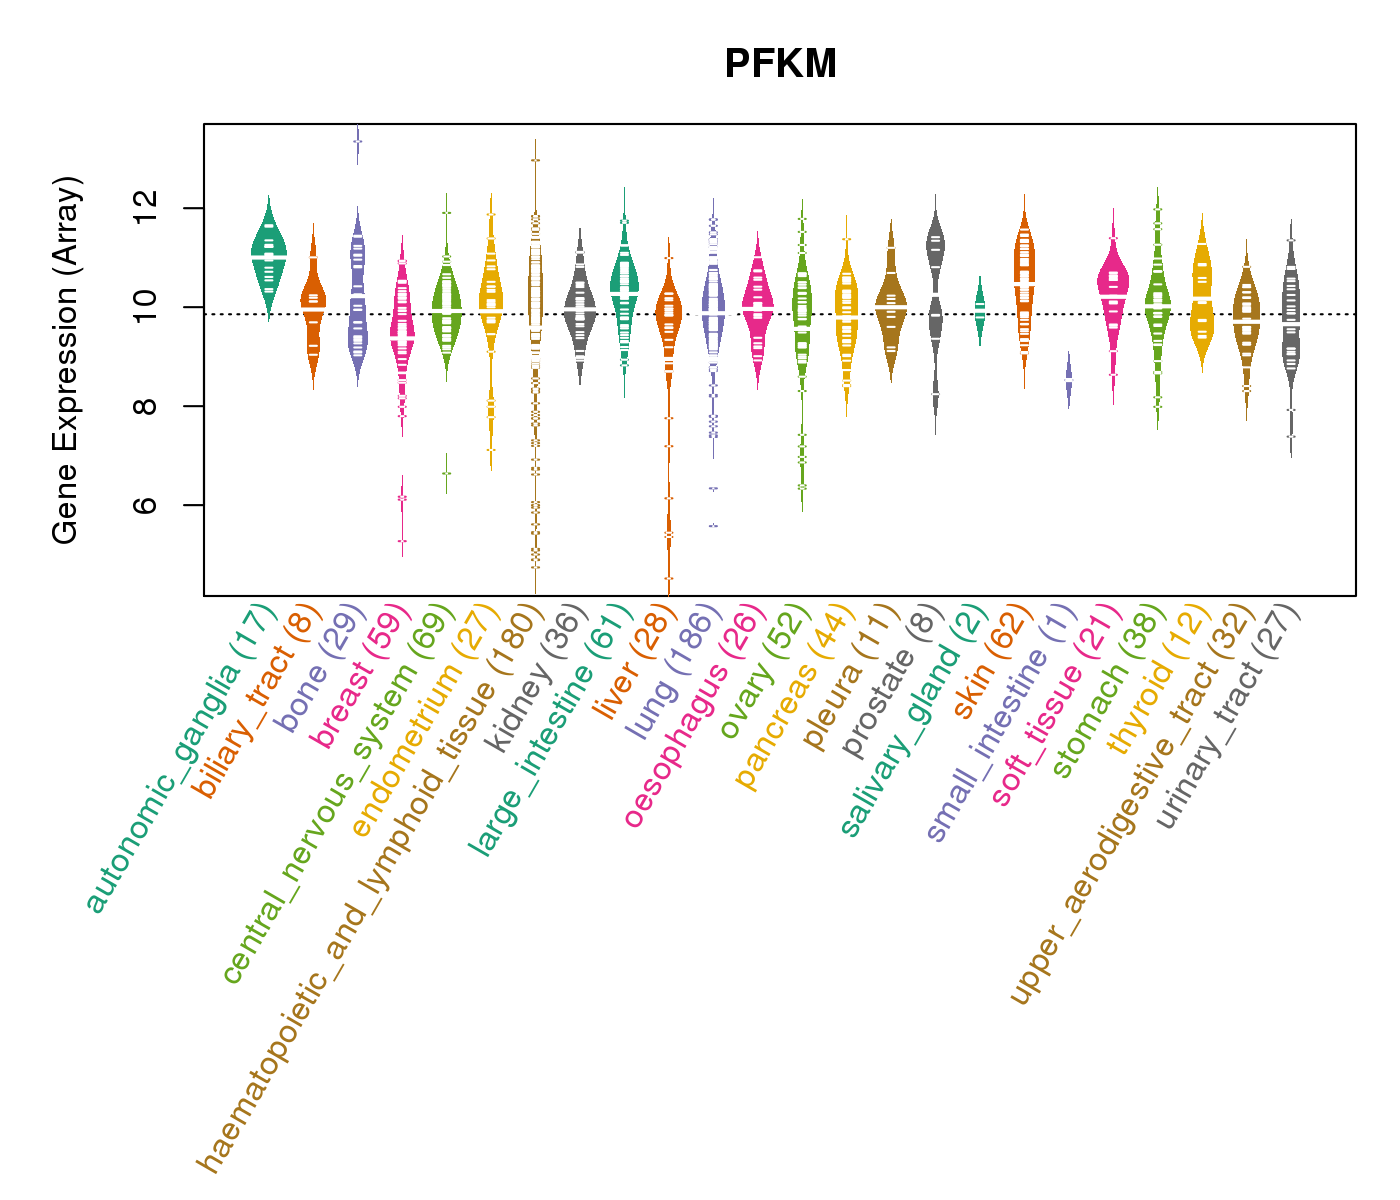
| * CCLE gene expression data were extracted from CCLE_Expression_Entrez_2012-10-18.res: Gene-centric RMA-normalized mRNA expression data. |
 |
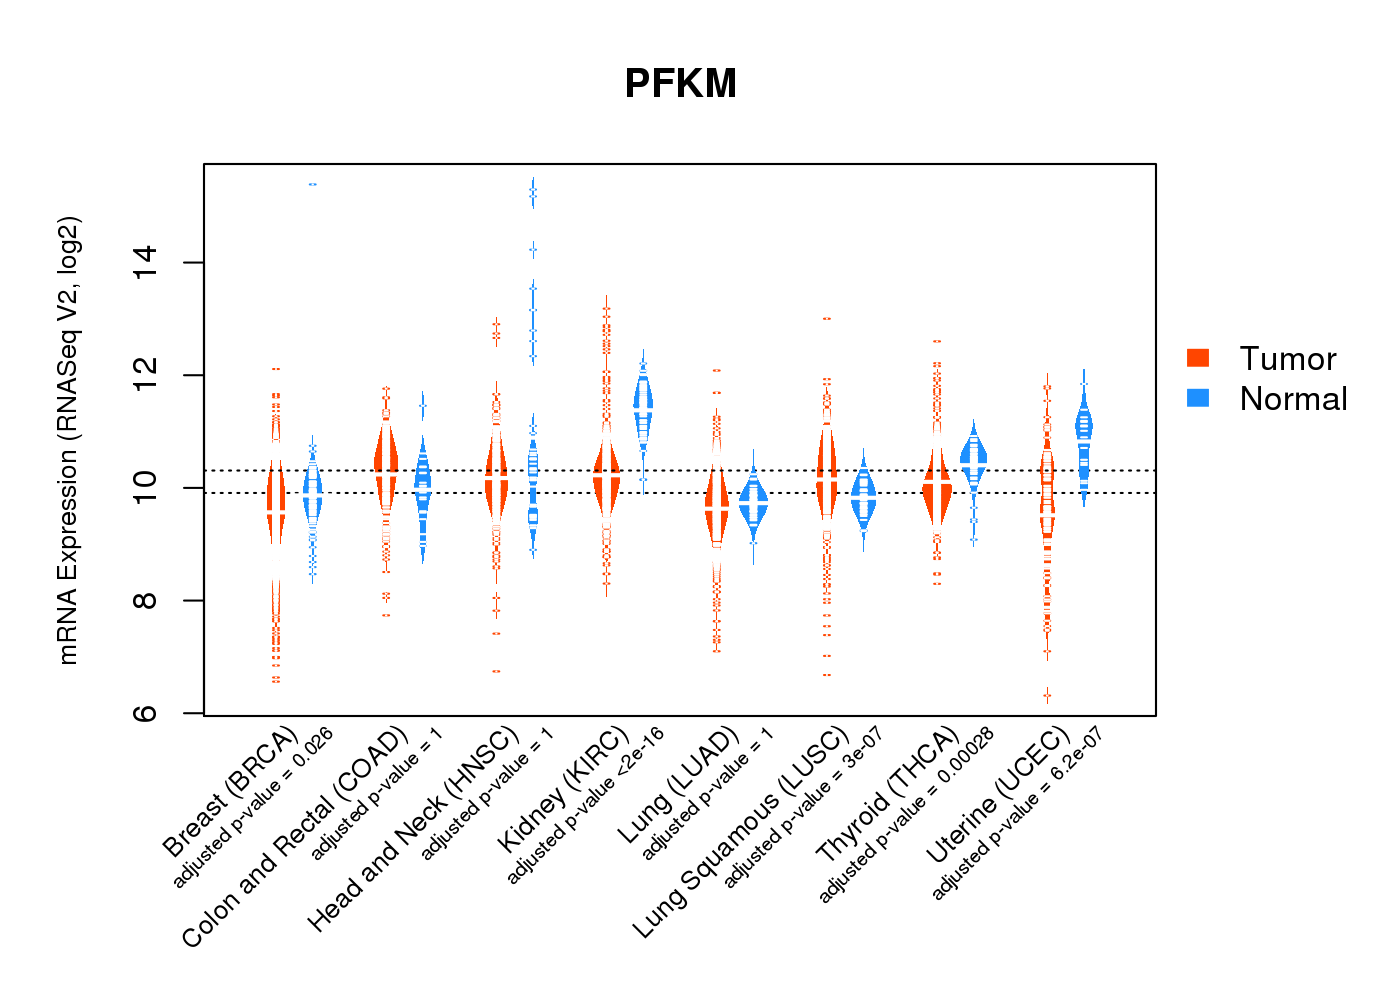
| * Normalized gene expression data of RNASeqV2 was extracted from TCGA using R package TCGA-Assembler. The URLs of all public data files on TCGA DCC data server were gathered at Jan-05-2015. Only eight cancer types have enough normal control samples for differential expression analysis. (t test, adjusted p<0.05 (using Benjamini-Hochberg FDR)) |
 |
| Top |
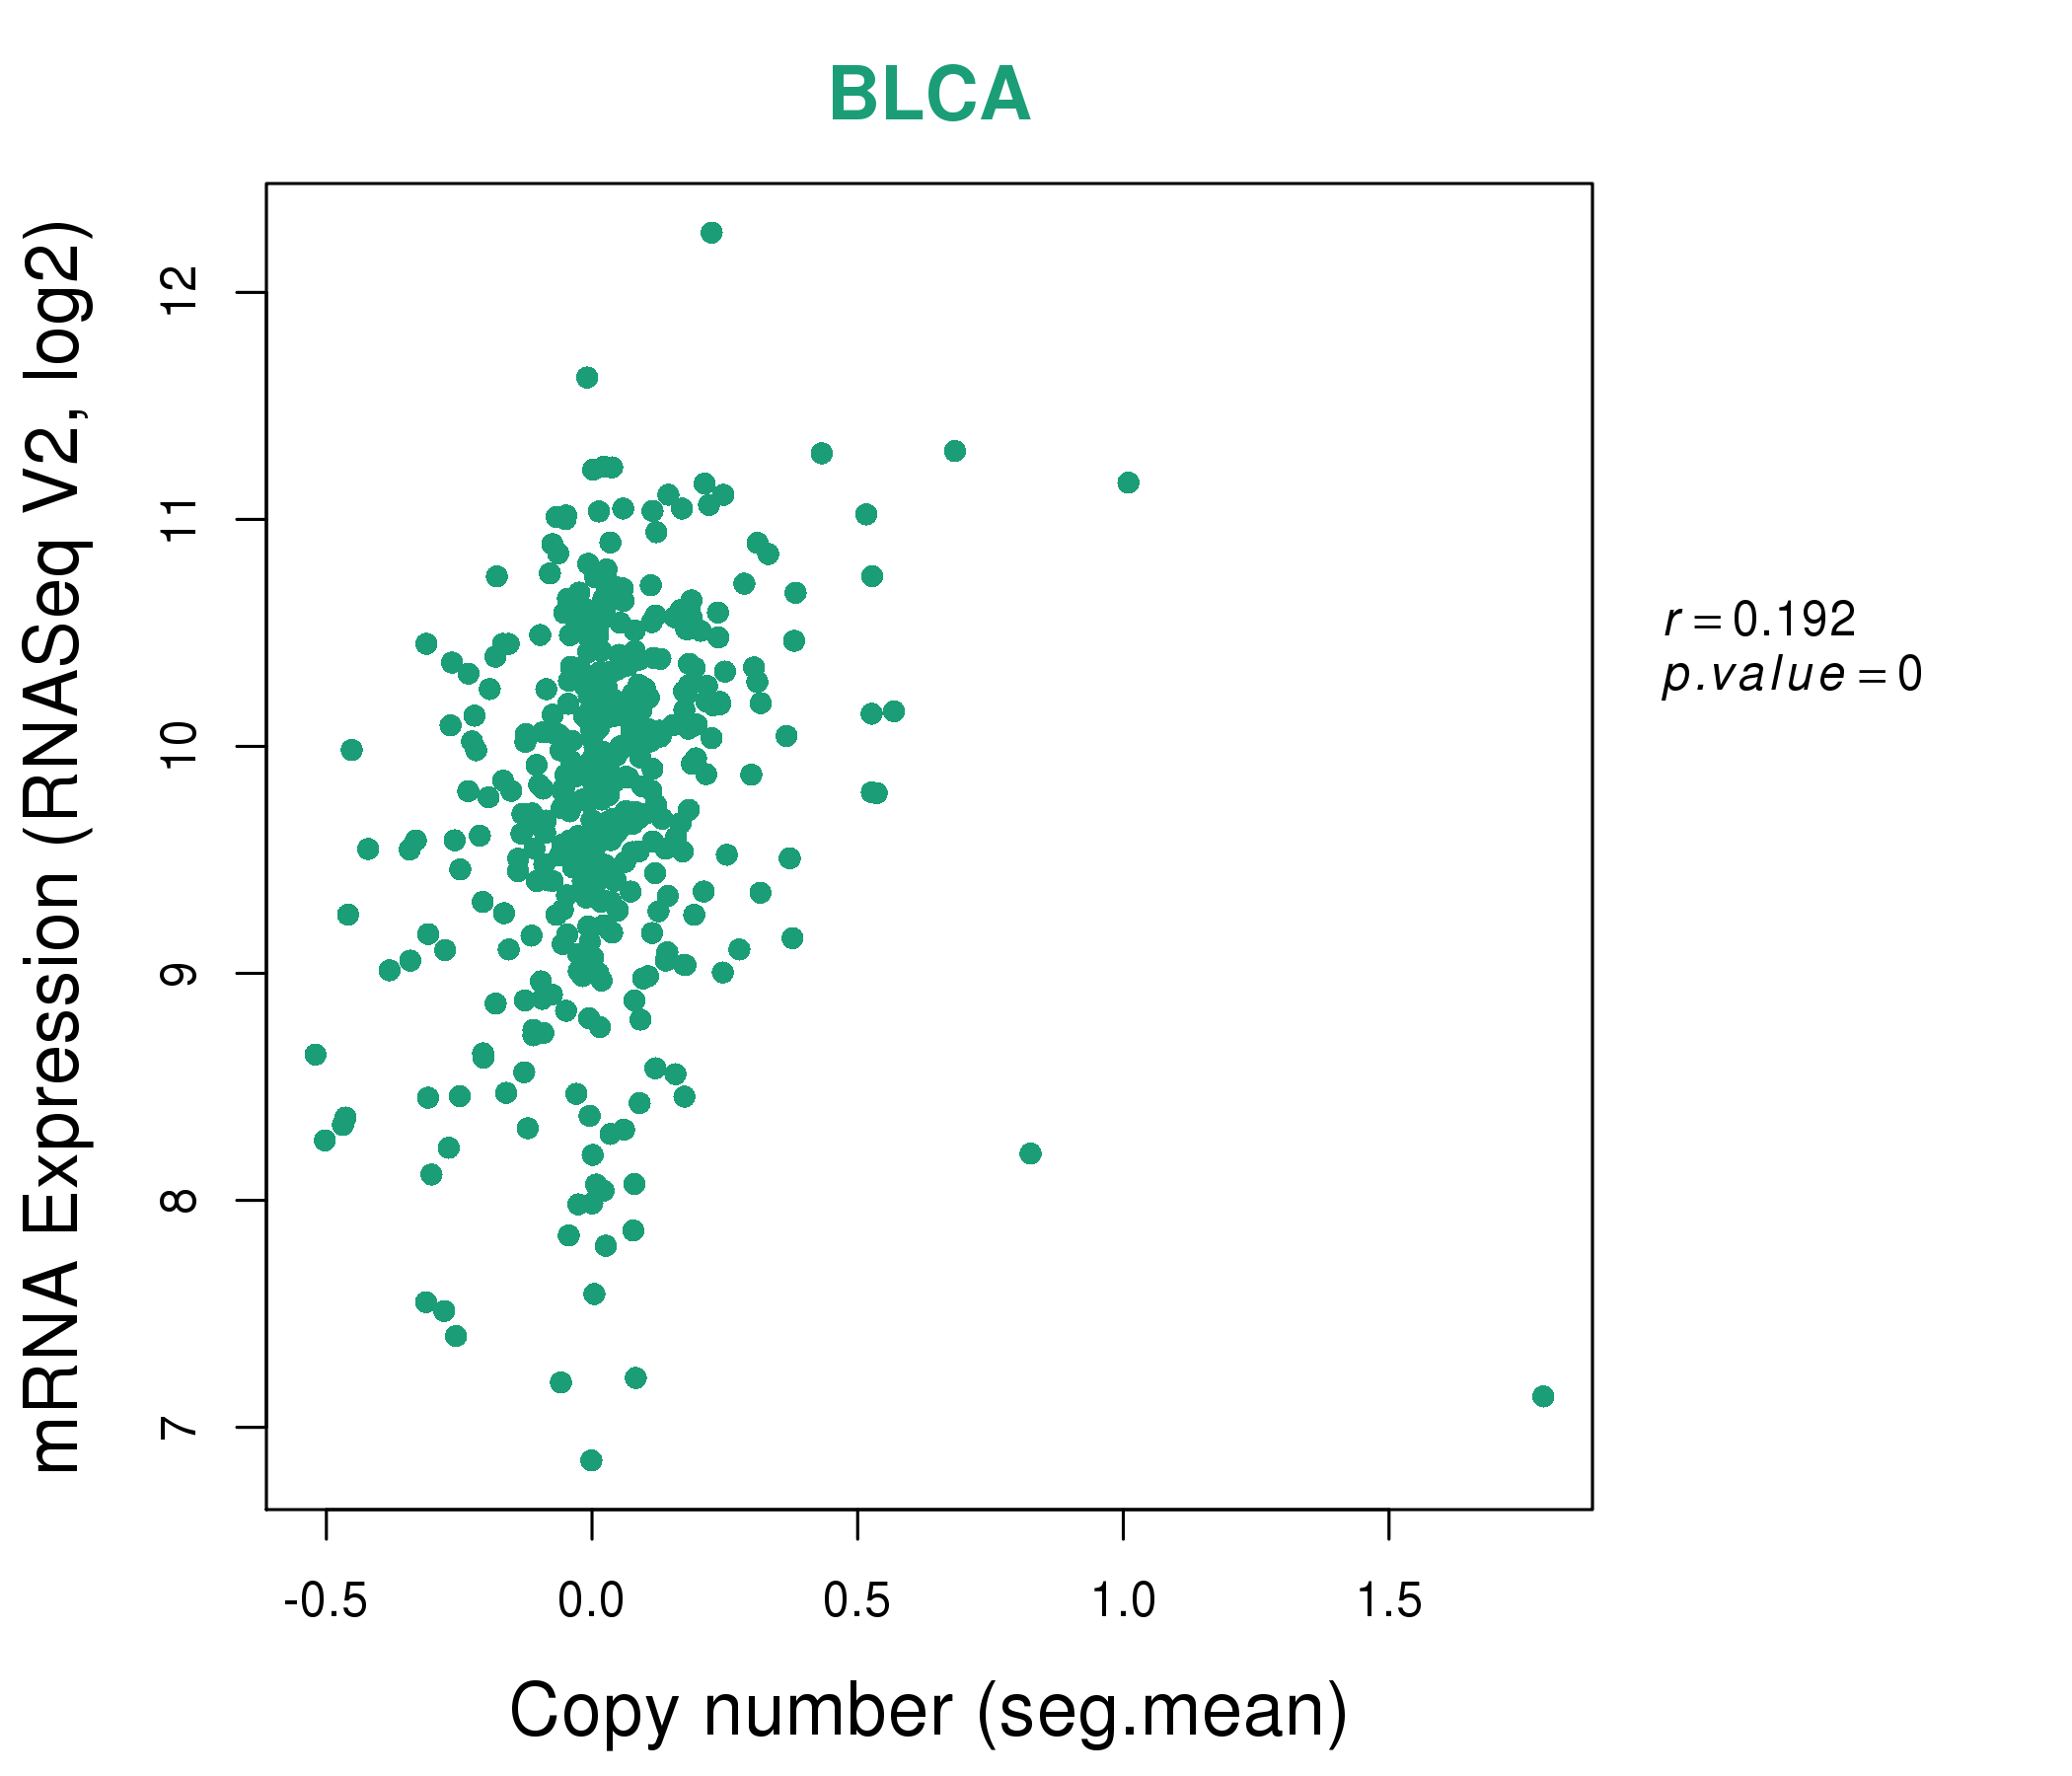
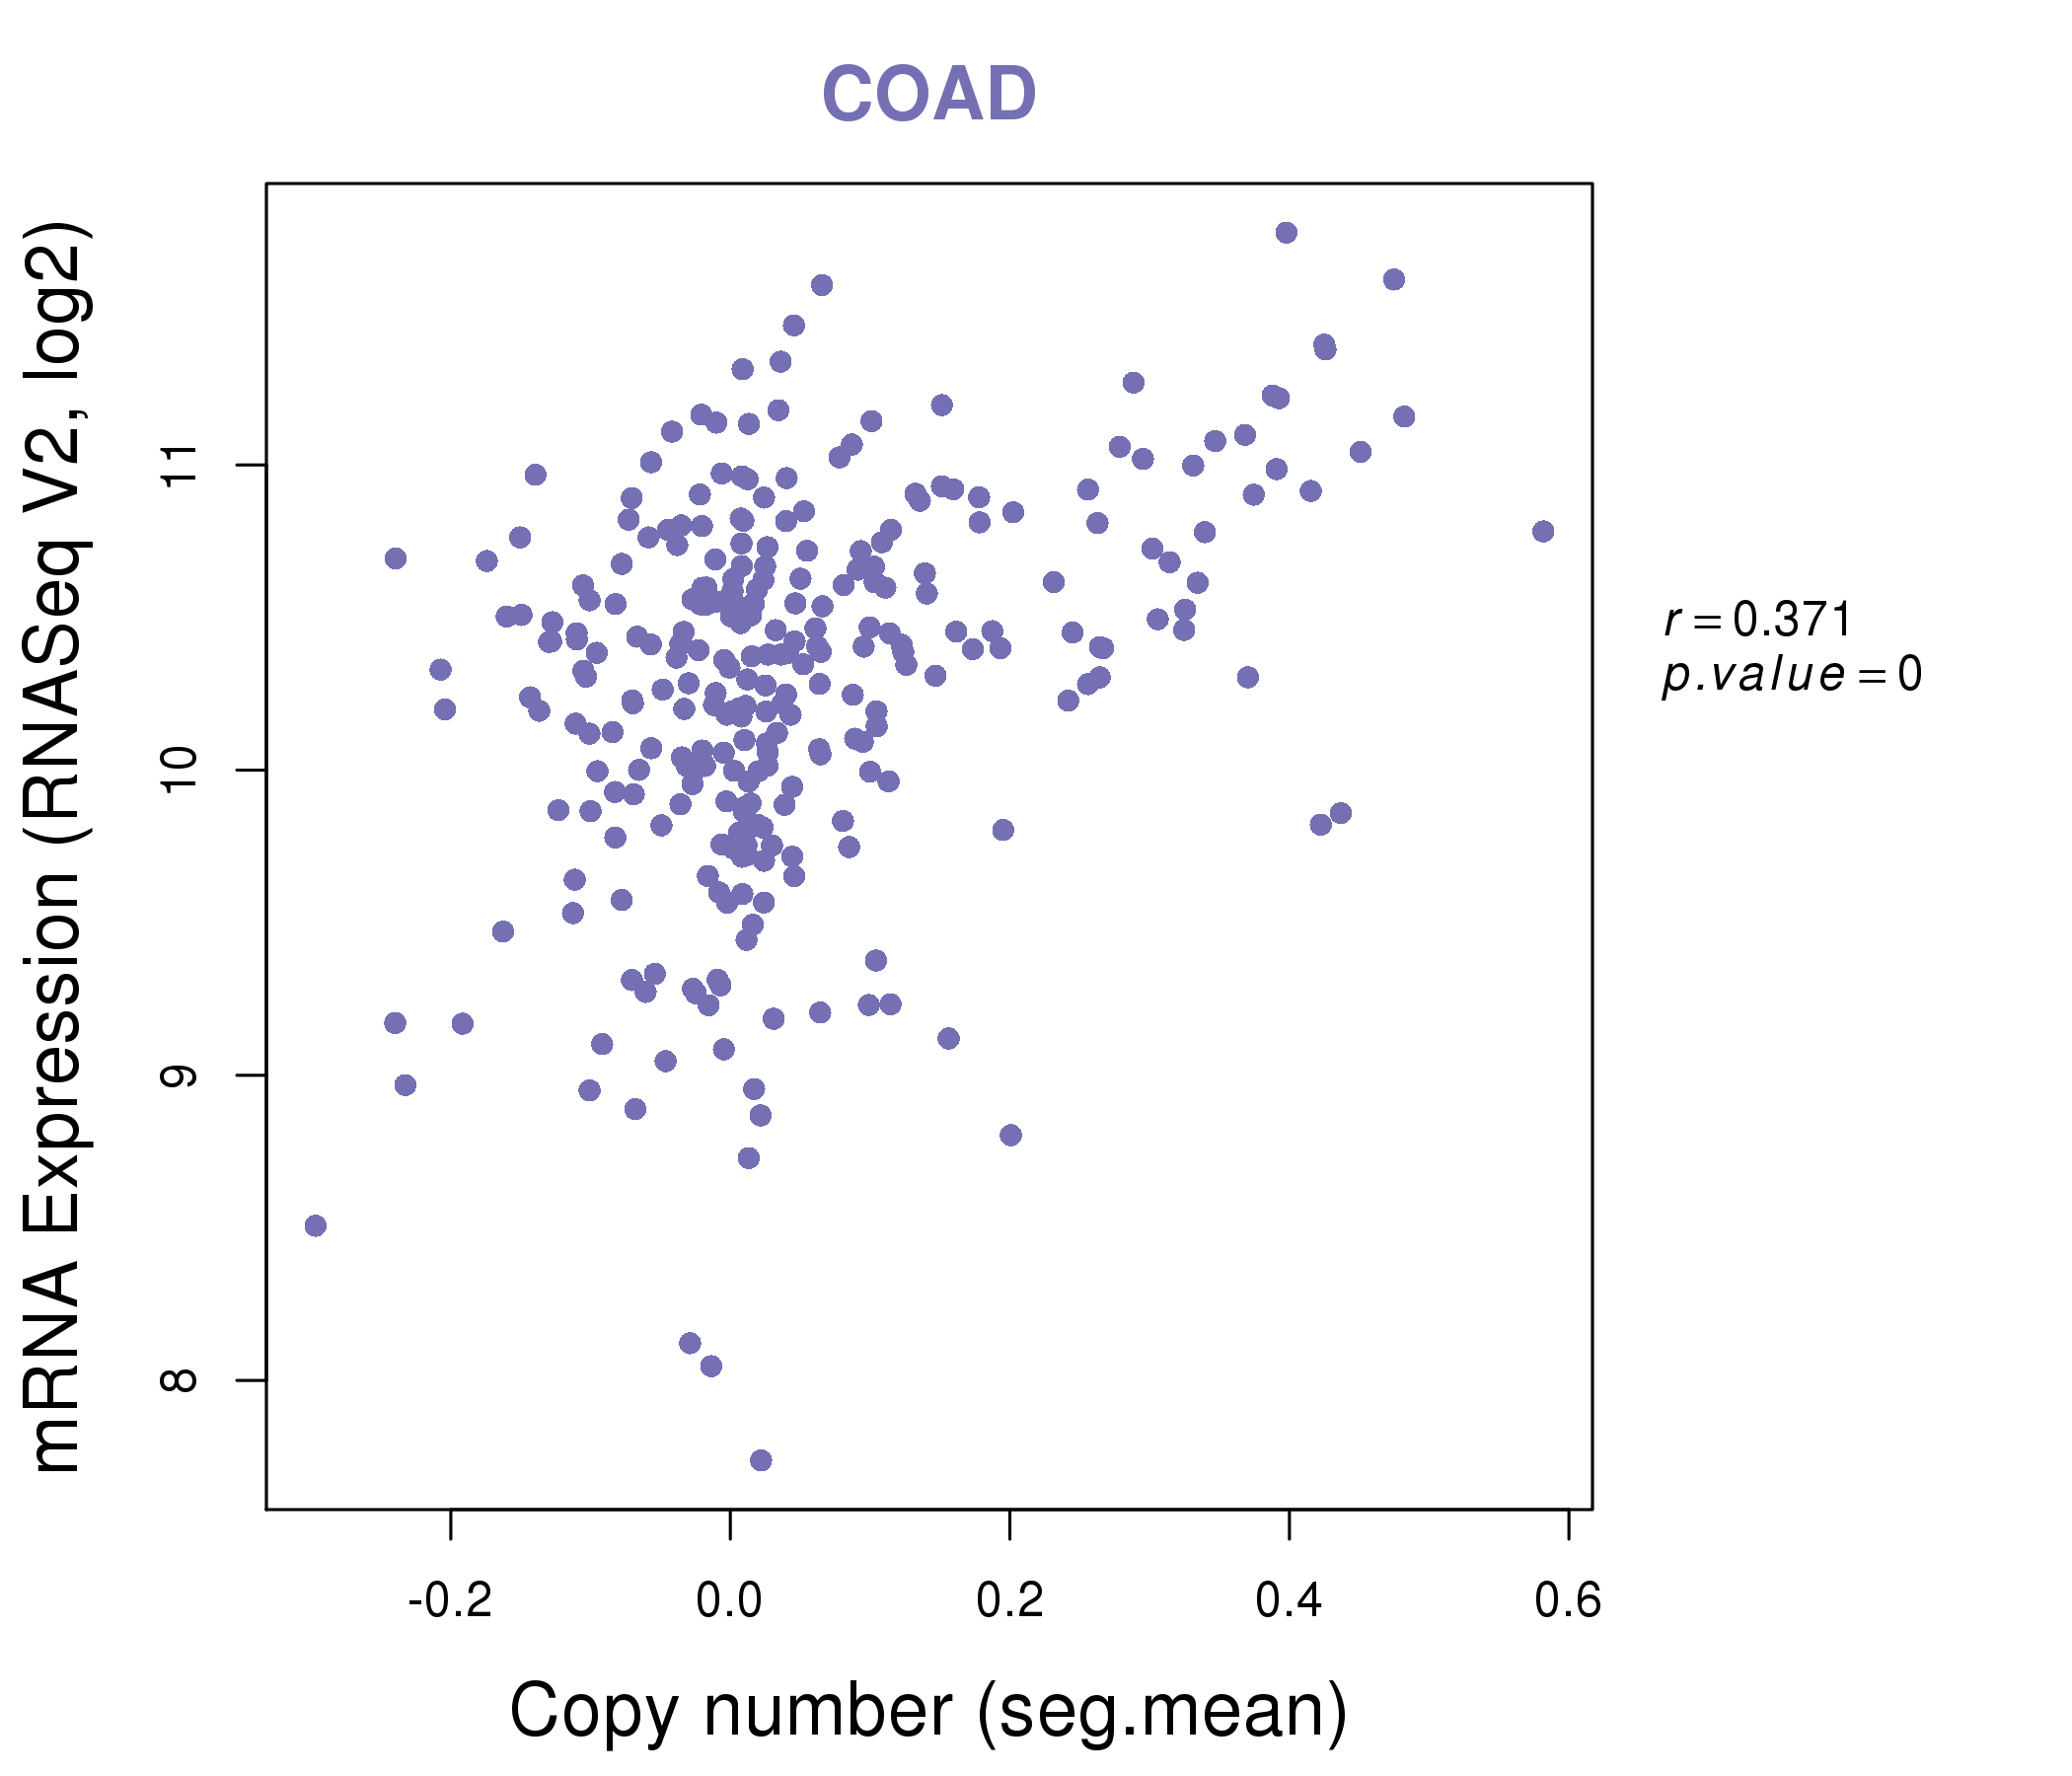
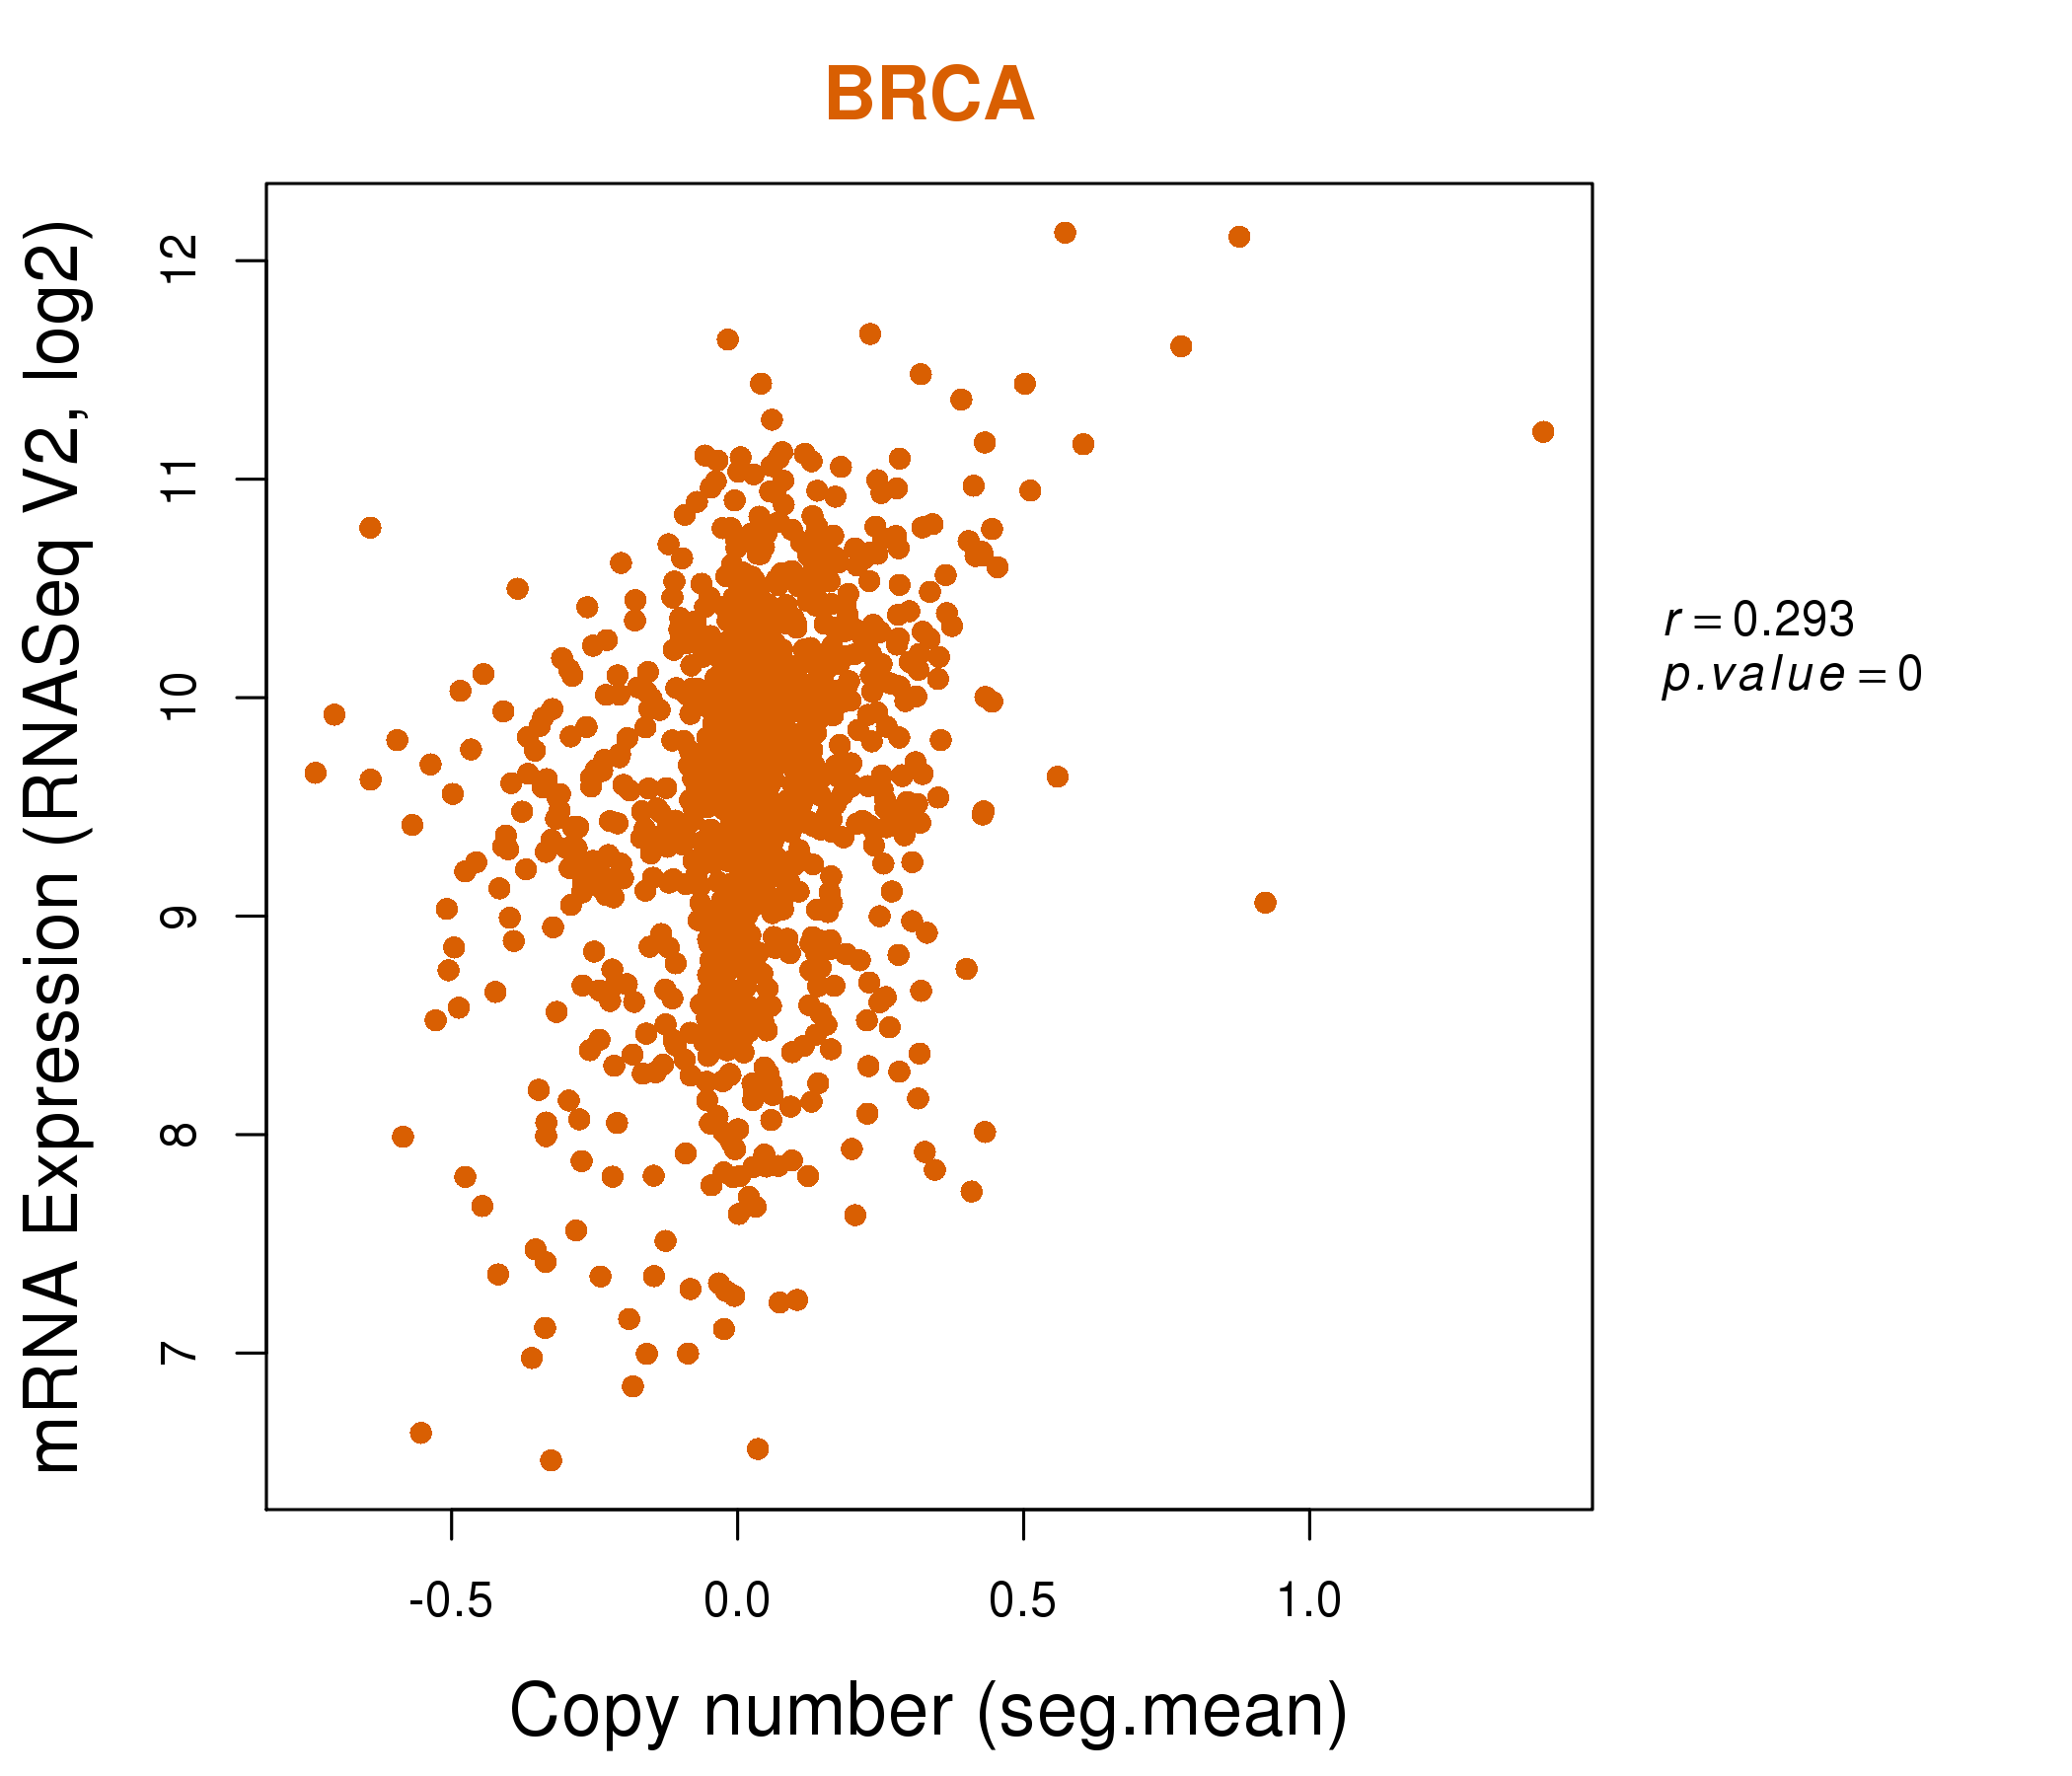
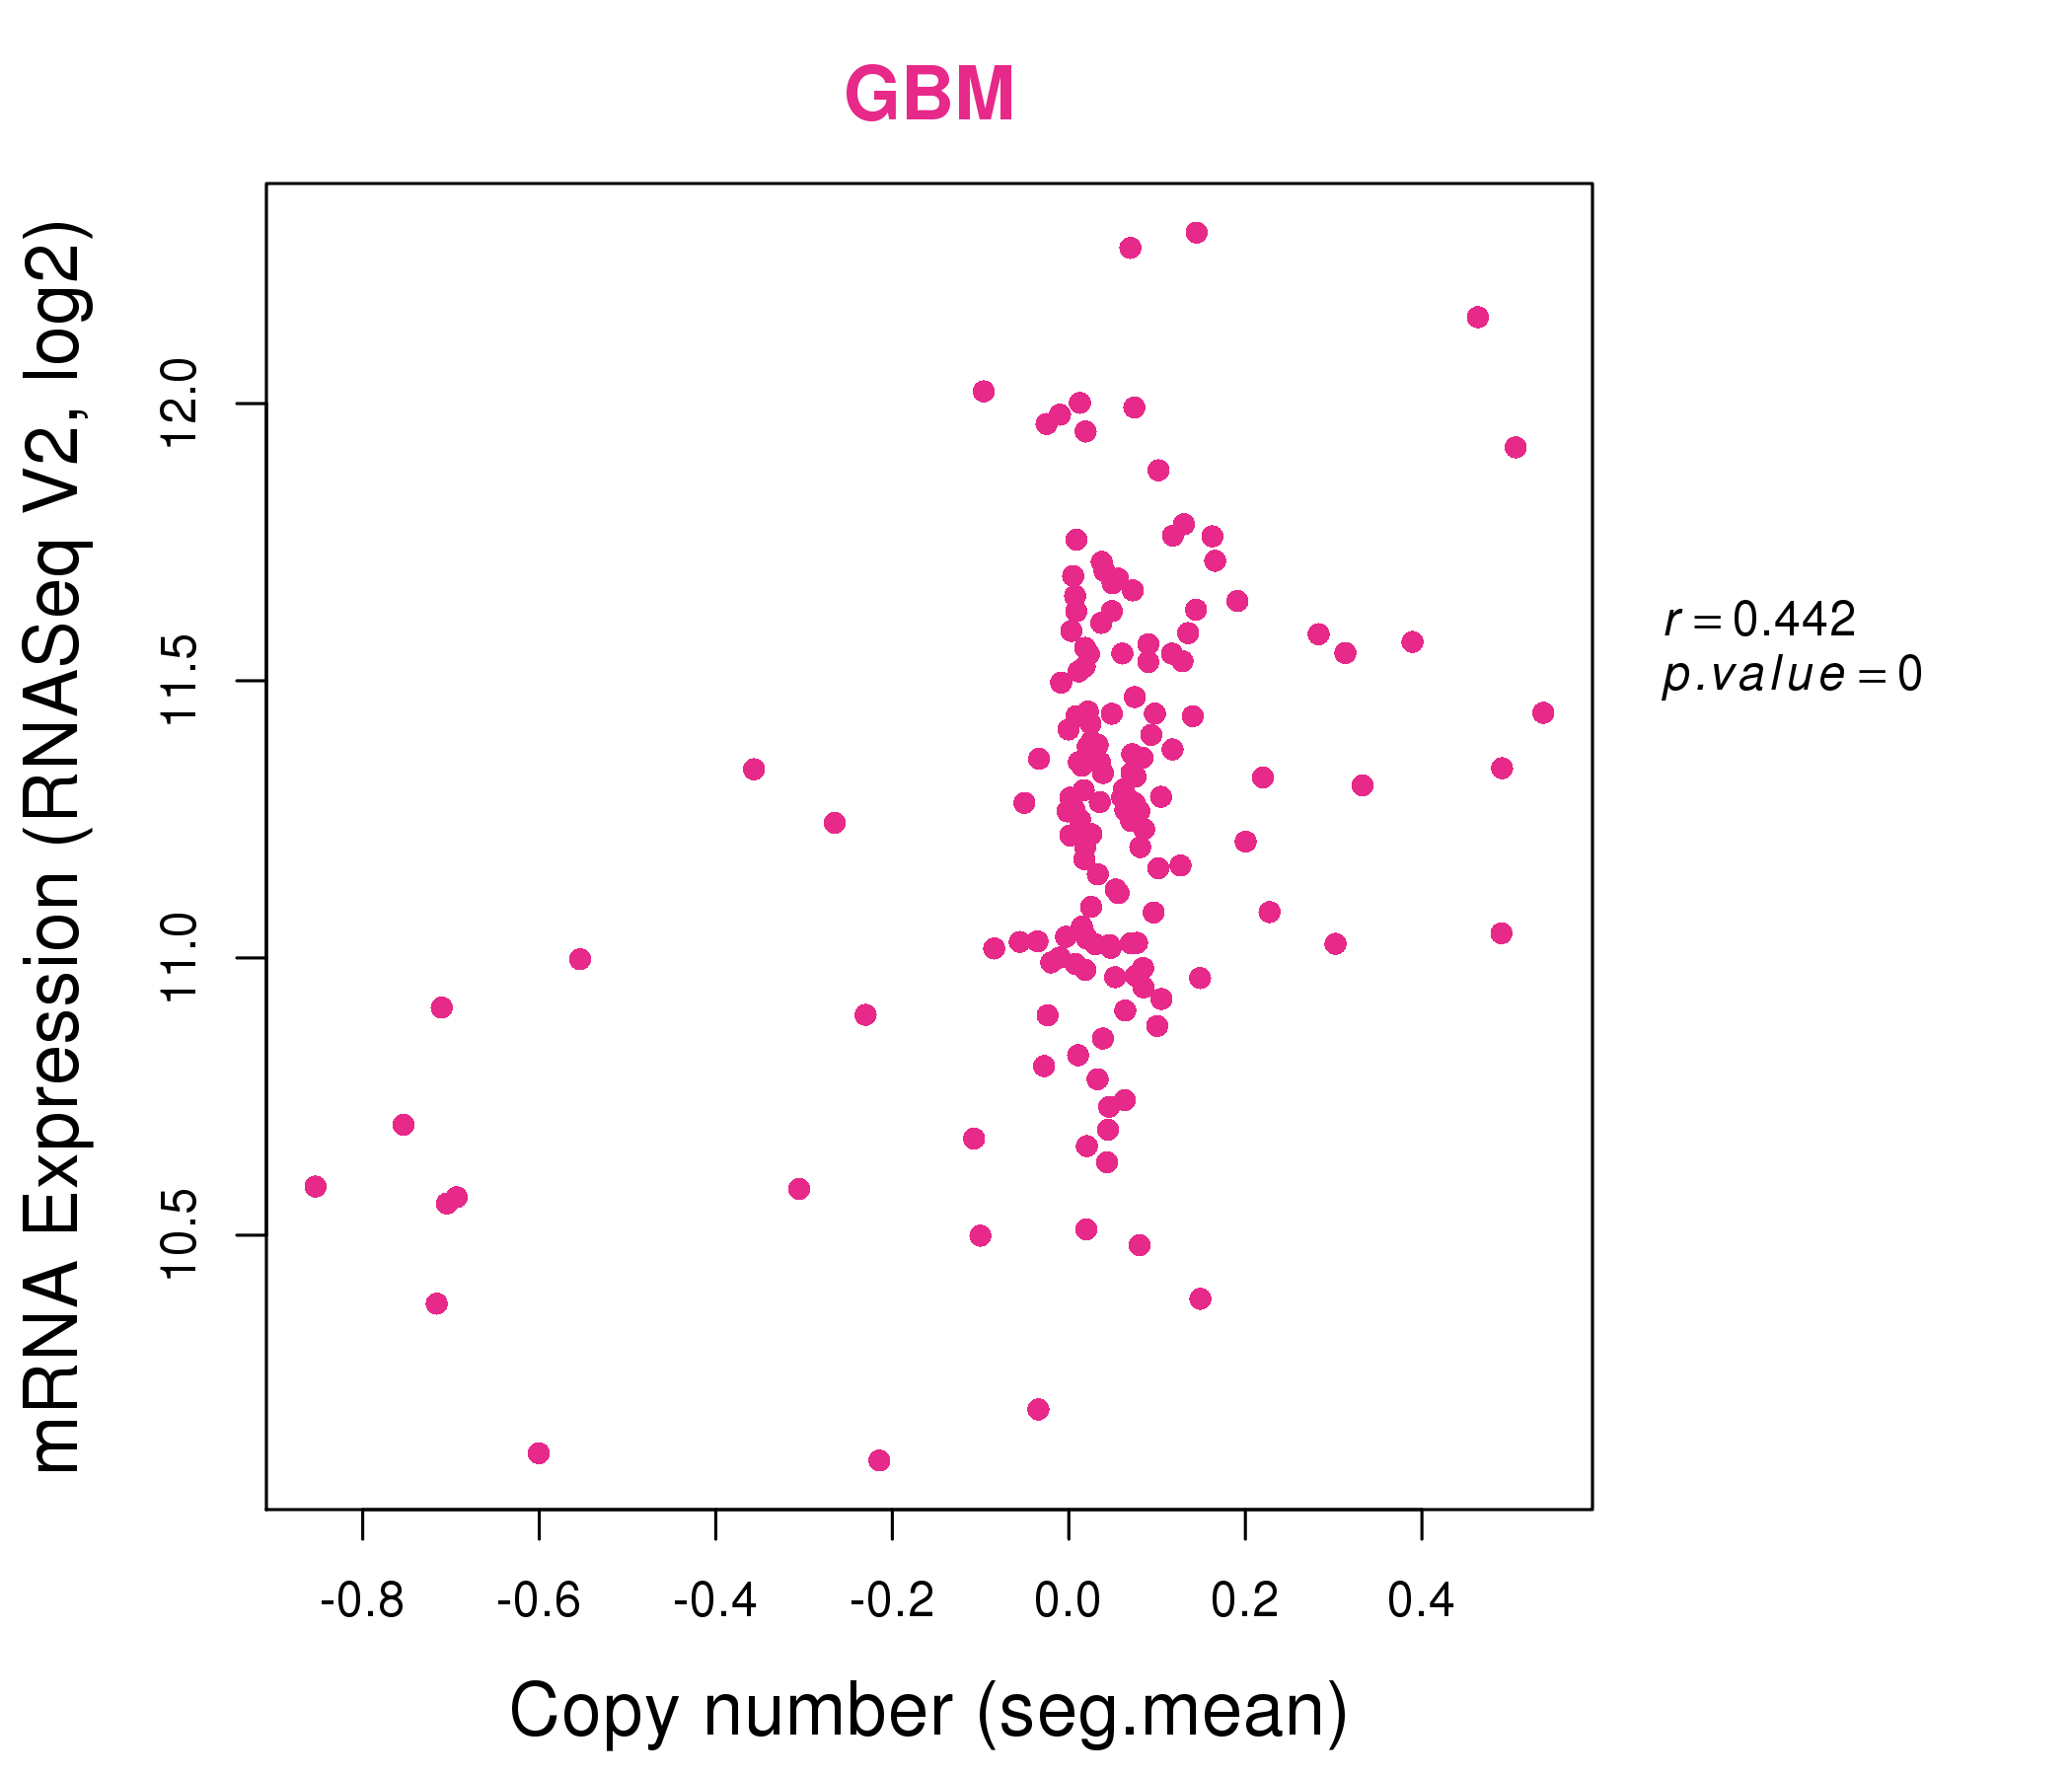
| * This plots show the correlation between CNV and gene expression. |
: Open all plots for all cancer types
 |
|
 |
|
| Top |
| Gene-Gene Network Information |
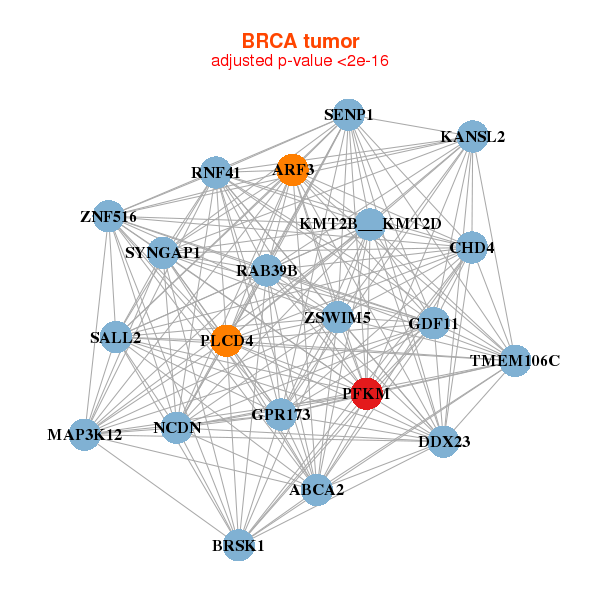
| * Co-Expression network figures were drawn using R package igraph. Only the top 20 genes with the highest correlations were shown. Red circle: input gene, orange circle: cell metabolism gene, sky circle: other gene |
: Open all plots for all cancer types
 |
| ||||
| ABCA2,ARF3,BRSK1,KANSL2,CHD4,DDX23,GDF11, GPR173,MAP3K12,KMT2B___KMT2D,NCDN,PFKM,PLCD4,RAB39B, RNF41,SALL2,SENP1,SYNGAP1,TMEM106C,ZNF516,ZSWIM5 | RBFOX1,ANKRD23,ASB12,ASB16,CACNG1,CALML6,CMYA5, DUSP26,FEM1A,JPH1,KLHL38,MYADML2,MYOM3,OBSCN, PEBP4,PFKM,RYR1,SRPK3,TMEM38A,TRIM54,UCP3 | ||||
 |
| ||||
| C10orf2,CDK4,CS,DDN,DDX55,ESPL1,HSPD1, LDHB,LRPPRC,MARS2,MGC14436,NAA25,NOLC1,PA2G4, PDCD11,PFKM,POLR1B,PUS1,SCLY,TRAP1,XPOT | ABI2,APBB1,CD81,DCBLD2,DIP2C,KANK1,KCTD15, TP73-AS1,LPPR2,MID2,PDE2A,PDZRN3,PFKM,PHC1, RBFOX2,SEMA4C,SLC29A1,STAT5B,TACC1,TMEM43,ZBTB4 |
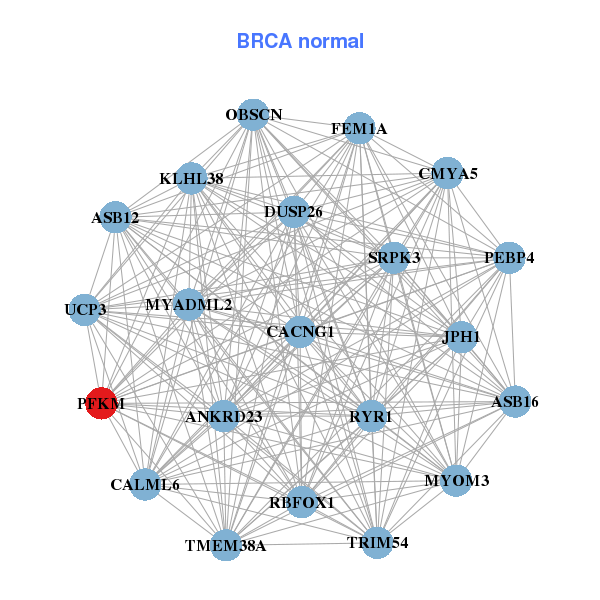
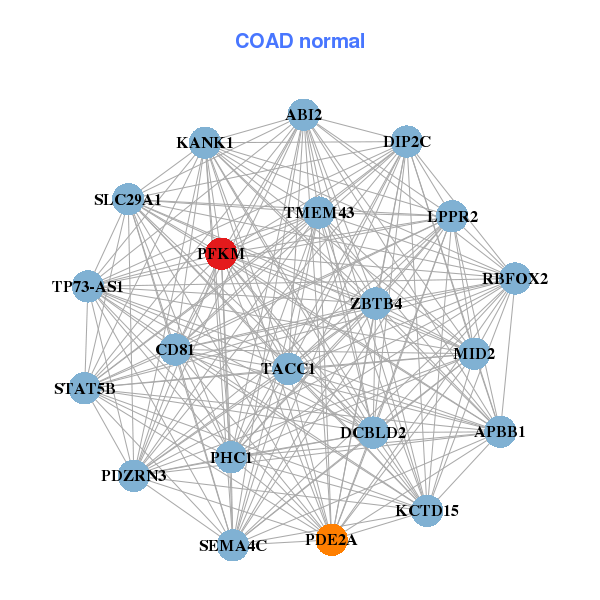
| * Co-Expression network figures were drawn using R package igraph. Only the top 20 genes with the highest correlations were shown. Red circle: input gene, orange circle: cell metabolism gene, sky circle: other gene |
: Open all plots for all cancer types
| Top |
: Open all interacting genes' information including KEGG pathway for all interacting genes from DAVID
| Top |
| Pharmacological Information for PFKM |
| DB Category | DB Name | DB's ID and Url link |
| * Gene Centered Interaction Network. |
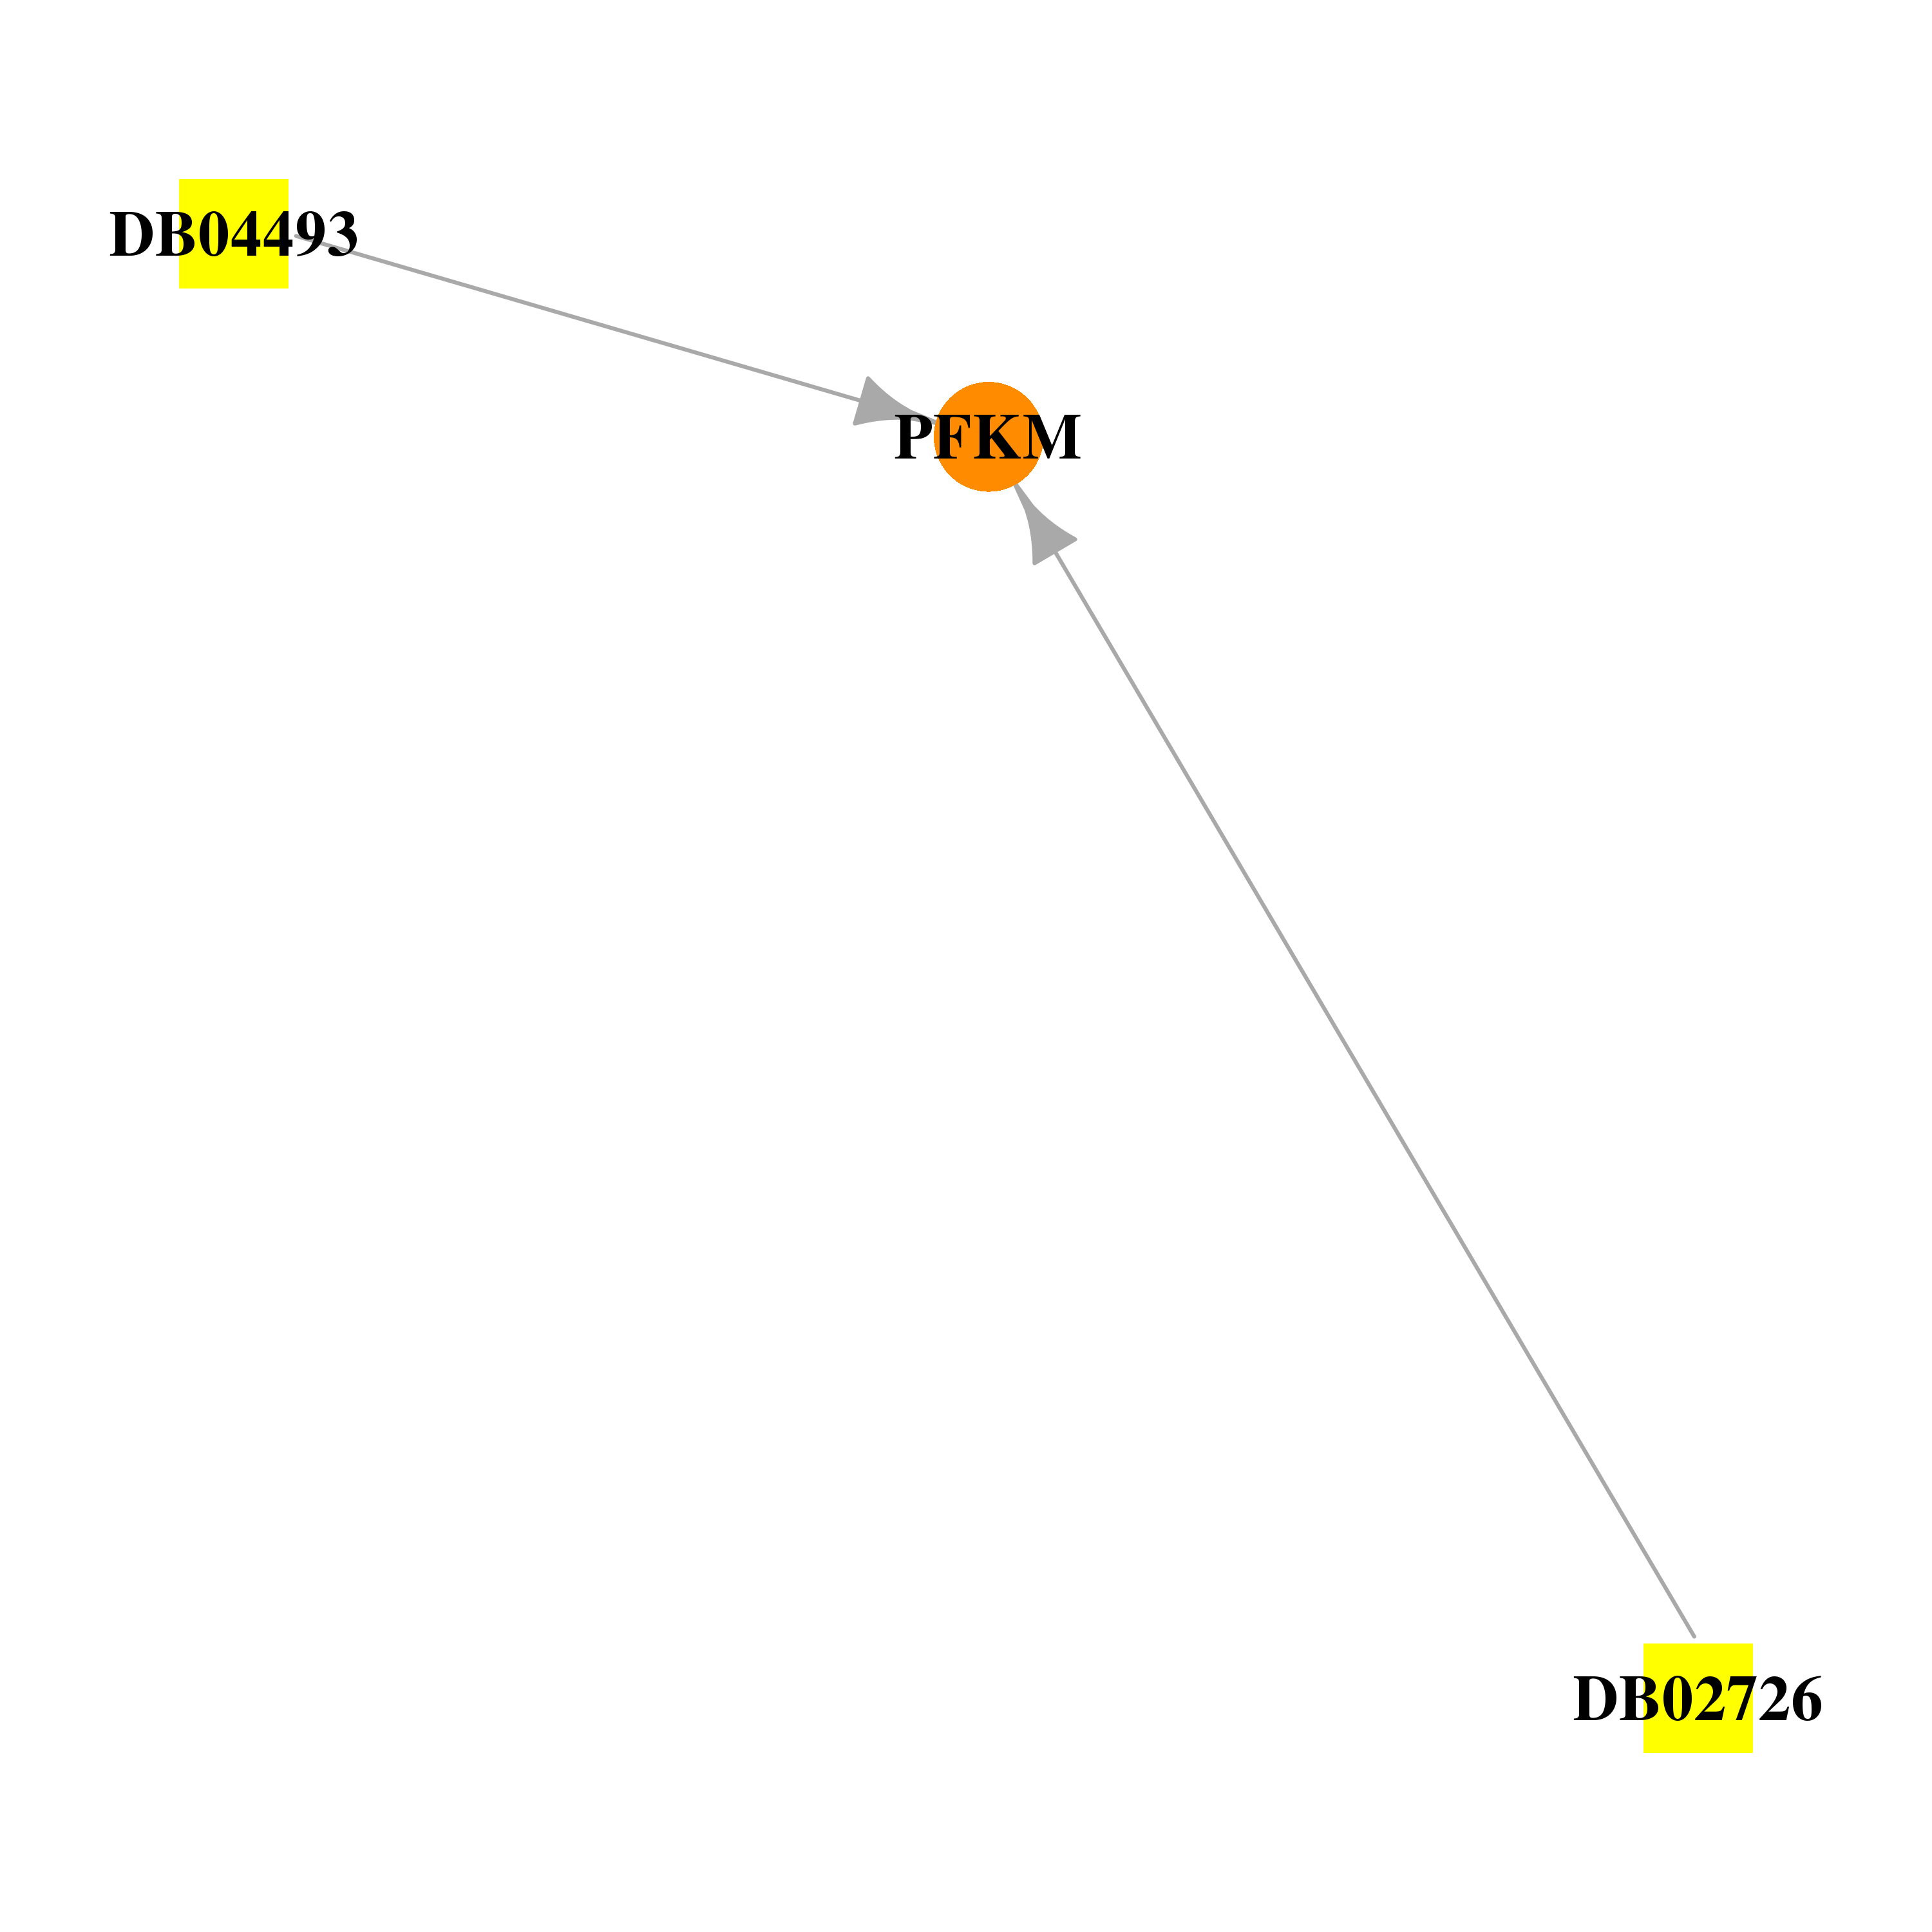 |
| * Drug Centered Interaction Network. |
| DrugBank ID | Target Name | Drug Groups | Generic Name | Drug Centered Network | Drug Structure |
| DB02726 | phosphofructokinase, muscle | experimental | 2-Phosphoglycolic Acid | 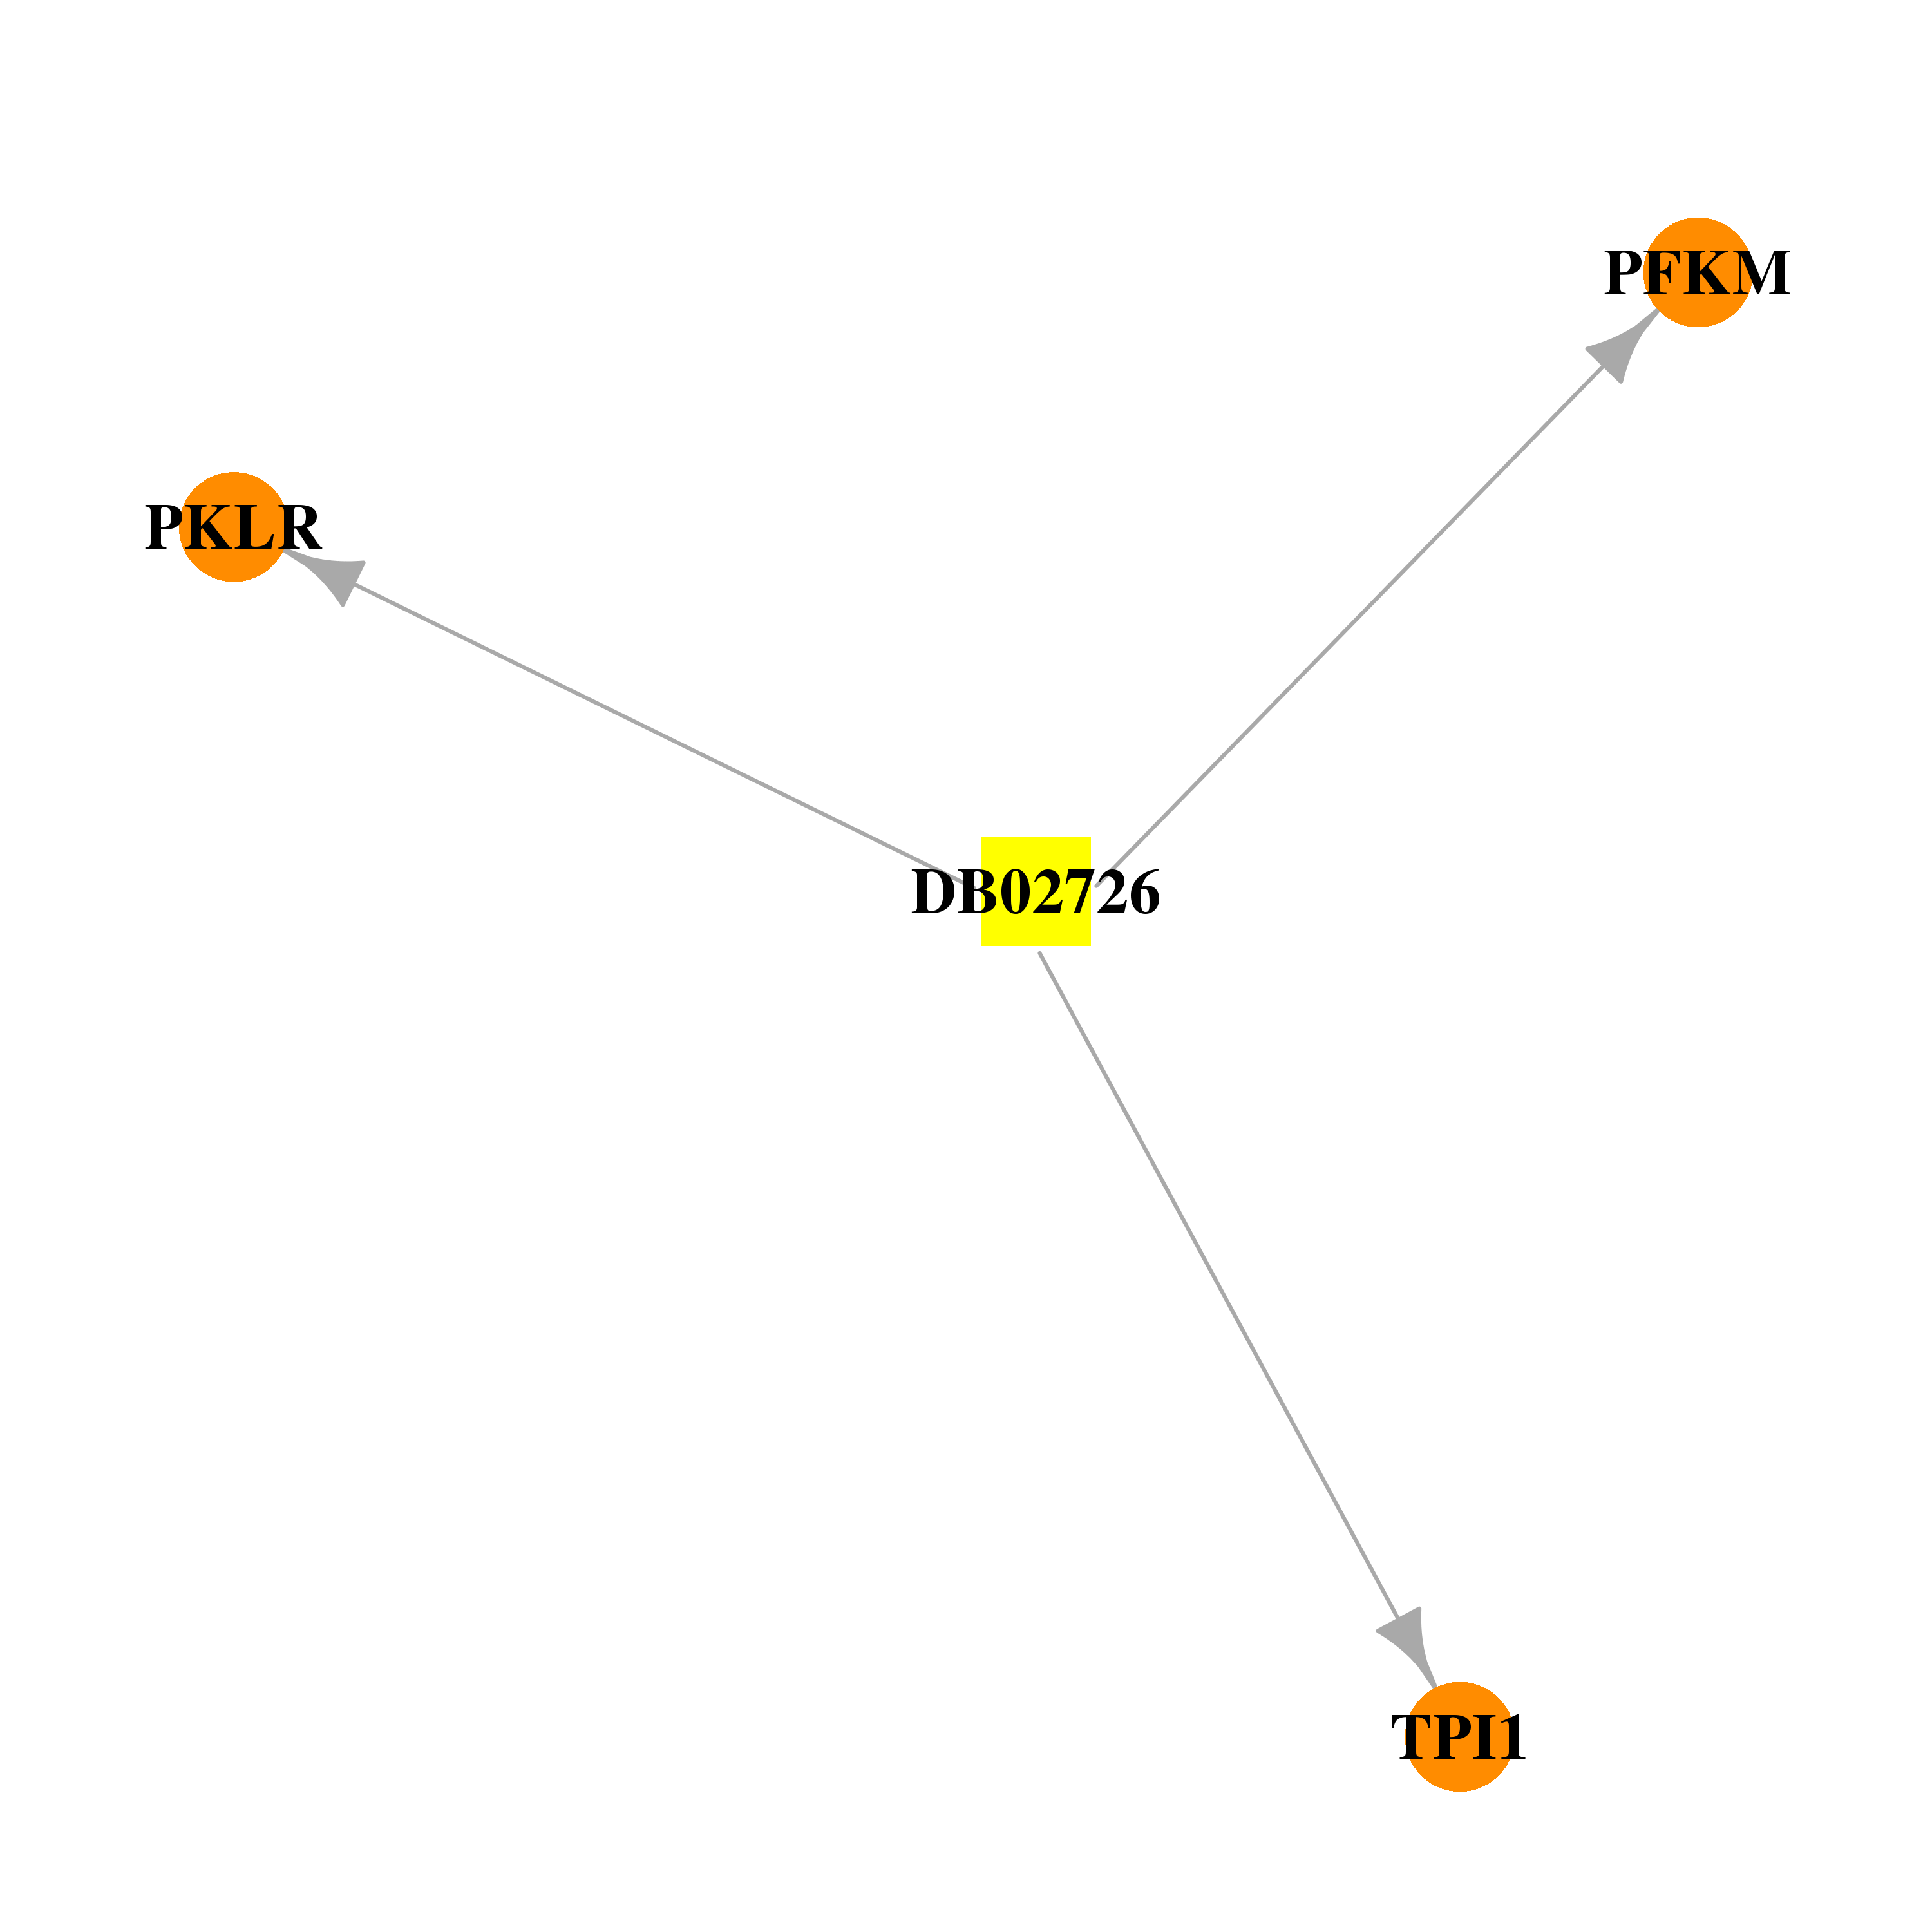 | 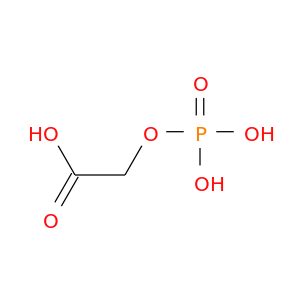 |
| DB04493 | phosphofructokinase, muscle | experimental | Fructose-6-Phosphate | 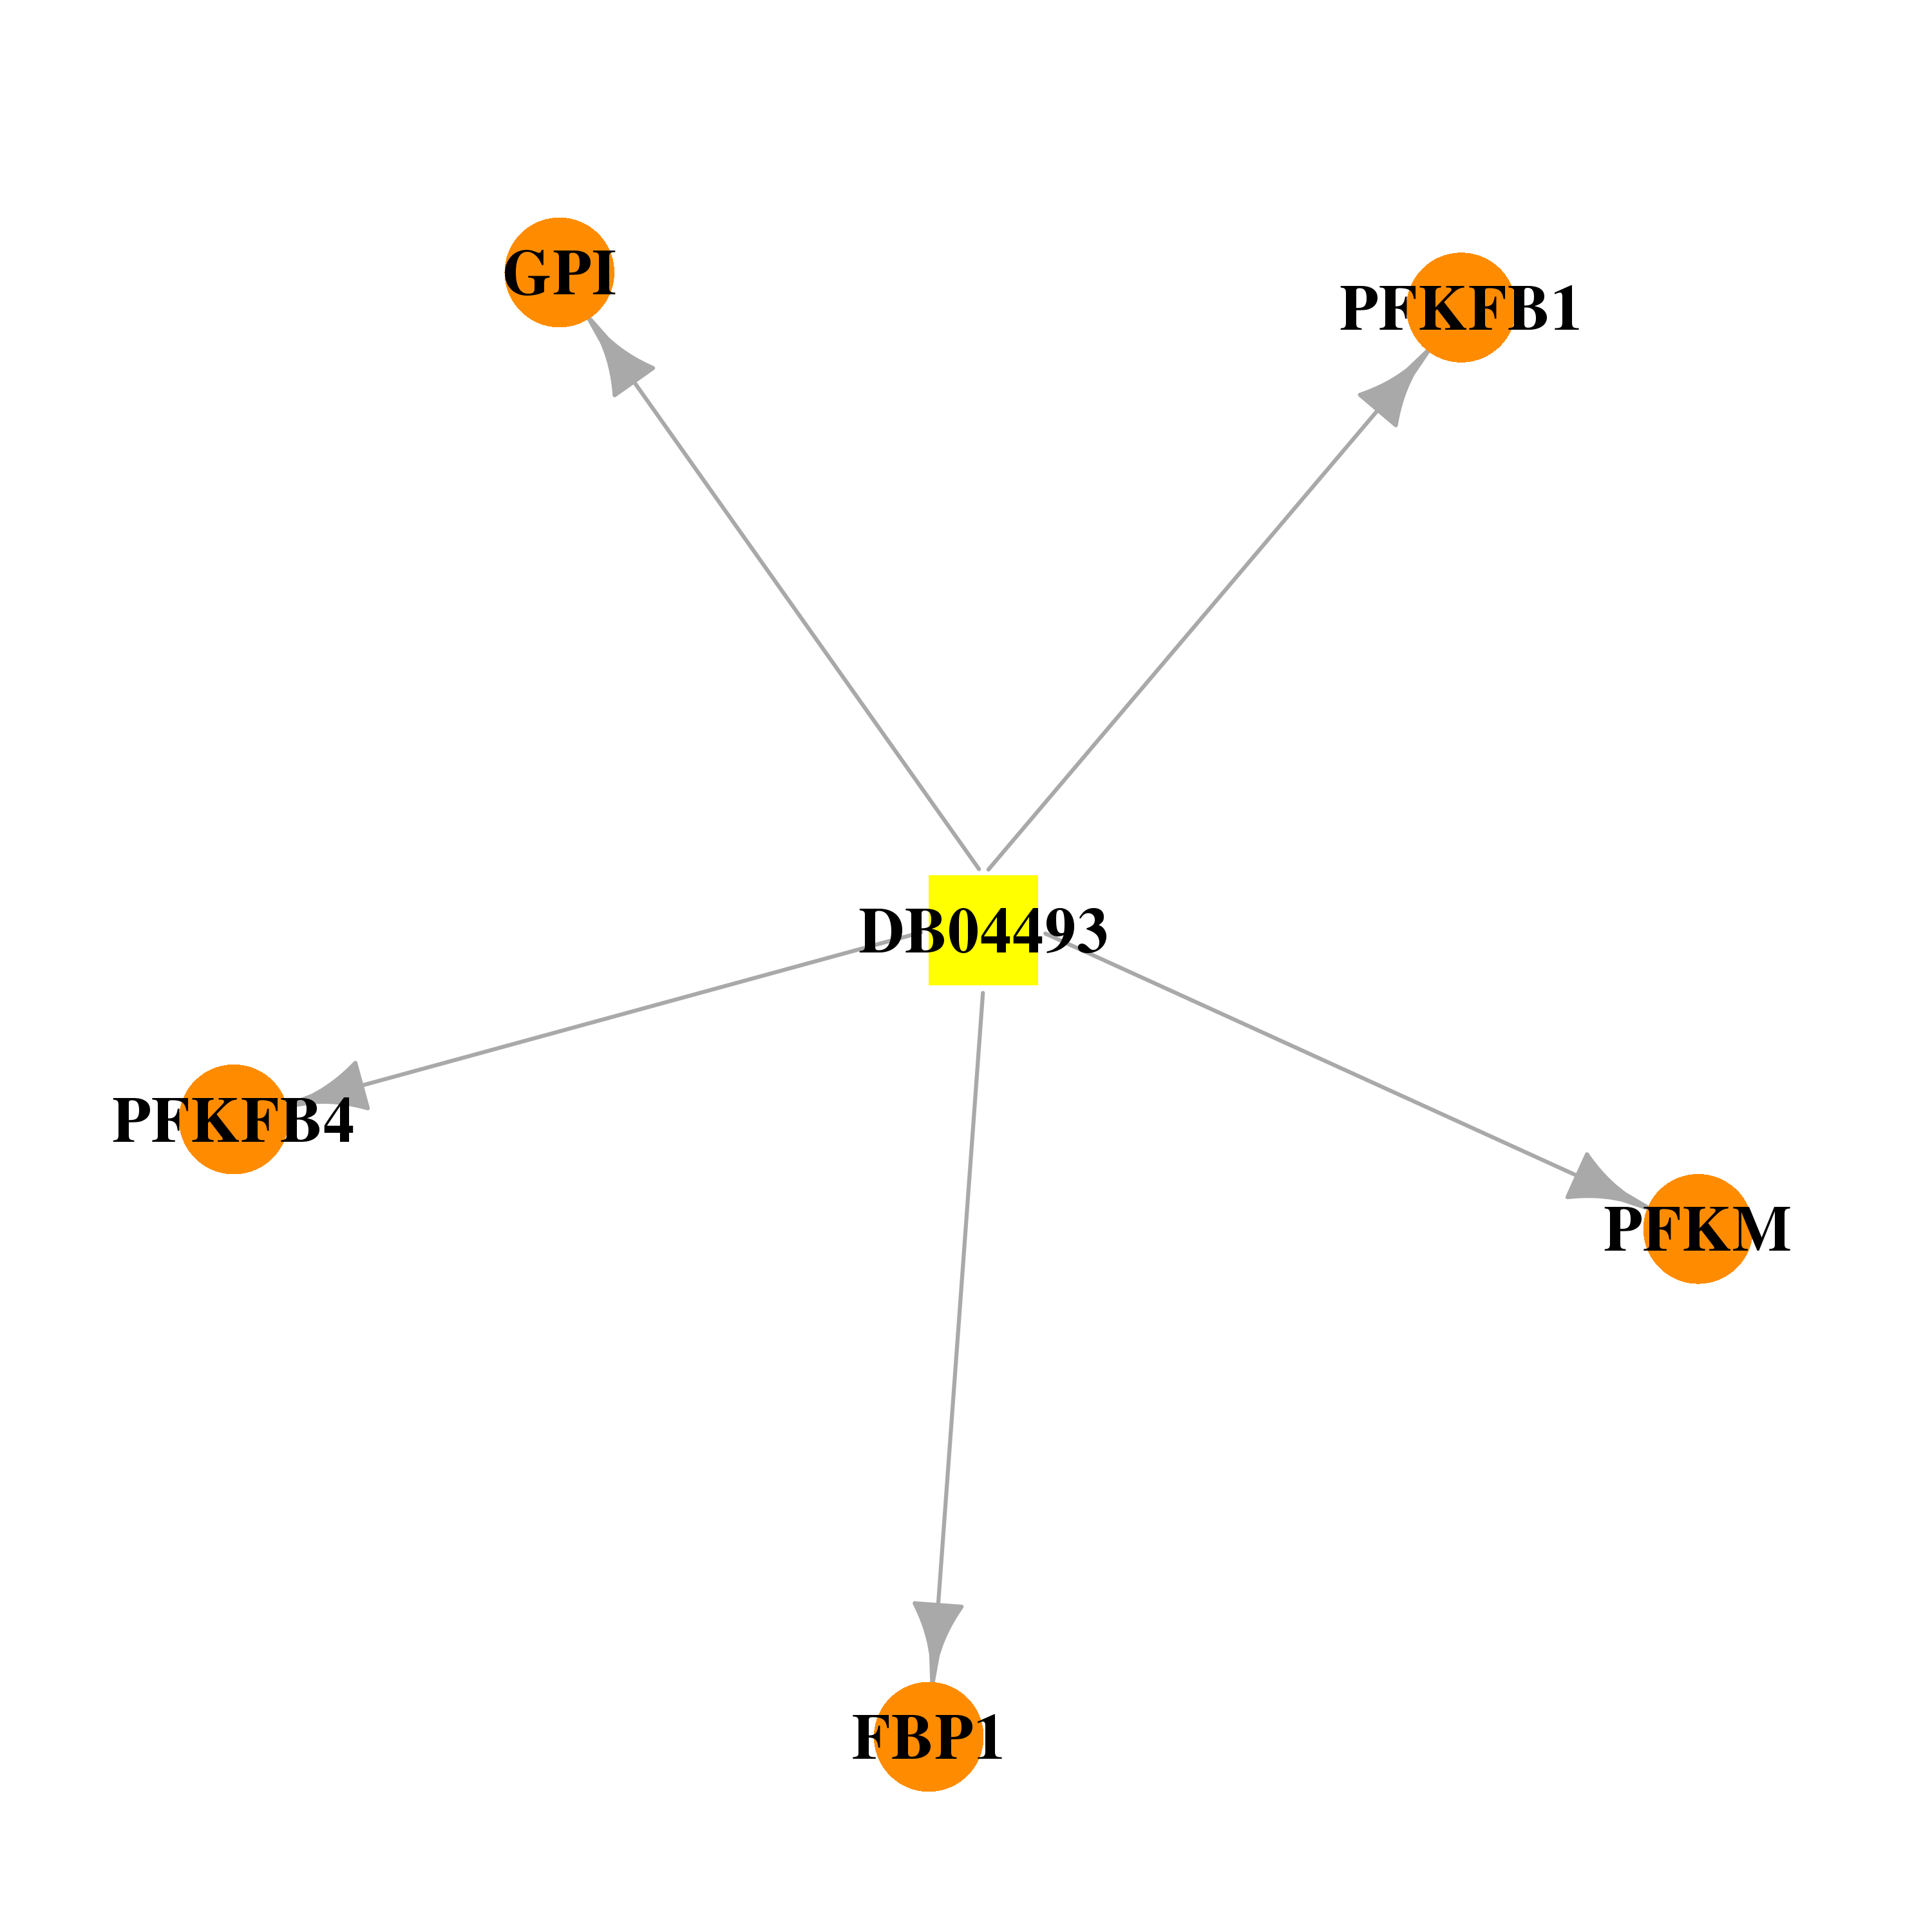 | 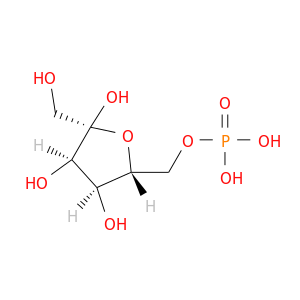 |
| Top |
| Cross referenced IDs for PFKM |
| * We obtained these cross-references from Uniprot database. It covers 150 different DBs, 18 categories. http://www.uniprot.org/help/cross_references_section |
: Open all cross reference information
|
Copyright © 2016-Present - The Univsersity of Texas Health Science Center at Houston @ |