|
||||||||||||||||||||||||||||||||||||||||||||||||||||||||||||||||||||||||||||||||||||||||||||||||||||||||||||||||||||||||||||||||||||||||||||||||||||||||||||||||||||||||||||||||||||||||||||||||||||||||||||||||||||||||||||||||||||||||||||||||||||||||||||||||||||||||||||||||||||||||||||||||||||||||||||||||||||||||||
| |
| Phenotypic Information (metabolism pathway, cancer, disease, phenome) |
| |
| |
| Gene-Gene Network Information: Co-Expression Network, Interacting Genes & KEGG |
| |
|


| Gene Summary for PFKP |
| Basic gene info. | Gene symbol | PFKP |
| Gene name | phosphofructokinase, platelet | |
| Synonyms | ATP-PFK|PFK-C|PFK-P|PFKF | |
| Cytomap | UCSC genome browser: 10p15.3-p15.2 | |
| Genomic location | chr10 :3110818-3178997 | |
| Type of gene | protein-coding | |
| RefGenes | NM_001242339.1, NM_002627.4, | |
| Ensembl id | ENSG00000067057 | |
| Description | 6-phosphofructokinase type C6-phosphofructokinase, platelet typeATP-PFKATP-dependent 6-phosphofructokinase, platelet typePhosphofructokinase, platelet typephosphofructo-1-kinase isozyme Cphosphofructokinase 1phosphohexokinase | |
| Modification date | 20141207 | |
| dbXrefs | MIM : 171840 | |
| HGNC : HGNC | ||
| Ensembl : ENSG00000067057 | ||
| HPRD : 01384 | ||
| Vega : OTTHUMG00000017556 | ||
| Protein | UniProt: go to UniProt's Cross Reference DB Table | |
| Expression | CleanEX: HS_PFKP | |
| BioGPS: 5214 | ||
| Gene Expression Atlas: ENSG00000067057 | ||
| The Human Protein Atlas: ENSG00000067057 | ||
| Pathway | NCI Pathway Interaction Database: PFKP | |
| KEGG: PFKP | ||
| REACTOME: PFKP | ||
| ConsensusPathDB | ||
| Pathway Commons: PFKP | ||
| Metabolism | MetaCyc: PFKP | |
| HUMANCyc: PFKP | ||
| Regulation | Ensembl's Regulation: ENSG00000067057 | |
| miRBase: chr10 :3,110,818-3,178,997 | ||
| TargetScan: NM_001242339 | ||
| cisRED: ENSG00000067057 | ||
| Context | iHOP: PFKP | |
| cancer metabolism search in PubMed: PFKP | ||
| UCL Cancer Institute: PFKP | ||
| Assigned class in ccmGDB | C | |
| Top |
| Phenotypic Information for PFKP(metabolism pathway, cancer, disease, phenome) |
| Cancer | CGAP: PFKP |
| Familial Cancer Database: PFKP | |
| * This gene is included in those cancer gene databases. |
|
|
|
|
|
|
| ||||||||||||||||||||||||||||||||||||||||||||||||||||||||||||||||||||||||||||||||||||||||||||||||||||||||||||||||||||||||||||||||||||||||||||||||||||||||||||||||||||||||||||||||||||||||||||||||||||||||||||||||||||||||||||||||||||||||||||||||||||||||||||||||||||||||||||||||||||||||||||||||||||||||||||||||||||
Oncogene 1 | Significant driver gene in | |||||||||||||||||||||||||||||||||||||||||||||||||||||||||||||||||||||||||||||||||||||||||||||||||||||||||||||||||||||||||||||||||||||||||||||||||||||||||||||||||||||||||||||||||||||||||||||||||||||||||||||||||||||||||||||||||||||||||||||||||||||||||||||||||||||||||||||||||||||||||||||||||||||||||||||||||||||||||
| cf) number; DB name 1 Oncogene; http://nar.oxfordjournals.org/content/35/suppl_1/D721.long, 2 Tumor Suppressor gene; https://bioinfo.uth.edu/TSGene/, 3 Cancer Gene Census; http://www.nature.com/nrc/journal/v4/n3/abs/nrc1299.html, 4 CancerGenes; http://nar.oxfordjournals.org/content/35/suppl_1/D721.long, 5 Network of Cancer Gene; http://ncg.kcl.ac.uk/index.php, 1Therapeutic Vulnerabilities in Cancer; http://cbio.mskcc.org/cancergenomics/statius/ |
| KEGG_GLYCOLYSIS_GLUCONEOGENESIS KEGG_FRUCTOSE_AND_MANNOSE_METABOLISM KEGG_GALACTOSE_METABOLISM REACTOME_METABOLISM_OF_CARBOHYDRATES REACTOME_GLUCOSE_METABOLISM | |
| OMIM | |
| Orphanet | |
| Disease | KEGG Disease: PFKP |
| MedGen: PFKP (Human Medical Genetics with Condition) | |
| ClinVar: PFKP | |
| Phenotype | MGI: PFKP (International Mouse Phenotyping Consortium) |
| PhenomicDB: PFKP | |
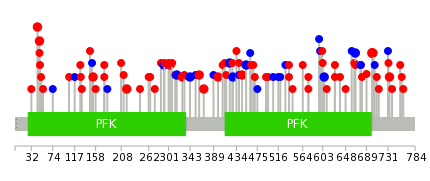
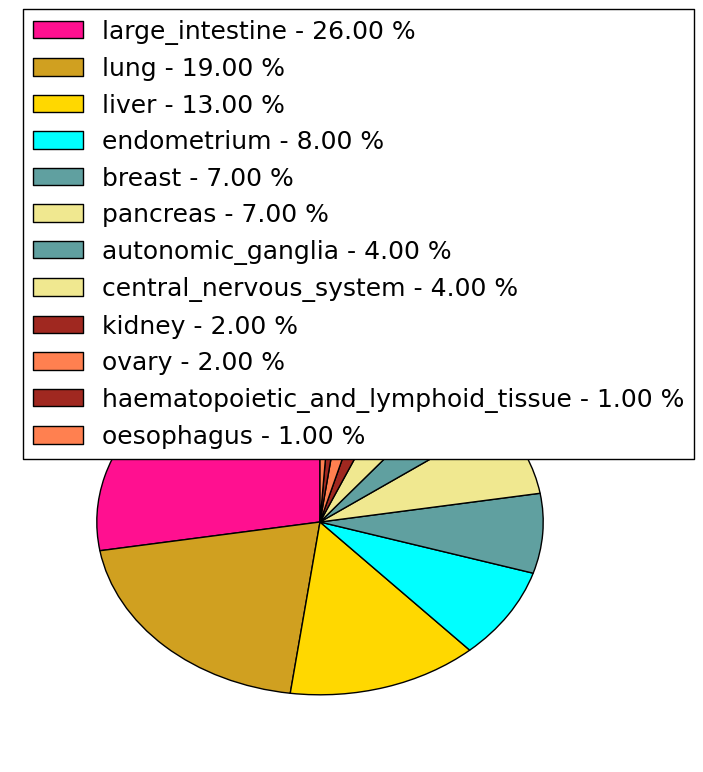
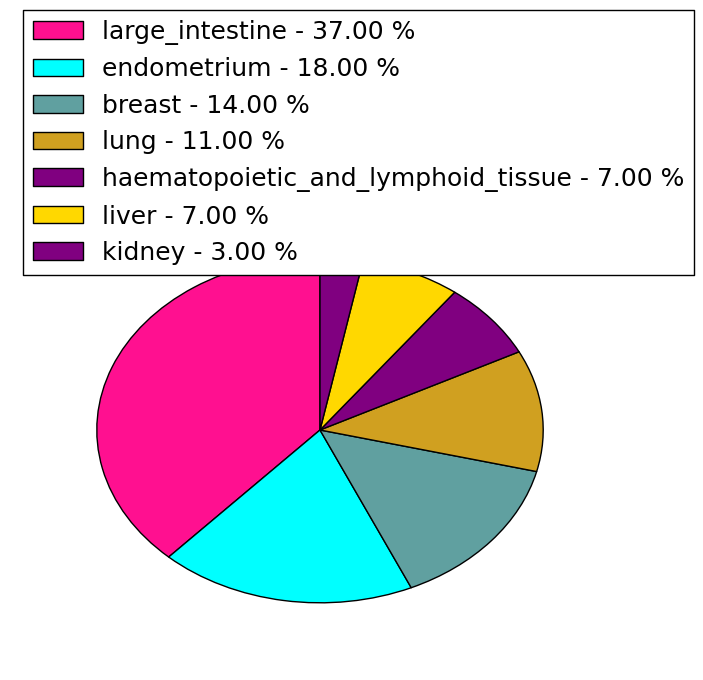
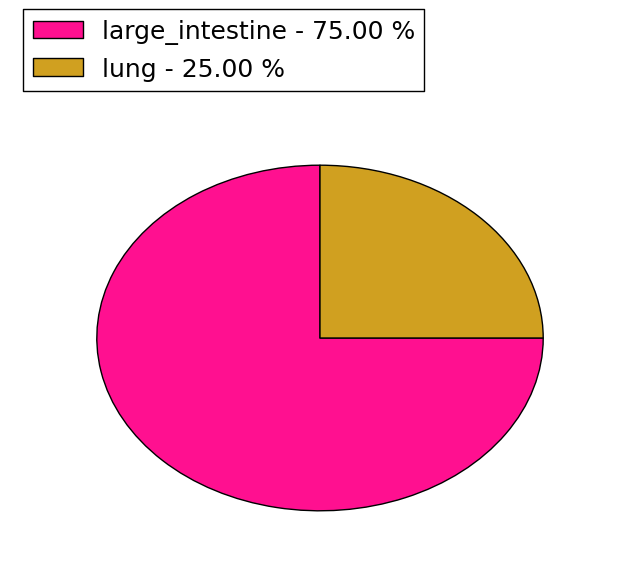
| Mutations for PFKP |
| * Under tables are showing count per each tissue to give us broad intuition about tissue specific mutation patterns.You can go to the detailed page for each mutation database's web site. |
| There's no structural variation information in COSMIC data for this gene. |
| * From mRNA Sanger sequences, Chitars2.0 arranged chimeric transcripts. This table shows PFKP related fusion information. |
| ID | Head Gene | Tail Gene | Accession | Gene_a | qStart_a | qEnd_a | Chromosome_a | tStart_a | tEnd_a | Gene_a | qStart_a | qEnd_a | Chromosome_a | tStart_a | tEnd_a |
| AA350049 | MARK1 | 1 | 110 | 1 | 220837603 | 220837712 | PFKP | 105 | 292 | 10 | 3170511 | 3170698 | |
| DB459081 | LYPLA1 | 1 | 270 | 8 | 55013468 | 55014552 | PFKP | 270 | 370 | 10 | 3154477 | 3154577 | |
| BP431482 | PFKP | 4 | 269 | 10 | 3178690 | 3178956 | STRAP | 258 | 333 | 12 | 16055870 | 16055944 | |
| U33818 | PFKP | 1 | 119 | 10 | 3170203 | 3170322 | PABPC4 | 118 | 2394 | 1 | 40026502 | 40041659 | |
| BI005429 | TG | 1 | 275 | 8 | 134125702 | 134144076 | PFKP | 266 | 420 | 10 | 3149421 | 3150966 | |
| Top |
| Mutation type/ Tissue ID | brca | cns | cerv | endome | haematopo | kidn | Lintest | liver | lung | ns | ovary | pancre | prost | skin | stoma | thyro | urina | |||
| Total # sample | 1 | 2 | 2 | |||||||||||||||||
| GAIN (# sample) | 1 | 2 | ||||||||||||||||||
| LOSS (# sample) | 1 | 1 |
| cf) Tissue ID; Tissue type (1; Breast, 2; Central_nervous_system, 3; Cervix, 4; Endometrium, 5; Haematopoietic_and_lymphoid_tissue, 6; Kidney, 7; Large_intestine, 8; Liver, 9; Lung, 10; NS, 11; Ovary, 12; Pancreas, 13; Prostate, 14; Skin, 15; Stomach, 16; Thyroid, 17; Urinary_tract) |
| Top |
|
 |
| Top |
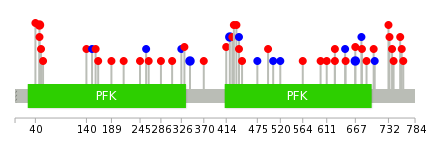
| Stat. for Non-Synonymous SNVs (# total SNVs=68) | (# total SNVs=27) |
 |  |
(# total SNVs=4) | (# total SNVs=1) |
 |  |
| Top |
| * When you move the cursor on each content, you can see more deailed mutation information on the Tooltip. Those are primary_site,primary_histology,mutation(aa),pubmedID. |
| GRCh37 position | Mutation(aa) | Unique sampleID count |
| chr10:3149418-3149418 | p.R265fs*2 | 4 |
| chr10:3176752-3176752 | p.K700N | 3 |
| chr10:3178031-3178032 | p.? | 2 |
| chr10:3155620-3155620 | p.A427A | 2 |
| chr10:3150932-3150932 | p.I304V | 2 |
| chr10:3155348-3155348 | p.A398P | 2 |
| chr10:3145973-3145973 | p.Q153K | 2 |
| chr10:3150973-3150973 | p.F317F | 2 |
| chr10:3155672-3155672 | p.A445T | 2 |
| chr10:3151566-3151566 | p.E328V | 2 |
| Top |
|
 |
| Point Mutation/ Tissue ID | 1 | 2 | 3 | 4 | 5 | 6 | 7 | 8 | 9 | 10 | 11 | 12 | 13 | 14 | 15 | 16 | 17 | 18 | 19 | 20 |
| # sample | 3 | 12 | 1 | 3 | 1 | 5 | 2 | 2 | 1 | 1 | 10 | 2 | 9 | |||||||
| # mutation | 3 | 11 | 1 | 3 | 1 | 6 | 3 | 2 | 1 | 1 | 10 | 2 | 10 | |||||||
| nonsynonymous SNV | 2 | 9 | 1 | 3 | 3 | 2 | 2 | 1 | 1 | 8 | 2 | 7 | ||||||||
| synonymous SNV | 1 | 2 | 1 | 3 | 1 | 2 | 3 |
| cf) Tissue ID; Tissue type (1; BLCA[Bladder Urothelial Carcinoma], 2; BRCA[Breast invasive carcinoma], 3; CESC[Cervical squamous cell carcinoma and endocervical adenocarcinoma], 4; COAD[Colon adenocarcinoma], 5; GBM[Glioblastoma multiforme], 6; Glioma Low Grade, 7; HNSC[Head and Neck squamous cell carcinoma], 8; KICH[Kidney Chromophobe], 9; KIRC[Kidney renal clear cell carcinoma], 10; KIRP[Kidney renal papillary cell carcinoma], 11; LAML[Acute Myeloid Leukemia], 12; LUAD[Lung adenocarcinoma], 13; LUSC[Lung squamous cell carcinoma], 14; OV[Ovarian serous cystadenocarcinoma ], 15; PAAD[Pancreatic adenocarcinoma], 16; PRAD[Prostate adenocarcinoma], 17; SKCM[Skin Cutaneous Melanoma], 18:STAD[Stomach adenocarcinoma], 19:THCA[Thyroid carcinoma], 20:UCEC[Uterine Corpus Endometrial Carcinoma]) |
| Top |
| * We represented just top 10 SNVs. When you move the cursor on each content, you can see more deailed mutation information on the Tooltip. Those are primary_site, primary_histology, mutation(aa), pubmedID. |
| Genomic Position | Mutation(aa) | Unique sampleID count |
| chr10:3151612 | p.N667N,PFKP | 2 |
| chr10:3175485 | p.R48C,PFKP | 2 |
| chr10:3155602 | p.C343C,PFKP | 2 |
| chr10:3124609 | p.P421P,PFKP | 2 |
| chr10:3151561 | p.A158V,PFKP | 1 |
| chr10:3178021 | p.V429I,PFKP | 1 |
| chr10:3155672 | p.N667Y,PFKP | 1 |
| chr10:3175426 | p.A163T,PFKP | 1 |
| chr10:3143745 | p.R434H,PFKP | 1 |
| chr10:3151577 | p.S189P,PFKP | 1 |
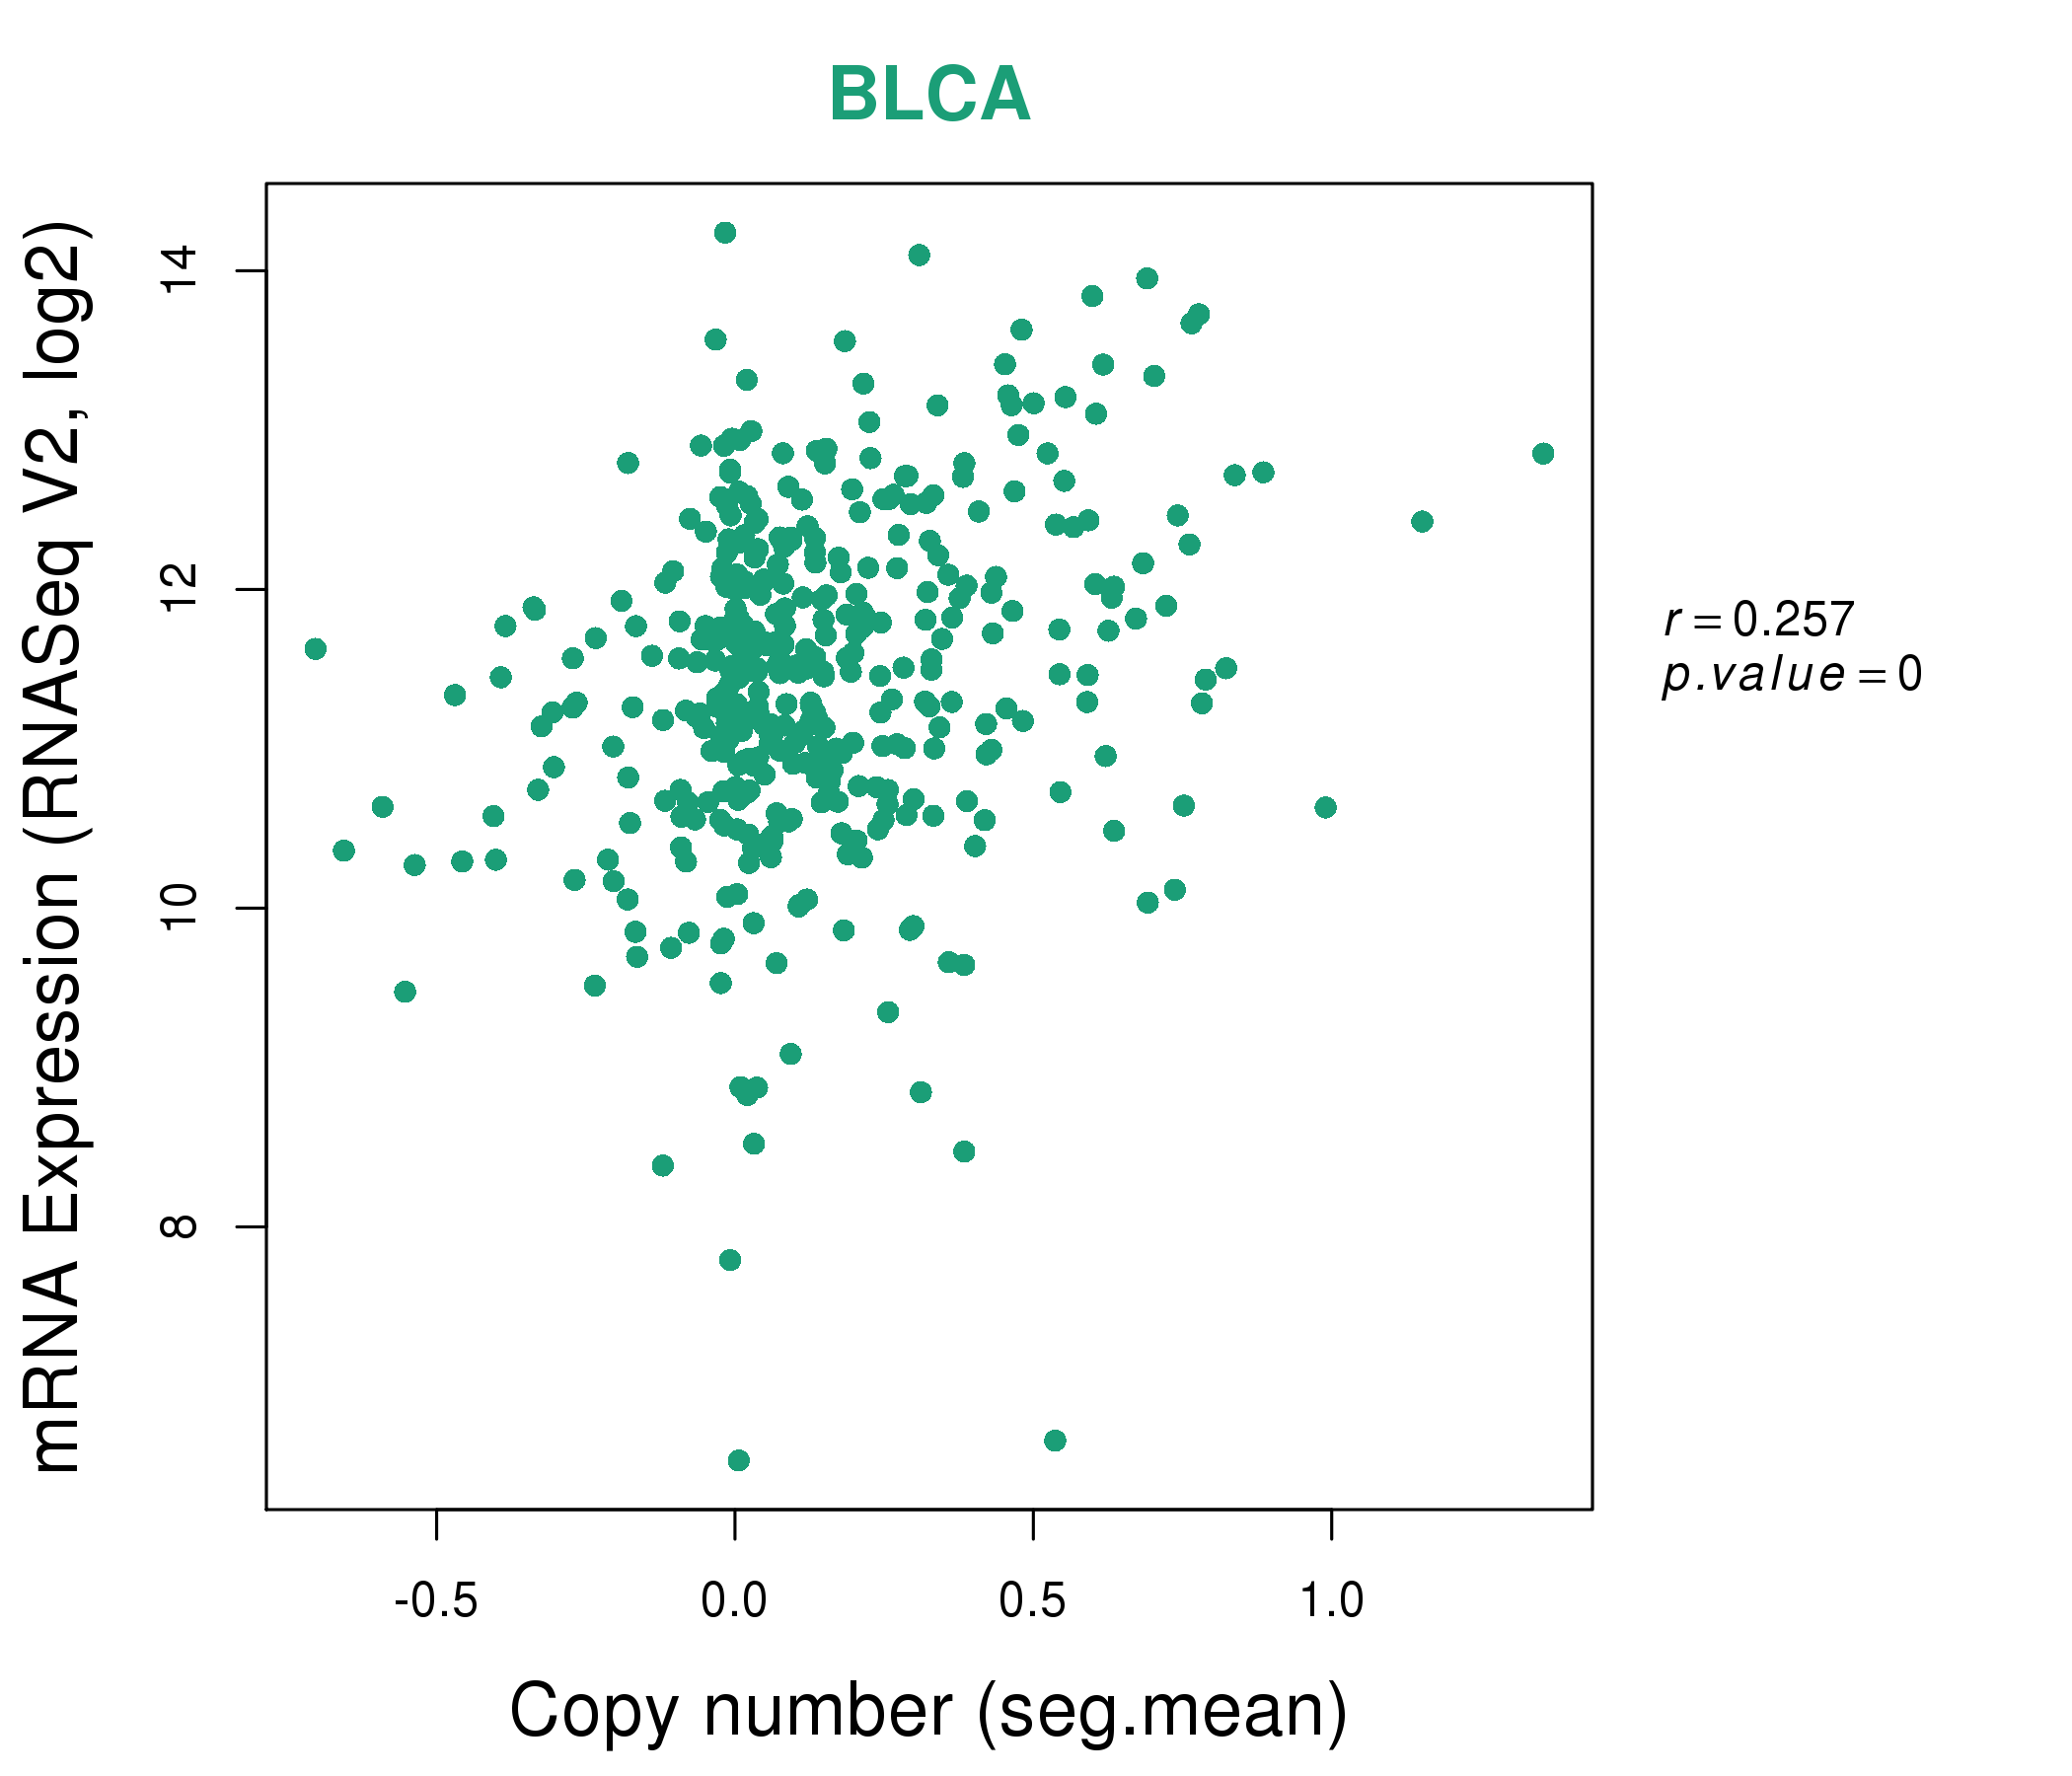
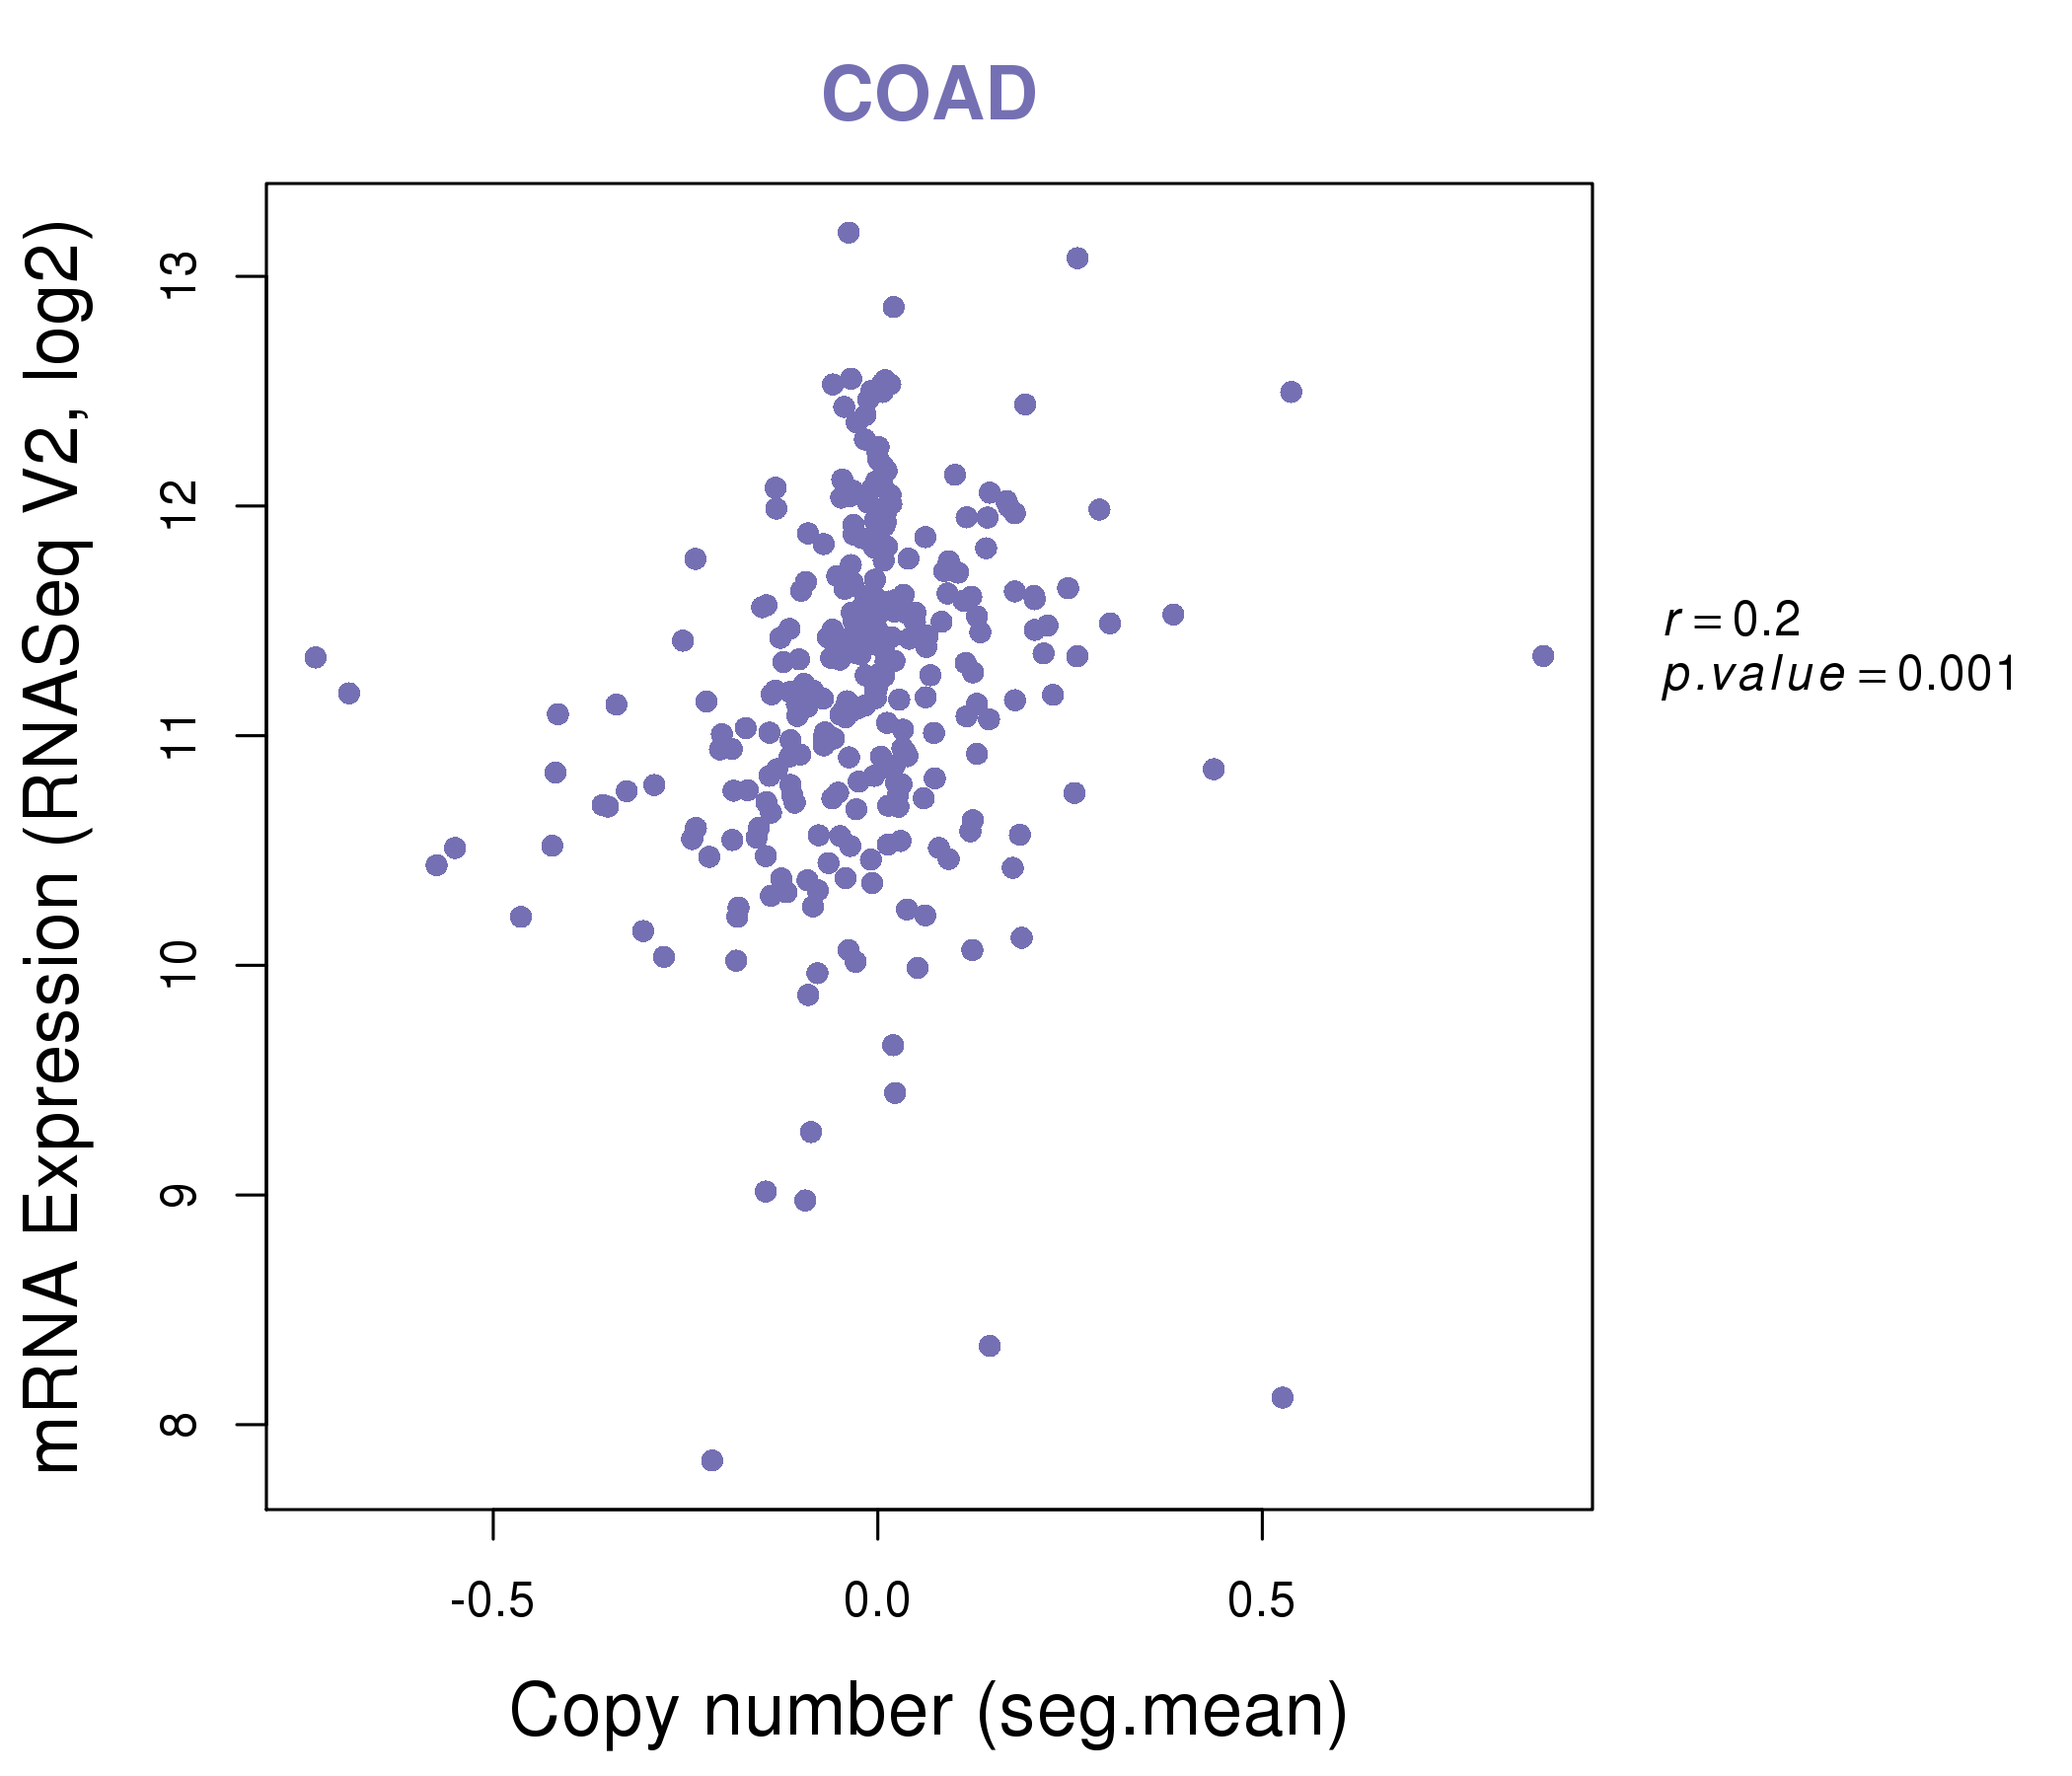
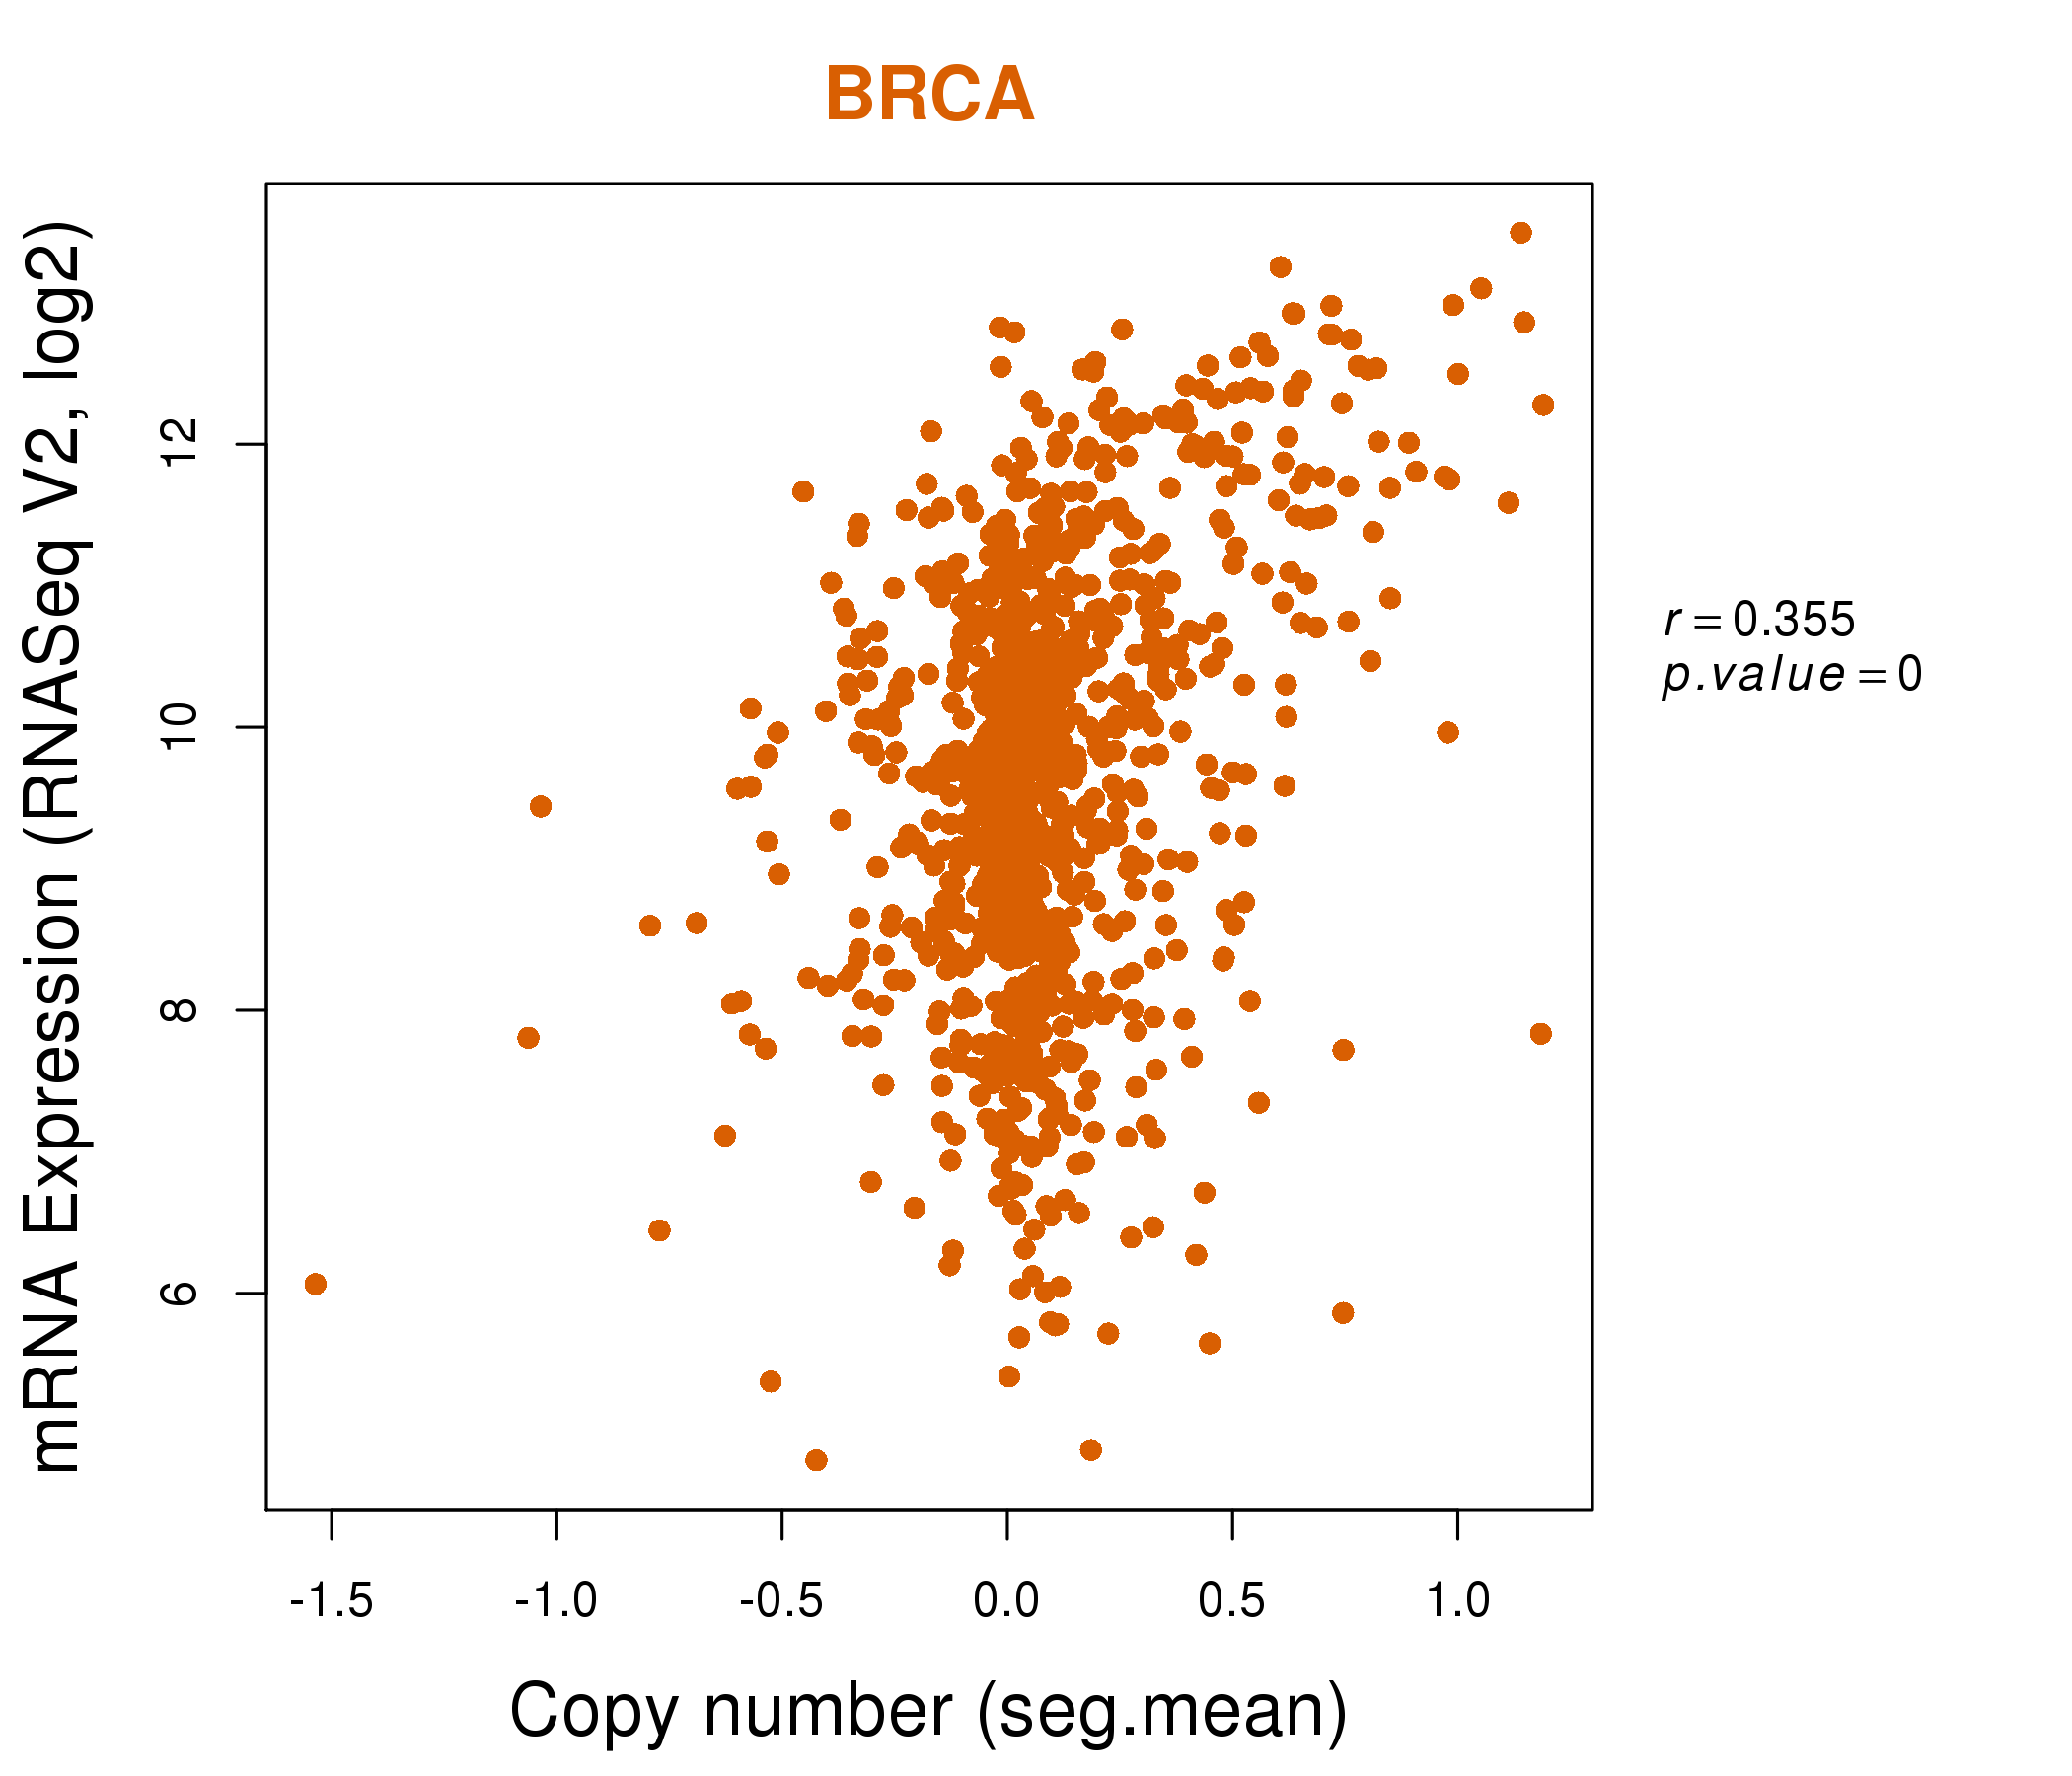
| * Copy number data were extracted from TCGA using R package TCGA-Assembler. The URLs of all public data files on TCGA DCC data server were gathered on Jan-05-2015. Function ProcessCNAData in TCGA-Assembler package was used to obtain gene-level copy number value which is calculated as the average copy number of the genomic region of a gene. |
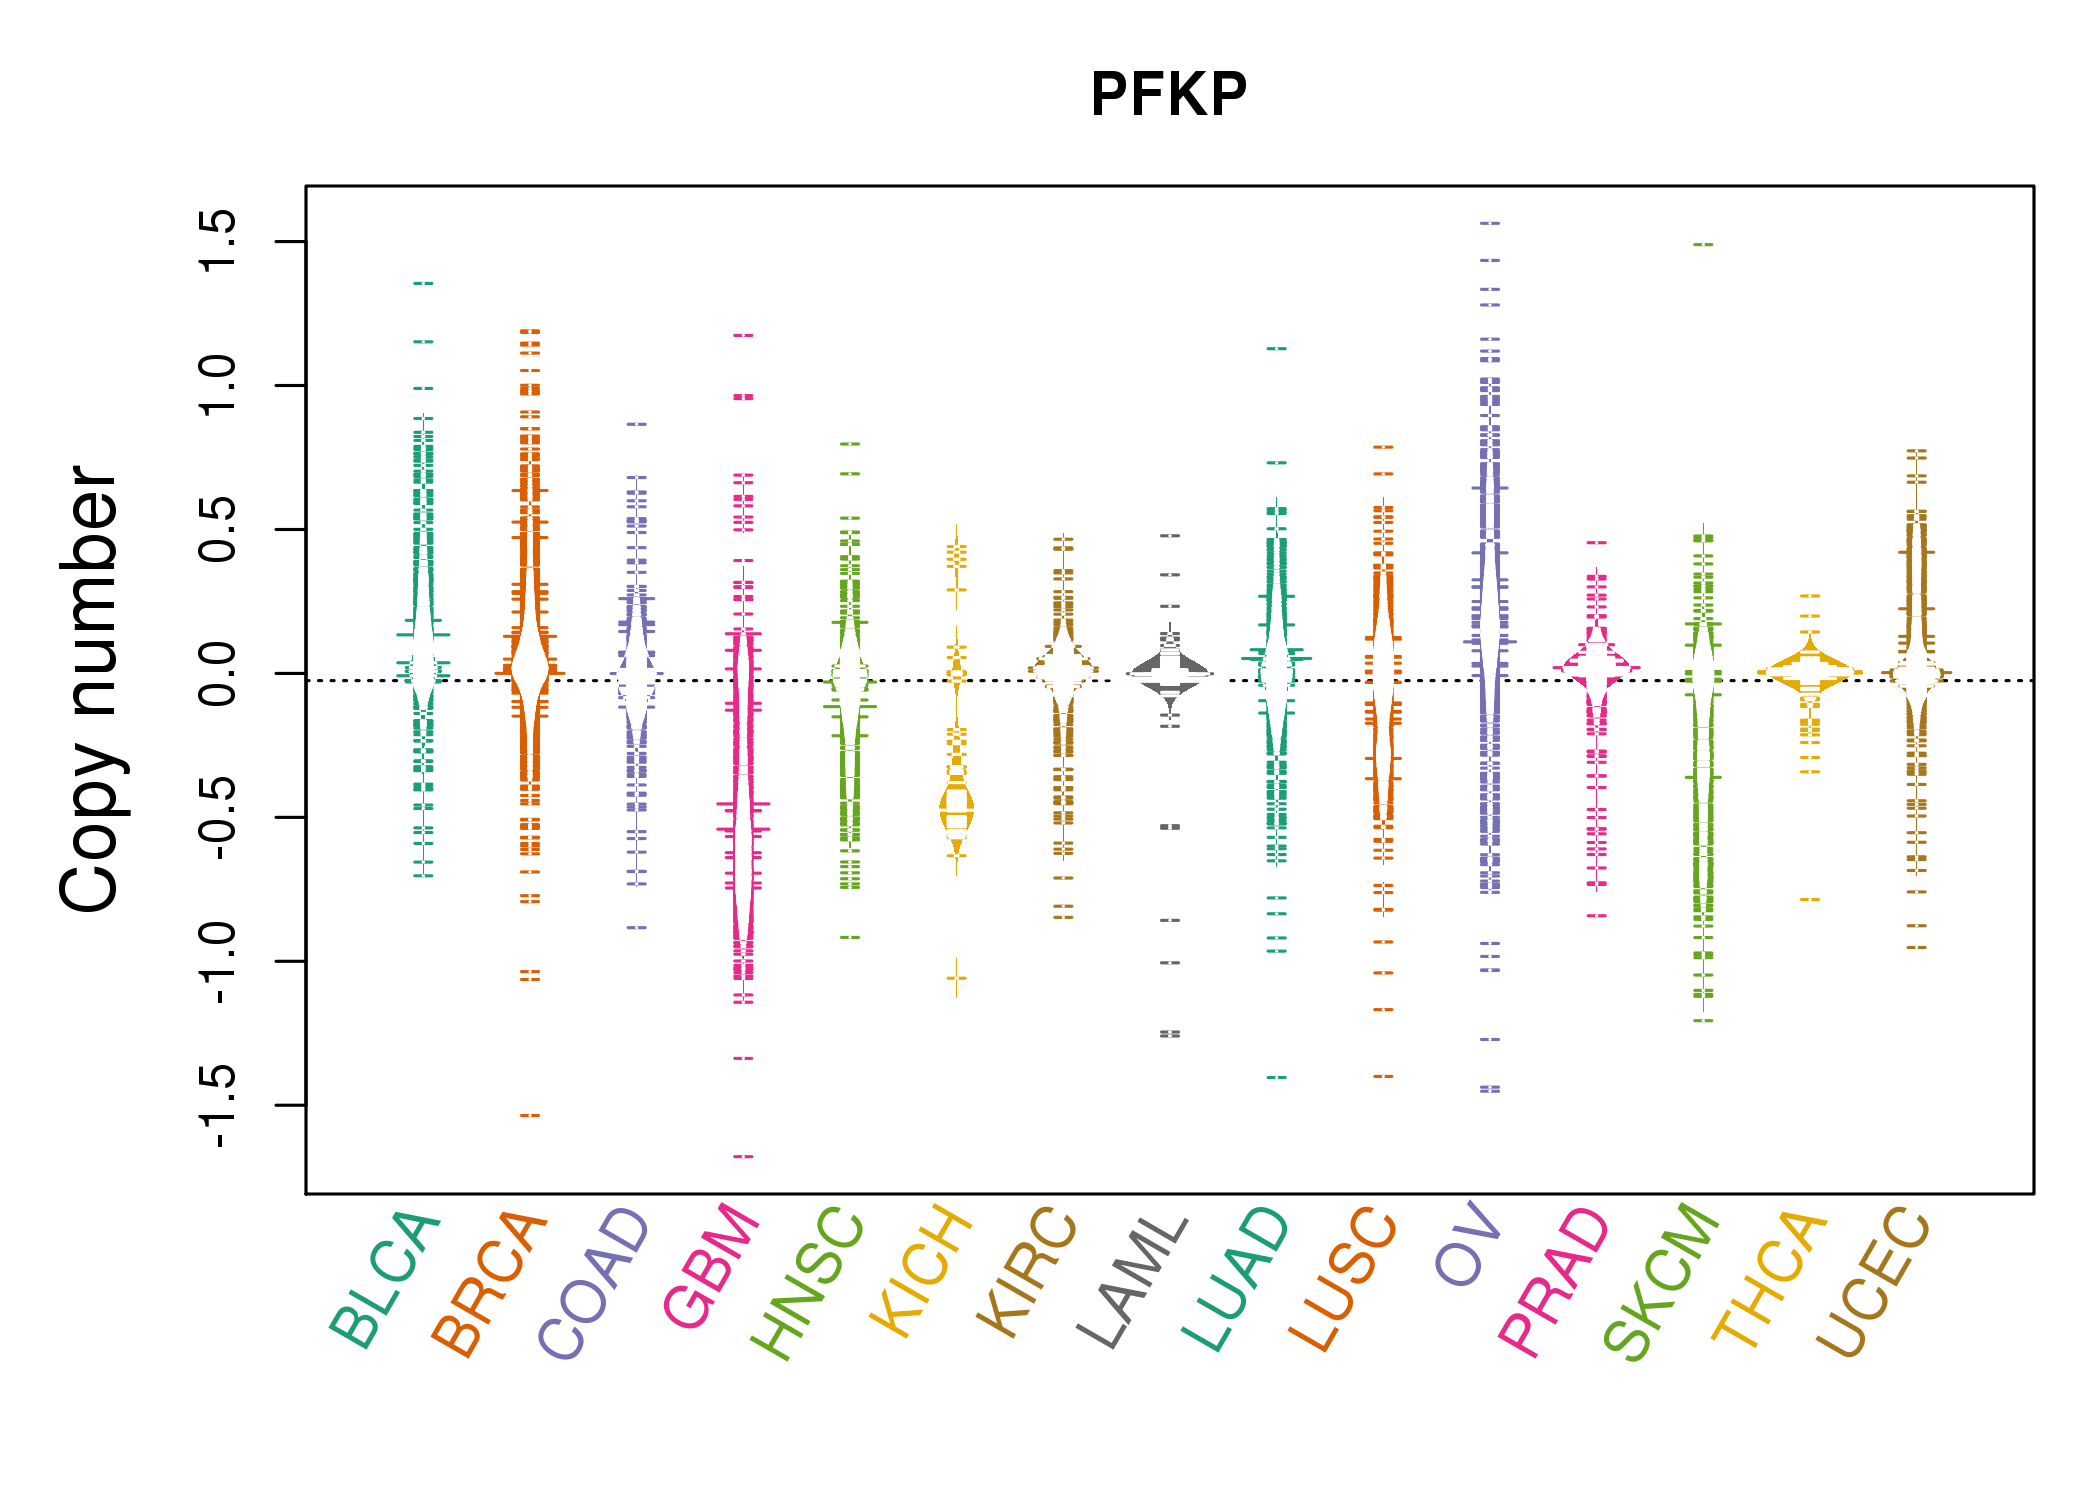 |
| cf) Tissue ID[Tissue type]: BLCA[Bladder Urothelial Carcinoma], BRCA[Breast invasive carcinoma], CESC[Cervical squamous cell carcinoma and endocervical adenocarcinoma], COAD[Colon adenocarcinoma], GBM[Glioblastoma multiforme], Glioma Low Grade, HNSC[Head and Neck squamous cell carcinoma], KICH[Kidney Chromophobe], KIRC[Kidney renal clear cell carcinoma], KIRP[Kidney renal papillary cell carcinoma], LAML[Acute Myeloid Leukemia], LUAD[Lung adenocarcinoma], LUSC[Lung squamous cell carcinoma], OV[Ovarian serous cystadenocarcinoma ], PAAD[Pancreatic adenocarcinoma], PRAD[Prostate adenocarcinoma], SKCM[Skin Cutaneous Melanoma], STAD[Stomach adenocarcinoma], THCA[Thyroid carcinoma], UCEC[Uterine Corpus Endometrial Carcinoma] |
| Top |
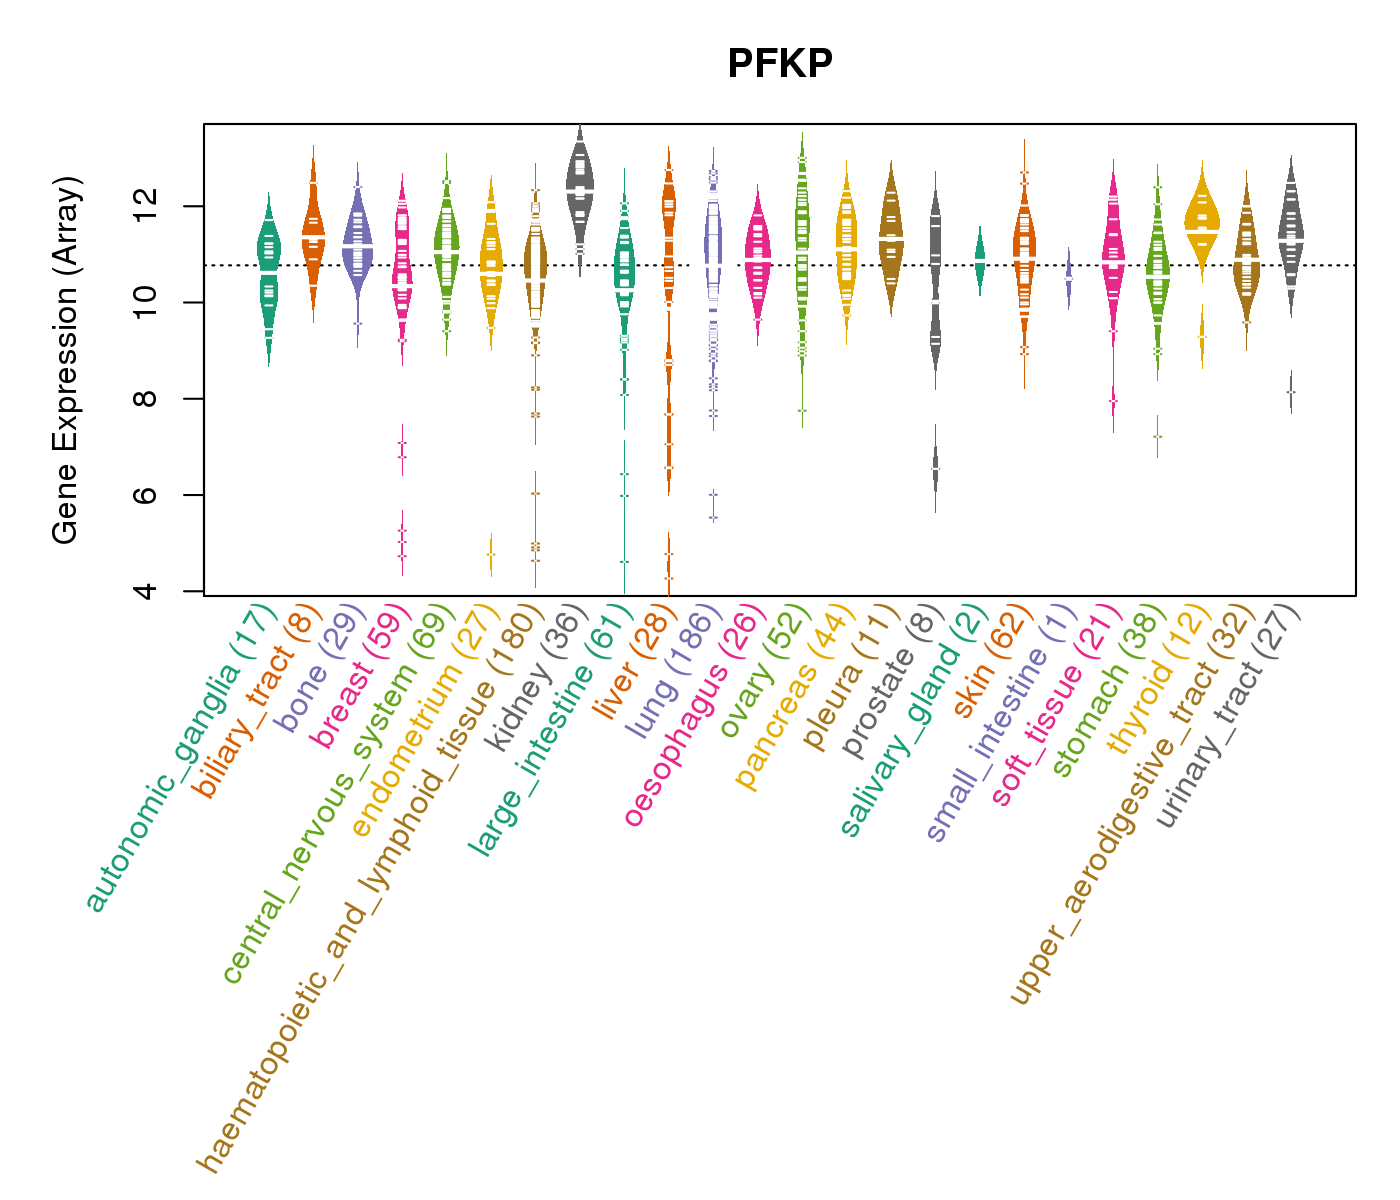
| Gene Expression for PFKP |
| * CCLE gene expression data were extracted from CCLE_Expression_Entrez_2012-10-18.res: Gene-centric RMA-normalized mRNA expression data. |
 |
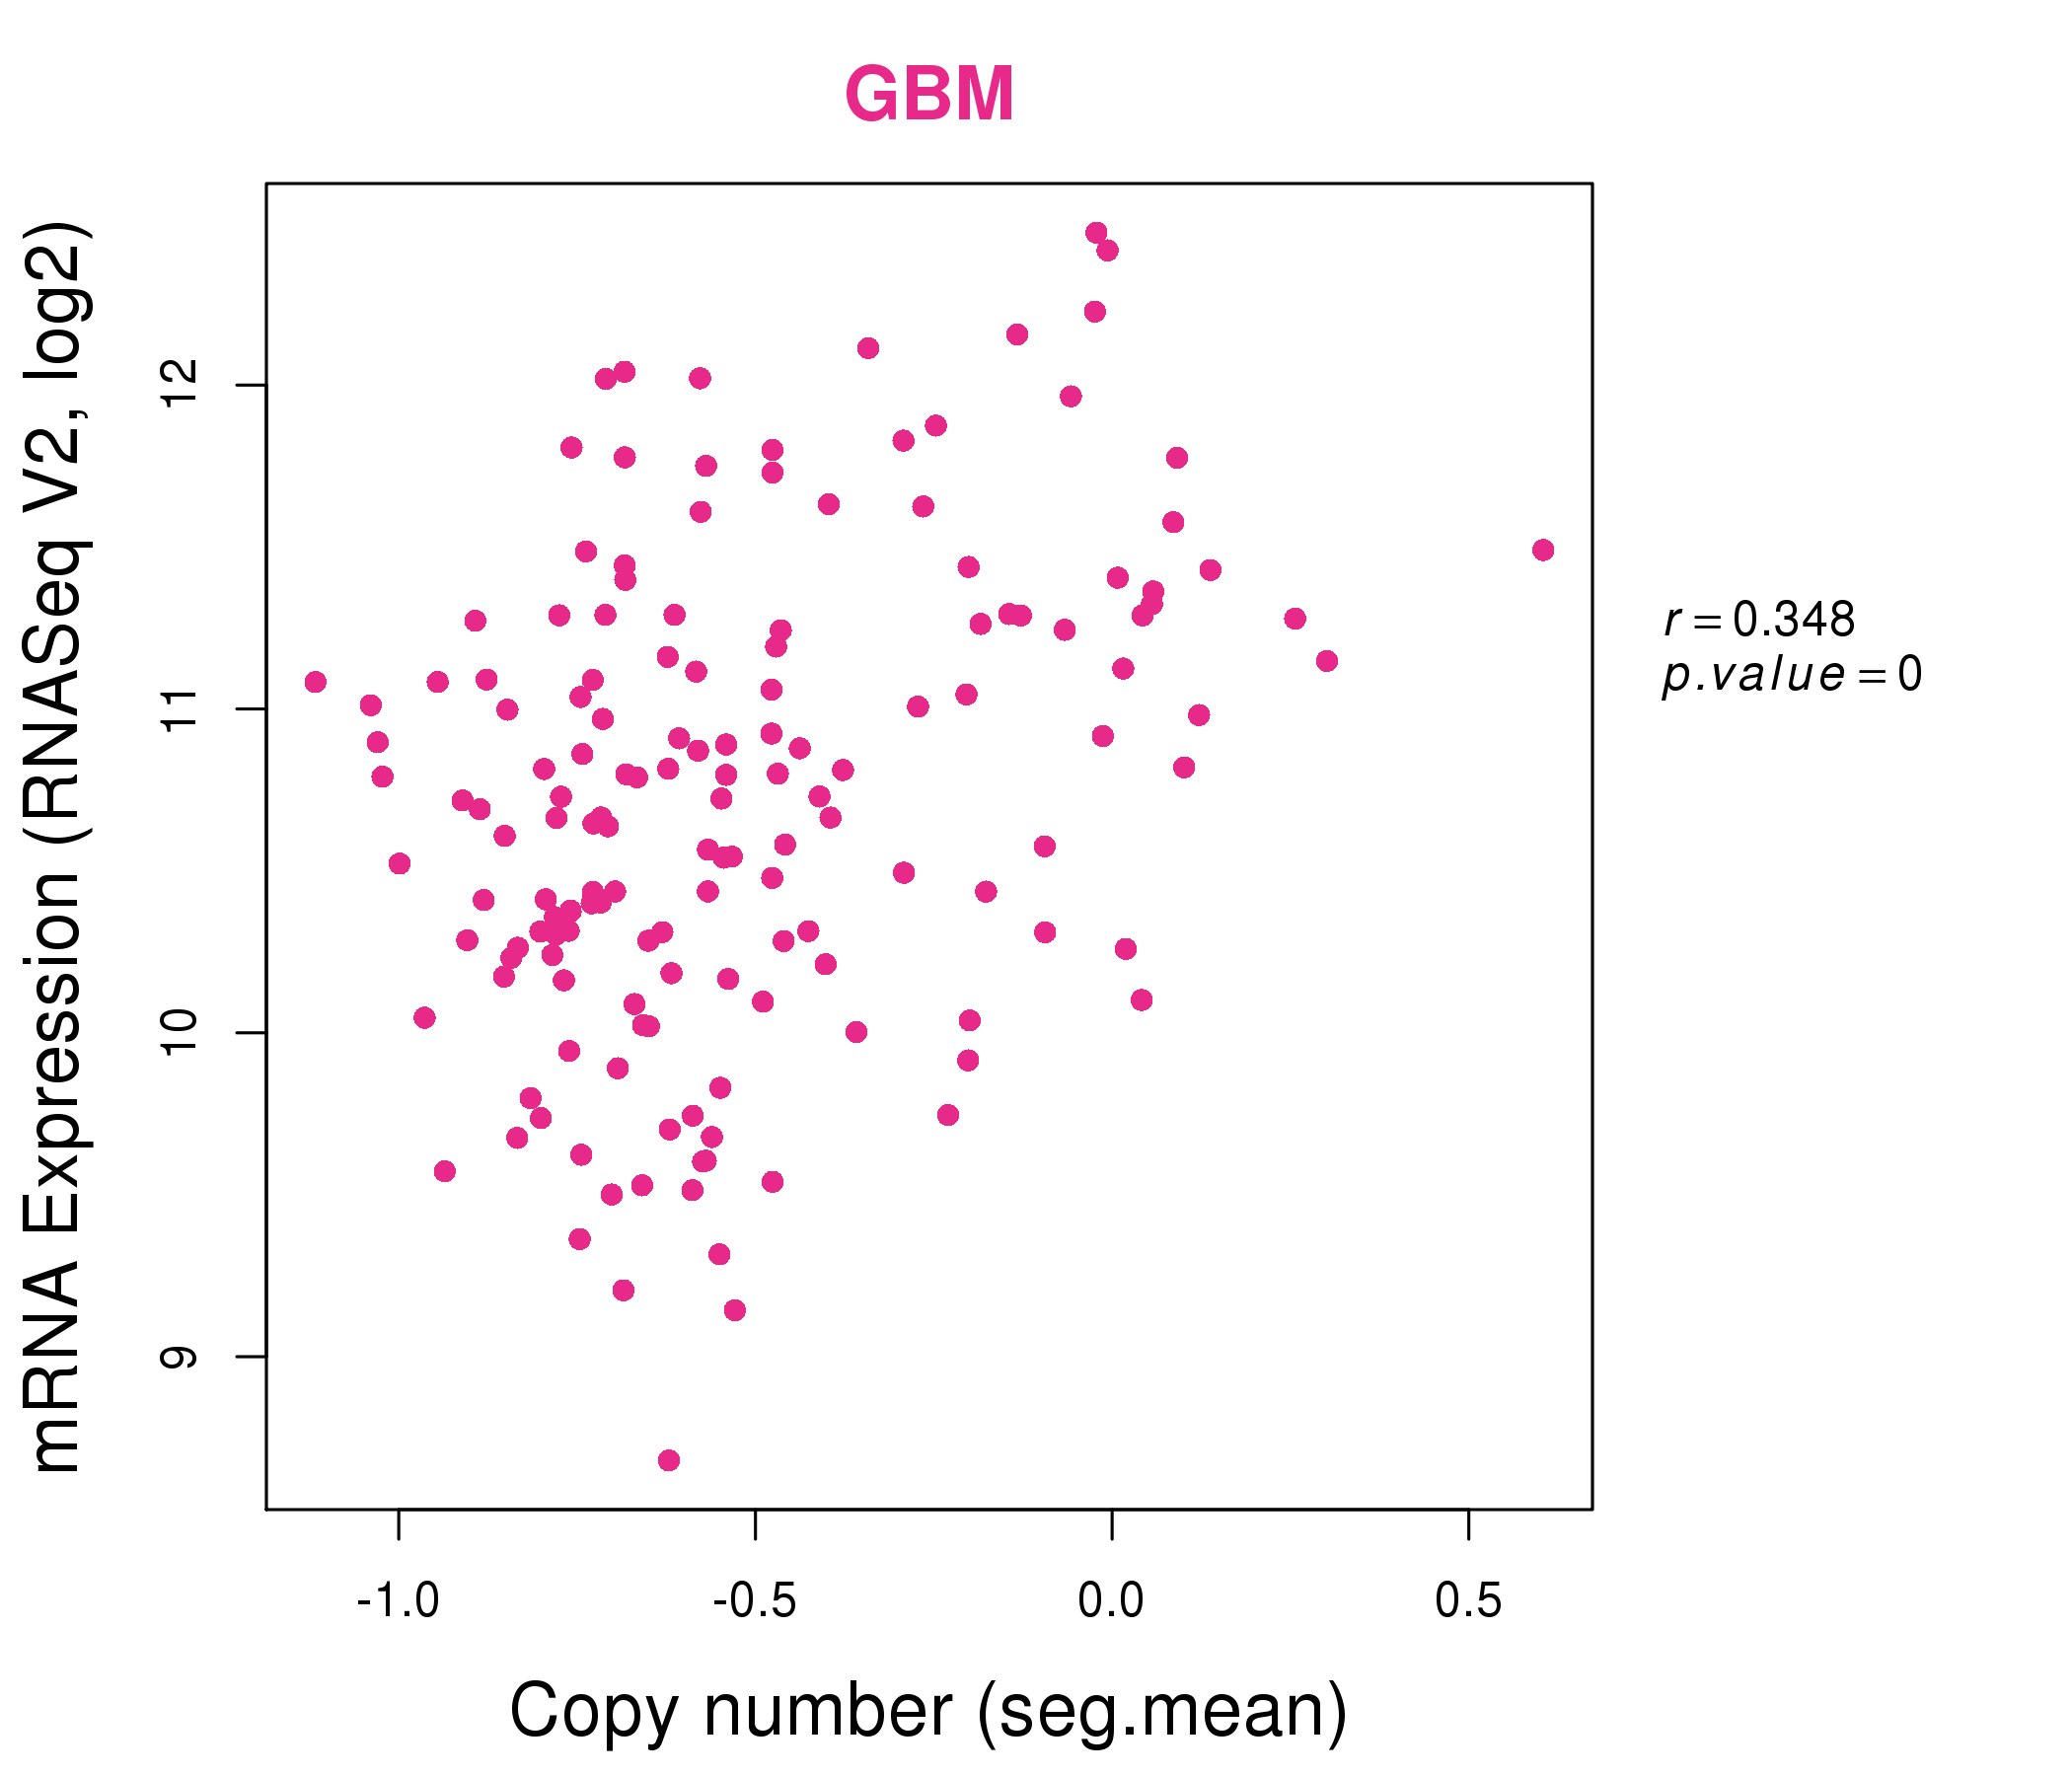
| * Normalized gene expression data of RNASeqV2 was extracted from TCGA using R package TCGA-Assembler. The URLs of all public data files on TCGA DCC data server were gathered at Jan-05-2015. Only eight cancer types have enough normal control samples for differential expression analysis. (t test, adjusted p<0.05 (using Benjamini-Hochberg FDR)) |
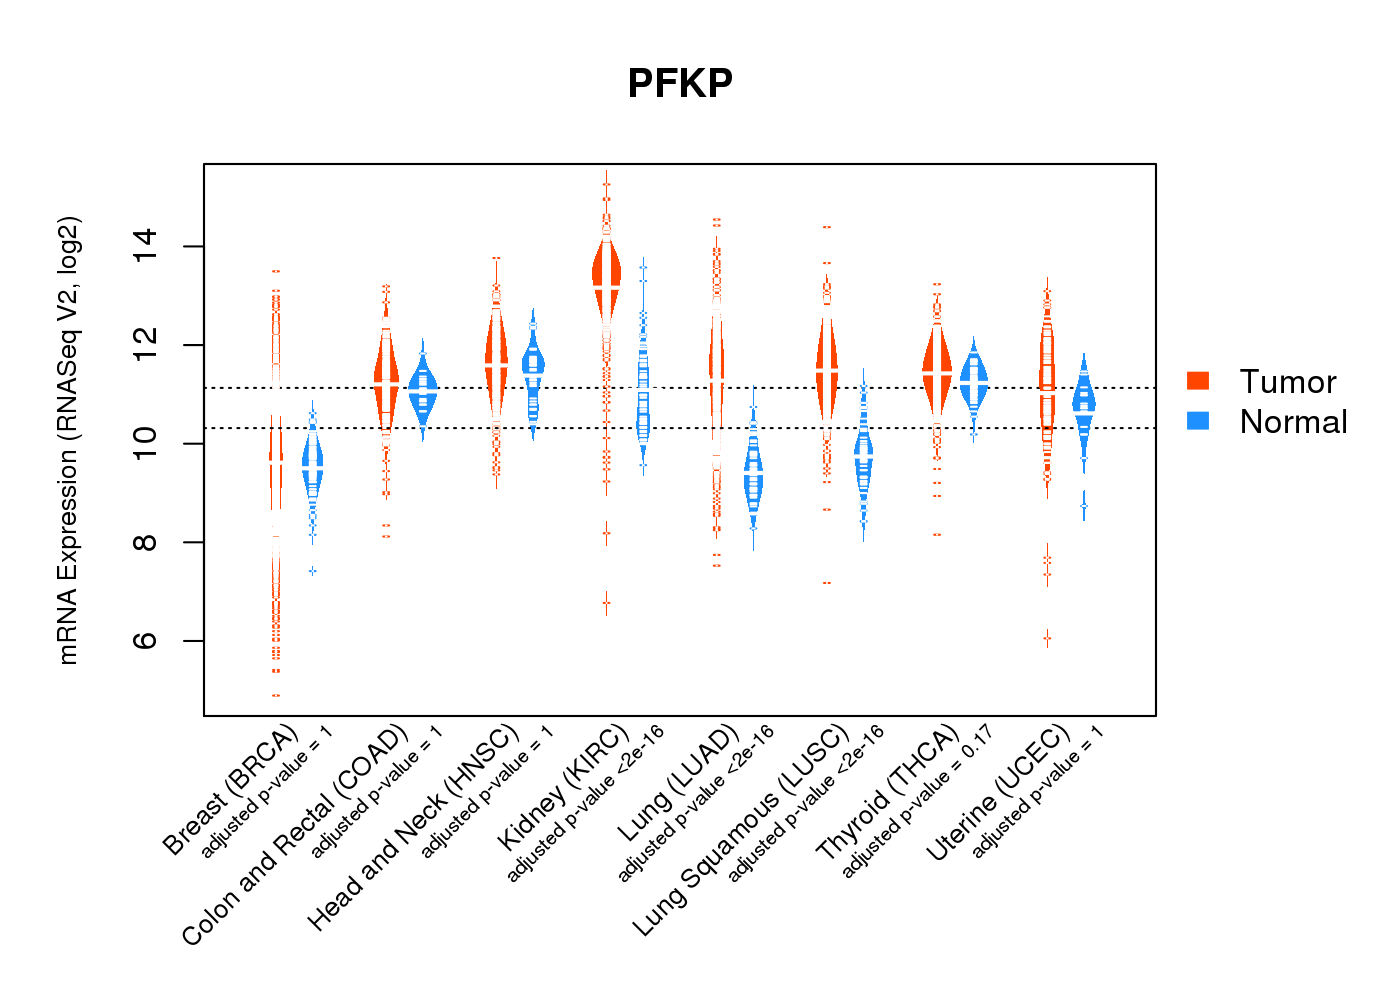 |
| Top |
| * This plots show the correlation between CNV and gene expression. |
: Open all plots for all cancer types
 |
|
 |
|
| Top |
| Gene-Gene Network Information |
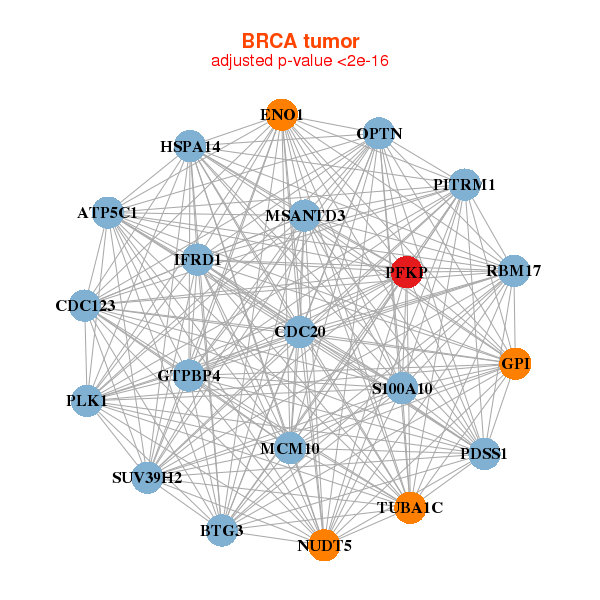
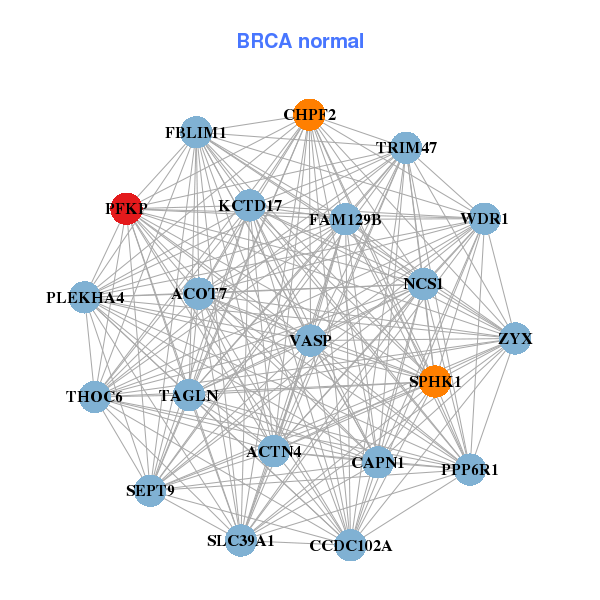
| * Co-Expression network figures were drawn using R package igraph. Only the top 20 genes with the highest correlations were shown. Red circle: input gene, orange circle: cell metabolism gene, sky circle: other gene |
: Open all plots for all cancer types
 |
|
| ATP5C1,BTG3,MSANTD3,CDC123,CDC20,ENO1,GPI, GTPBP4,HSPA14,IFRD1,MCM10,NUDT5,OPTN,PDSS1, PFKP,PITRM1,PLK1,RBM17,S100A10,SUV39H2,TUBA1C | ACOT7,ACTN4,CAPN1,CCDC102A,CHPF2,FAM129B,FBLIM1, KCTD17,NCS1,PFKP,PLEKHA4,PPP6R1,SEPT9,SLC39A1, SPHK1,TAGLN,THOC6,TRIM47,VASP,WDR1,ZYX |
 |
|
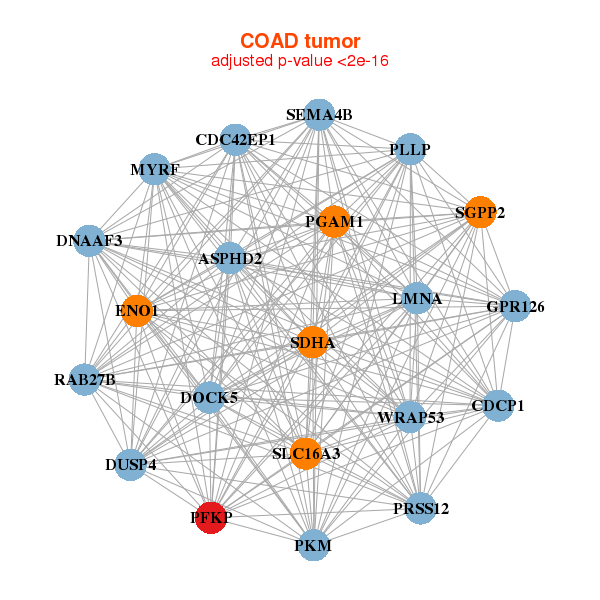
| ASPHD2,MYRF,DNAAF3,CDC42EP1,CDCP1,DOCK5,DUSP4, ENO1,GPR126,LMNA,PFKP,PGAM1,PKM,PLLP, PRSS12,RAB27B,SDHA,SEMA4B,SGPP2,SLC16A3,WRAP53 | ARHGDIA,CDKN1A,CEACAM5,CTTN,DNAJC5,GTPBP1,LHFPL2, LRP10,MXD1,PCBP1,PFKP,PLEKHA7,PLIN3,SLC37A1, SMPD1,STK24,TRIM14,XDH,YKT6,ZER1,ZNFX1 |
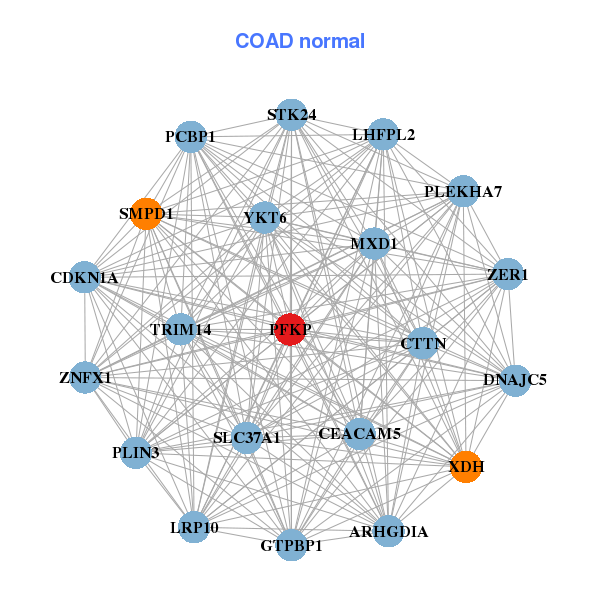
| * Co-Expression network figures were drawn using R package igraph. Only the top 20 genes with the highest correlations were shown. Red circle: input gene, orange circle: cell metabolism gene, sky circle: other gene |
: Open all plots for all cancer types
| Top |
: Open all interacting genes' information including KEGG pathway for all interacting genes from DAVID
| Top |
| Pharmacological Information for PFKP |
| There's no related Drug. |
| Top |
| Cross referenced IDs for PFKP |
| * We obtained these cross-references from Uniprot database. It covers 150 different DBs, 18 categories. http://www.uniprot.org/help/cross_references_section |
: Open all cross reference information
|
Copyright © 2016-Present - The Univsersity of Texas Health Science Center at Houston @ |