|
||||||||||||||||||||
| |
| Phenotypic Information (metabolism pathway, cancer, disease, phenome) |
| |
| |
| Gene-Gene Network Information: Co-Expression Network, Interacting Genes & KEGG |
| |
|


| Gene Summary for PGAM1 |
| Basic gene info. | Gene symbol | PGAM1 |
| Gene name | phosphoglycerate mutase 1 (brain) | |
| Synonyms | HEL-S-35|PGAM-B|PGAMA | |
| Cytomap | UCSC genome browser: 10q25.3 | |
| Genomic location | chr10 :99186026-99193198 | |
| Type of gene | protein-coding | |
| RefGenes | NM_002629.2, | |
| Ensembl id | ENSG00000171314 | |
| Description | BPG-dependent PGAM 1epididymis secretory protein Li 35phosphoglycerate mutase 1phosphoglycerate mutase A, nonmuscle formphosphoglycerate mutase isozyme B | |
| Modification date | 20141207 | |
| dbXrefs | MIM : 172250 | |
| HGNC : HGNC | ||
| Ensembl : ENSG00000171314 | ||
| HPRD : 01392 | ||
| Vega : OTTHUMG00000018846 | ||
| Protein | UniProt: go to UniProt's Cross Reference DB Table | |
| Expression | CleanEX: HS_PGAM1 | |
| BioGPS: 5223 | ||
| Gene Expression Atlas: ENSG00000171314 | ||
| The Human Protein Atlas: ENSG00000171314 | ||
| Pathway | NCI Pathway Interaction Database: PGAM1 | |
| KEGG: PGAM1 | ||
| REACTOME: PGAM1 | ||
| ConsensusPathDB | ||
| Pathway Commons: PGAM1 | ||
| Metabolism | MetaCyc: PGAM1 | |
| HUMANCyc: PGAM1 | ||
| Regulation | Ensembl's Regulation: ENSG00000171314 | |
| miRBase: chr10 :99,186,026-99,193,198 | ||
| TargetScan: NM_002629 | ||
| cisRED: ENSG00000171314 | ||
| Context | iHOP: PGAM1 | |
| cancer metabolism search in PubMed: PGAM1 | ||
| UCL Cancer Institute: PGAM1 | ||
| Assigned class in ccmGDB | A - This gene has a literature evidence and it belongs to cancer gene. | |
| References showing role of PGAM1 in cancer cell metabolism | 1. Obre E, Rossignol R (2015) Emerging concepts in bioenergetics and cancer research: metabolic flexibility, coupling, symbiosis, switch, oxidative tumors, metabolic remodeling, signaling and bioenergetic therapy. Int J Biochem Cell Biol 59: 167-181. doi: 10.1016/j.biocel.2014.12.008. go to article 2. Jiang X, Sun Q, Li H, Li K, Ren X (2014) The role of phosphoglycerate mutase 1 in tumor aerobic glycolysis and its potential therapeutic implications. Int J Cancer 135: 1991-1996. doi: 10.1002/ijc.28637. go to article 3. Stine ZE, Dang CV (2013) Stress eating and tuning out: cancer cells re-wire metabolism to counter stress. Crit Rev Biochem Mol Biol 48: 609-619. doi: 10.3109/10409238.2013.844093. pmid: 4063414. go to article 4. Hitosugi T, Zhou L, Fan J, Elf S, Zhang L, et al. (2013) Tyr26 phosphorylation of PGAM1 provides a metabolic advantage to tumours by stabilizing the active conformation. Nat Commun 4: 1790. doi: 10.1038/ncomms2759. pmid: 3648882. go to article 5. Chaneton B, Gottlieb E (2012) PGAMgnam style: a glycolytic switch controls biosynthesis. Cancer Cell 22: 565-566. doi: 10.1016/j.ccr.2012.10.014. go to article | |
| Top |
| Phenotypic Information for PGAM1(metabolism pathway, cancer, disease, phenome) |
| Cancer | CGAP: PGAM1 |
| Familial Cancer Database: PGAM1 | |
| * This gene is included in those cancer gene databases. |
|
|
|
|
|
|
| ||||||||||||||
Oncogene 1 | Significant driver gene in | |||||||||||||||||||
| cf) number; DB name 1 Oncogene; http://nar.oxfordjournals.org/content/35/suppl_1/D721.long, 2 Tumor Suppressor gene; https://bioinfo.uth.edu/TSGene/, 3 Cancer Gene Census; http://www.nature.com/nrc/journal/v4/n3/abs/nrc1299.html, 4 CancerGenes; http://nar.oxfordjournals.org/content/35/suppl_1/D721.long, 5 Network of Cancer Gene; http://ncg.kcl.ac.uk/index.php, 1Therapeutic Vulnerabilities in Cancer; http://cbio.mskcc.org/cancergenomics/statius/ |
| KEGG_GLYCOLYSIS_GLUCONEOGENESIS BIOCARTA_GLYCOLYSIS_PATHWAY REACTOME_METABOLISM_OF_CARBOHYDRATES REACTOME_GLUCOSE_METABOLISM | |
| OMIM | |
| Orphanet | |
| Disease | KEGG Disease: PGAM1 |
| MedGen: PGAM1 (Human Medical Genetics with Condition) | |
| ClinVar: PGAM1 | |
| Phenotype | MGI: PGAM1 (International Mouse Phenotyping Consortium) |
| PhenomicDB: PGAM1 | |
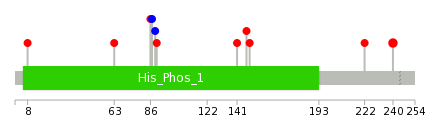
| Mutations for PGAM1 |
| * Under tables are showing count per each tissue to give us broad intuition about tissue specific mutation patterns.You can go to the detailed page for each mutation database's web site. |
| There's no structural variation information in COSMIC data for this gene. |
| * From mRNA Sanger sequences, Chitars2.0 arranged chimeric transcripts. This table shows PGAM1 related fusion information. |
| ID | Head Gene | Tail Gene | Accession | Gene_a | qStart_a | qEnd_a | Chromosome_a | tStart_a | tEnd_a | Gene_a | qStart_a | qEnd_a | Chromosome_a | tStart_a | tEnd_a |
| AK125057 | SMAD2 | 1 | 1430 | 18 | 45453116 | 45454544 | PGAM1 | 1431 | 3139 | 10 | 99186037 | 99193197 | |
| CN393630 | ATP7A | 1 | 63 | X | 77223635 | 77223697 | PGAM1 | 64 | 581 | 10 | 99192262 | 99192779 | |
| Top |
| There's no copy number variation information in COSMIC data for this gene. |
| Top |
|
 |
| Top |
| Stat. for Non-Synonymous SNVs (# total SNVs=9) | (# total SNVs=2) |
 |  |
(# total SNVs=0) | (# total SNVs=0) |
| Top |
| * When you move the cursor on each content, you can see more deailed mutation information on the Tooltip. Those are primary_site,primary_histology,mutation(aa),pubmedID. |
| GRCh37 position | Mutation(aa) | Unique sampleID count |
| chr10:99192235-99192235 | p.R240H | 2 |
| chr10:99190257-99190257 | p.L87L | 1 |
| chr10:99190263-99190263 | p.E89E | 1 |
| chr10:99190264-99190264 | p.R90W | 1 |
| chr10:99190719-99190719 | p.R141M | 1 |
| chr10:99190736-99190736 | p.E147K | 1 |
| chr10:99190742-99190742 | p.Q149E | 1 |
| chr10:99190894-99190894 | p.? | 1 |
| chr10:99192182-99192182 | p.K222N | 1 |
| chr10:99186086-99186086 | p.L8V | 1 |
| Top |
|
 |
| Point Mutation/ Tissue ID | 1 | 2 | 3 | 4 | 5 | 6 | 7 | 8 | 9 | 10 | 11 | 12 | 13 | 14 | 15 | 16 | 17 | 18 | 19 | 20 |
| # sample | 1 | 1 | 4 | 1 | 2 | 4 | ||||||||||||||
| # mutation | 1 | 1 | 3 | 1 | 2 | 4 | ||||||||||||||
| nonsynonymous SNV | 1 | 1 | 3 | 1 | 1 | 3 | ||||||||||||||
| synonymous SNV | 1 | 1 |
| cf) Tissue ID; Tissue type (1; BLCA[Bladder Urothelial Carcinoma], 2; BRCA[Breast invasive carcinoma], 3; CESC[Cervical squamous cell carcinoma and endocervical adenocarcinoma], 4; COAD[Colon adenocarcinoma], 5; GBM[Glioblastoma multiforme], 6; Glioma Low Grade, 7; HNSC[Head and Neck squamous cell carcinoma], 8; KICH[Kidney Chromophobe], 9; KIRC[Kidney renal clear cell carcinoma], 10; KIRP[Kidney renal papillary cell carcinoma], 11; LAML[Acute Myeloid Leukemia], 12; LUAD[Lung adenocarcinoma], 13; LUSC[Lung squamous cell carcinoma], 14; OV[Ovarian serous cystadenocarcinoma ], 15; PAAD[Pancreatic adenocarcinoma], 16; PRAD[Prostate adenocarcinoma], 17; SKCM[Skin Cutaneous Melanoma], 18:STAD[Stomach adenocarcinoma], 19:THCA[Thyroid carcinoma], 20:UCEC[Uterine Corpus Endometrial Carcinoma]) |
| Top |
| * We represented just top 10 SNVs. When you move the cursor on each content, you can see more deailed mutation information on the Tooltip. Those are primary_site, primary_histology, mutation(aa), pubmedID. |
| Genomic Position | Mutation(aa) | Unique sampleID count |
| chr10:99192235 | p.R240H | 2 |
| chr10:99190184 | p.R141M | 1 |
| chr10:99190253 | p.E147K | 1 |
| chr10:99190257 | p.Q149E | 1 |
| chr10:99190263 | p.P173S | 1 |
| chr10:99190264 | p.E198Q | 1 |
| chr10:99190719 | p.A3S | 1 |
| chr10:99190736 | p.L8V | 1 |
| chr10:99190742 | p.A63V | 1 |
| chr10:99190814 | p.R86H | 1 |
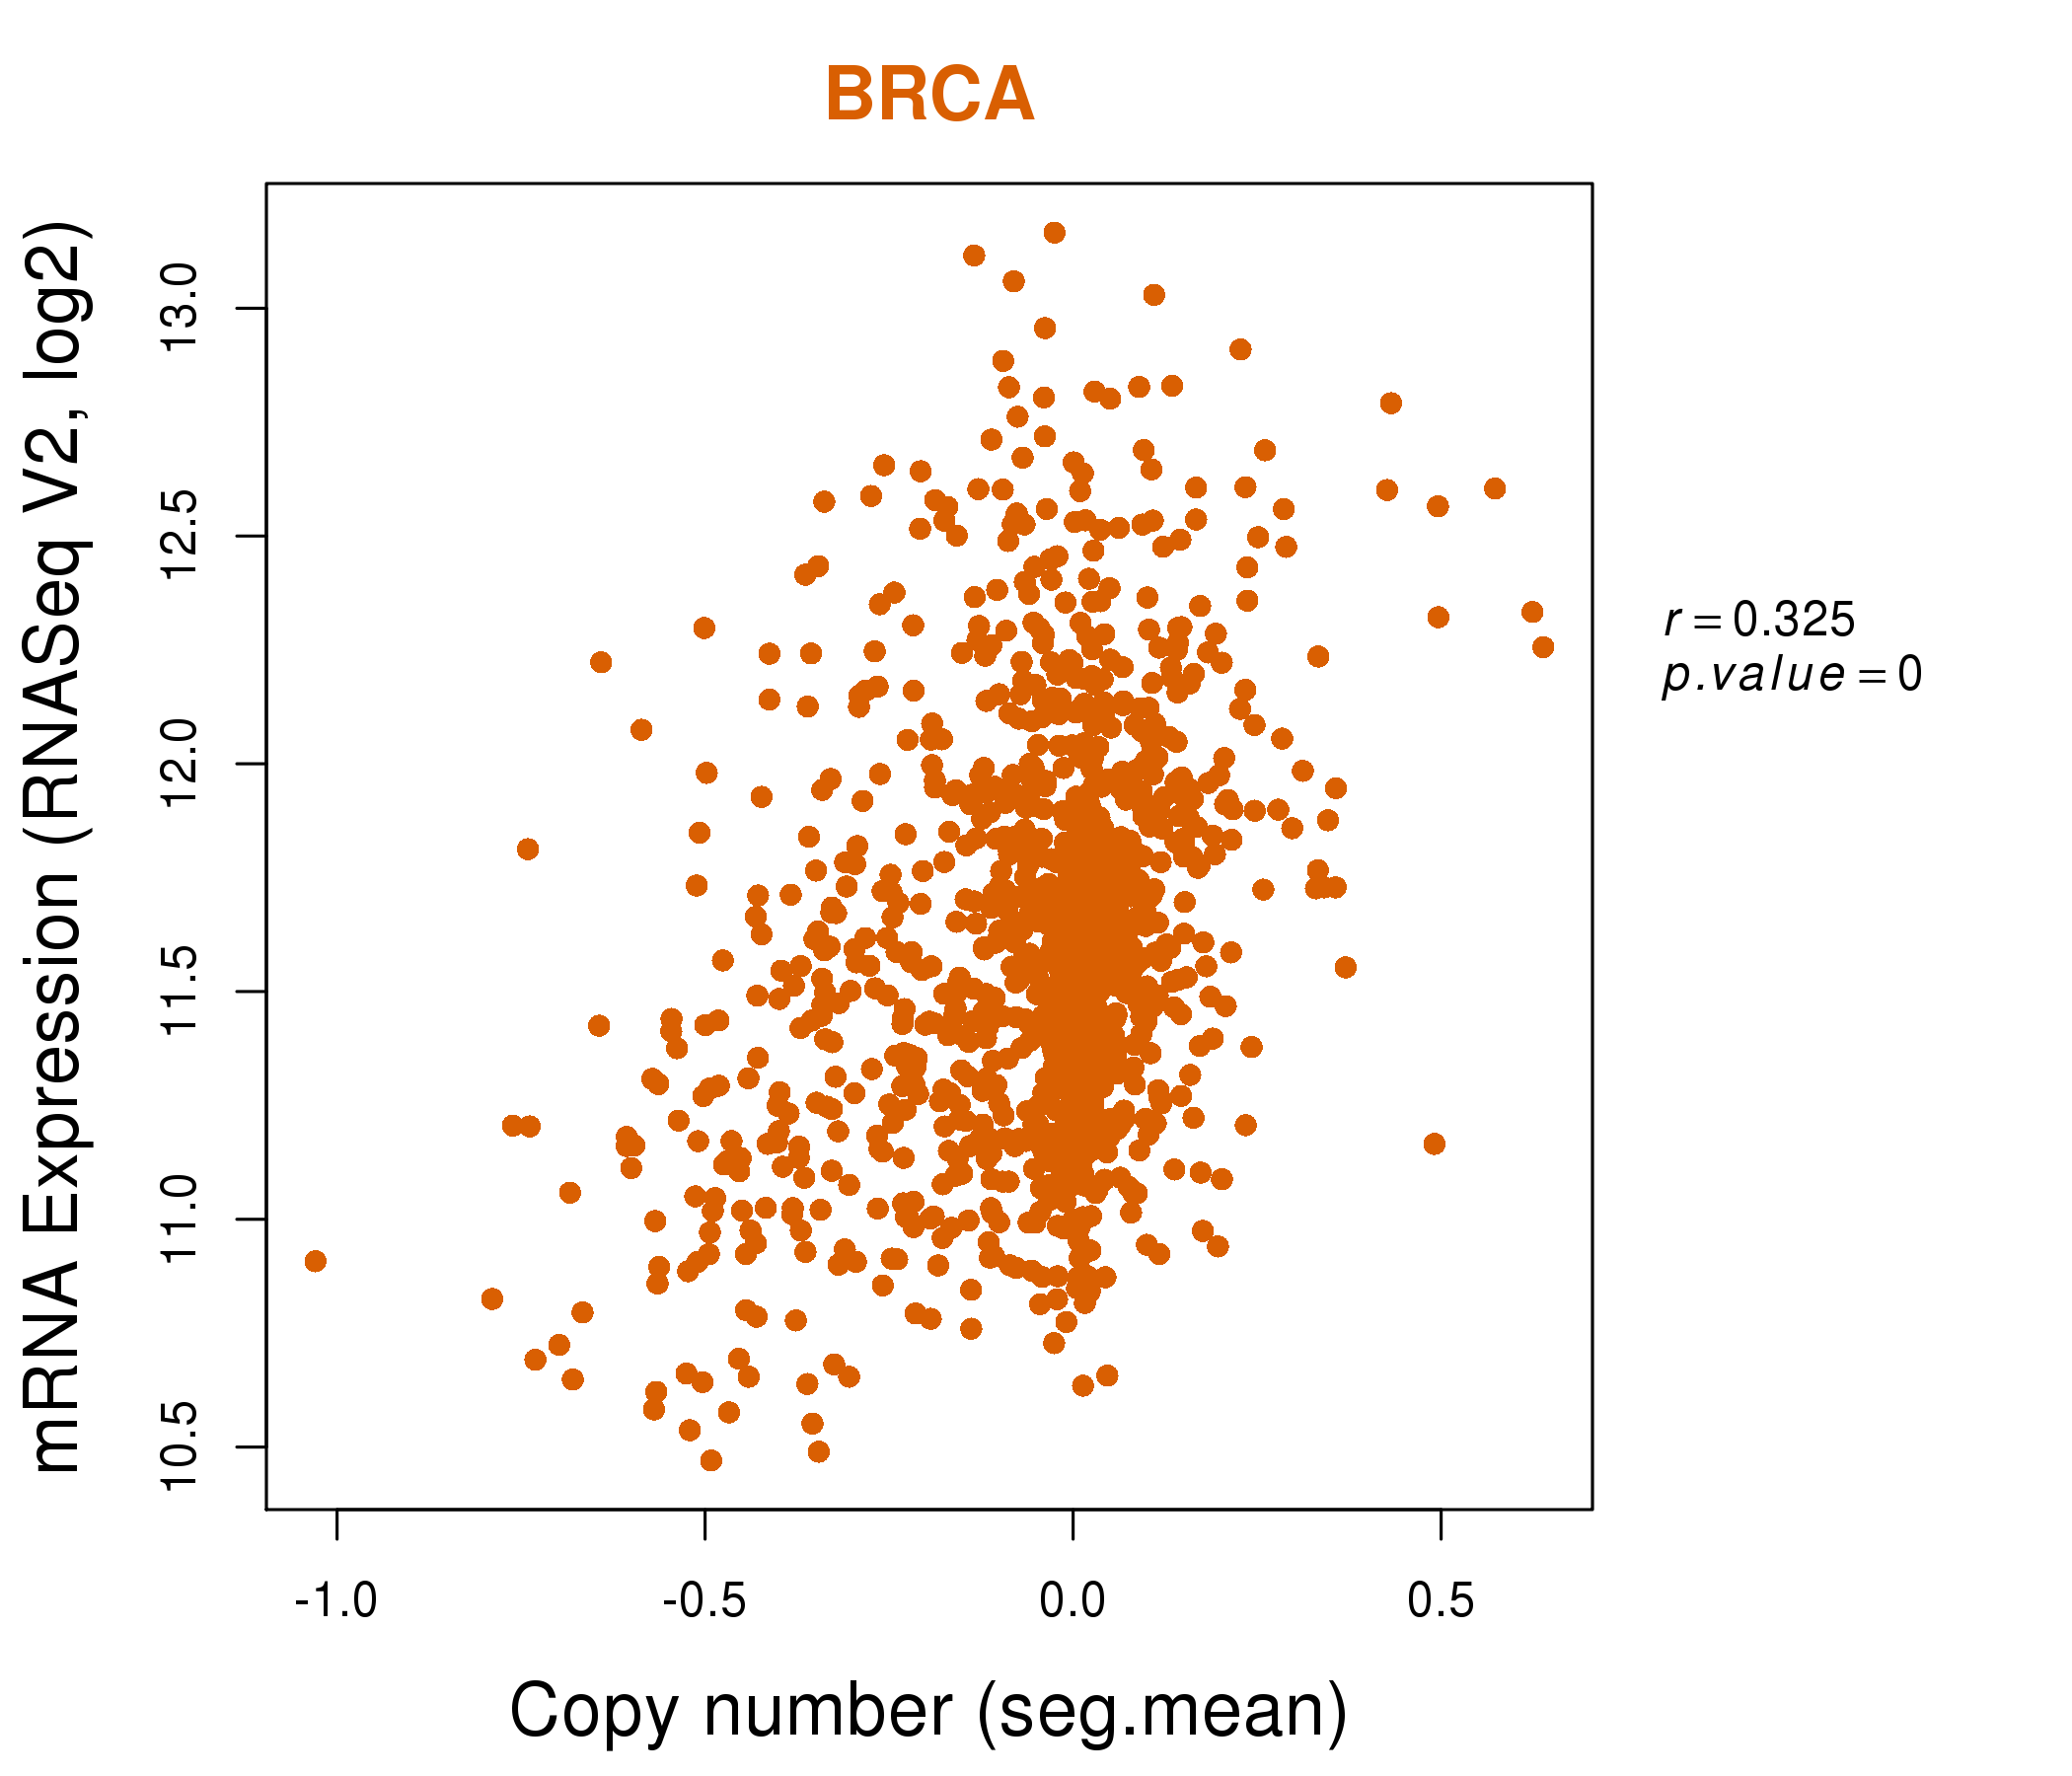
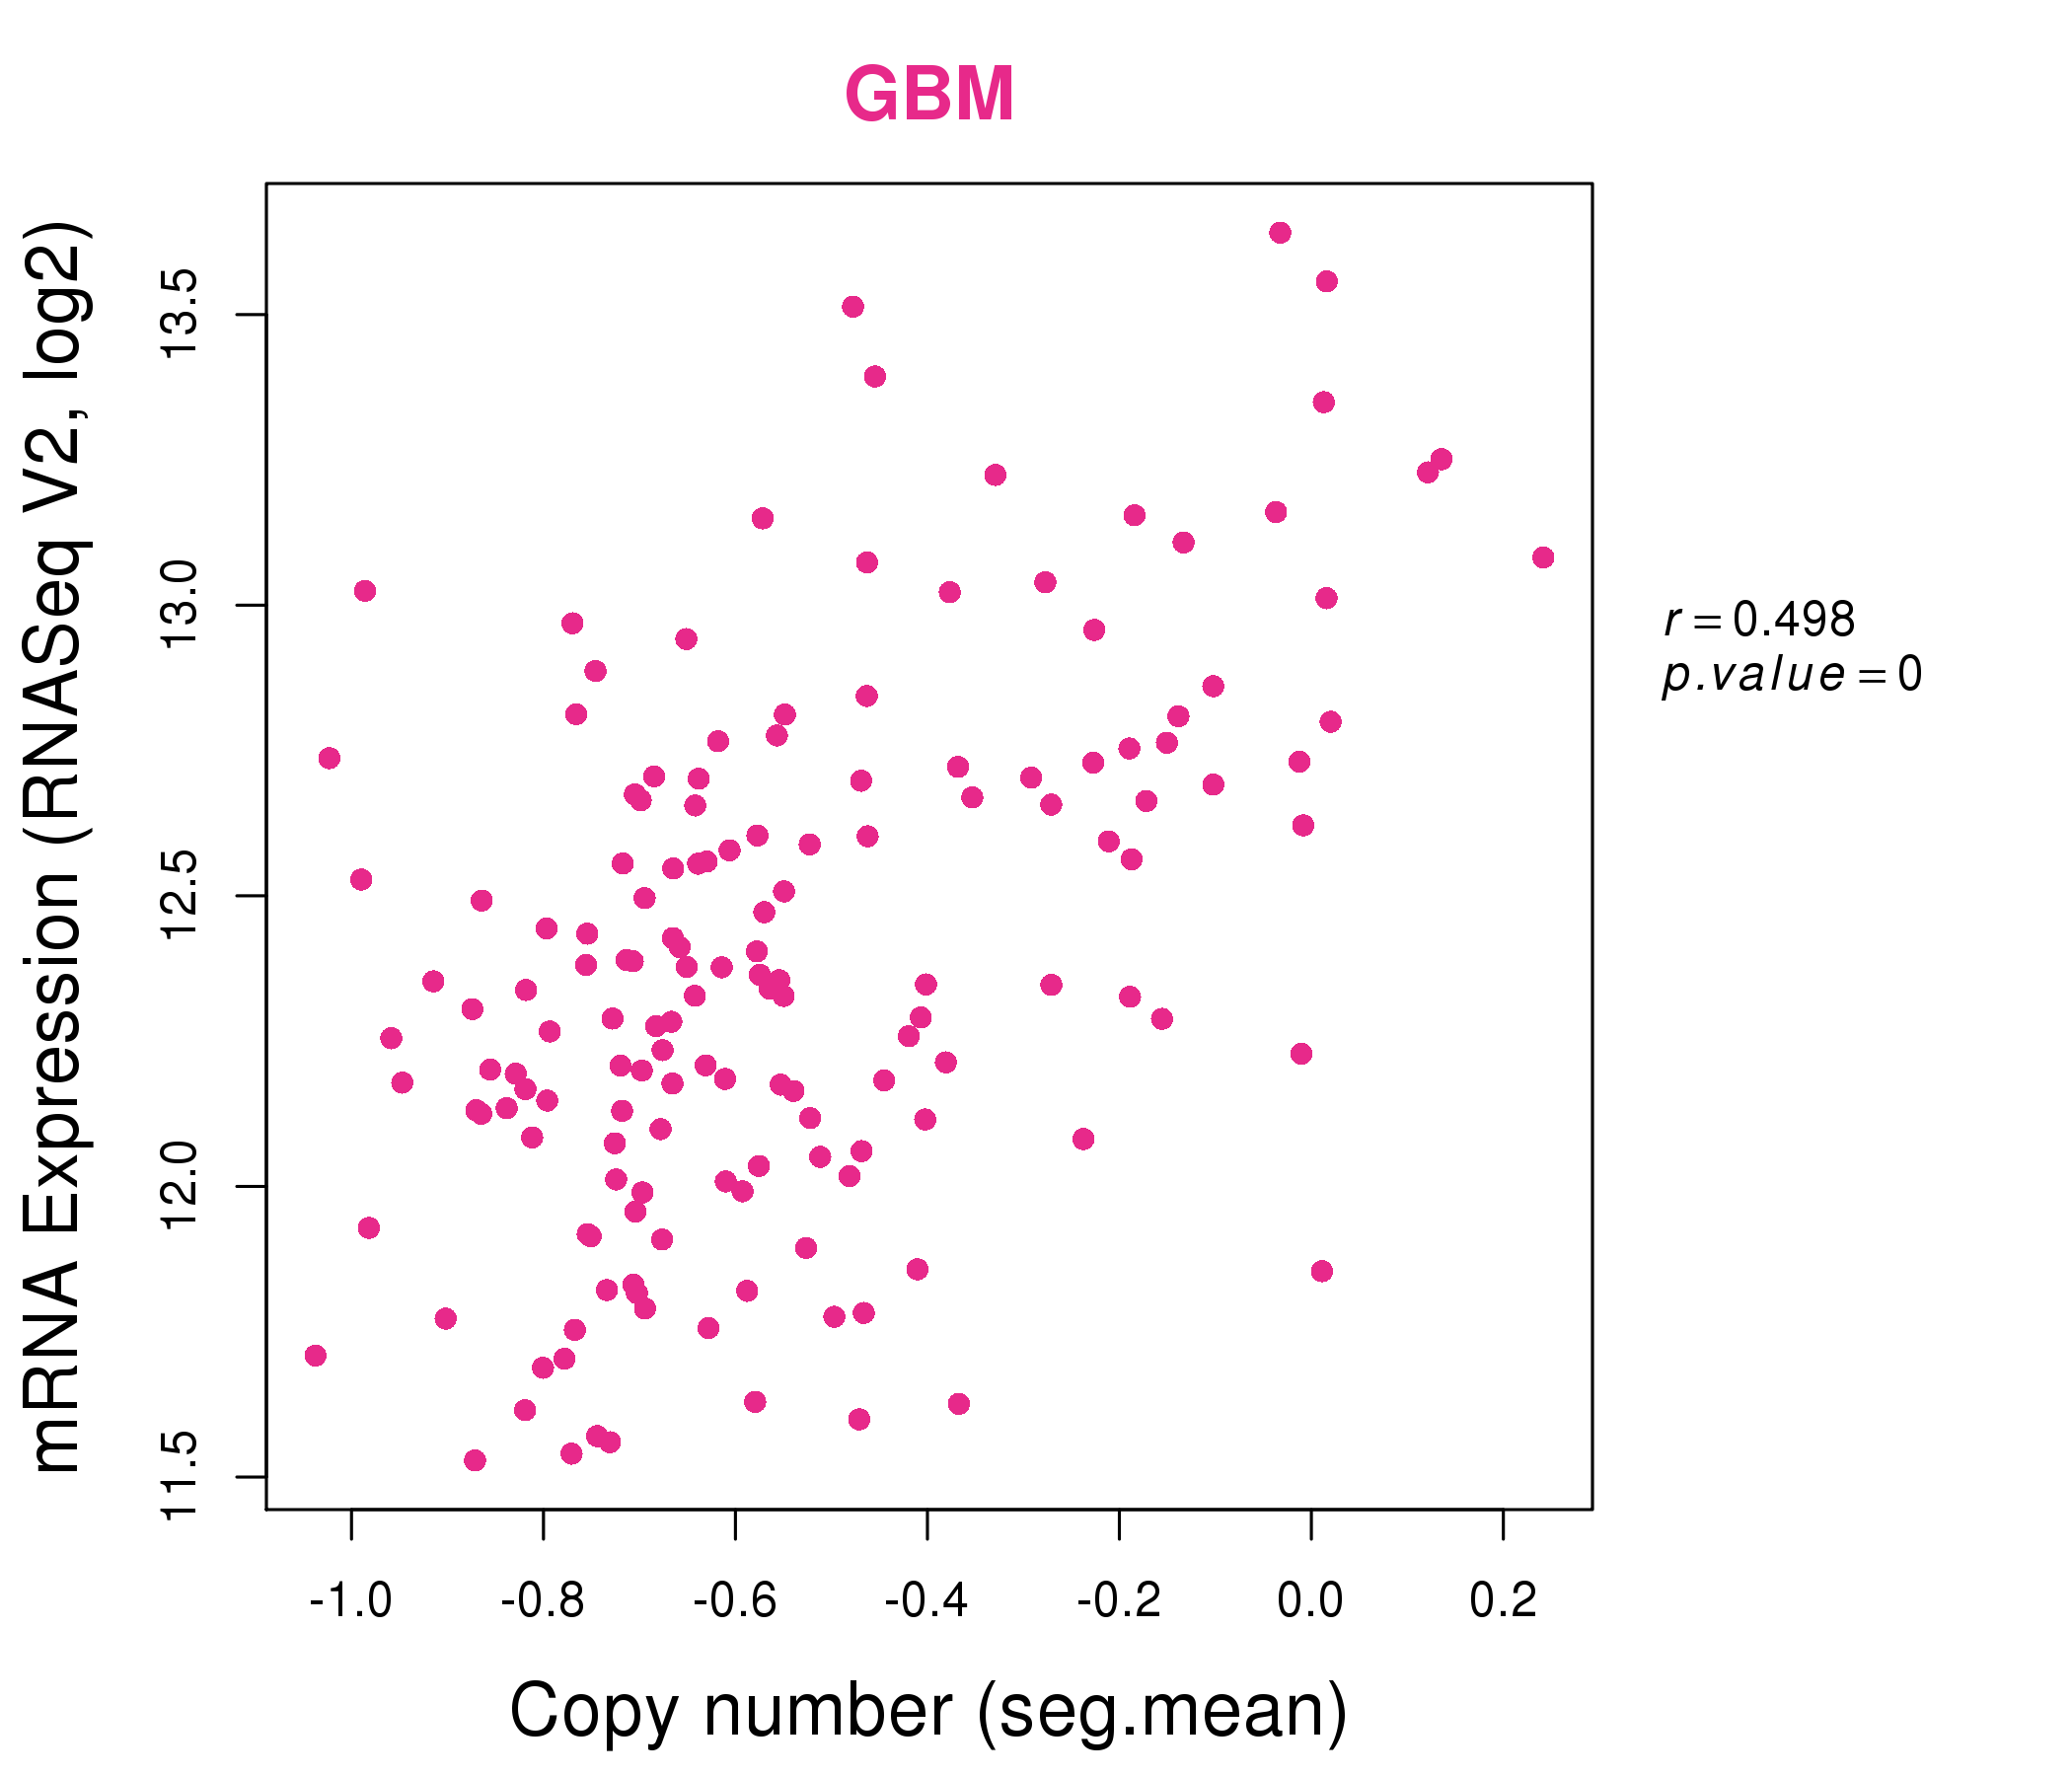
| * Copy number data were extracted from TCGA using R package TCGA-Assembler. The URLs of all public data files on TCGA DCC data server were gathered on Jan-05-2015. Function ProcessCNAData in TCGA-Assembler package was used to obtain gene-level copy number value which is calculated as the average copy number of the genomic region of a gene. |
 |
| cf) Tissue ID[Tissue type]: BLCA[Bladder Urothelial Carcinoma], BRCA[Breast invasive carcinoma], CESC[Cervical squamous cell carcinoma and endocervical adenocarcinoma], COAD[Colon adenocarcinoma], GBM[Glioblastoma multiforme], Glioma Low Grade, HNSC[Head and Neck squamous cell carcinoma], KICH[Kidney Chromophobe], KIRC[Kidney renal clear cell carcinoma], KIRP[Kidney renal papillary cell carcinoma], LAML[Acute Myeloid Leukemia], LUAD[Lung adenocarcinoma], LUSC[Lung squamous cell carcinoma], OV[Ovarian serous cystadenocarcinoma ], PAAD[Pancreatic adenocarcinoma], PRAD[Prostate adenocarcinoma], SKCM[Skin Cutaneous Melanoma], STAD[Stomach adenocarcinoma], THCA[Thyroid carcinoma], UCEC[Uterine Corpus Endometrial Carcinoma] |
| Top |
| Gene Expression for PGAM1 |
| * CCLE gene expression data were extracted from CCLE_Expression_Entrez_2012-10-18.res: Gene-centric RMA-normalized mRNA expression data. |
 |
| * Normalized gene expression data of RNASeqV2 was extracted from TCGA using R package TCGA-Assembler. The URLs of all public data files on TCGA DCC data server were gathered at Jan-05-2015. Only eight cancer types have enough normal control samples for differential expression analysis. (t test, adjusted p<0.05 (using Benjamini-Hochberg FDR)) |
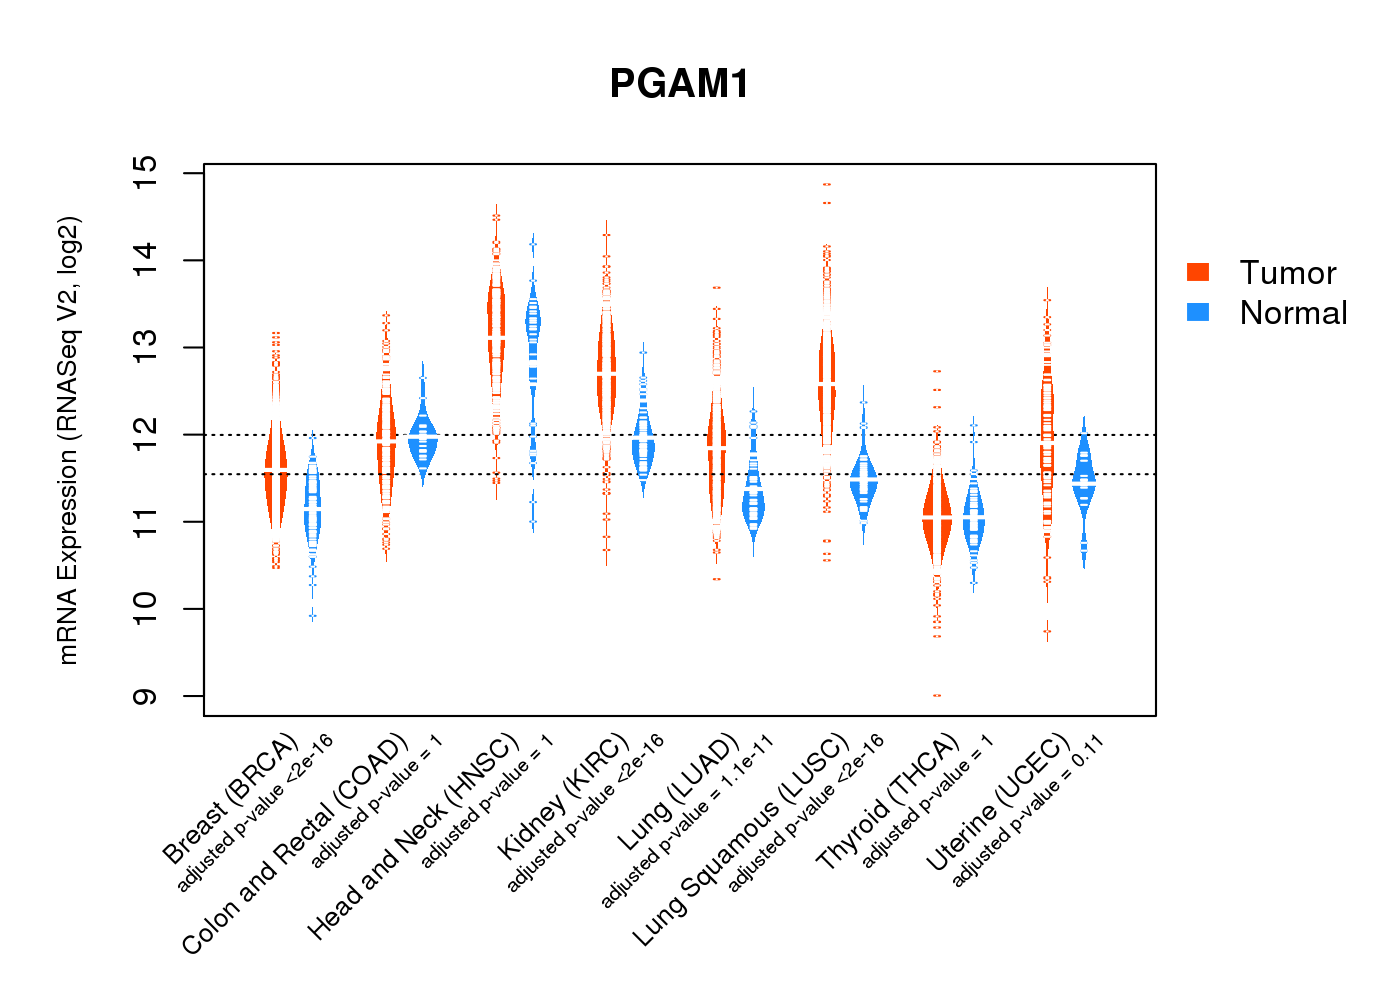 |
| Top |
| * This plots show the correlation between CNV and gene expression. |
: Open all plots for all cancer types
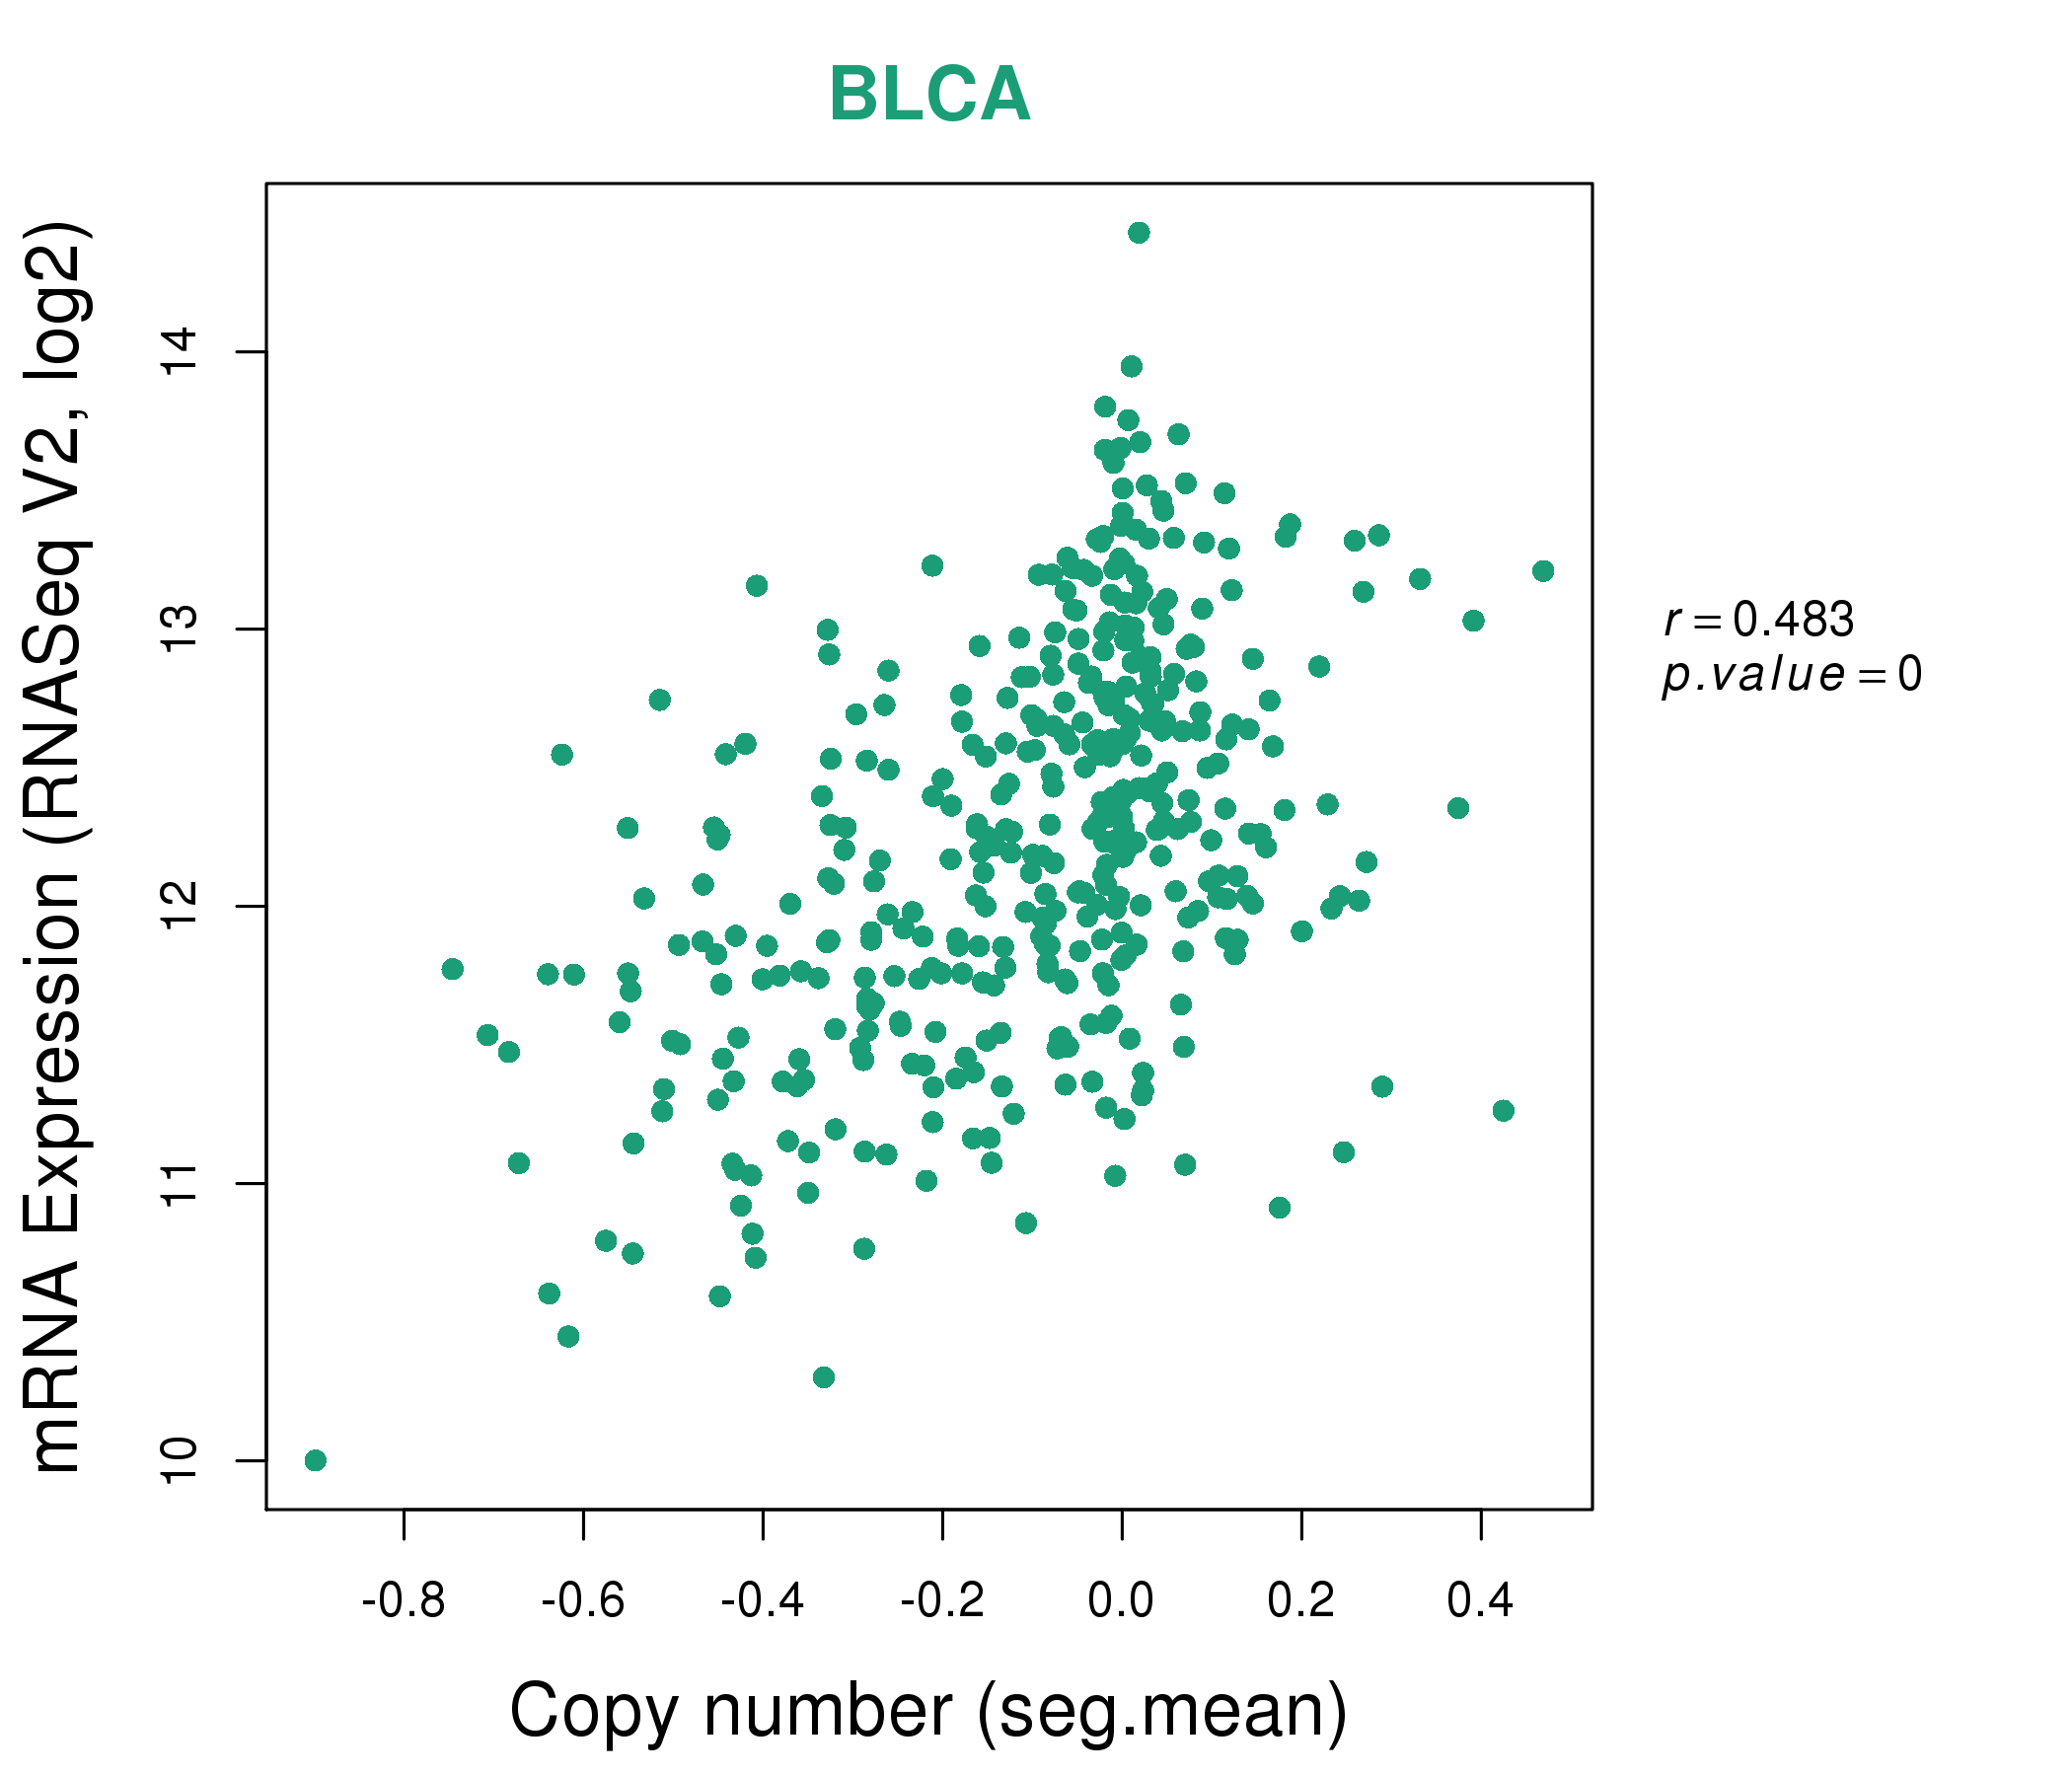 |
|
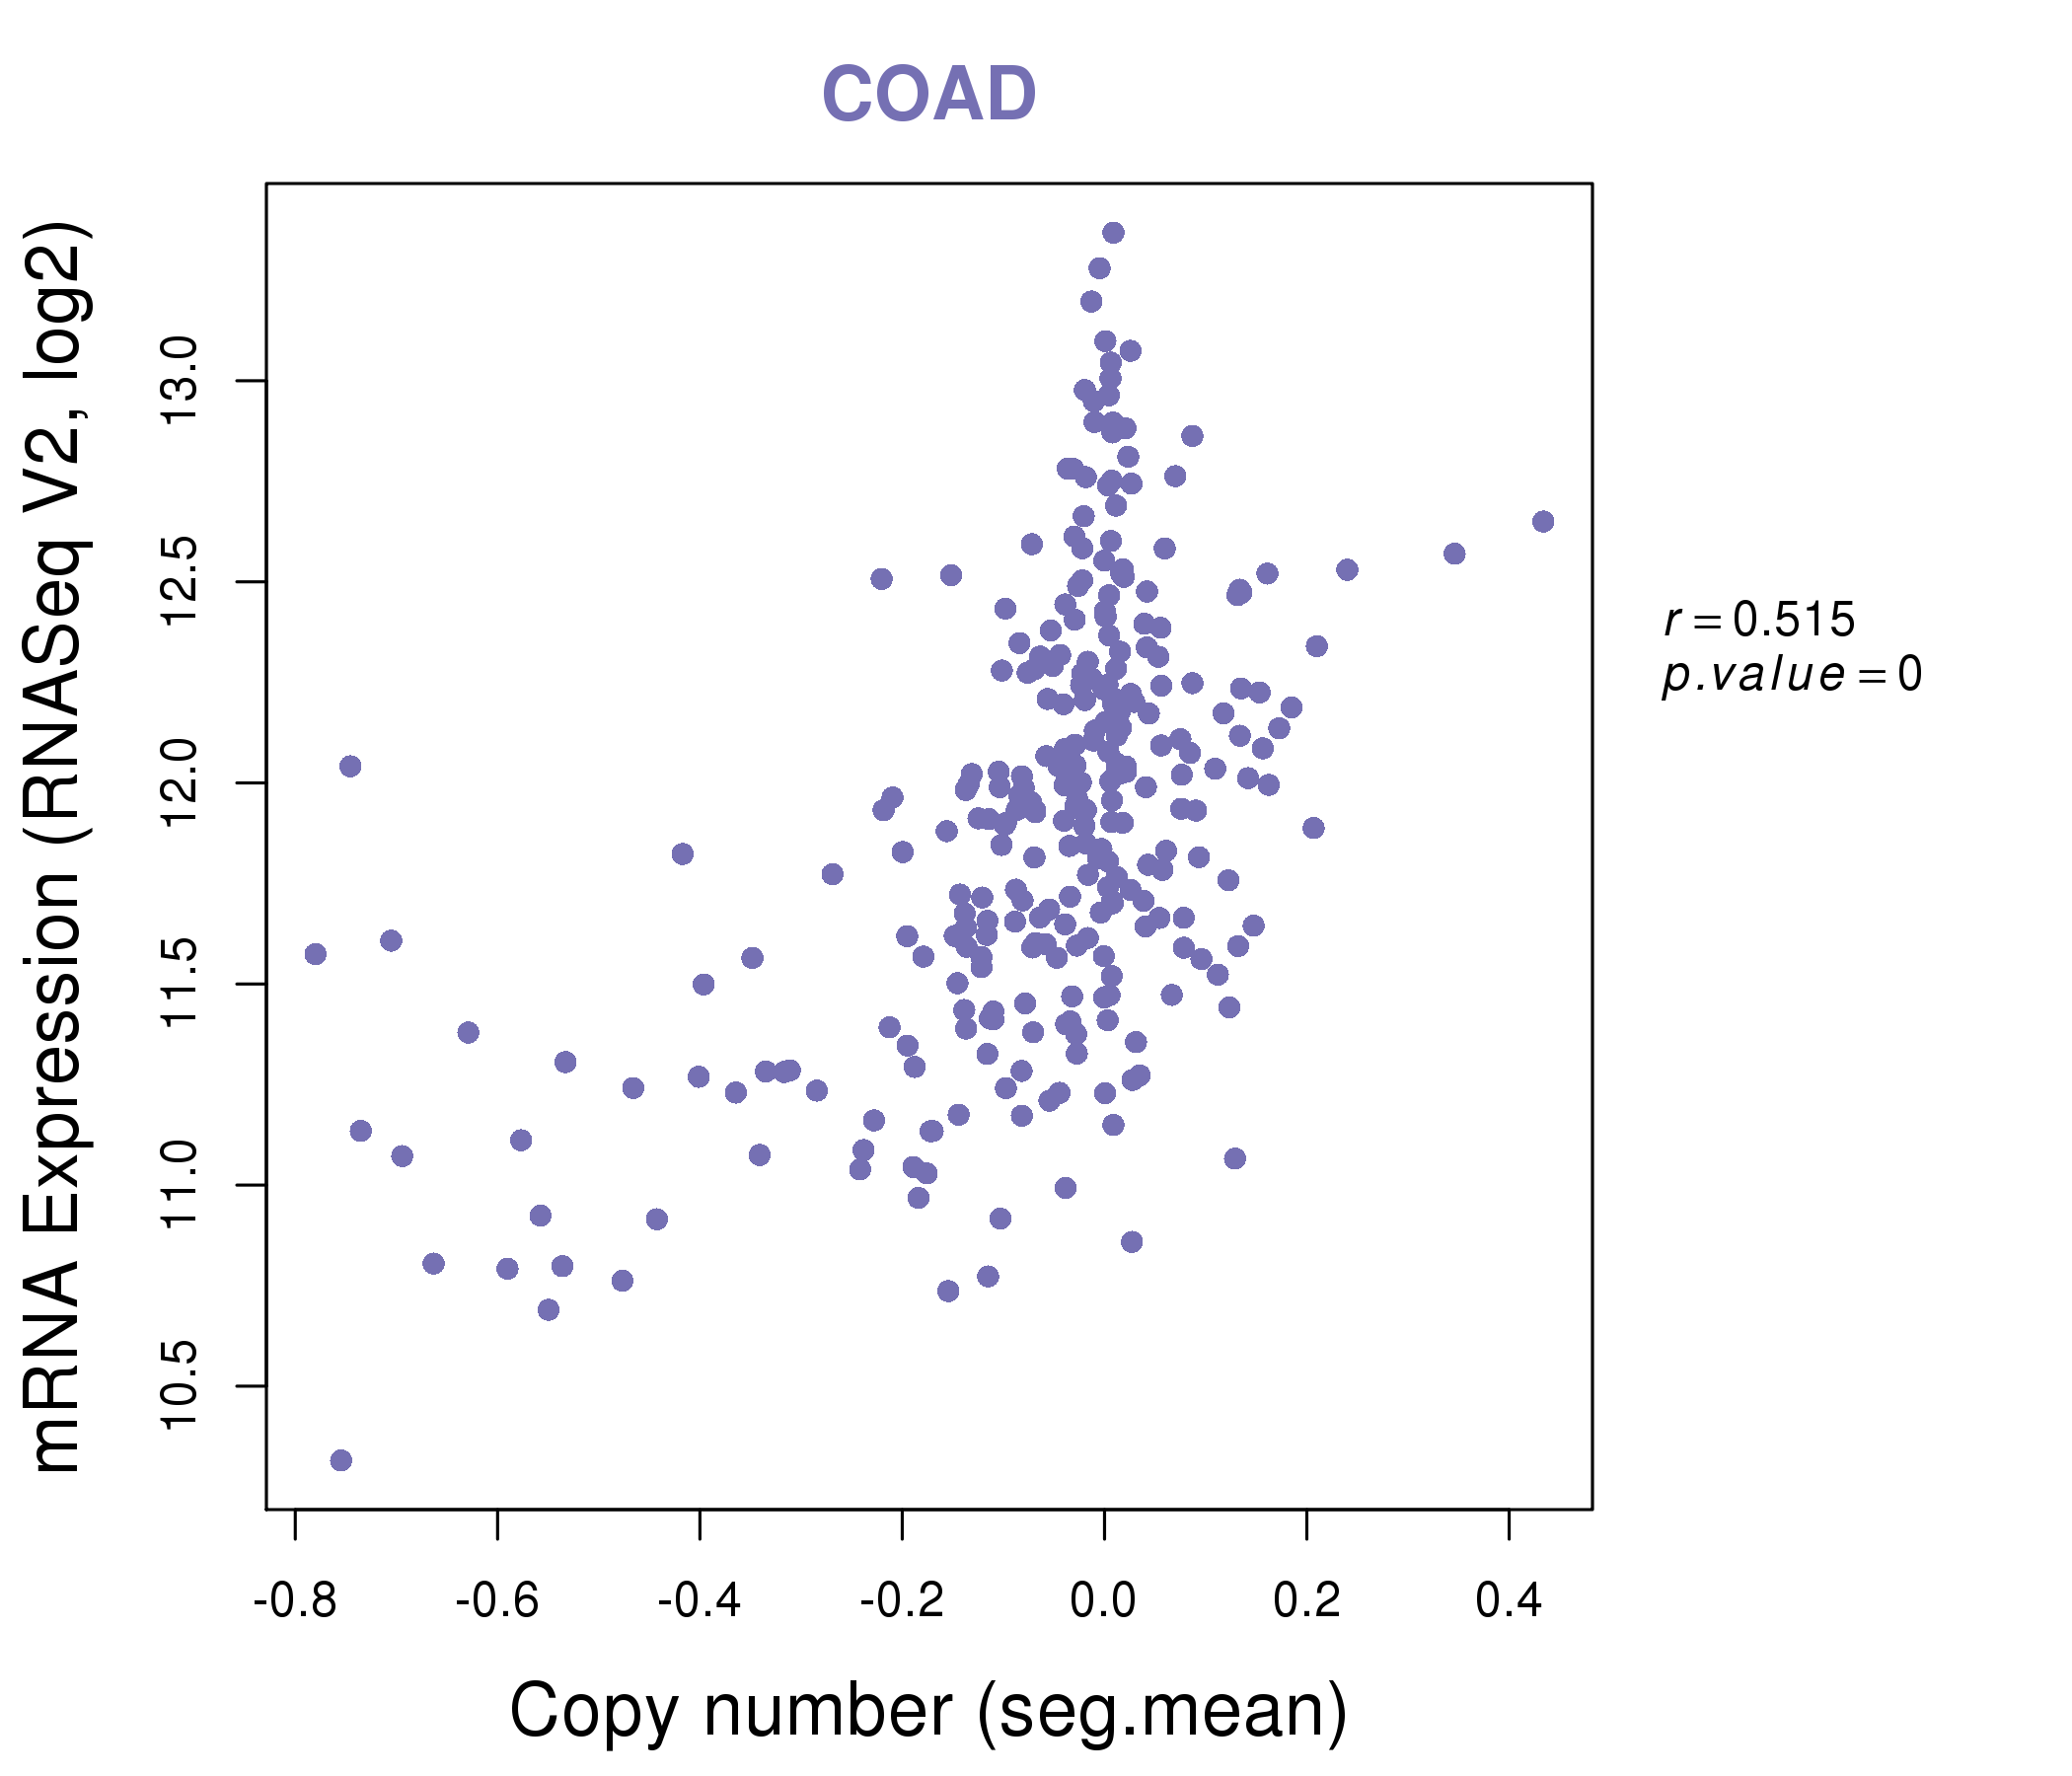 |
|
| Top |
| Gene-Gene Network Information |
| * Co-Expression network figures were drawn using R package igraph. Only the top 20 genes with the highest correlations were shown. Red circle: input gene, orange circle: cell metabolism gene, sky circle: other gene |
: Open all plots for all cancer types
 |
|
| ACTR1A,ARPC2,AVEN,BNIP3,ENO1,GAPDH,GLRX3, GOT1,GPI,GSTO1,LDHA,PGAM1,PGAM4,PGK1, PKM,PSMB2,RAN,SLC16A3,TPI1,TUBA1C,USMG5 | ANXA2,ANXA2P1,ANXA2P2,ATP1B3,ATP6V0E1,EMC7,SLC35F6, CD63,CRYL1,DOLK,DYNLL1,FUCA2,IFNGR2,MSRA, NUDT5,PGAM1,PRDX4,RHOA,SNX11,UBE2L3,VKORC1 |
 |
|
| ALDOA,ATP5A1,ATP5B,TIMM21,MCU,EIF4A1,EIF5A, EIF5AL1,ENO1,GAPDH,LDHA,P4HA1,PFKP,PGAM1, PKM,PLEK2,SFXN1,SLC16A3,TPI1,TUBA1B,TYMS | ATP6V1E1,SLIRP,DYNLT1,LSM3,MRPL20,NEDD8,PGAM1, POMP,PSMA1,PSMA2,PSMA3,PSMA6,PSMA7,PSMB1, PSMB5,PSMB6,PSMC2,PSMC3,PSMC4,PSMD13,RHOA |


| * Co-Expression network figures were drawn using R package igraph. Only the top 20 genes with the highest correlations were shown. Red circle: input gene, orange circle: cell metabolism gene, sky circle: other gene |
: Open all plots for all cancer types
| Top |
: Open all interacting genes' information including KEGG pathway for all interacting genes from DAVID
| Top |
| Pharmacological Information for PGAM1 |
| There's no related Drug. |
| Top |
| Cross referenced IDs for PGAM1 |
| * We obtained these cross-references from Uniprot database. It covers 150 different DBs, 18 categories. http://www.uniprot.org/help/cross_references_section |
: Open all cross reference information
|
Copyright © 2016-Present - The Univsersity of Texas Health Science Center at Houston @ |