|
||||||||||||||||||||
| |
| Phenotypic Information (metabolism pathway, cancer, disease, phenome) |
| |
| |
| Gene-Gene Network Information: Co-Expression Network, Interacting Genes & KEGG |
| |
|


| Gene Summary for PGK2 |
| Top |
| Phenotypic Information for PGK2(metabolism pathway, cancer, disease, phenome) |
| Cancer | CGAP: PGK2 |
| Familial Cancer Database: PGK2 | |
| * This gene is included in those cancer gene databases. |
|
|
|
|
|
|
| ||||||||||||||
Oncogene 1 | Significant driver gene in | |||||||||||||||||||
| cf) number; DB name 1 Oncogene; http://nar.oxfordjournals.org/content/35/suppl_1/D721.long, 2 Tumor Suppressor gene; https://bioinfo.uth.edu/TSGene/, 3 Cancer Gene Census; http://www.nature.com/nrc/journal/v4/n3/abs/nrc1299.html, 4 CancerGenes; http://nar.oxfordjournals.org/content/35/suppl_1/D721.long, 5 Network of Cancer Gene; http://ncg.kcl.ac.uk/index.php, 1Therapeutic Vulnerabilities in Cancer; http://cbio.mskcc.org/cancergenomics/statius/ |
| KEGG_GLYCOLYSIS_GLUCONEOGENESIS | |
| OMIM | |
| Orphanet | |
| Disease | KEGG Disease: PGK2 |
| MedGen: PGK2 (Human Medical Genetics with Condition) | |
| ClinVar: PGK2 | |
| Phenotype | MGI: PGK2 (International Mouse Phenotyping Consortium) |
| PhenomicDB: PGK2 | |
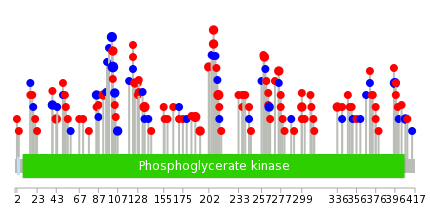
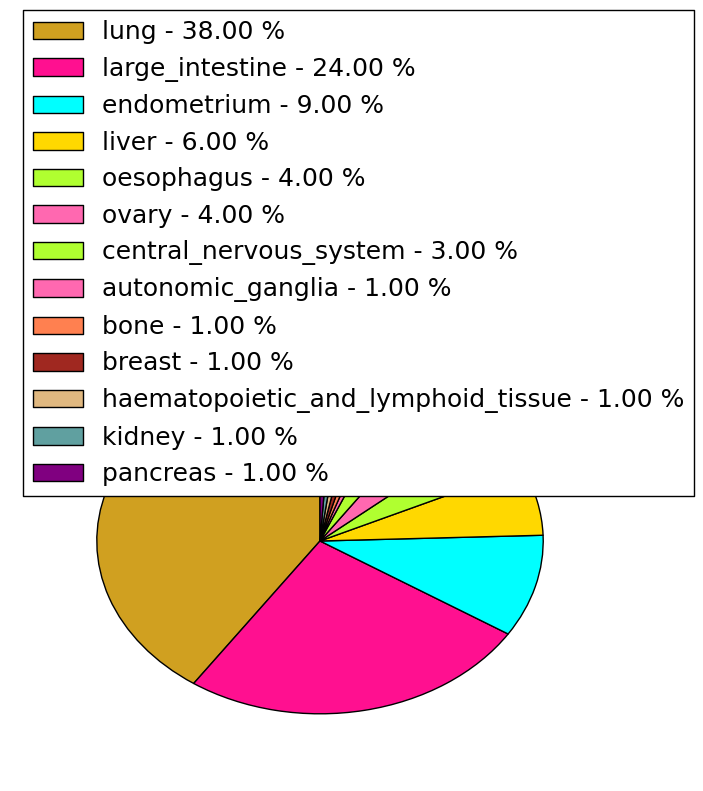
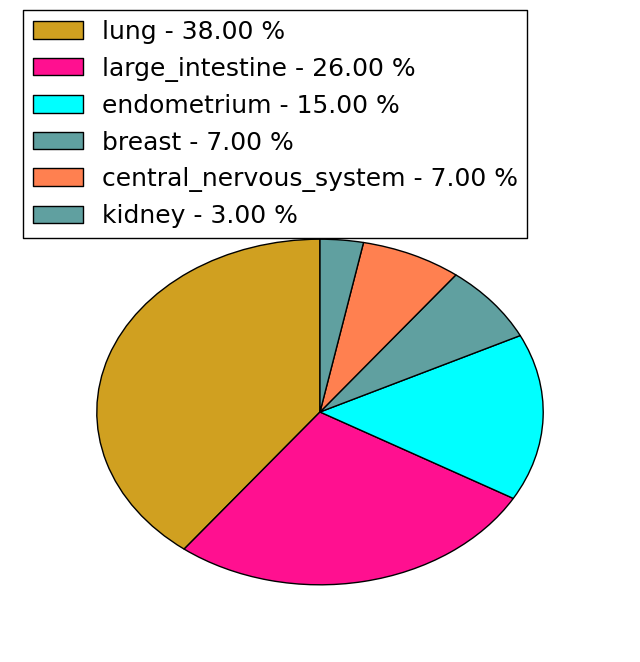
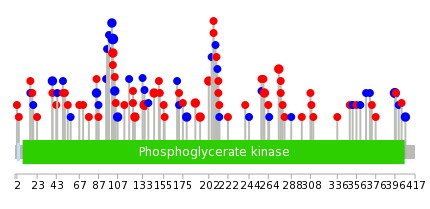
| Mutations for PGK2 |
| * Under tables are showing count per each tissue to give us broad intuition about tissue specific mutation patterns.You can go to the detailed page for each mutation database's web site. |
| There's no structural variation information in COSMIC data for this gene. |
| * From mRNA Sanger sequences, Chitars2.0 arranged chimeric transcripts. This table shows PGK2 related fusion information. |
| ID | Head Gene | Tail Gene | Accession | Gene_a | qStart_a | qEnd_a | Chromosome_a | tStart_a | tEnd_a | Gene_a | qStart_a | qEnd_a | Chromosome_a | tStart_a | tEnd_a |
| Top |
| There's no copy number variation information in COSMIC data for this gene. |
| Top |
|
 |
| Top |
| Stat. for Non-Synonymous SNVs (# total SNVs=65) | (# total SNVs=26) |
 |  |
(# total SNVs=1) | (# total SNVs=0) |
 |
| Top |
| * When you move the cursor on each content, you can see more deailed mutation information on the Tooltip. Those are primary_site,primary_histology,mutation(aa),pubmedID. |
| GRCh37 position | Mutation(aa) | Unique sampleID count |
| chr6:49754595-49754595 | p.A102A | 4 |
| chr6:49753713-49753713 | p.G396G | 3 |
| chr6:49754266-49754266 | p.L212R | 3 |
| chr6:49754598-49754598 | p.G101G | 3 |
| chr6:49754337-49754337 | p.F188L | 3 |
| chr6:49754076-49754076 | p.K275N | 3 |
| chr6:49754498-49754498 | p.P135S | 3 |
| chr6:49754005-49754005 | p.G299E | 3 |
| chr6:49754646-49754646 | p.L85L | 2 |
| chr6:49754123-49754123 | p.E260K | 2 |
| Top |
|
 |
| Point Mutation/ Tissue ID | 1 | 2 | 3 | 4 | 5 | 6 | 7 | 8 | 9 | 10 | 11 | 12 | 13 | 14 | 15 | 16 | 17 | 18 | 19 | 20 |
| # sample | 1 | 2 | 12 | 2 | 2 | 1 | 20 | 7 | 1 | 38 | 6 | 9 | ||||||||
| # mutation | 1 | 2 | 13 | 2 | 2 | 1 | 23 | 7 | 1 | 38 | 6 | 9 | ||||||||
| nonsynonymous SNV | 9 | 1 | 1 | 17 | 4 | 1 | 22 | 3 | 5 | |||||||||||
| synonymous SNV | 1 | 2 | 4 | 1 | 1 | 1 | 6 | 3 | 16 | 3 | 4 |
| cf) Tissue ID; Tissue type (1; BLCA[Bladder Urothelial Carcinoma], 2; BRCA[Breast invasive carcinoma], 3; CESC[Cervical squamous cell carcinoma and endocervical adenocarcinoma], 4; COAD[Colon adenocarcinoma], 5; GBM[Glioblastoma multiforme], 6; Glioma Low Grade, 7; HNSC[Head and Neck squamous cell carcinoma], 8; KICH[Kidney Chromophobe], 9; KIRC[Kidney renal clear cell carcinoma], 10; KIRP[Kidney renal papillary cell carcinoma], 11; LAML[Acute Myeloid Leukemia], 12; LUAD[Lung adenocarcinoma], 13; LUSC[Lung squamous cell carcinoma], 14; OV[Ovarian serous cystadenocarcinoma ], 15; PAAD[Pancreatic adenocarcinoma], 16; PRAD[Prostate adenocarcinoma], 17; SKCM[Skin Cutaneous Melanoma], 18:STAD[Stomach adenocarcinoma], 19:THCA[Thyroid carcinoma], 20:UCEC[Uterine Corpus Endometrial Carcinoma]) |
| Top |
| * We represented just top 10 SNVs. When you move the cursor on each content, you can see more deailed mutation information on the Tooltip. Those are primary_site, primary_histology, mutation(aa), pubmedID. |
| Genomic Position | Mutation(aa) | Unique sampleID count |
| chr6:49754595 | p.A102A | 4 |
| chr6:49754498 | p.G396G | 3 |
| chr6:49753713 | p.P135S | 3 |
| chr6:49754132 | p.E202K | 2 |
| chr6:49754297 | p.H125Y | 2 |
| chr6:49754580 | p.E260K | 2 |
| chr6:49754324 | p.E193K | 2 |
| chr6:49754466 | p.F188L | 2 |
| chr6:49754337 | p.L85L | 2 |
| chr6:49754071 | p.L257M | 2 |
| * Copy number data were extracted from TCGA using R package TCGA-Assembler. The URLs of all public data files on TCGA DCC data server were gathered on Jan-05-2015. Function ProcessCNAData in TCGA-Assembler package was used to obtain gene-level copy number value which is calculated as the average copy number of the genomic region of a gene. |
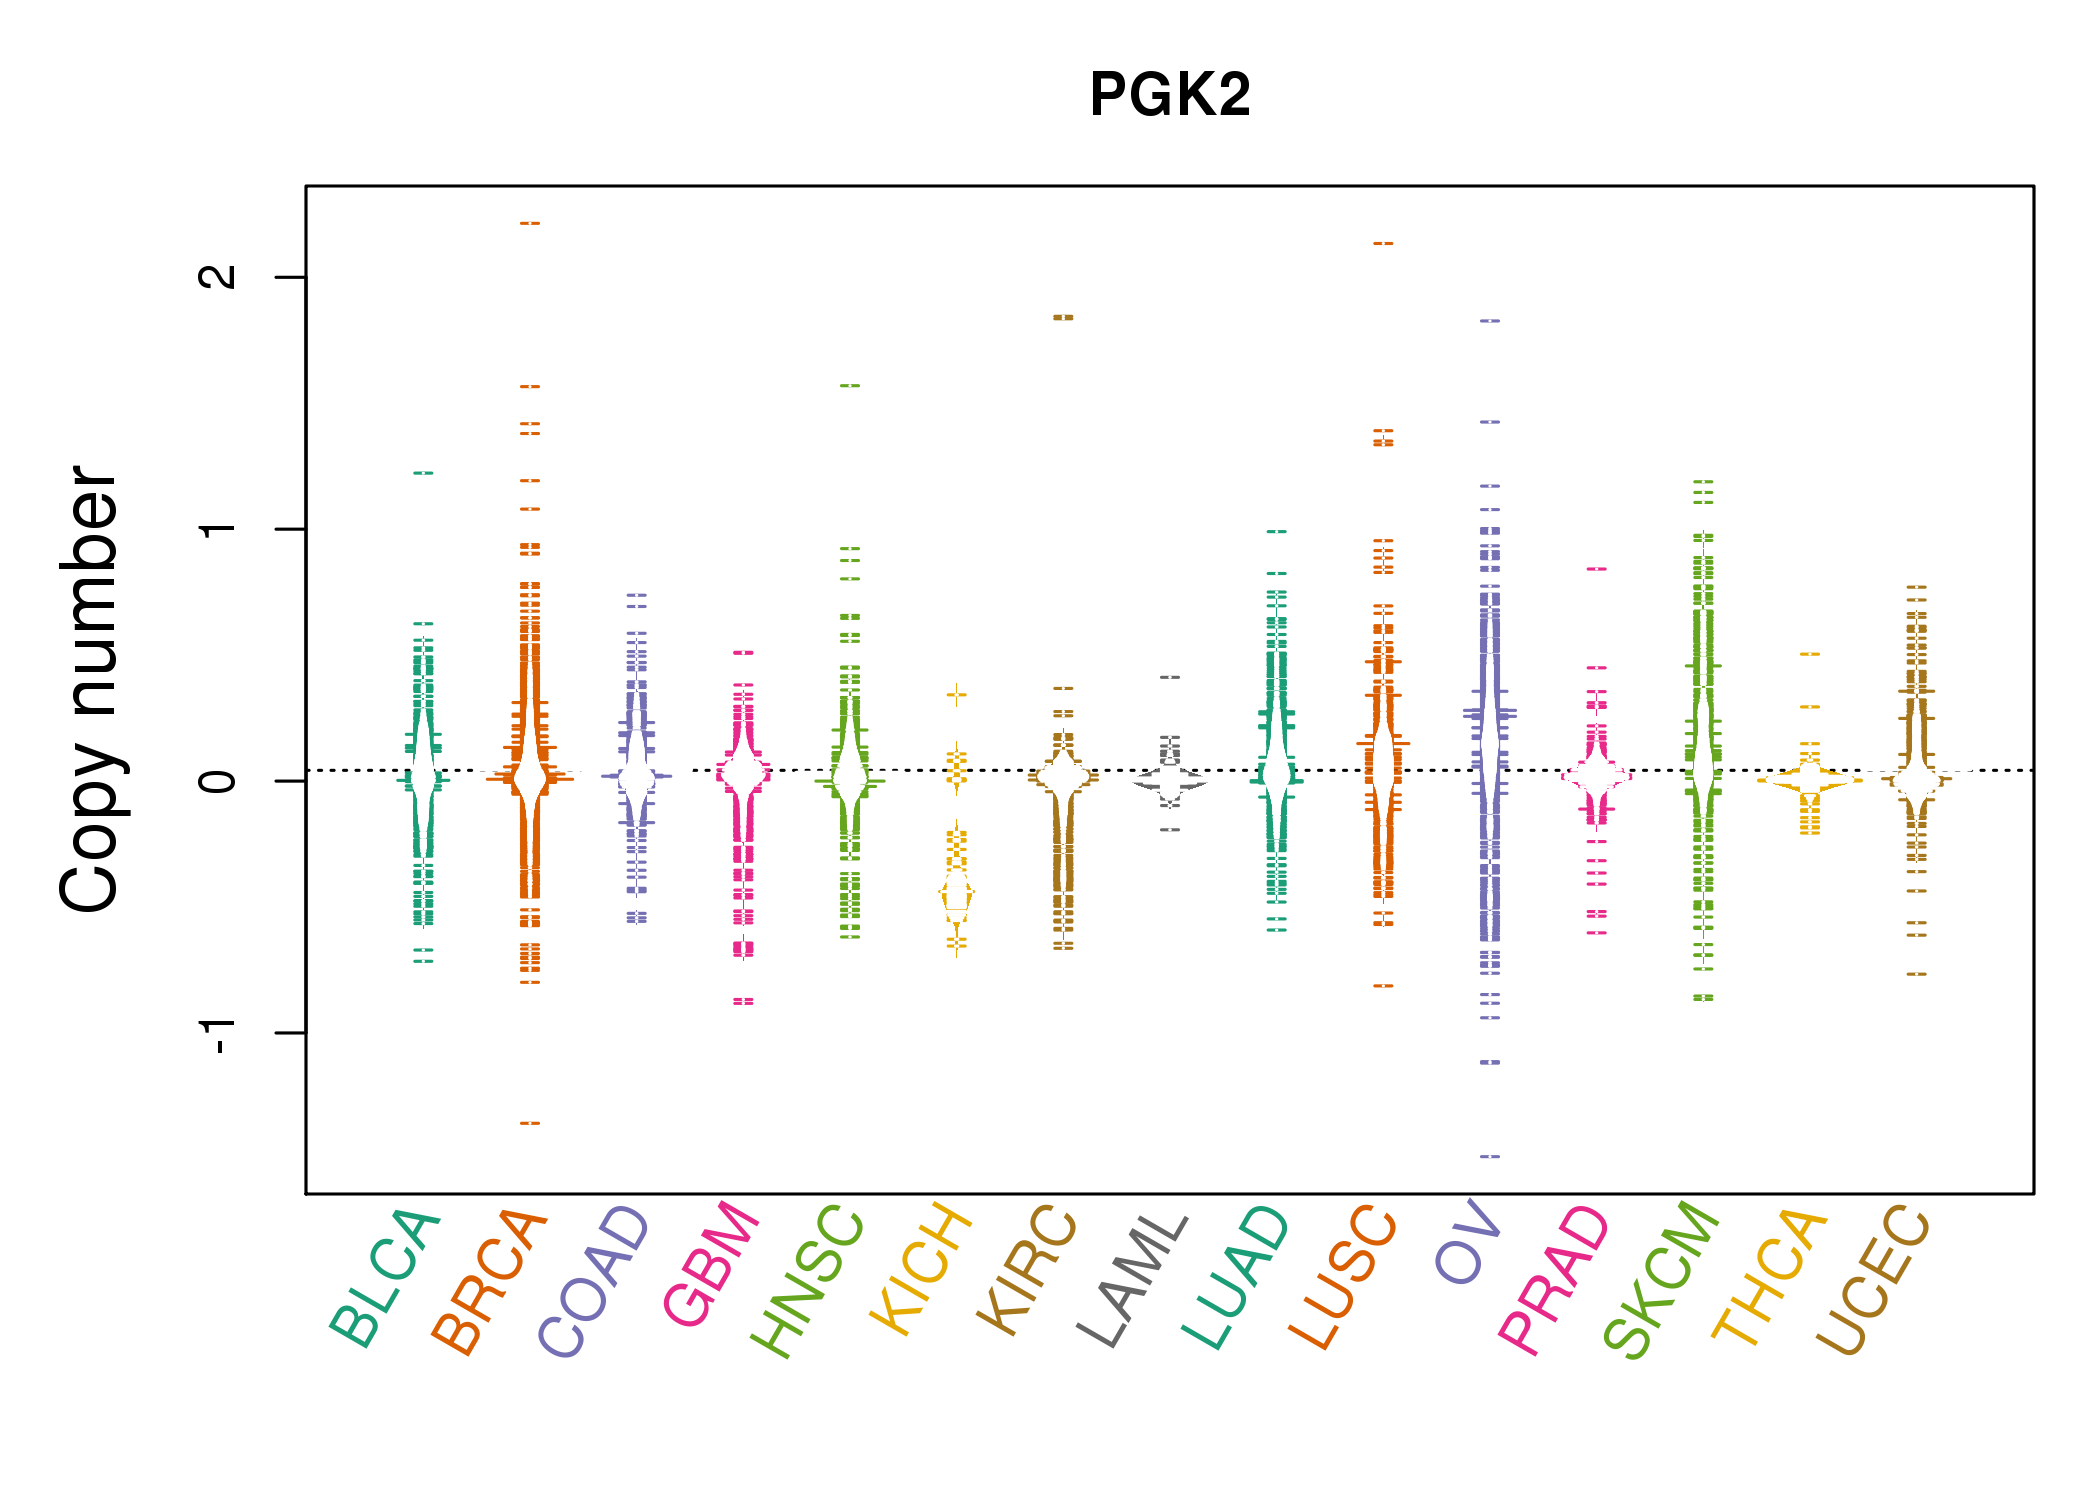 |
| cf) Tissue ID[Tissue type]: BLCA[Bladder Urothelial Carcinoma], BRCA[Breast invasive carcinoma], CESC[Cervical squamous cell carcinoma and endocervical adenocarcinoma], COAD[Colon adenocarcinoma], GBM[Glioblastoma multiforme], Glioma Low Grade, HNSC[Head and Neck squamous cell carcinoma], KICH[Kidney Chromophobe], KIRC[Kidney renal clear cell carcinoma], KIRP[Kidney renal papillary cell carcinoma], LAML[Acute Myeloid Leukemia], LUAD[Lung adenocarcinoma], LUSC[Lung squamous cell carcinoma], OV[Ovarian serous cystadenocarcinoma ], PAAD[Pancreatic adenocarcinoma], PRAD[Prostate adenocarcinoma], SKCM[Skin Cutaneous Melanoma], STAD[Stomach adenocarcinoma], THCA[Thyroid carcinoma], UCEC[Uterine Corpus Endometrial Carcinoma] |
| Top |
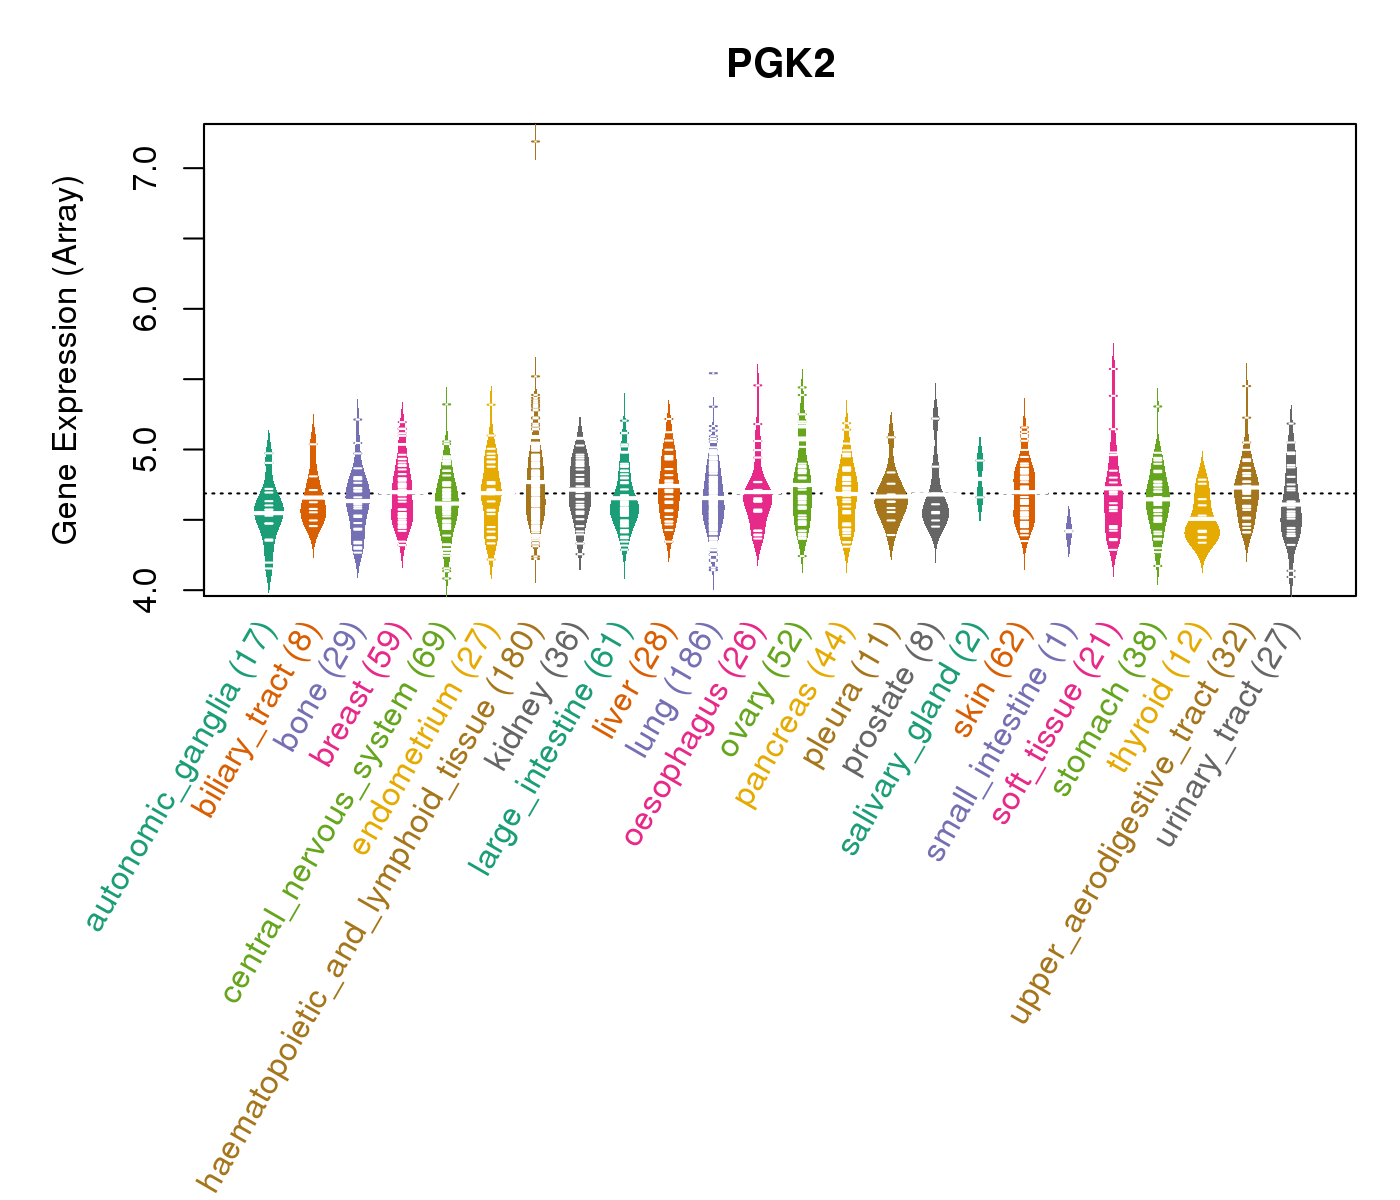
| Gene Expression for PGK2 |
| * CCLE gene expression data were extracted from CCLE_Expression_Entrez_2012-10-18.res: Gene-centric RMA-normalized mRNA expression data. |
 |
| * Normalized gene expression data of RNASeqV2 was extracted from TCGA using R package TCGA-Assembler. The URLs of all public data files on TCGA DCC data server were gathered at Jan-05-2015. Only eight cancer types have enough normal control samples for differential expression analysis. (t test, adjusted p<0.05 (using Benjamini-Hochberg FDR)) |
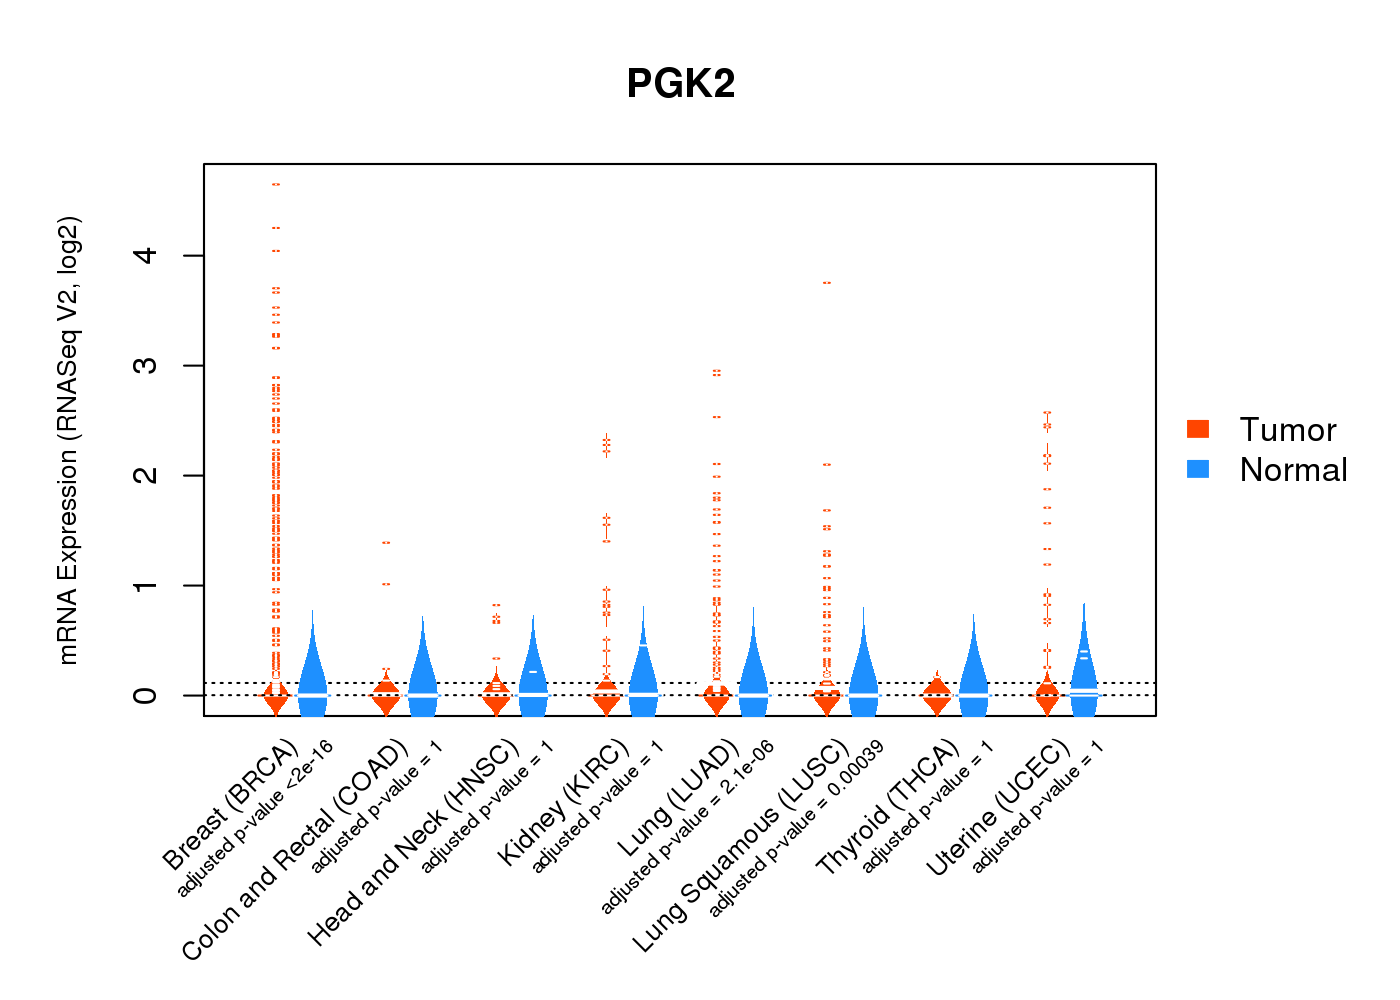 |
| Top |
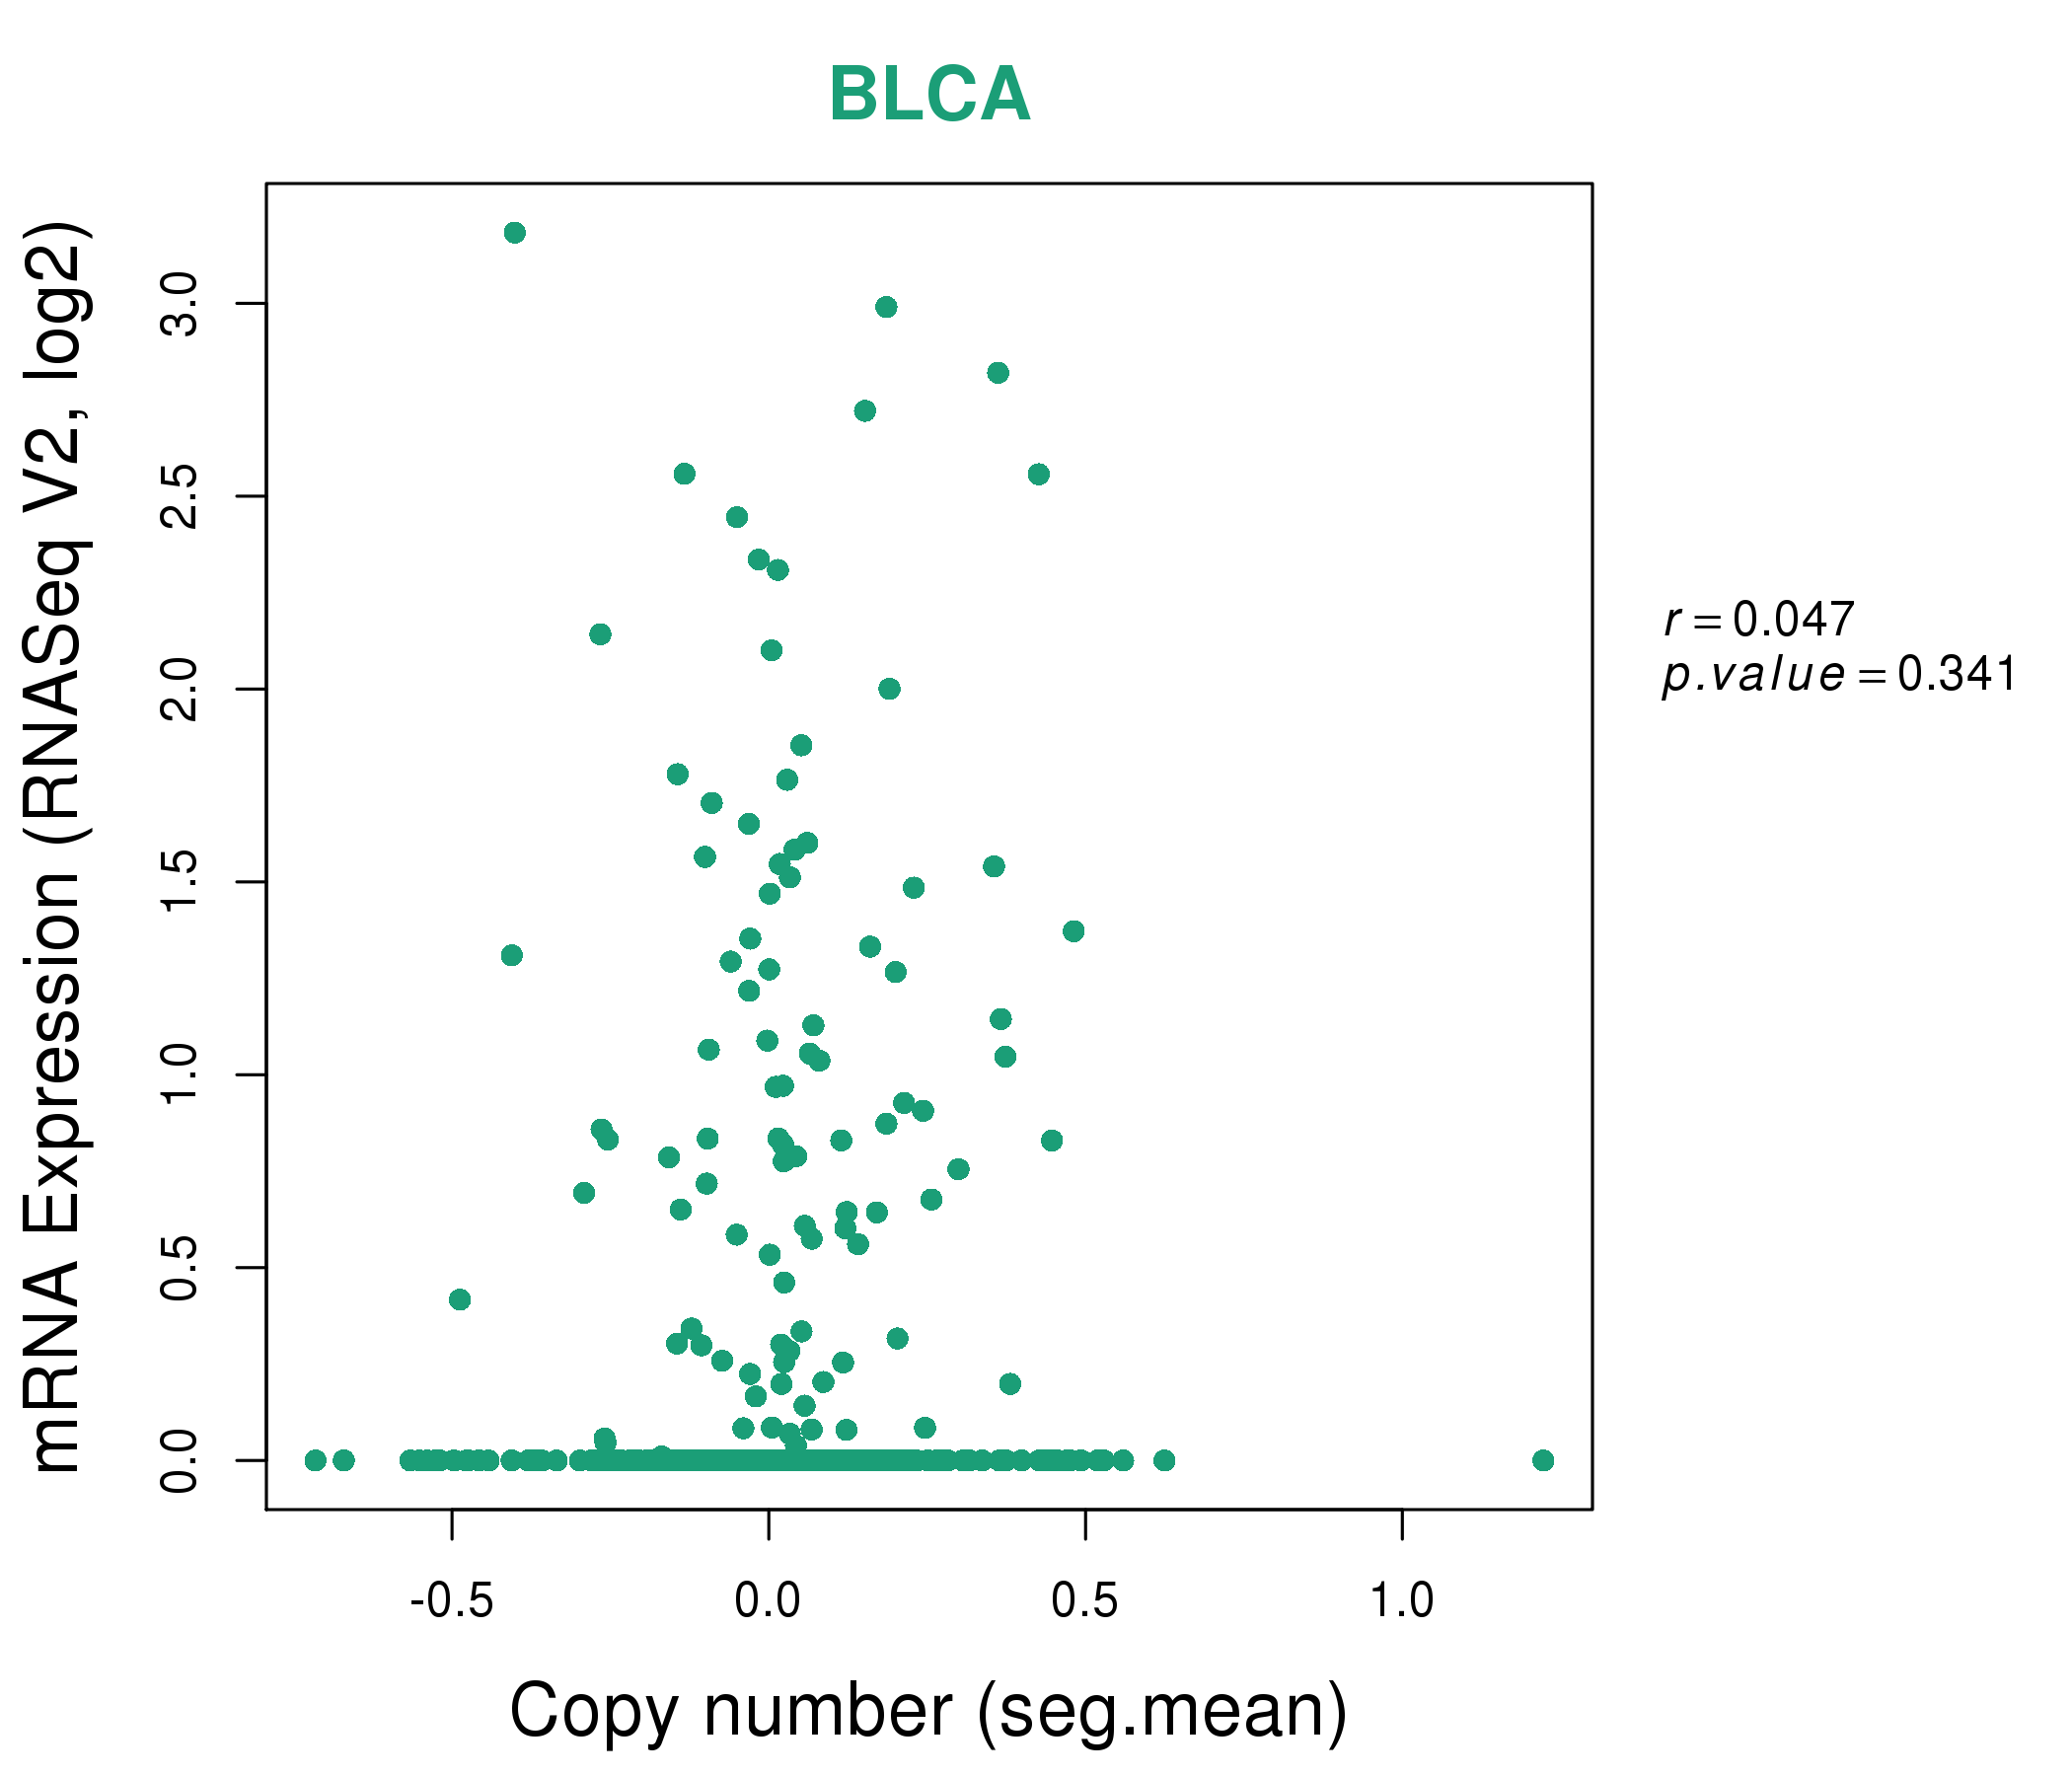
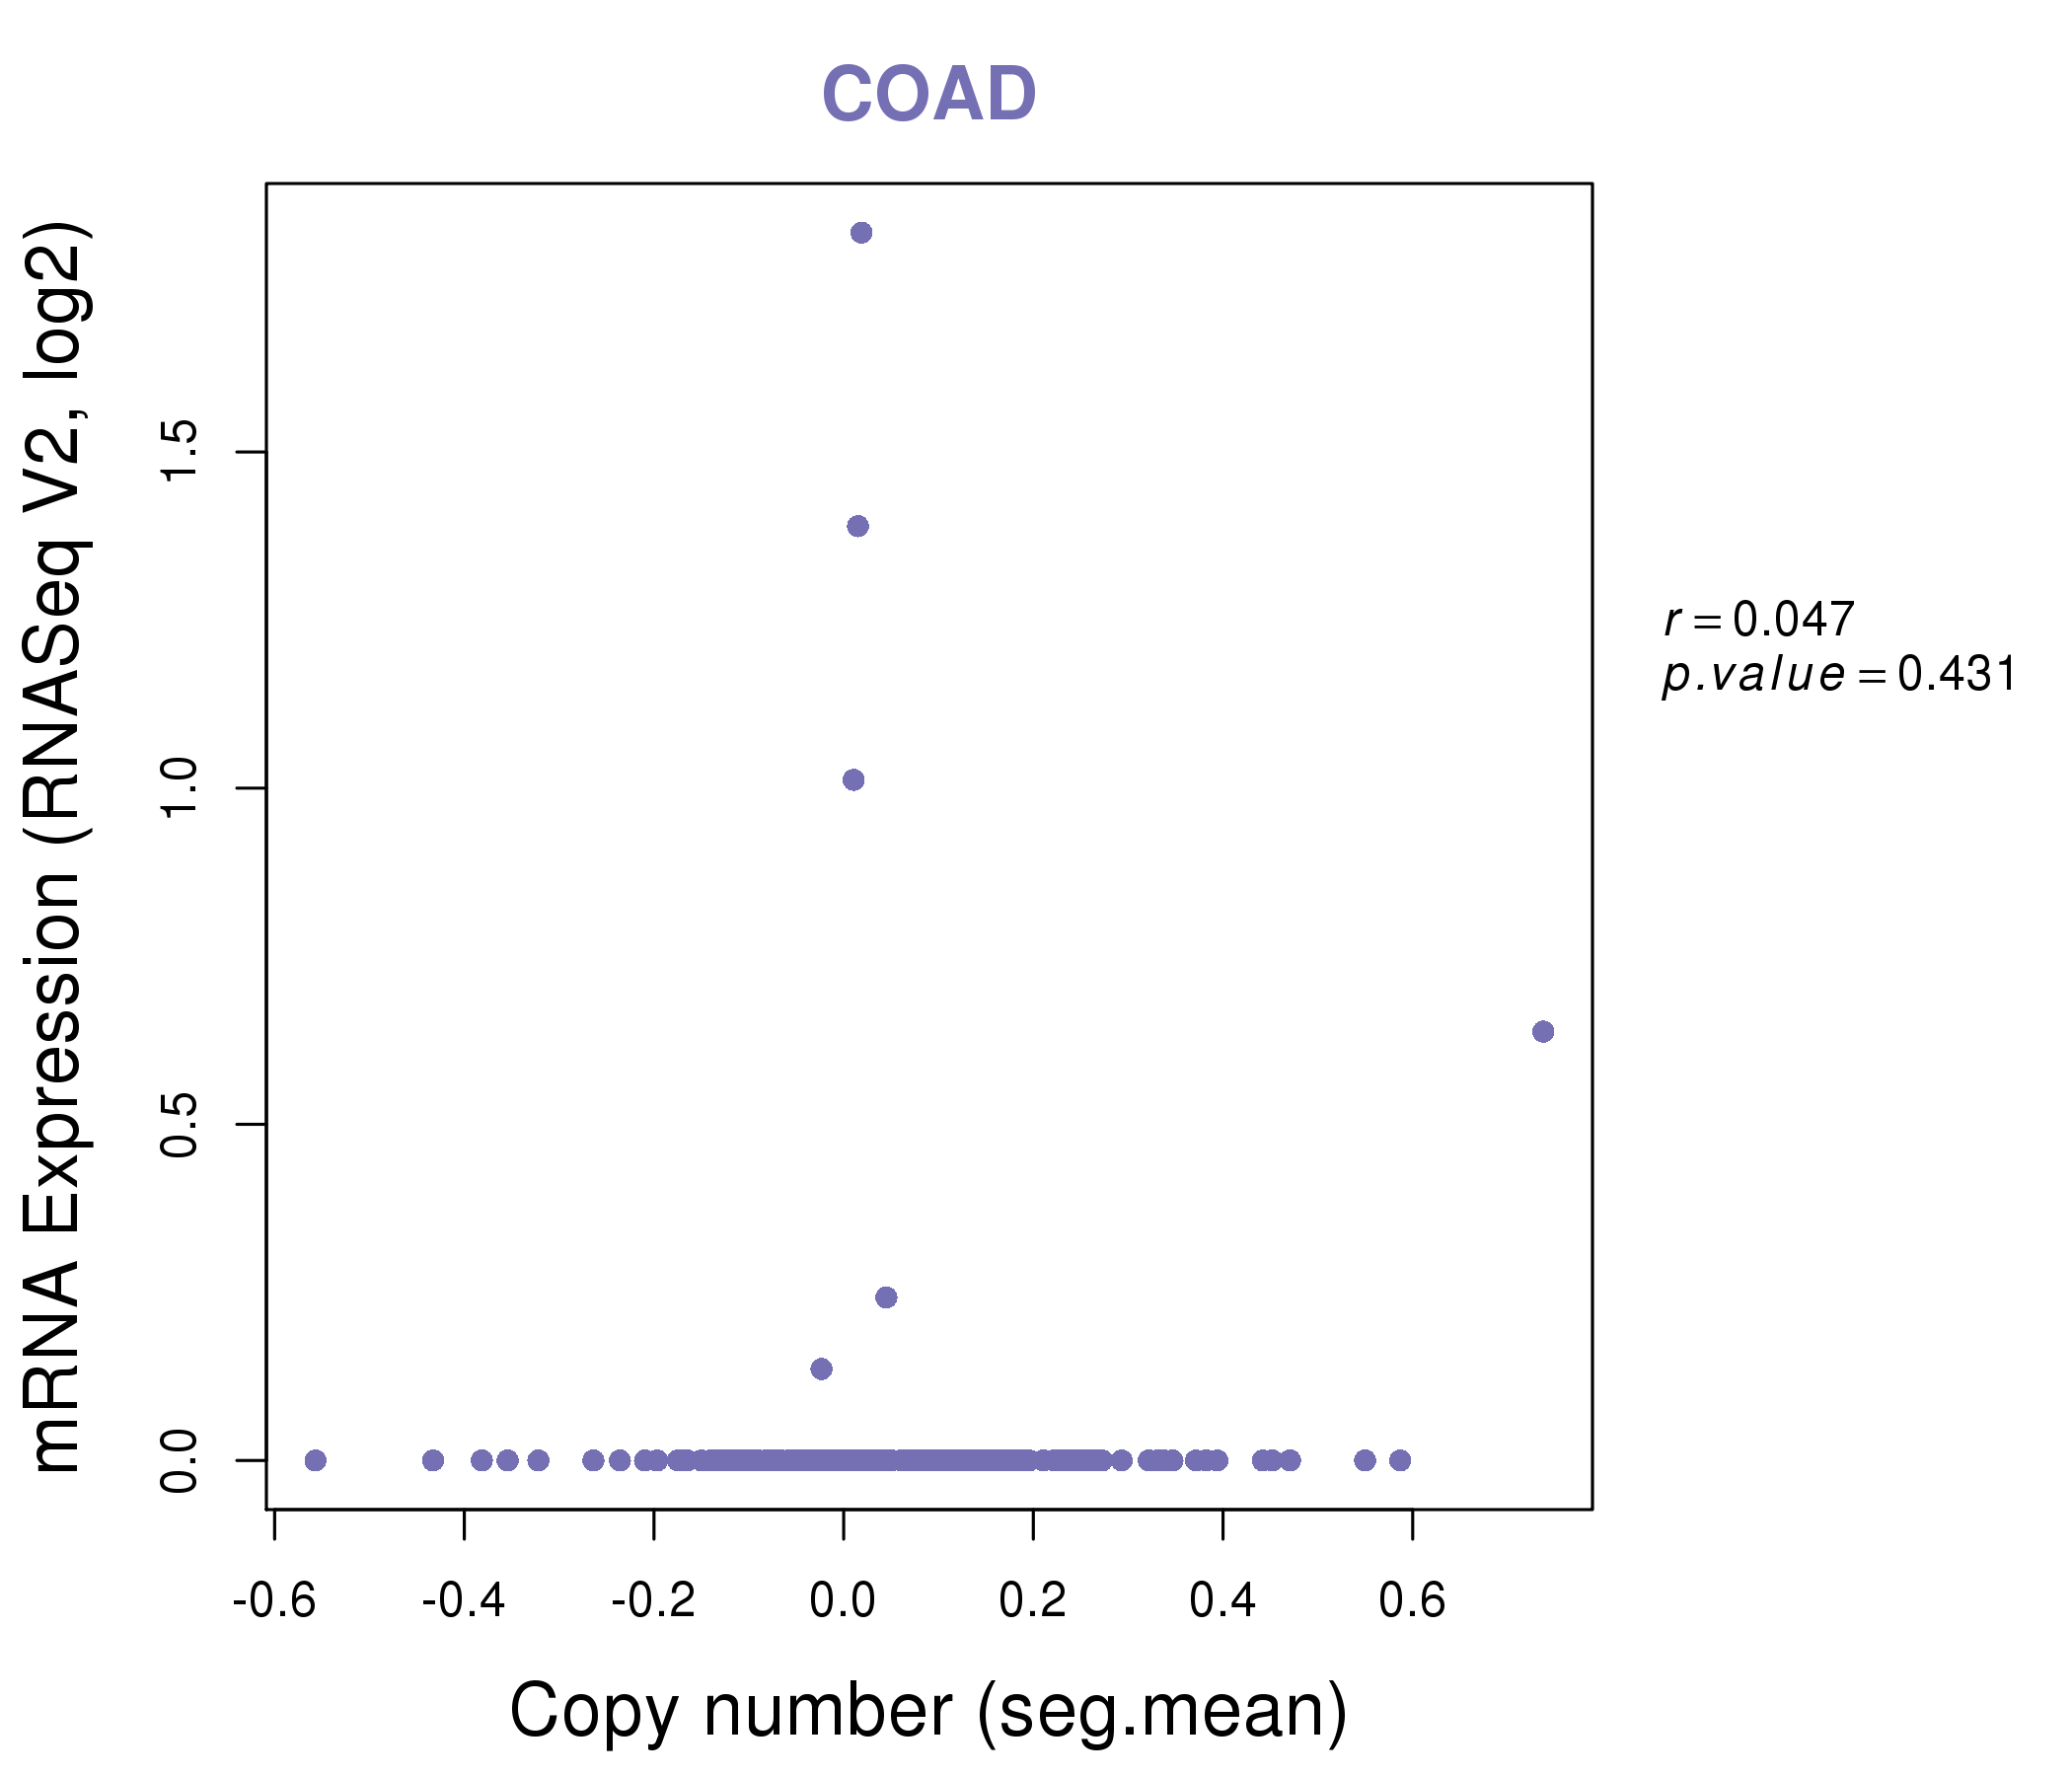
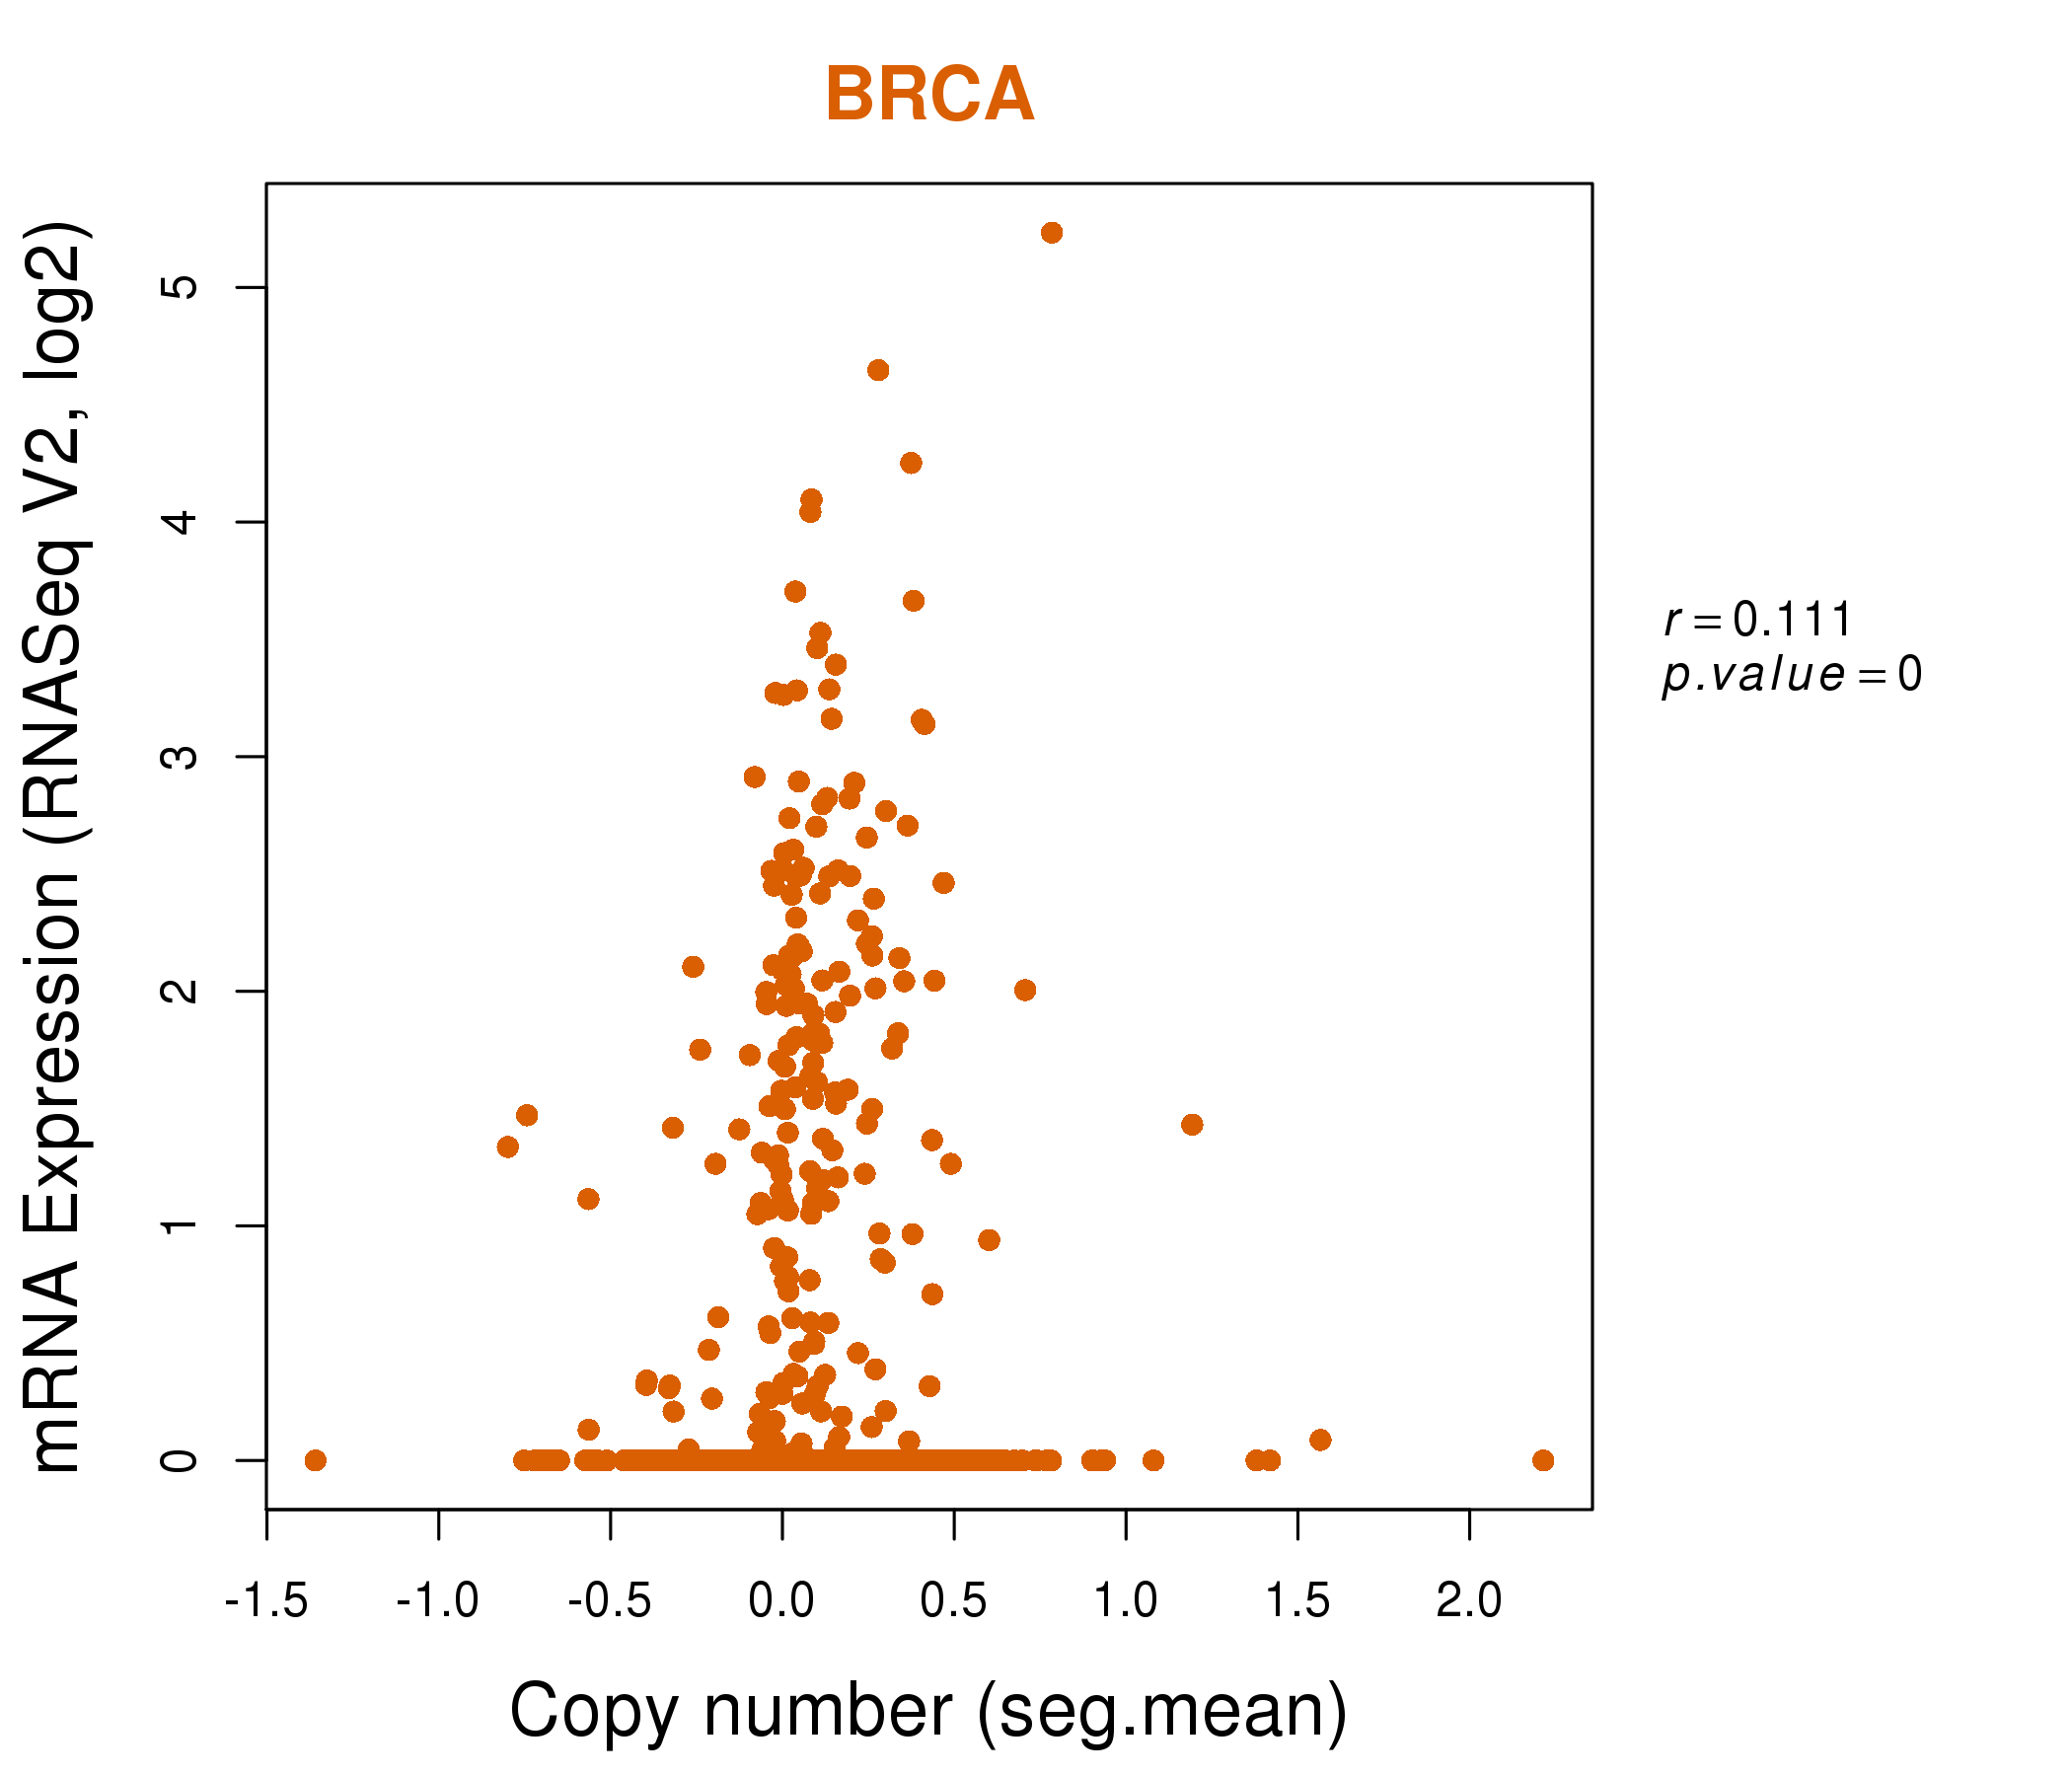
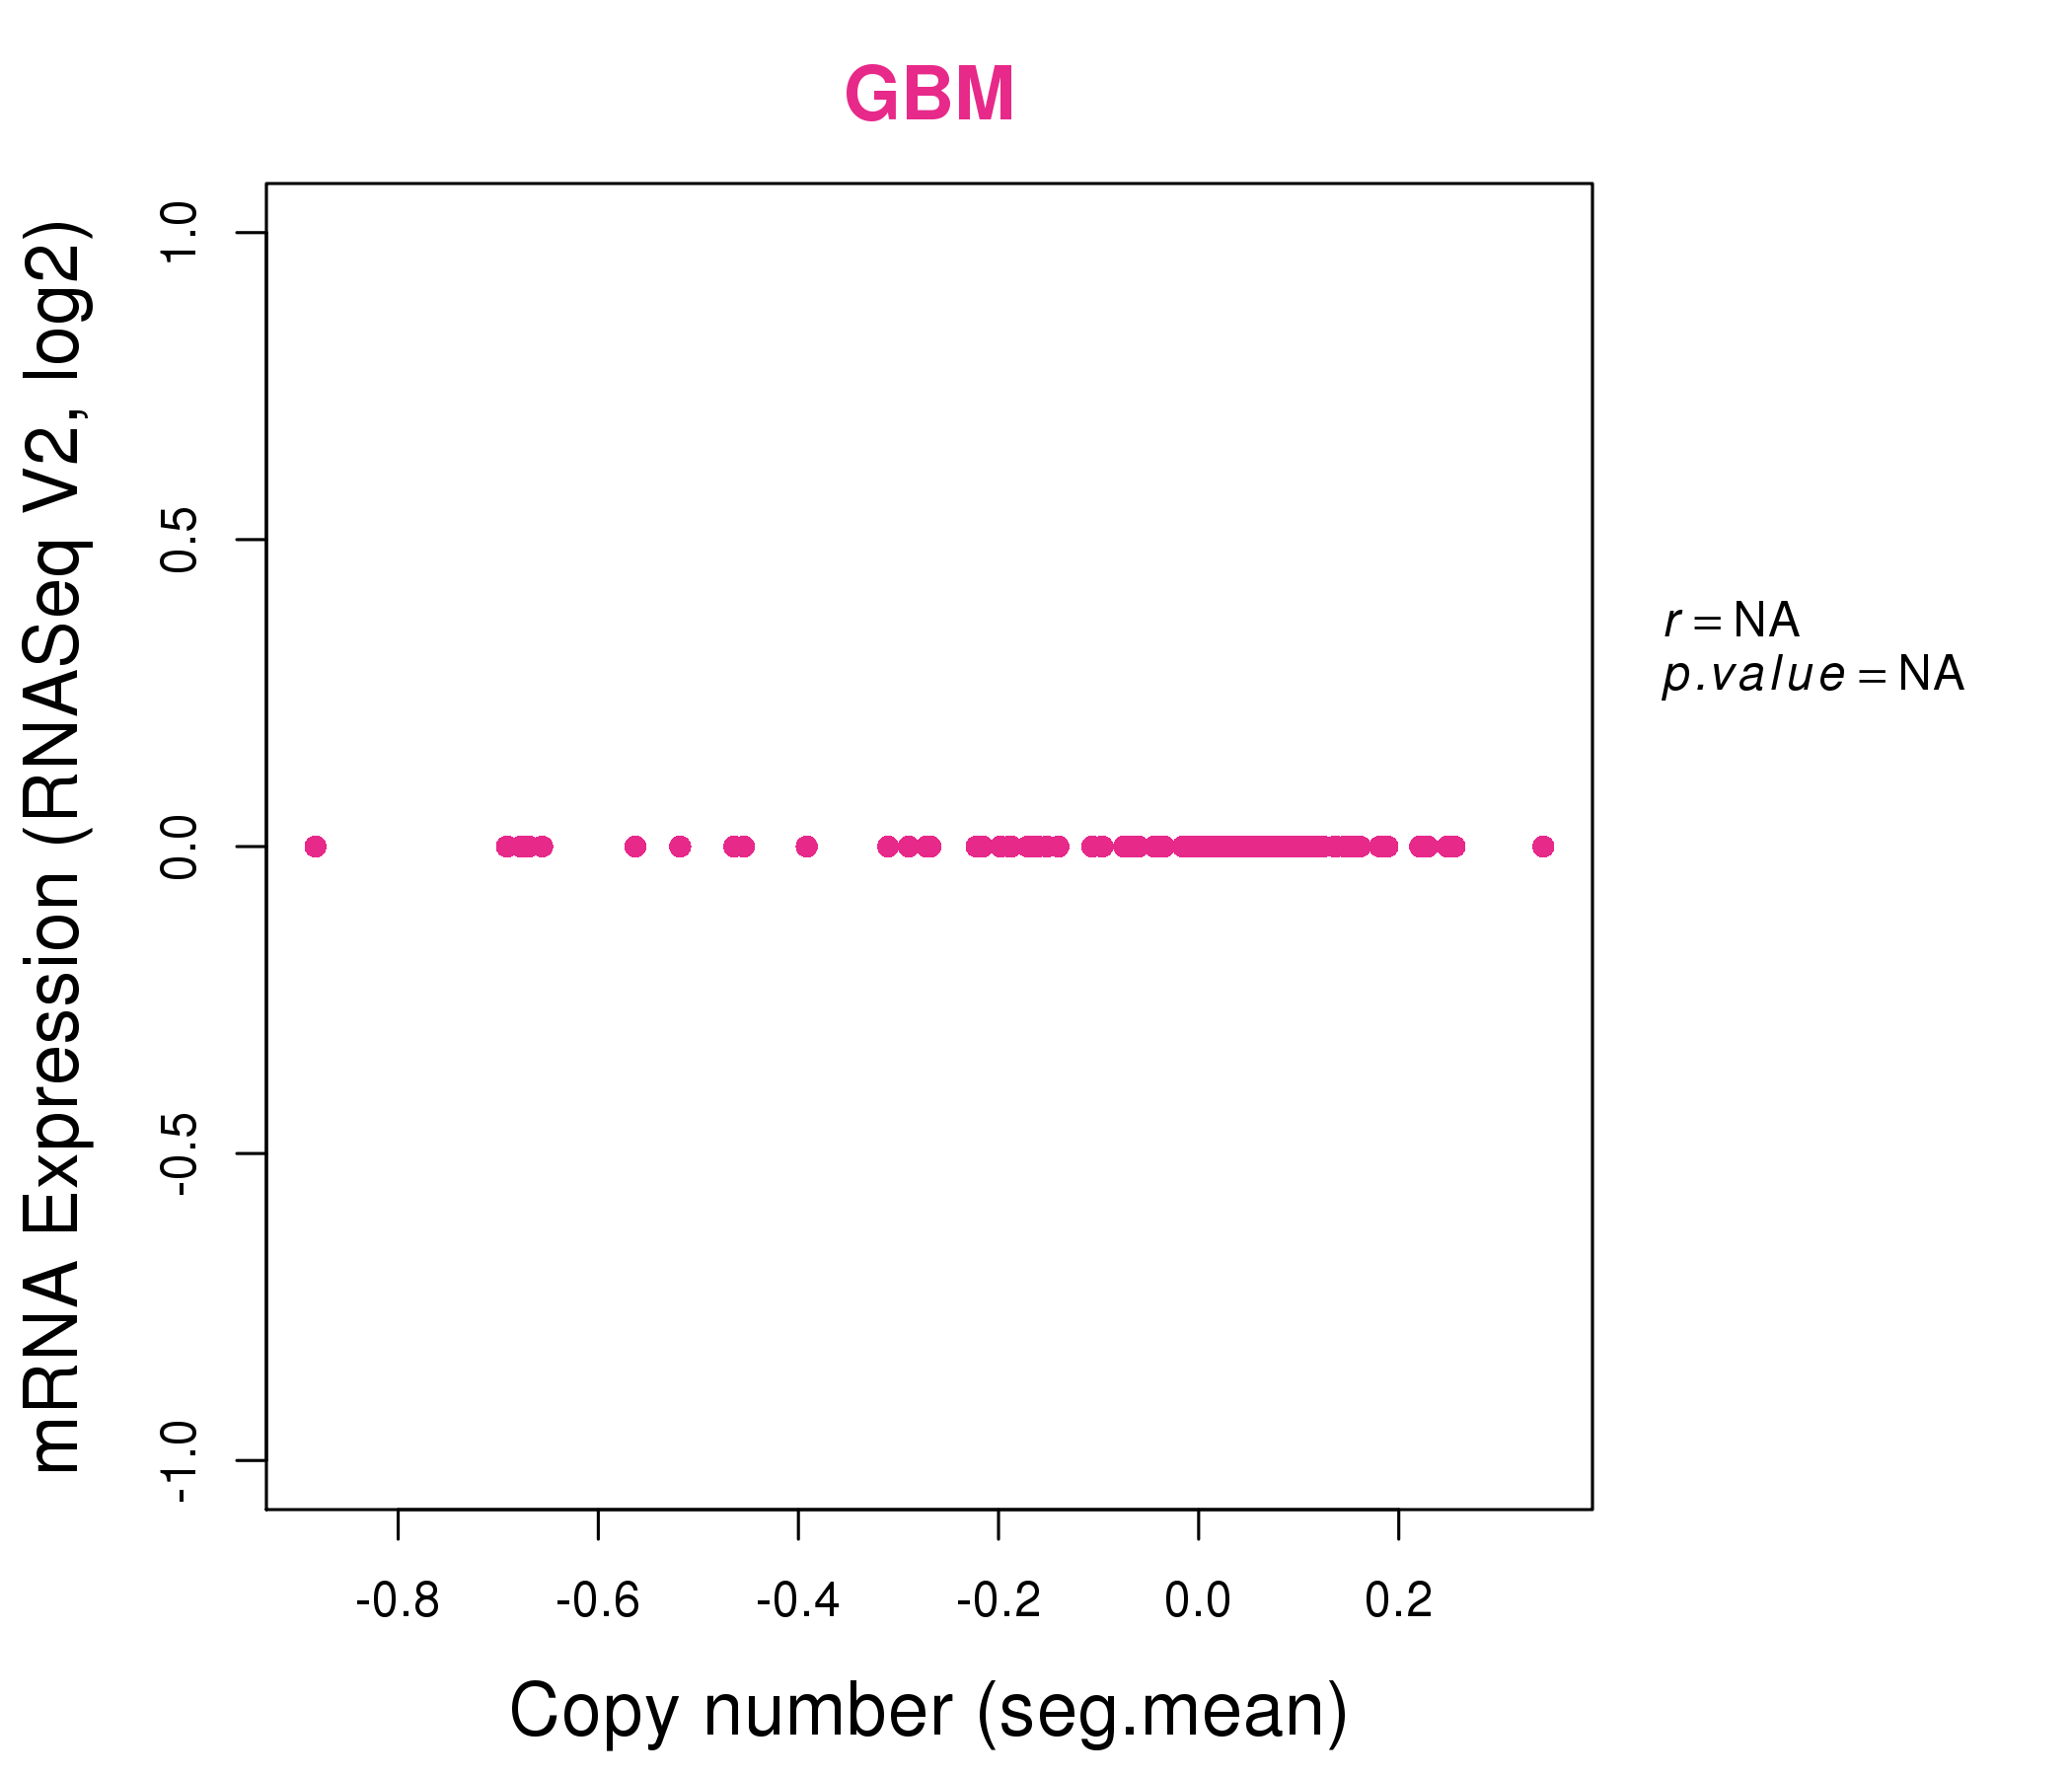
| * This plots show the correlation between CNV and gene expression. |
: Open all plots for all cancer types
 |
|
 |
|
| Top |
| Gene-Gene Network Information |
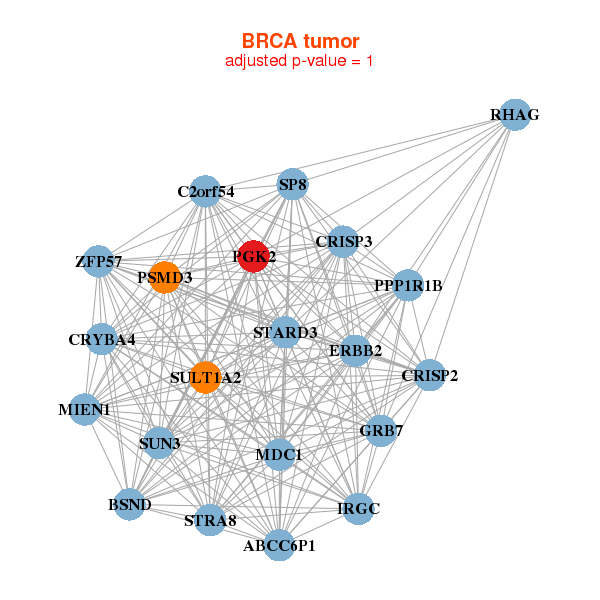
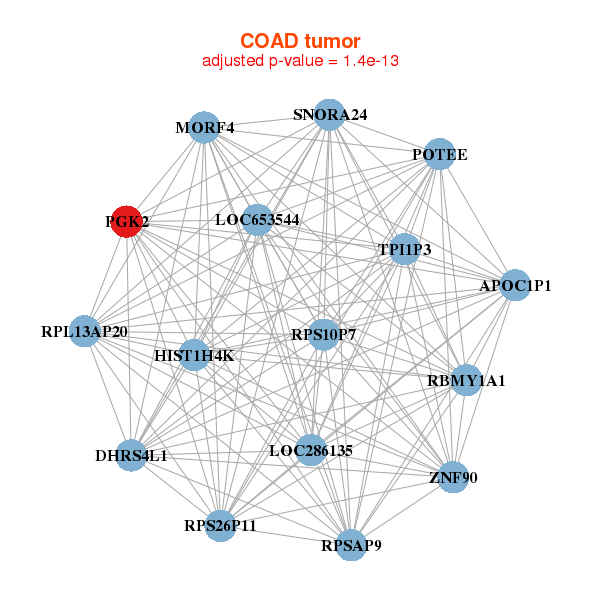
| * Co-Expression network figures were drawn using R package igraph. Only the top 20 genes with the highest correlations were shown. Red circle: input gene, orange circle: cell metabolism gene, sky circle: other gene |
: Open all plots for all cancer types
 |
|
| ABCC6P1,BSND,MIEN1,C2orf54,CRISP2,CRISP3,CRYBA4, ERBB2,GRB7,IRGC,MDC1,PGK2,PPP1R1B,PSMD3, RHAG,SP8,STARD3,STRA8,SULT1A2,SUN3,ZFP57 | CD163L1,CFHR1,CXorf21,DNTT,FAM105A,FPR3,KIR2DS4, KRTAP12-2,LUZP4,MARCH1,MPEG1,OPN1LW,OR56A5,OR5AK2, OR7E5P,PGK2,PRG4,RGS18,PMEL,TCHH,TREML3P |
 |
|
| APOC1P1,DHRS4L1,HIST1H4K,LOC286135,LOC653544,MORF4,PGK2, POTEE,RBMY1A1,RPL13AP20,RPS10P7,RPS26P11,RPSAP9,SNORA24, TPI1P3,Z | ABCC12,ANO4,CALML5,CCDC63,DPCR1,FGF22,GUCY2EP, LOC100133920,MUCL1,NKX6-1,OR4A16,OR6B2,OR7E24,OR8D2, PGK2,PIP,IER3___SRGN,RBMY1A1,SNORA13,SNORA58,WFDC8 |
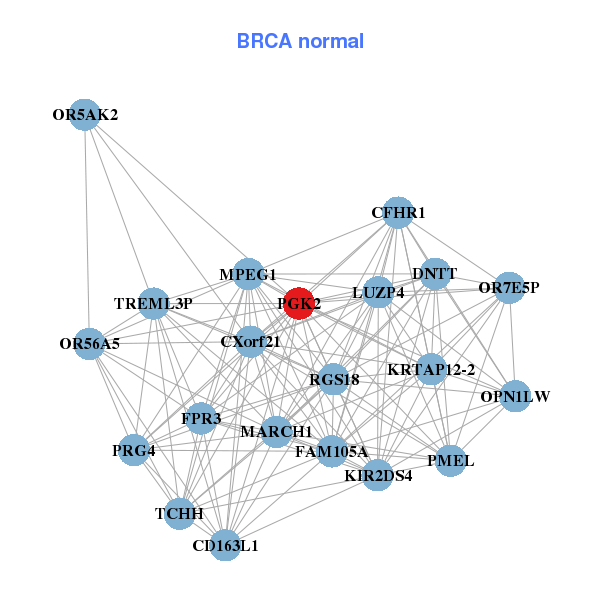
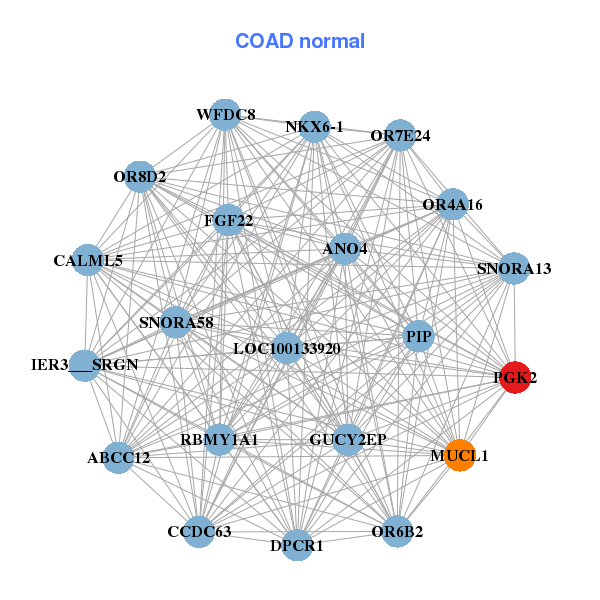
| * Co-Expression network figures were drawn using R package igraph. Only the top 20 genes with the highest correlations were shown. Red circle: input gene, orange circle: cell metabolism gene, sky circle: other gene |
: Open all plots for all cancer types
| Top |
: Open all interacting genes' information including KEGG pathway for all interacting genes from DAVID
| Top |
| Pharmacological Information for PGK2 |
| There's no related Drug. |
| Top |
| Cross referenced IDs for PGK2 |
| * We obtained these cross-references from Uniprot database. It covers 150 different DBs, 18 categories. http://www.uniprot.org/help/cross_references_section |
: Open all cross reference information
|
Copyright © 2016-Present - The Univsersity of Texas Health Science Center at Houston @ |