|
|||||||||||||||||||||||||||||||||||||||||||||||||||||||||||||||||||||||||||||||||||||||||||||||||||||||||||||||||||||||||||||||||||||||||||||||||||||||||||||||||||||||||||||||||||||||||||||||||||||||||||||||||||||||||||||||||||||||||||||||||||||||||||||||||||||||||||||||||||||||||||||||||||||||||||||||||||||||||||||||||||||||||||||
| |
| Phenotypic Information (metabolism pathway, cancer, disease, phenome) |
| |
| |
| Gene-Gene Network Information: Co-Expression Network, Interacting Genes & KEGG |
| |
|


| Gene Summary for PGM1 |
| Basic gene info. | Gene symbol | PGM1 |
| Gene name | phosphoglucomutase 1 | |
| Synonyms | CDG1T|GSD14 | |
| Cytomap | UCSC genome browser: 1p31 | |
| Genomic location | chr1 :64088886-64125916 | |
| Type of gene | protein-coding | |
| RefGenes | NM_001172818.1, NM_001172819.1,NM_002633.2, | |
| Ensembl id | ENSG00000079739 | |
| Description | PGM 1glucose phosphomutase 1phosphoglucomutase-1 | |
| Modification date | 20141219 | |
| dbXrefs | MIM : 171900 | |
| HGNC : HGNC | ||
| Ensembl : ENSG00000079739 | ||
| HPRD : 01389 | ||
| Vega : OTTHUMG00000008968 | ||
| Protein | UniProt: go to UniProt's Cross Reference DB Table | |
| Expression | CleanEX: HS_PGM1 | |
| BioGPS: 5236 | ||
| Gene Expression Atlas: ENSG00000079739 | ||
| The Human Protein Atlas: ENSG00000079739 | ||
| Pathway | NCI Pathway Interaction Database: PGM1 | |
| KEGG: PGM1 | ||
| REACTOME: PGM1 | ||
| ConsensusPathDB | ||
| Pathway Commons: PGM1 | ||
| Metabolism | MetaCyc: PGM1 | |
| HUMANCyc: PGM1 | ||
| Regulation | Ensembl's Regulation: ENSG00000079739 | |
| miRBase: chr1 :64,088,886-64,125,916 | ||
| TargetScan: NM_001172818 | ||
| cisRED: ENSG00000079739 | ||
| Context | iHOP: PGM1 | |
| cancer metabolism search in PubMed: PGM1 | ||
| UCL Cancer Institute: PGM1 | ||
| Assigned class in ccmGDB | C | |
| Top |
| Phenotypic Information for PGM1(metabolism pathway, cancer, disease, phenome) |
| Cancer | CGAP: PGM1 |
| Familial Cancer Database: PGM1 | |
| * This gene is included in those cancer gene databases. |
|
|
|
|
|
|
| |||||||||||||||||||||||||||||||||||||||||||||||||||||||||||||||||||||||||||||||||||||||||||||||||||||||||||||||||||||||||||||||||||||||||||||||||||||||||||||||||||||||||||||||||||||||||||||||||||||||||||||||||||||||||||||||||||||||||||||||||||||||||||||||||||||||||||||||||||||||||||||||||||||||||||||||||||||||||||||||||||||||
Oncogene 1 | Significant driver gene in | ||||||||||||||||||||||||||||||||||||||||||||||||||||||||||||||||||||||||||||||||||||||||||||||||||||||||||||||||||||||||||||||||||||||||||||||||||||||||||||||||||||||||||||||||||||||||||||||||||||||||||||||||||||||||||||||||||||||||||||||||||||||||||||||||||||||||||||||||||||||||||||||||||||||||||||||||||||||||||||||||||||||||||||
| cf) number; DB name 1 Oncogene; http://nar.oxfordjournals.org/content/35/suppl_1/D721.long, 2 Tumor Suppressor gene; https://bioinfo.uth.edu/TSGene/, 3 Cancer Gene Census; http://www.nature.com/nrc/journal/v4/n3/abs/nrc1299.html, 4 CancerGenes; http://nar.oxfordjournals.org/content/35/suppl_1/D721.long, 5 Network of Cancer Gene; http://ncg.kcl.ac.uk/index.php, 1Therapeutic Vulnerabilities in Cancer; http://cbio.mskcc.org/cancergenomics/statius/ |
| KEGG_GLYCOLYSIS_GLUCONEOGENESIS KEGG_GALACTOSE_METABOLISM KEGG_STARCH_AND_SUCROSE_METABOLISM KEGG_AMINO_SUGAR_AND_NUCLEOTIDE_SUGAR_METABOLISM REACTOME_METABOLISM_OF_CARBOHYDRATES REACTOME_GLUCOSE_METABOLISM | |
| OMIM | |
| Orphanet | |
| Disease | KEGG Disease: PGM1 |
| MedGen: PGM1 (Human Medical Genetics with Condition) | |
| ClinVar: PGM1 | |
| Phenotype | MGI: PGM1 (International Mouse Phenotyping Consortium) |
| PhenomicDB: PGM1 | |
| Mutations for PGM1 |
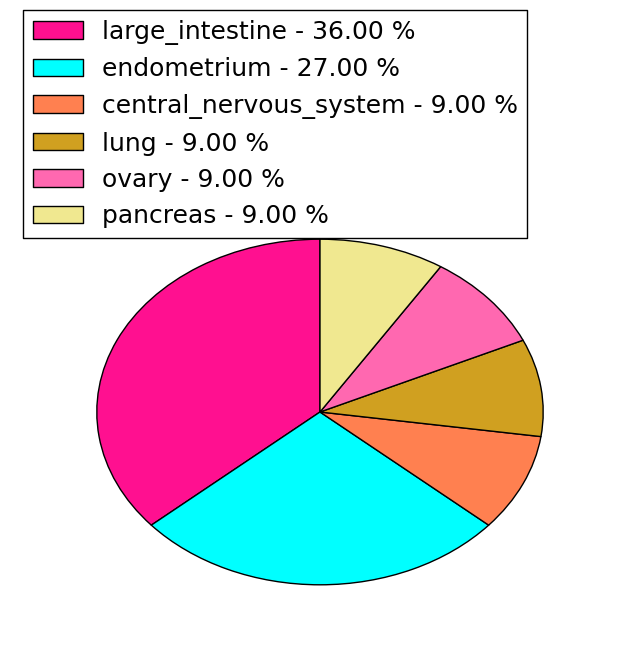
| * Under tables are showing count per each tissue to give us broad intuition about tissue specific mutation patterns.You can go to the detailed page for each mutation database's web site. |
| - Statistics for Tissue and Mutation type | Top |
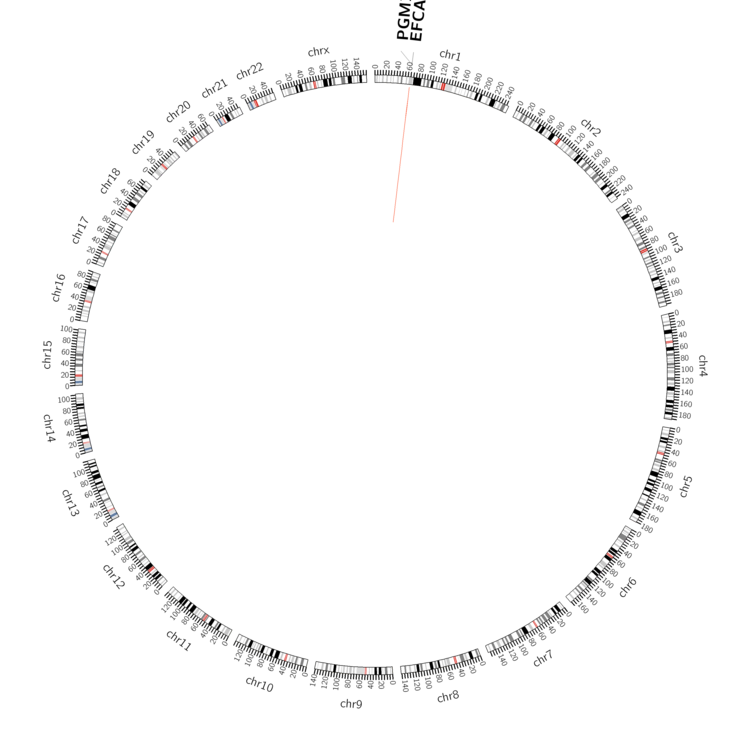 |
| - For Inter-chromosomal Variations |
| There's no inter-chromosomal structural variation. |
| - For Intra-chromosomal Variations |
| * Intra-chromosomal variantions includes 'intrachromosomal amplicon to amplicon', 'intrachromosomal amplicon to non-amplified dna', 'intrachromosomal deletion', 'intrachromosomal fold-back inversion', 'intrachromosomal inversion', 'intrachromosomal tandem duplication', 'Intrachromosomal unknown type', 'intrachromosomal with inverted orientation', 'intrachromosomal with non-inverted orientation'. |
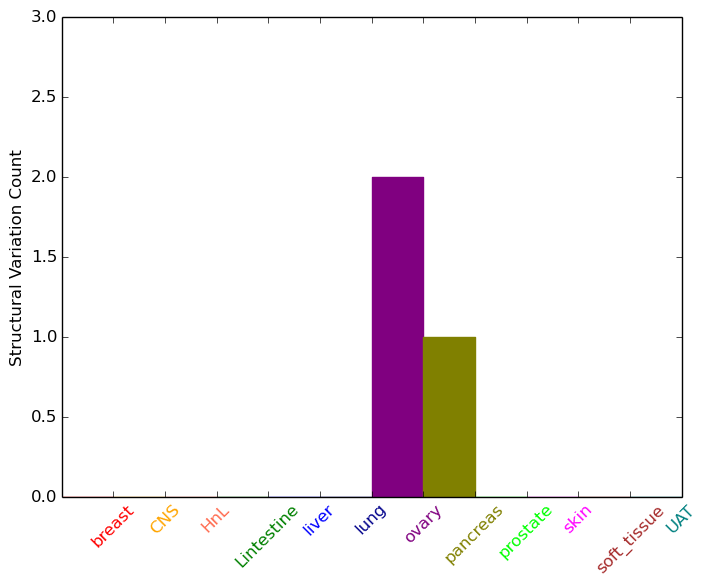 |
| Sample | Symbol_a | Chr_a | Start_a | End_a | Symbol_b | Chr_b | Start_b | End_b |
| ovary | PGM1 | chr1 | 64125217 | 64125237 | PGM1 | chr1 | 64087200 | 64087220 |
| pancreas | PGM1 | chr1 | 64103521 | 64103541 | EFCAB7 | chr1 | 64023900 | 64023920 |
| cf) Tissue number; Tissue name (1;Breast, 2;Central_nervous_system, 3;Haematopoietic_and_lymphoid_tissue, 4;Large_intestine, 5;Liver, 6;Lung, 7;Ovary, 8;Pancreas, 9;Prostate, 10;Skin, 11;Soft_tissue, 12;Upper_aerodigestive_tract) |
| * From mRNA Sanger sequences, Chitars2.0 arranged chimeric transcripts. This table shows PGM1 related fusion information. |
| ID | Head Gene | Tail Gene | Accession | Gene_a | qStart_a | qEnd_a | Chromosome_a | tStart_a | tEnd_a | Gene_a | qStart_a | qEnd_a | Chromosome_a | tStart_a | tEnd_a |
| AI830657 | PGM1 | 1 | 181 | 1 | 64125741 | 64125974 | CPSF2 | 182 | 378 | 14 | 92628923 | 92629119 | |
| BE836713 | XG | 52 | 174 | X | 2693718 | 2693841 | PGM1 | 170 | 343 | 1 | 64100606 | 64101993 | |
| AI798979 | PGM1 | 1 | 71 | 1 | 64125276 | 64125346 | PGM1 | 68 | 301 | 1 | 64125419 | 64125652 | |
| Top |
| Mutation type/ Tissue ID | brca | cns | cerv | endome | haematopo | kidn | Lintest | liver | lung | ns | ovary | pancre | prost | skin | stoma | thyro | urina | |||
| Total # sample | 1 | 1 | ||||||||||||||||||
| GAIN (# sample) | 1 | |||||||||||||||||||
| LOSS (# sample) | 1 |
| cf) Tissue ID; Tissue type (1; Breast, 2; Central_nervous_system, 3; Cervix, 4; Endometrium, 5; Haematopoietic_and_lymphoid_tissue, 6; Kidney, 7; Large_intestine, 8; Liver, 9; Lung, 10; NS, 11; Ovary, 12; Pancreas, 13; Prostate, 14; Skin, 15; Stomach, 16; Thyroid, 17; Urinary_tract) |
| Top |
|
 |
| Top |
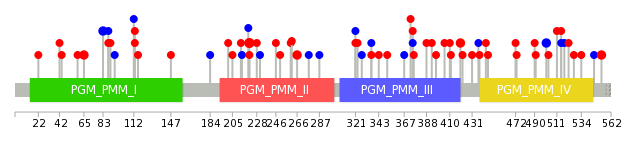
| Stat. for Non-Synonymous SNVs (# total SNVs=49) | (# total SNVs=11) |
 |  |
(# total SNVs=0) | (# total SNVs=0) |
| Top |
| * When you move the cursor on each content, you can see more deailed mutation information on the Tooltip. Those are primary_site,primary_histology,mutation(aa),pubmedID. |
| GRCh37 position | Mutation(aa) | Unique sampleID count |
| chr1:64097432-64097432 | p.R221C | 3 |
| chr1:64125315-64125315 | p.T553M | 2 |
| chr1:64120041-64120041 | p.V501V | 2 |
| chr1:64059353-64059353 | p.F65C | 2 |
| chr1:64095098-64095098 | p.I83I | 2 |
| chr1:64100614-64100614 | p.L266H | 2 |
| chr1:64095186-64095186 | p.I113F | 2 |
| chr1:64114301-64114301 | p.Y420H | 2 |
| chr1:64104445-64104445 | p.L373H | 1 |
| chr1:64095195-64095195 | p.A116T | 1 |
| Top |
|
 |
| Point Mutation/ Tissue ID | 1 | 2 | 3 | 4 | 5 | 6 | 7 | 8 | 9 | 10 | 11 | 12 | 13 | 14 | 15 | 16 | 17 | 18 | 19 | 20 |
| # sample | 3 | 1 | 1 | 7 | 1 | 1 | 1 | 1 | 5 | 1 | 1 | 1 | 5 | 4 | 8 | |||||
| # mutation | 3 | 1 | 1 | 9 | 1 | 1 | 1 | 1 | 6 | 1 | 1 | 1 | 5 | 4 | 8 | |||||
| nonsynonymous SNV | 2 | 1 | 1 | 8 | 1 | 1 | 1 | 1 | 3 | 1 | 1 | 1 | 2 | 6 | ||||||
| synonymous SNV | 1 | 1 | 3 | 1 | 4 | 2 | 2 |
| cf) Tissue ID; Tissue type (1; BLCA[Bladder Urothelial Carcinoma], 2; BRCA[Breast invasive carcinoma], 3; CESC[Cervical squamous cell carcinoma and endocervical adenocarcinoma], 4; COAD[Colon adenocarcinoma], 5; GBM[Glioblastoma multiforme], 6; Glioma Low Grade, 7; HNSC[Head and Neck squamous cell carcinoma], 8; KICH[Kidney Chromophobe], 9; KIRC[Kidney renal clear cell carcinoma], 10; KIRP[Kidney renal papillary cell carcinoma], 11; LAML[Acute Myeloid Leukemia], 12; LUAD[Lung adenocarcinoma], 13; LUSC[Lung squamous cell carcinoma], 14; OV[Ovarian serous cystadenocarcinoma ], 15; PAAD[Pancreatic adenocarcinoma], 16; PRAD[Prostate adenocarcinoma], 17; SKCM[Skin Cutaneous Melanoma], 18:STAD[Stomach adenocarcinoma], 19:THCA[Thyroid carcinoma], 20:UCEC[Uterine Corpus Endometrial Carcinoma]) |
| Top |
| * We represented just top 10 SNVs. When you move the cursor on each content, you can see more deailed mutation information on the Tooltip. Those are primary_site, primary_histology, mutation(aa), pubmedID. |
| Genomic Position | Mutation(aa) | Unique sampleID count |
| chr1:64095098 | p.I101I,PGM1 | 2 |
| chr1:64125315 | p.F202F,PGM1 | 1 |
| chr1:64095713 | p.E406K,PGM1 | 1 |
| chr1:64100678 | p.F223L,PGM1 | 1 |
| chr1:64117350 | p.W411C,PGM1 | 1 |
| chr1:64059334 | p.G232G,PGM1 | 1 |
| chr1:64095755 | p.E428K,PGM1 | 1 |
| chr1:64101999 | p.L22P | 1 |
| chr1:64117371 | p.I238I,PGM1 | 1 |
| chr1:64089164 | p.D429H,PGM1 | 1 |
| * Copy number data were extracted from TCGA using R package TCGA-Assembler. The URLs of all public data files on TCGA DCC data server were gathered on Jan-05-2015. Function ProcessCNAData in TCGA-Assembler package was used to obtain gene-level copy number value which is calculated as the average copy number of the genomic region of a gene. |
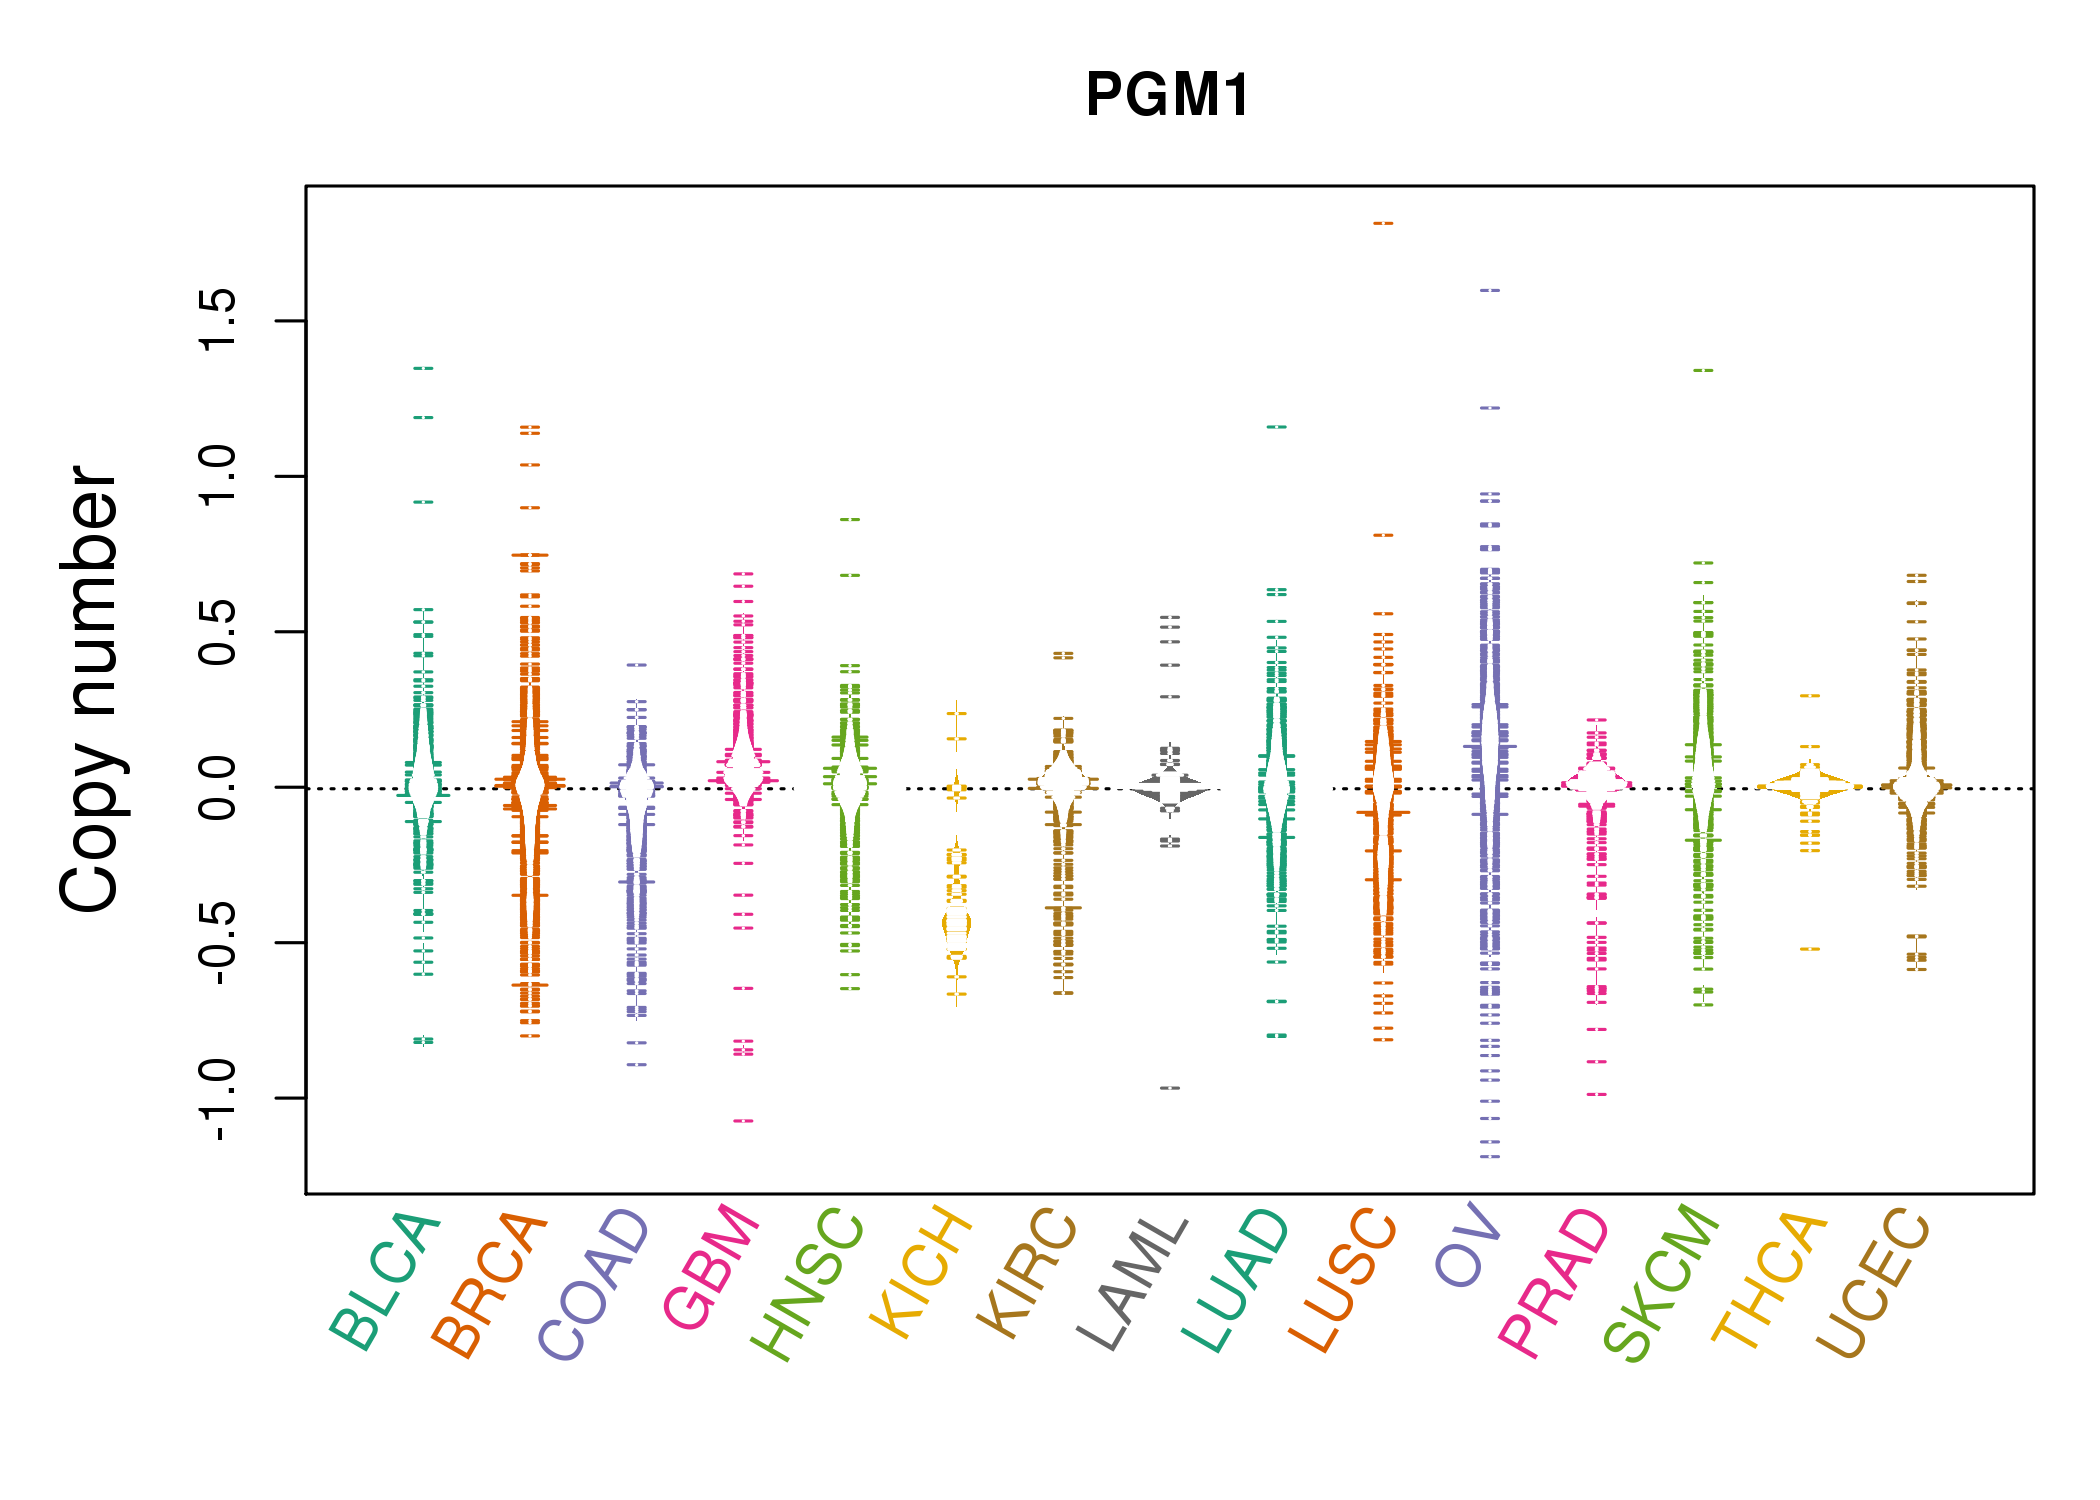 |
| cf) Tissue ID[Tissue type]: BLCA[Bladder Urothelial Carcinoma], BRCA[Breast invasive carcinoma], CESC[Cervical squamous cell carcinoma and endocervical adenocarcinoma], COAD[Colon adenocarcinoma], GBM[Glioblastoma multiforme], Glioma Low Grade, HNSC[Head and Neck squamous cell carcinoma], KICH[Kidney Chromophobe], KIRC[Kidney renal clear cell carcinoma], KIRP[Kidney renal papillary cell carcinoma], LAML[Acute Myeloid Leukemia], LUAD[Lung adenocarcinoma], LUSC[Lung squamous cell carcinoma], OV[Ovarian serous cystadenocarcinoma ], PAAD[Pancreatic adenocarcinoma], PRAD[Prostate adenocarcinoma], SKCM[Skin Cutaneous Melanoma], STAD[Stomach adenocarcinoma], THCA[Thyroid carcinoma], UCEC[Uterine Corpus Endometrial Carcinoma] |
| Top |
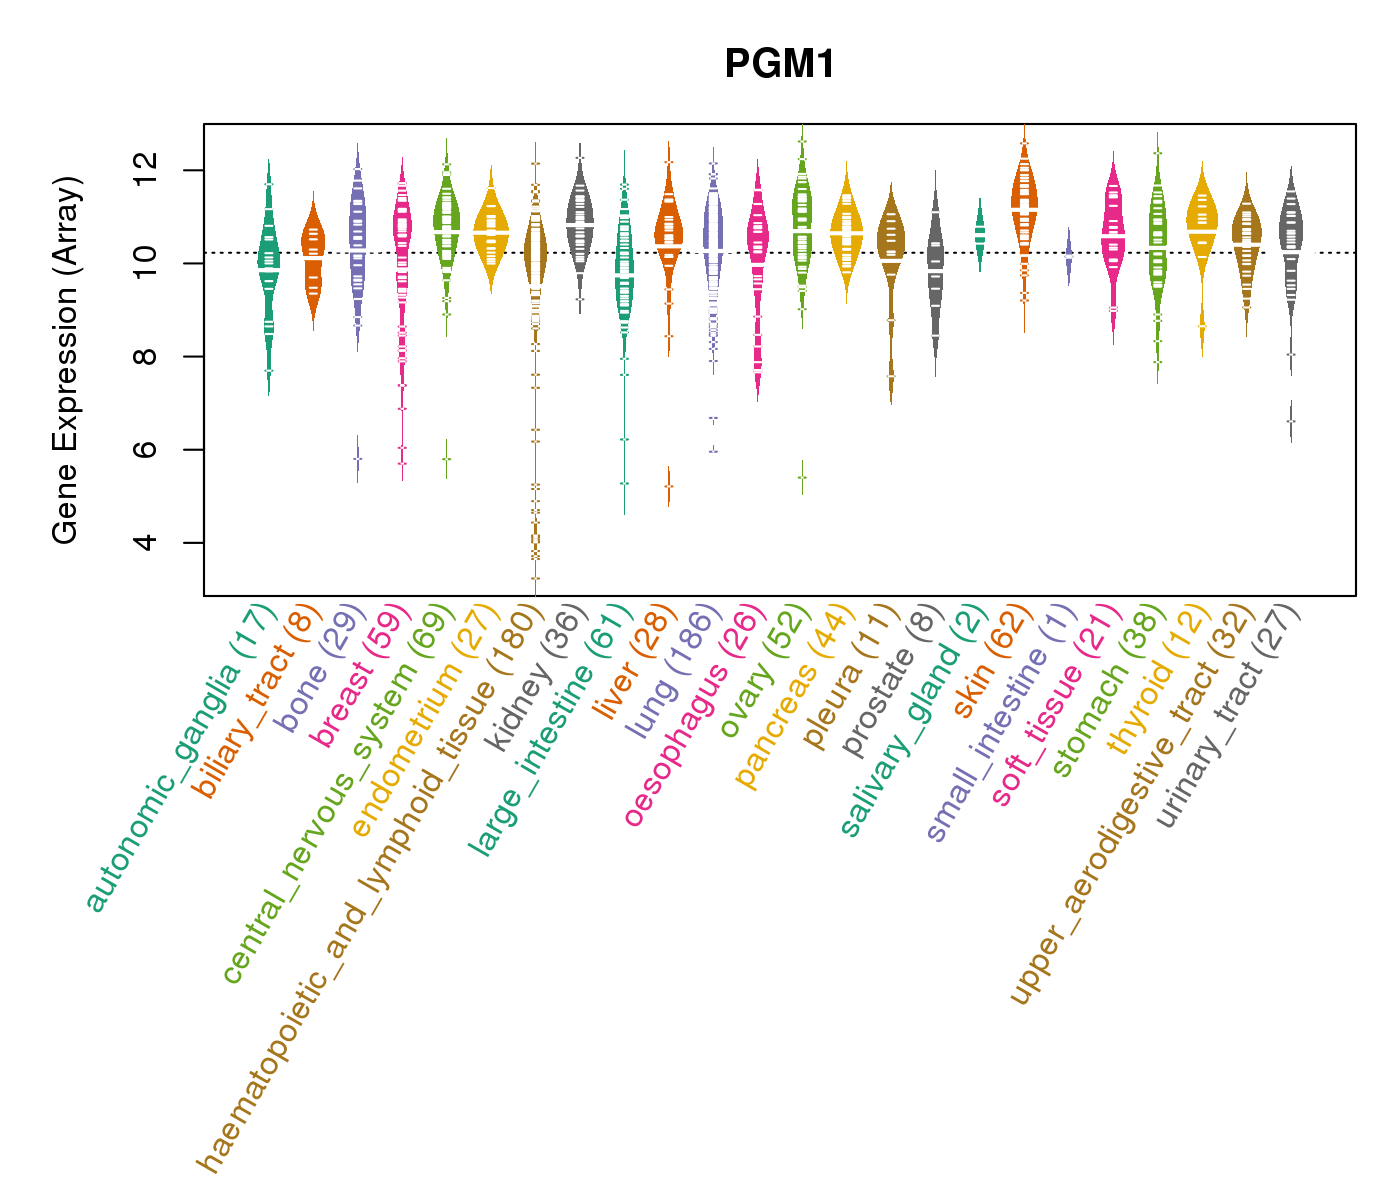
| Gene Expression for PGM1 |
| * CCLE gene expression data were extracted from CCLE_Expression_Entrez_2012-10-18.res: Gene-centric RMA-normalized mRNA expression data. |
 |
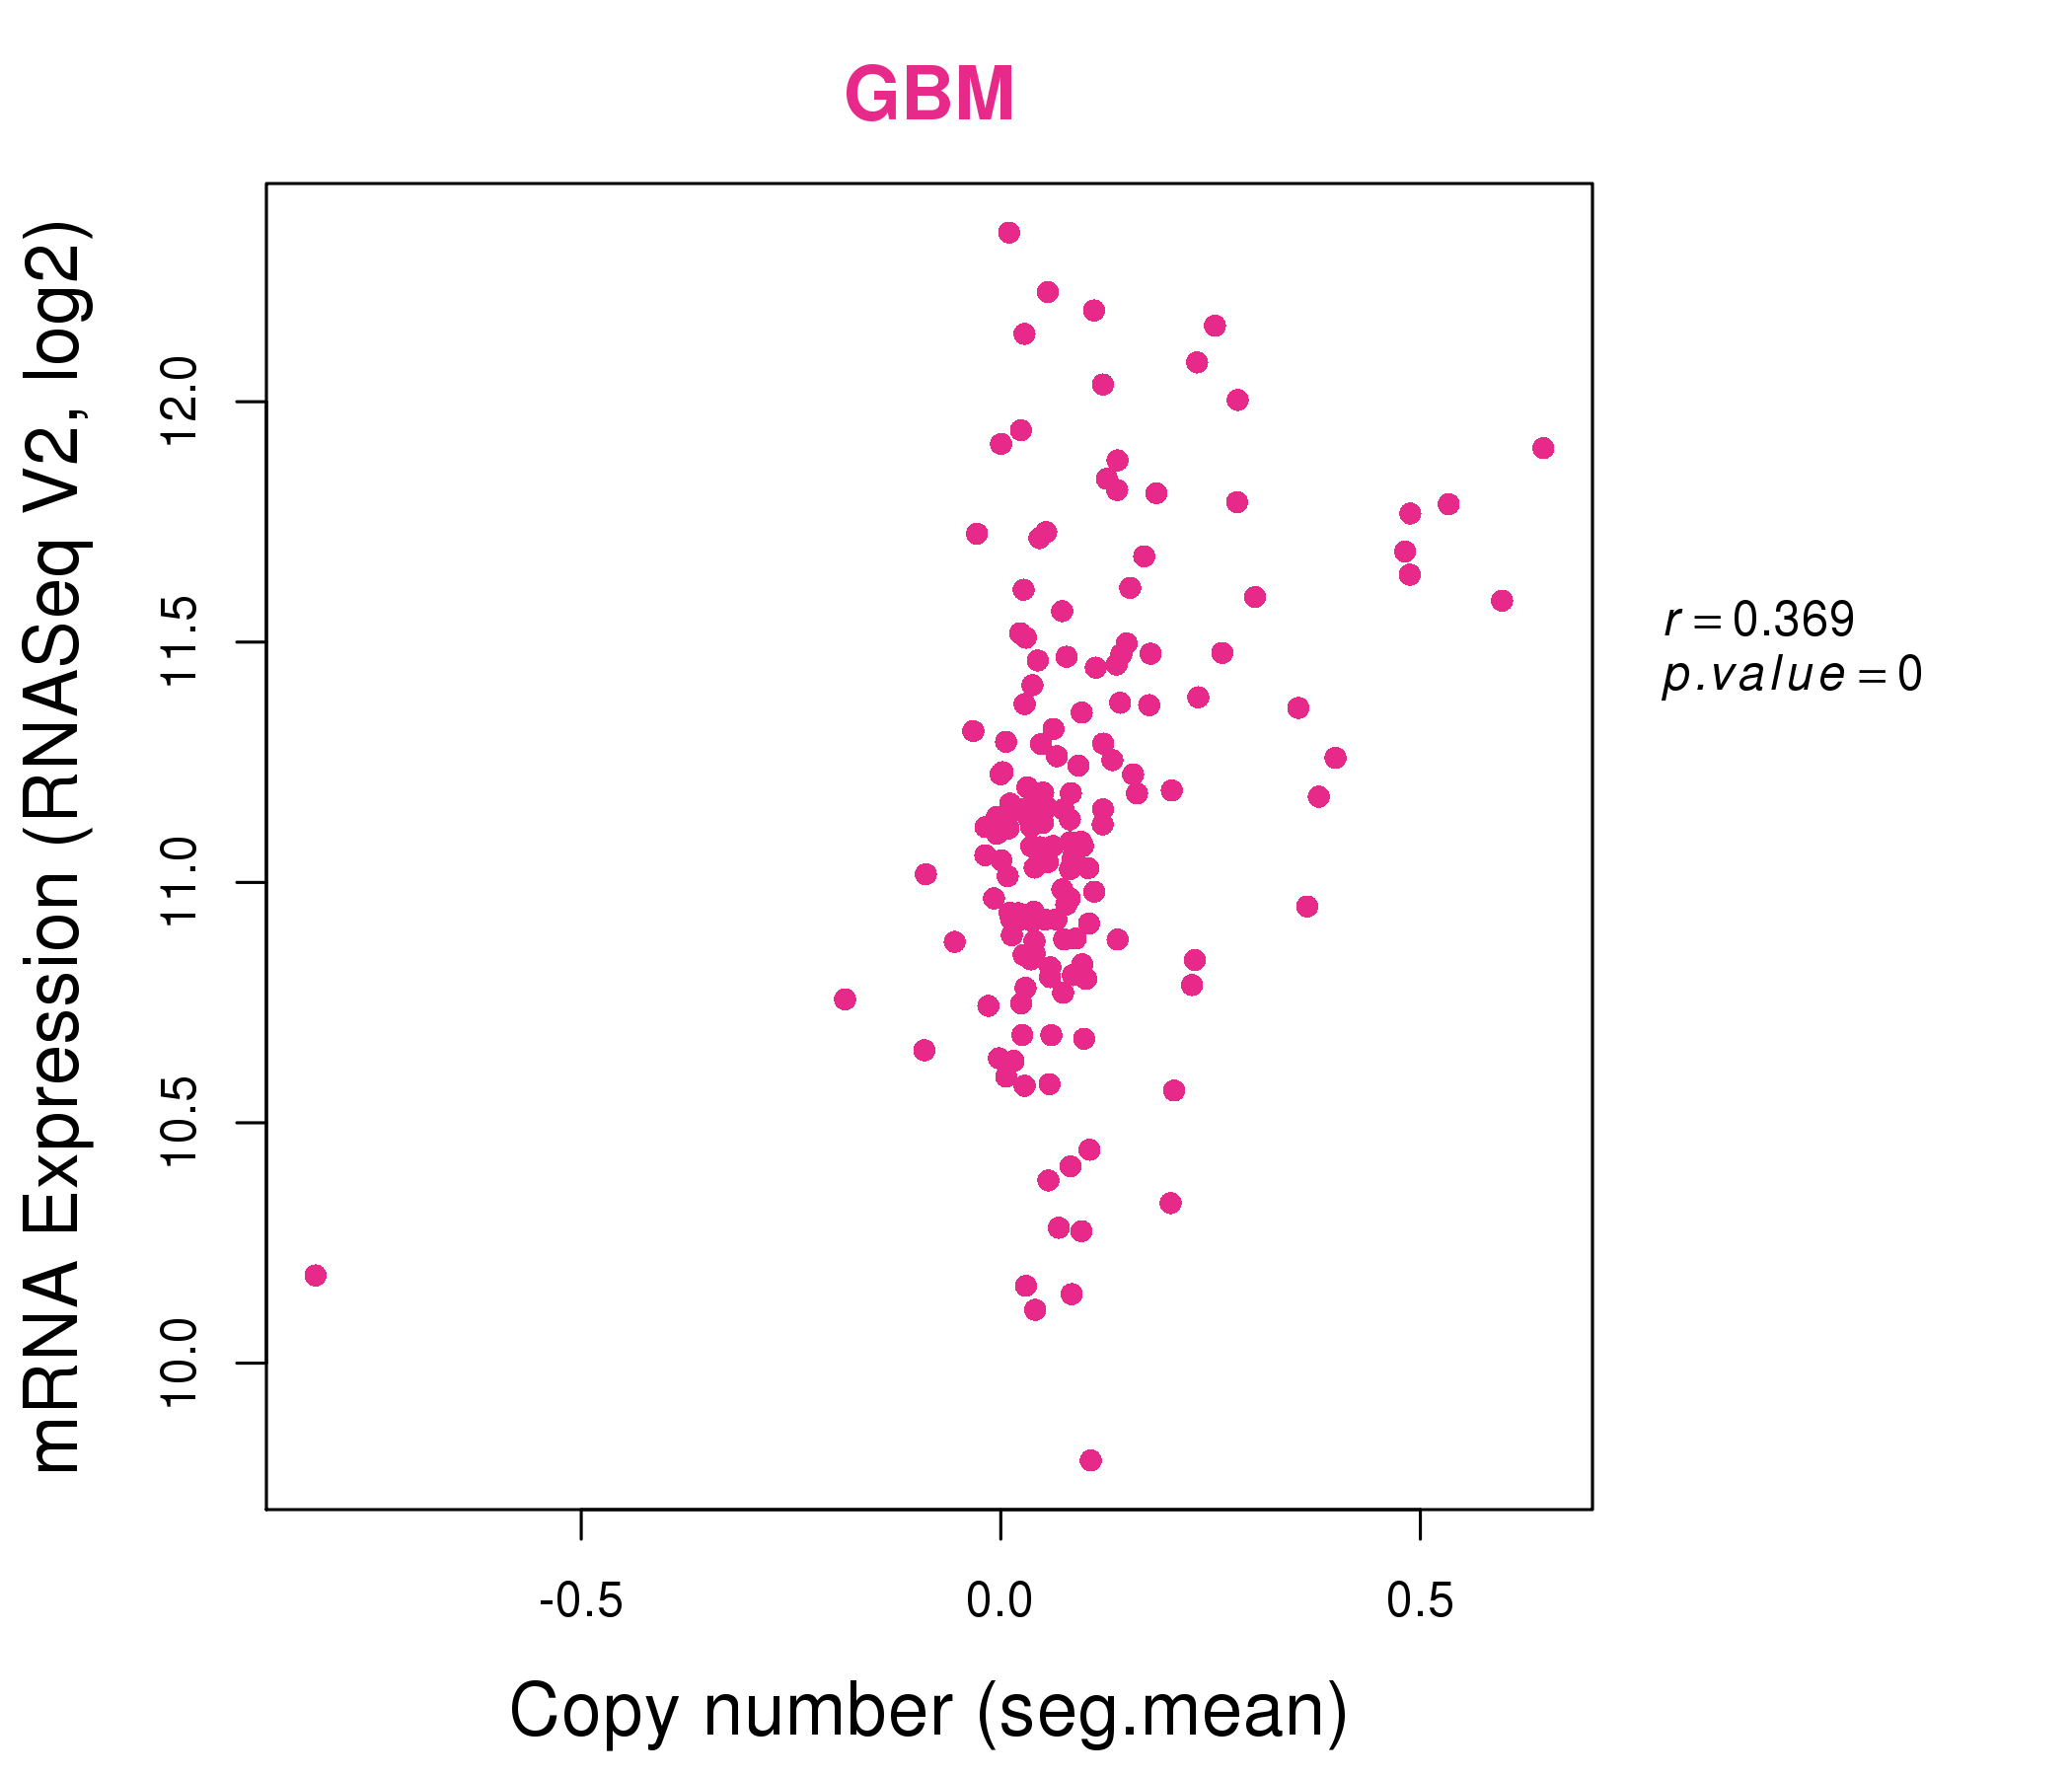
| * Normalized gene expression data of RNASeqV2 was extracted from TCGA using R package TCGA-Assembler. The URLs of all public data files on TCGA DCC data server were gathered at Jan-05-2015. Only eight cancer types have enough normal control samples for differential expression analysis. (t test, adjusted p<0.05 (using Benjamini-Hochberg FDR)) |
 |
| Top |
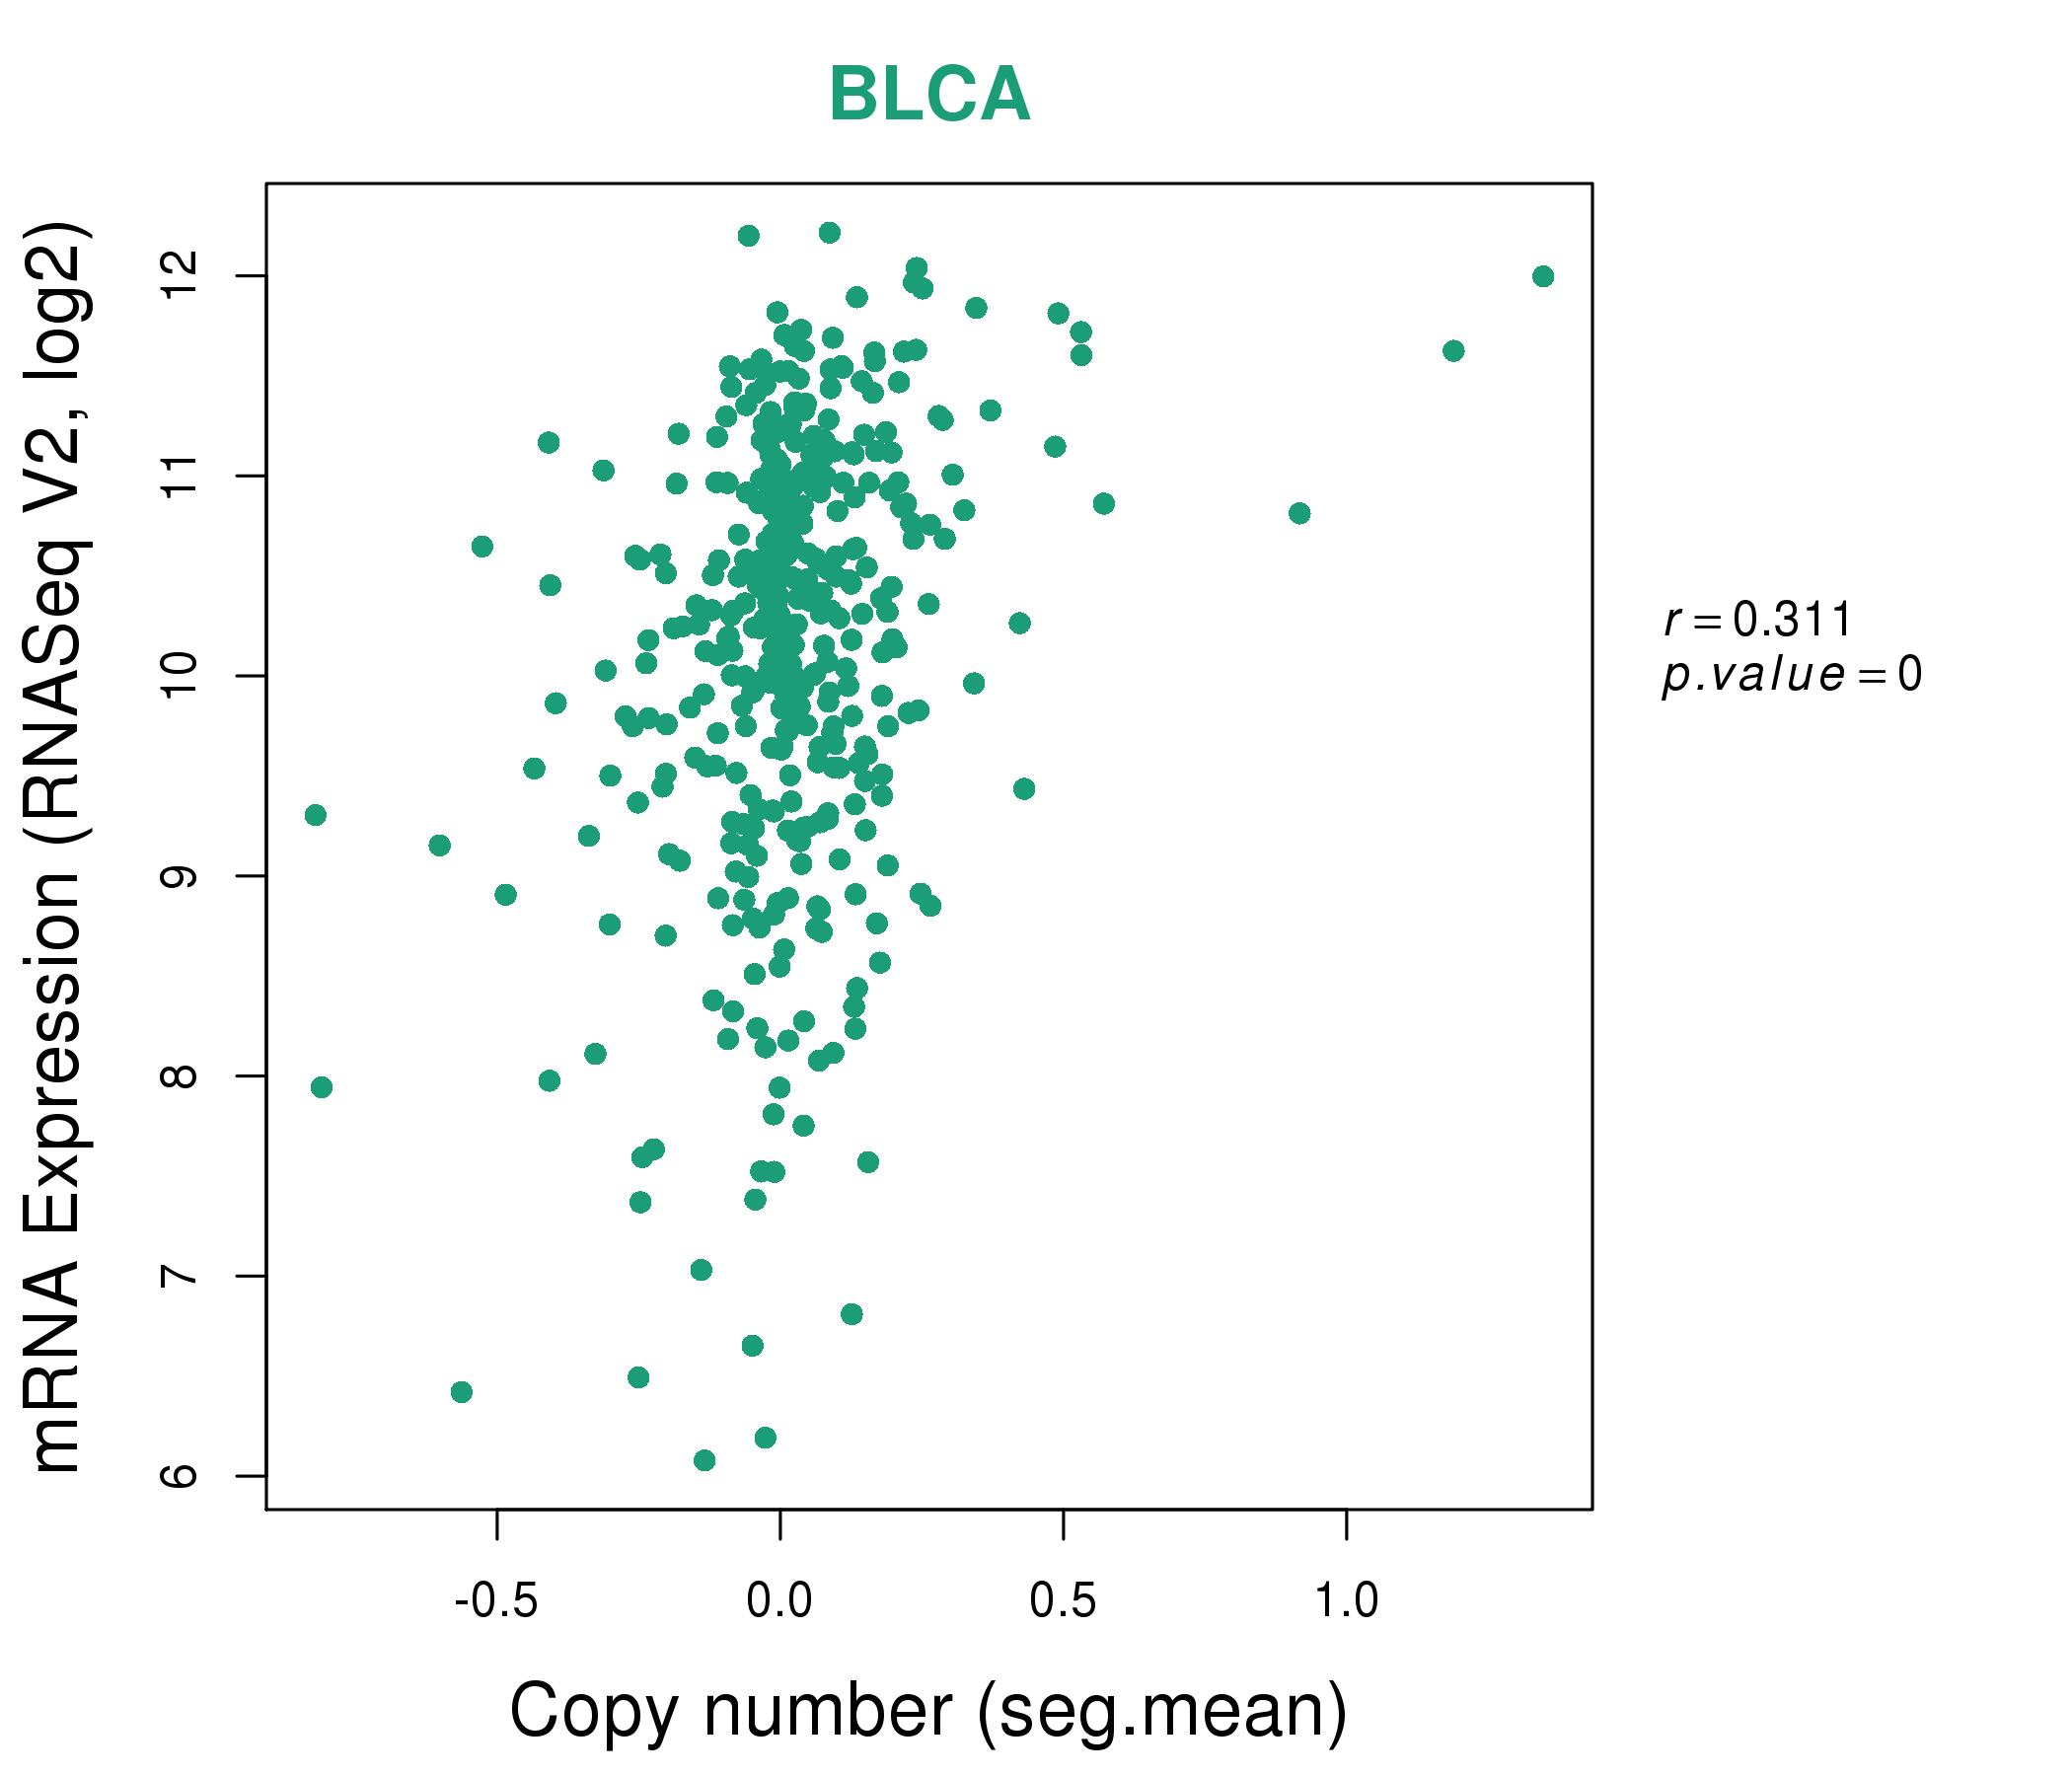
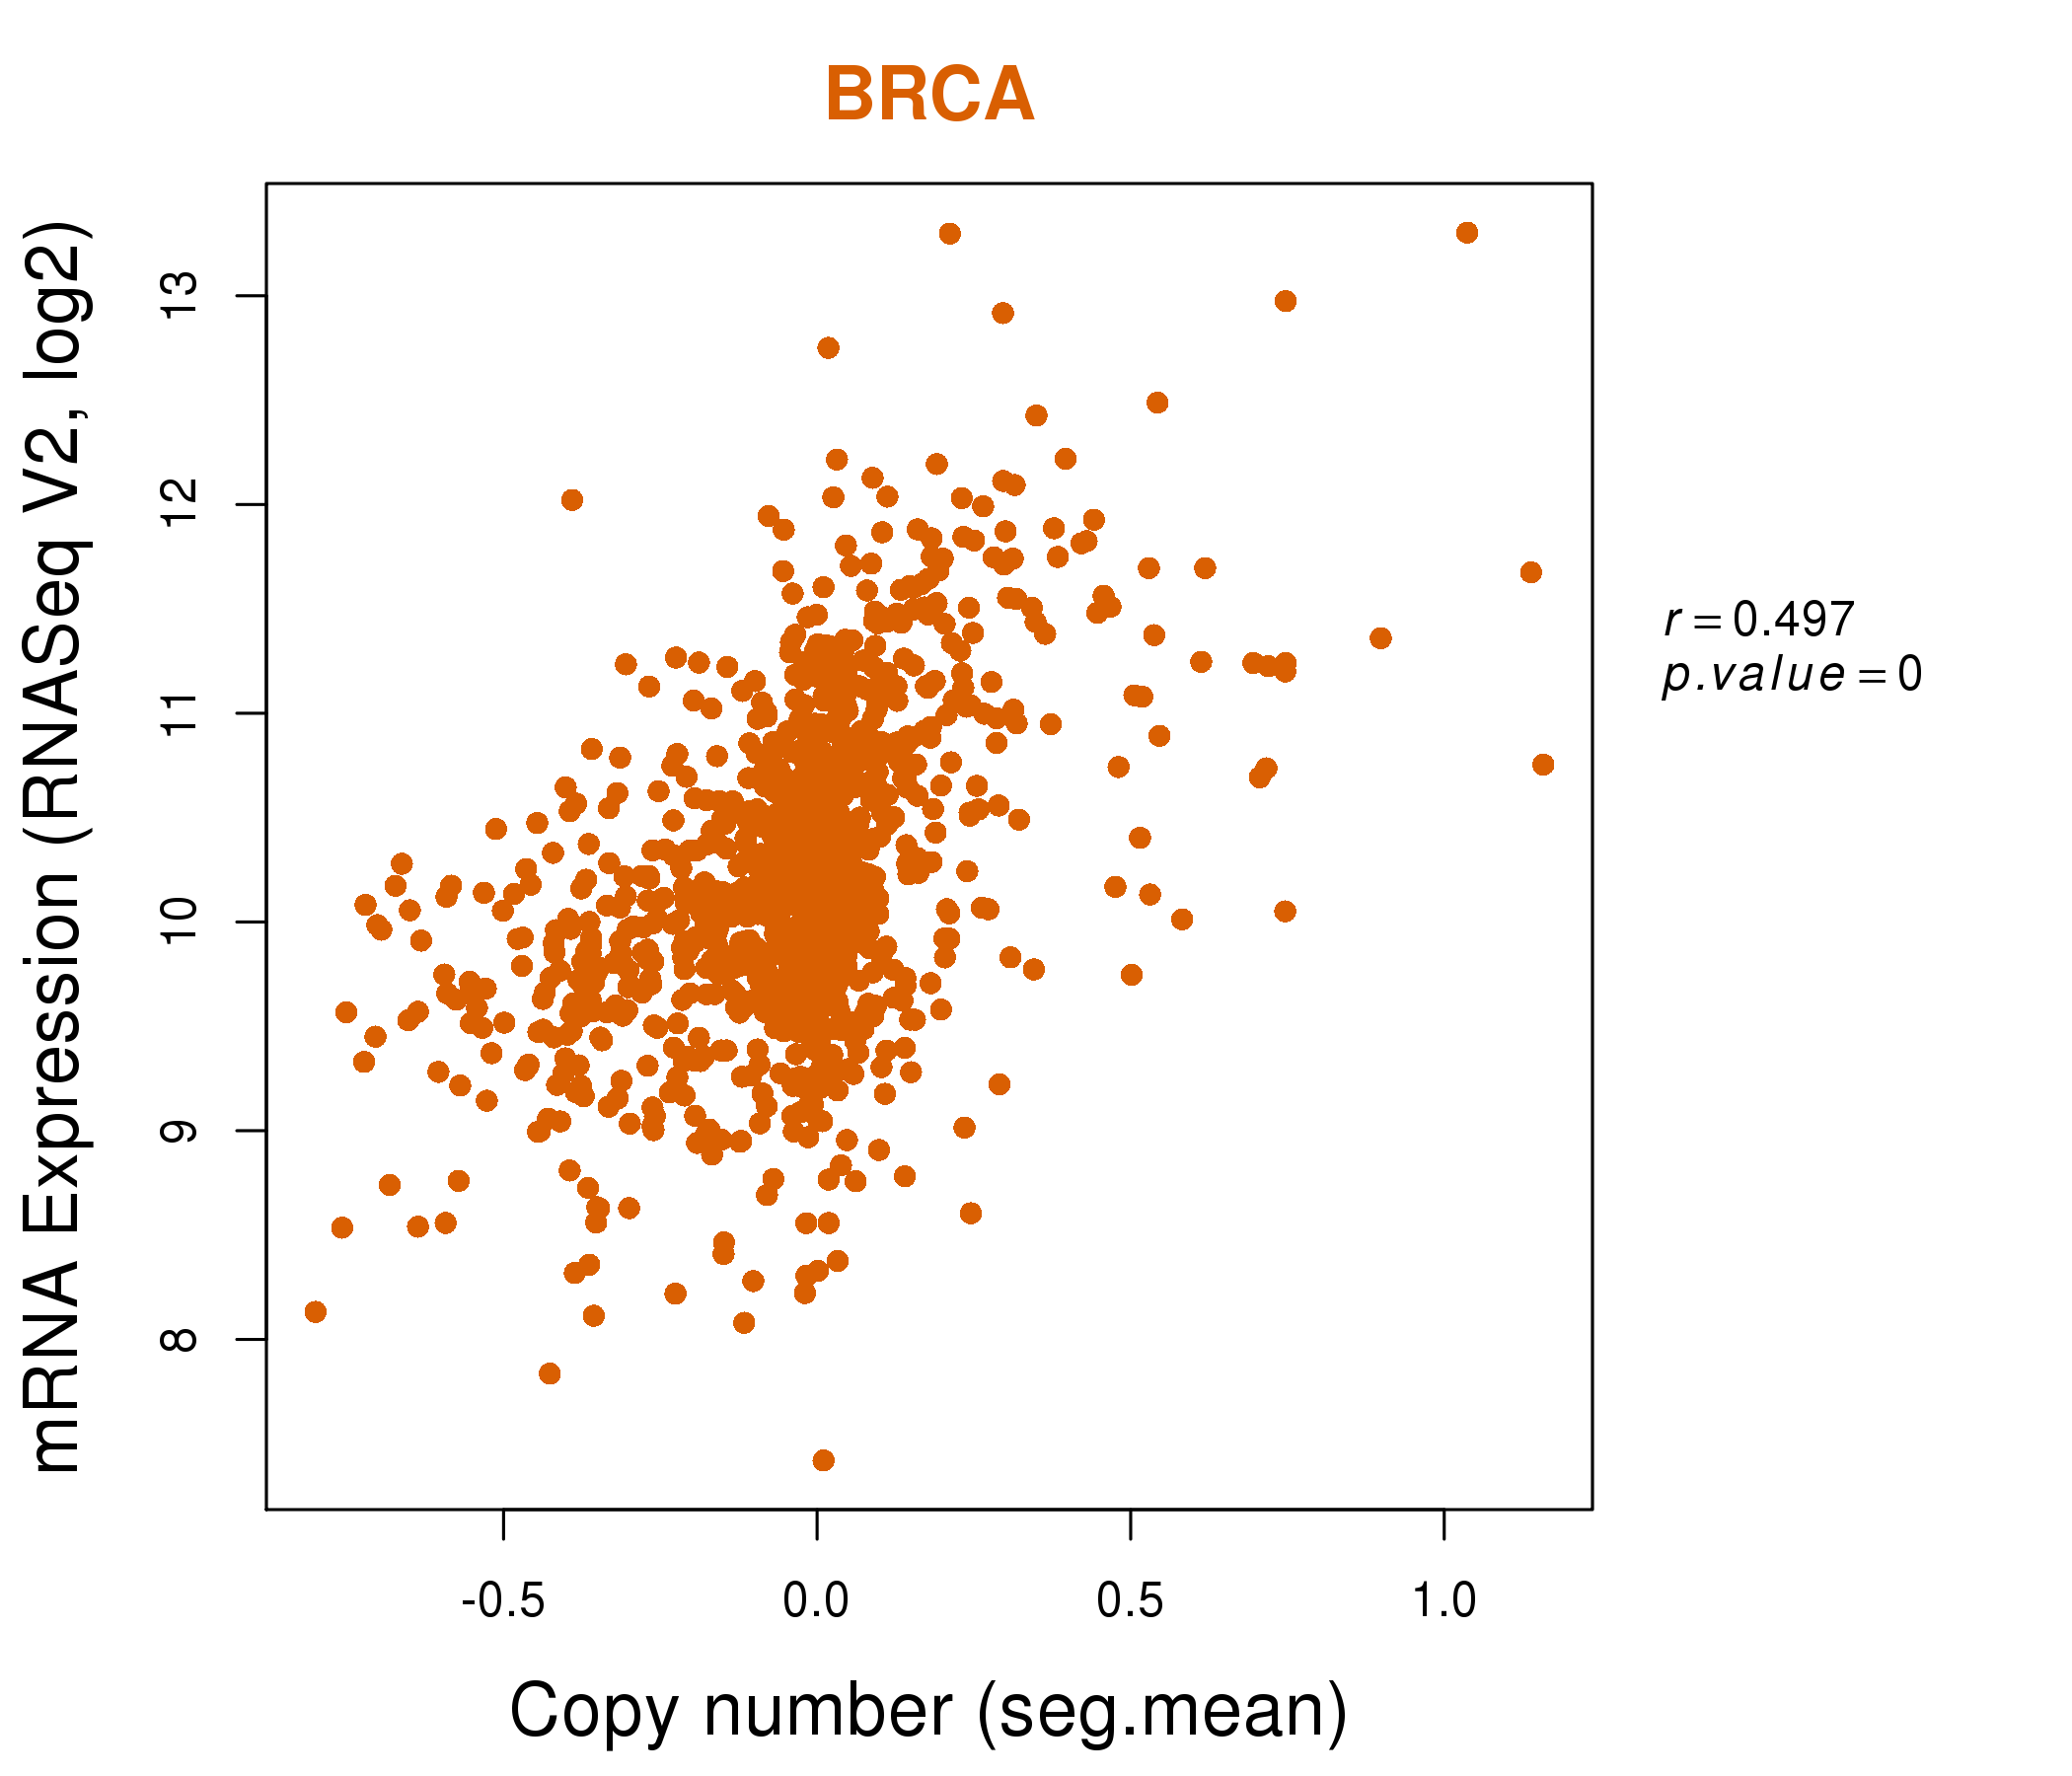
| * This plots show the correlation between CNV and gene expression. |
: Open all plots for all cancer types
 |
|
 |
|
| Top |
| Gene-Gene Network Information |
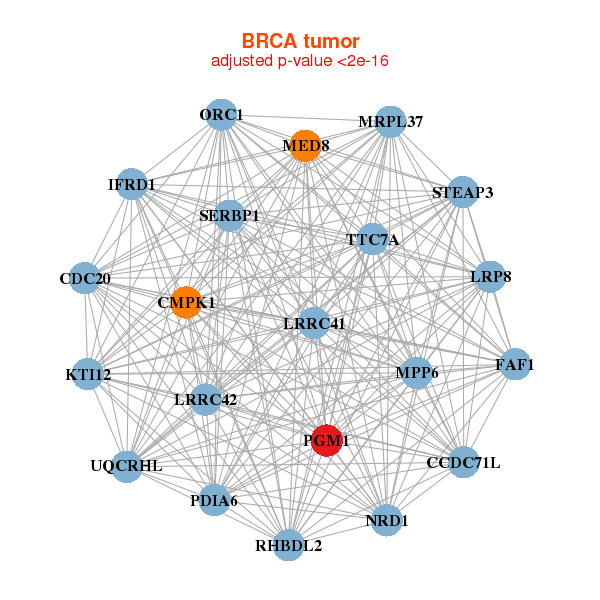
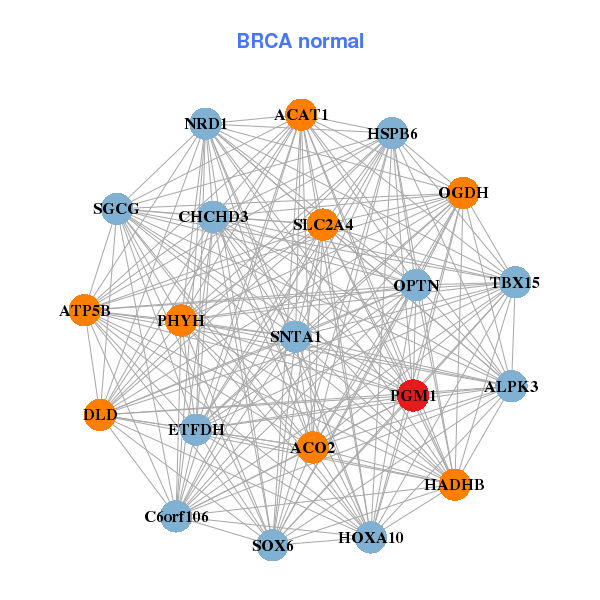
| * Co-Expression network figures were drawn using R package igraph. Only the top 20 genes with the highest correlations were shown. Red circle: input gene, orange circle: cell metabolism gene, sky circle: other gene |
: Open all plots for all cancer types
 |
| ||||
| CDC20,CMPK1,FAF1,CCDC71L,IFRD1,KTI12,LRP8, LRRC41,LRRC42,MED8,MPP6,MRPL37,NRD1,ORC1, PDIA6,PGM1,RHBDL2,SERBP1,STEAP3,TTC7A,UQCRHL | ACAT1,ACO2,ALPK3,ATP5B,C6orf106,CHCHD3,DLD, ETFDH,HADHB,HOXA10,HSPB6,NRD1,OGDH,OPTN, PGM1,PHYH,SGCG,SLC2A4,SNTA1,SOX6,TBX15 | ||||
 |
| ||||
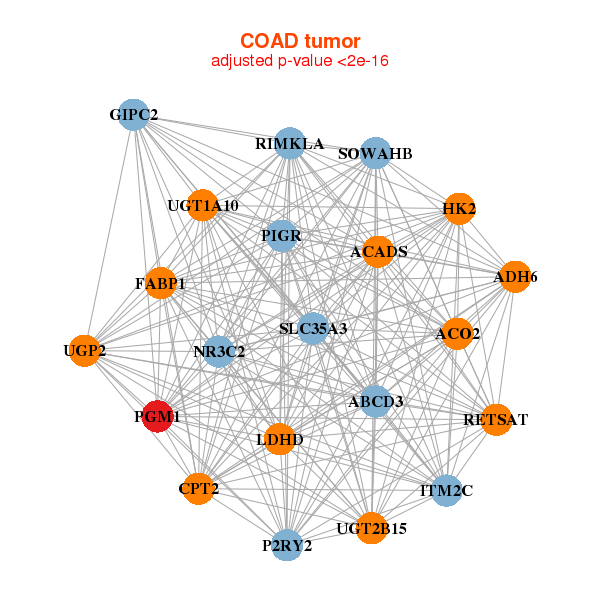
| ABCD3,ACADS,ACO2,ADH6,SOWAHB,CPT2,FABP1, GIPC2,HK2,ITM2C,LDHD,NR3C2,P2RY2,PGM1, PIGR,RETSAT,RIMKLA,SLC35A3,UGP2,UGT1A10,UGT2B15 | ACOT4,ACSS2,AGFG2,SOWAHB,AP1M2,BDH1,BTBD3, CCNJL,RHOV___CHP1,DTX4,FUT3,IHH,MARVELD3,MYO1D, PFKL,PGM1,PPARG,TNK1,TPRN,TRAF3IP2,WDR78 |
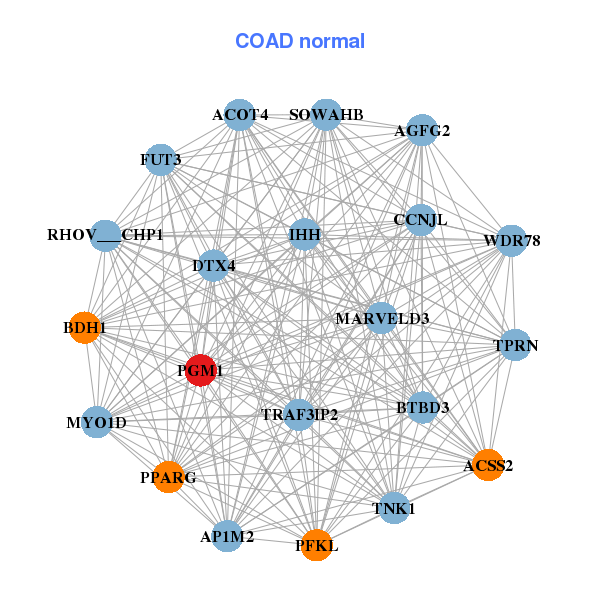
| * Co-Expression network figures were drawn using R package igraph. Only the top 20 genes with the highest correlations were shown. Red circle: input gene, orange circle: cell metabolism gene, sky circle: other gene |
: Open all plots for all cancer types
| Top |
: Open all interacting genes' information including KEGG pathway for all interacting genes from DAVID
| Top |
| Pharmacological Information for PGM1 |
| DB Category | DB Name | DB's ID and Url link |
| * Gene Centered Interaction Network. |
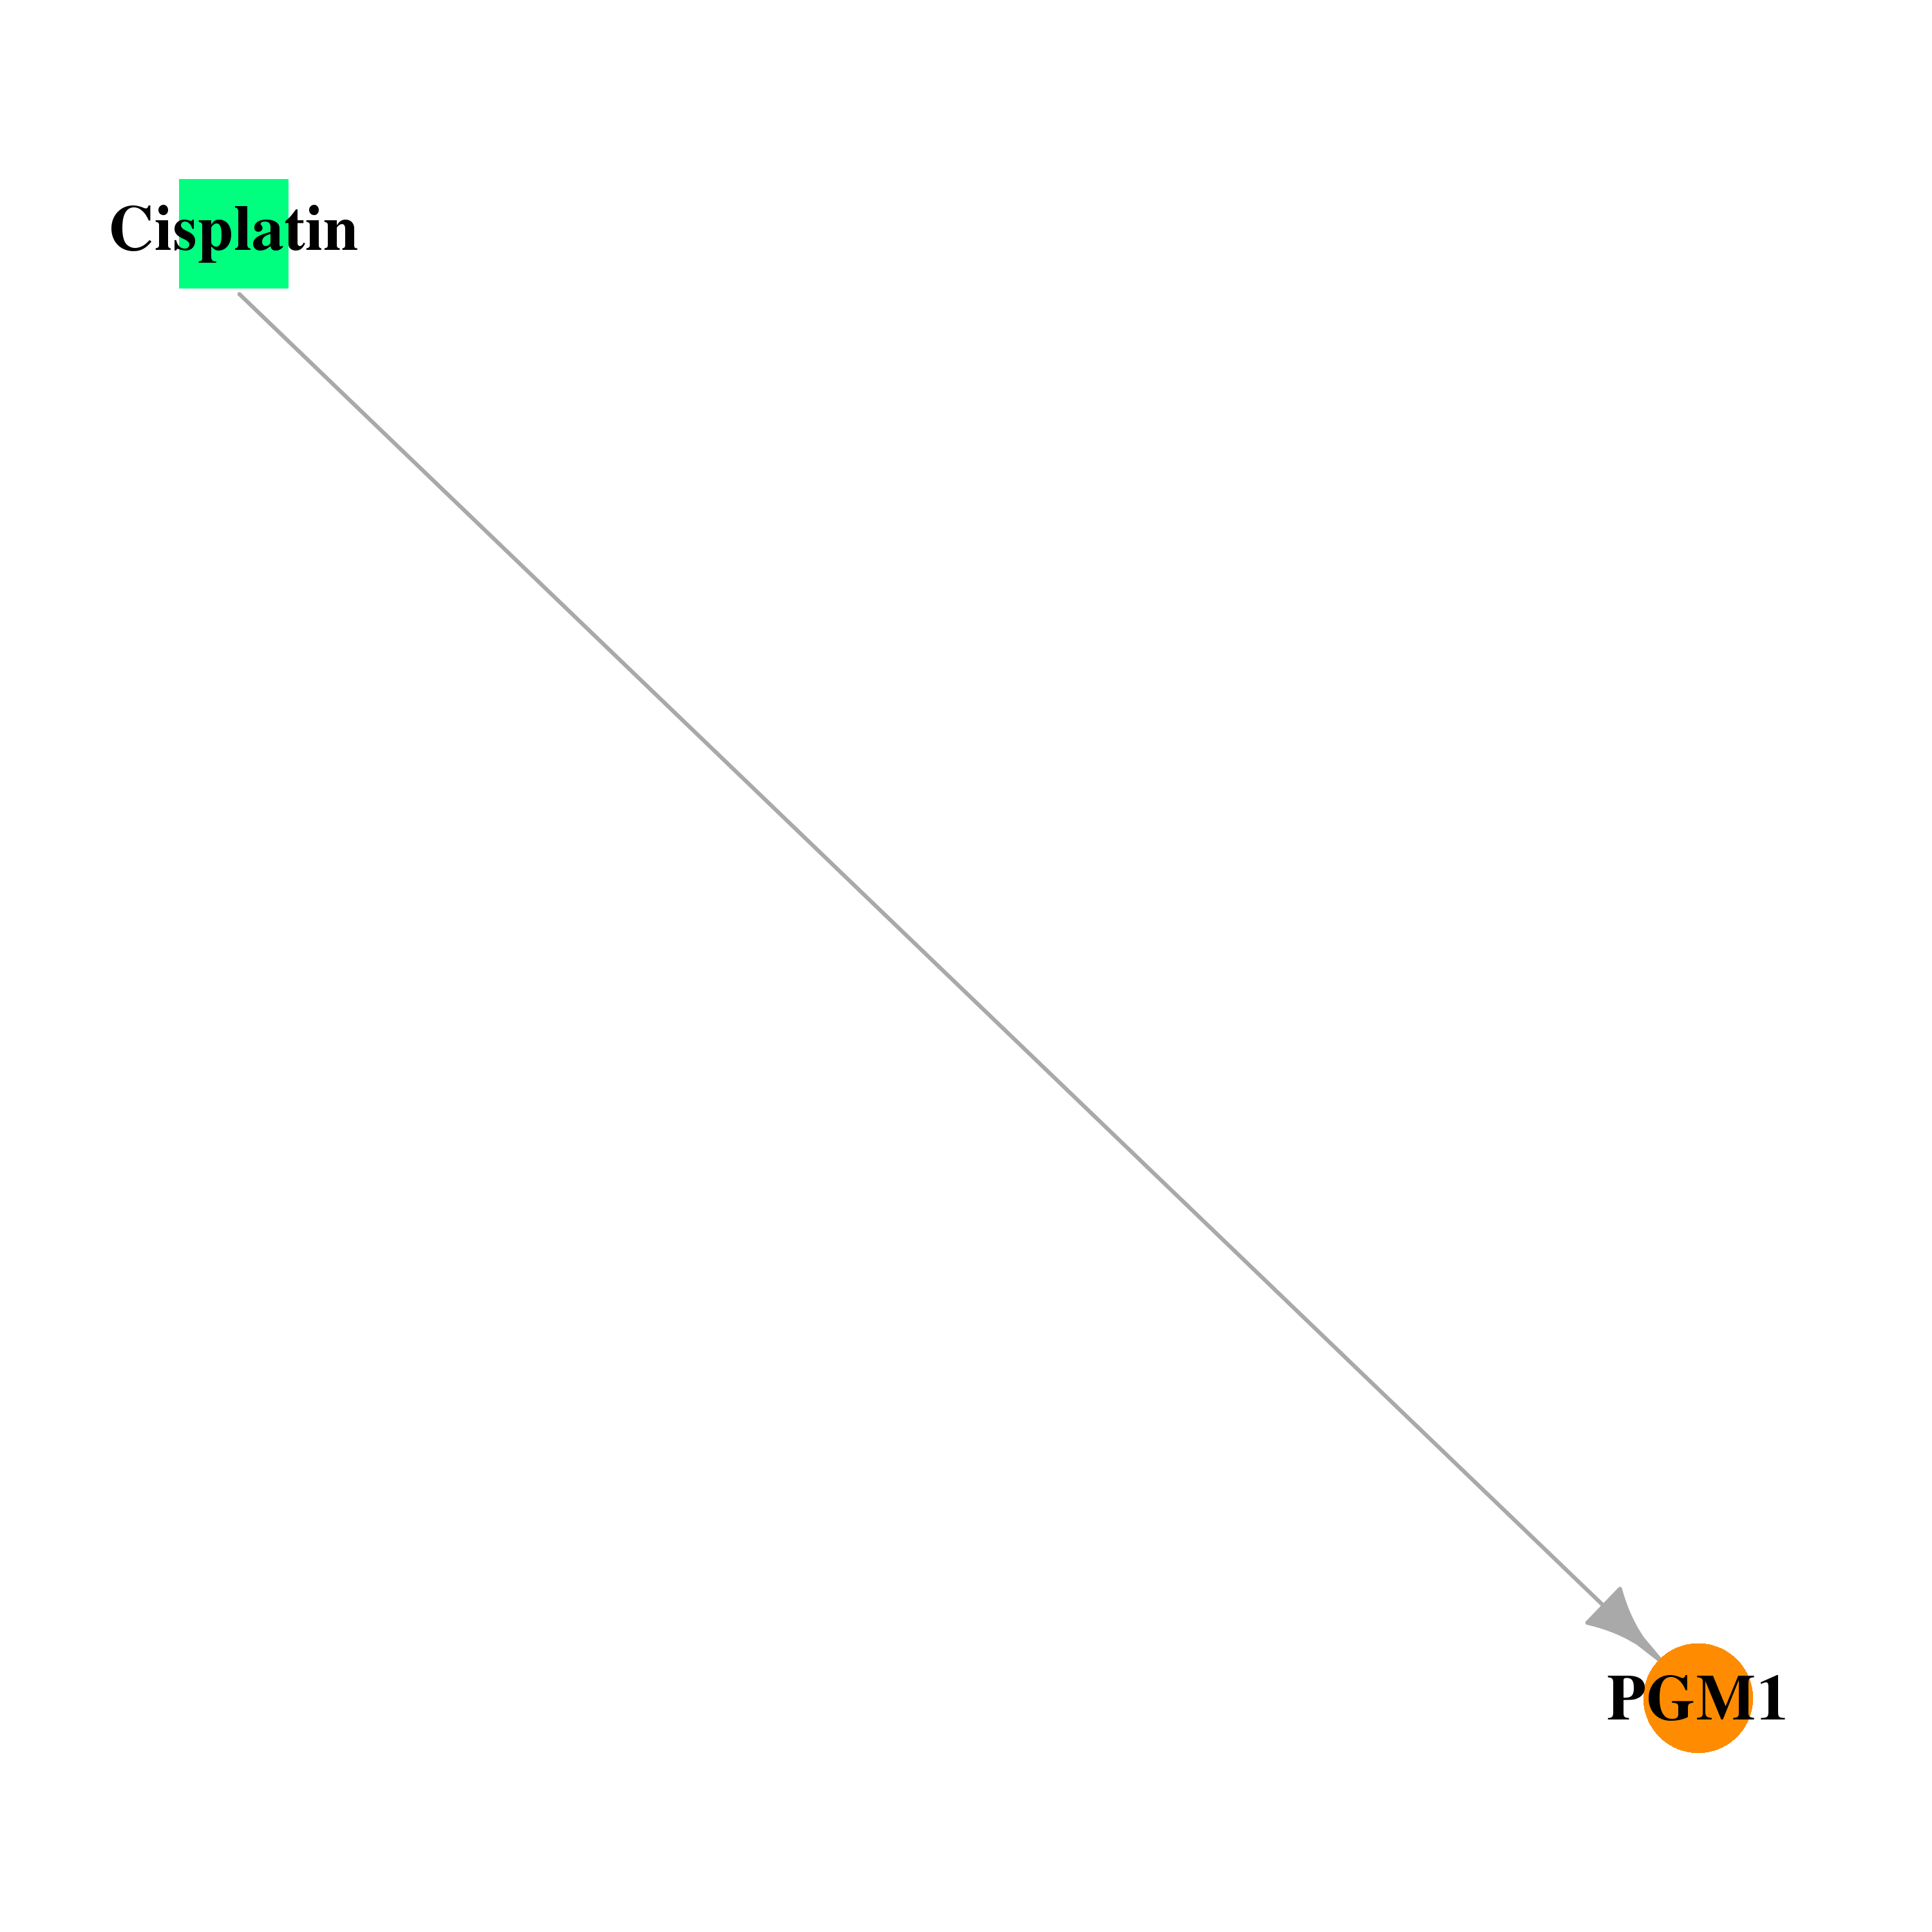 |
| * Drug Centered Interaction Network. |
| DrugBank ID | Target Name | Drug Groups | Generic Name | Drug Centered Network | Drug Structure |
| DB00515 | phosphoglucomutase 1 | approved | Cisplatin |  |  |
| Top |
| Cross referenced IDs for PGM1 |
| * We obtained these cross-references from Uniprot database. It covers 150 different DBs, 18 categories. http://www.uniprot.org/help/cross_references_section |
: Open all cross reference information
|
Copyright © 2016-Present - The Univsersity of Texas Health Science Center at Houston @ |