|
||||||||||||||||||||
| |
| Phenotypic Information (metabolism pathway, cancer, disease, phenome) |
| |
| |
| Gene-Gene Network Information: Co-Expression Network, Interacting Genes & KEGG |
| |
|


| Gene Summary for PGM3 |
| Top |
| Phenotypic Information for PGM3(metabolism pathway, cancer, disease, phenome) |
| Cancer | CGAP: PGM3 |
| Familial Cancer Database: PGM3 | |
| * This gene is included in those cancer gene databases. |
|
|
|
|
|
| . | ||||||||||||||
Oncogene 1 | Significant driver gene in | |||||||||||||||||||
| cf) number; DB name 1 Oncogene; http://nar.oxfordjournals.org/content/35/suppl_1/D721.long, 2 Tumor Suppressor gene; https://bioinfo.uth.edu/TSGene/, 3 Cancer Gene Census; http://www.nature.com/nrc/journal/v4/n3/abs/nrc1299.html, 4 CancerGenes; http://nar.oxfordjournals.org/content/35/suppl_1/D721.long, 5 Network of Cancer Gene; http://ncg.kcl.ac.uk/index.php, 1Therapeutic Vulnerabilities in Cancer; http://cbio.mskcc.org/cancergenomics/statius/ |
| KEGG_AMINO_SUGAR_AND_NUCLEOTIDE_SUGAR_METABOLISM REACTOME_METABOLISM_OF_PROTEINS | |
| OMIM | |
| Orphanet | |
| Disease | KEGG Disease: PGM3 |
| MedGen: PGM3 (Human Medical Genetics with Condition) | |
| ClinVar: PGM3 | |
| Phenotype | MGI: PGM3 (International Mouse Phenotyping Consortium) |
| PhenomicDB: PGM3 | |
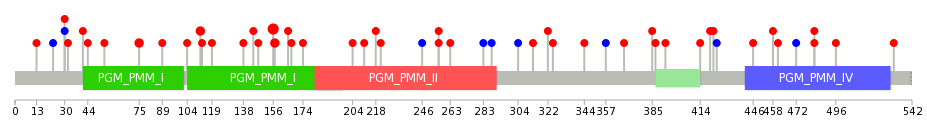
| Mutations for PGM3 |
| * Under tables are showing count per each tissue to give us broad intuition about tissue specific mutation patterns.You can go to the detailed page for each mutation database's web site. |
| There's no structural variation information in COSMIC data for this gene. |
| * From mRNA Sanger sequences, Chitars2.0 arranged chimeric transcripts. This table shows PGM3 related fusion information. |
| ID | Head Gene | Tail Gene | Accession | Gene_a | qStart_a | qEnd_a | Chromosome_a | tStart_a | tEnd_a | Gene_a | qStart_a | qEnd_a | Chromosome_a | tStart_a | tEnd_a |
| BP314848 | HIST1H2BE | 1 | 468 | 6 | 26183989 | 26184456 | PGM3 | 467 | 583 | 6 | 83900698 | 83902978 | |
| Top |
| There's no copy number variation information in COSMIC data for this gene. |
| Top |
|
 |
| Top |
| Stat. for Non-Synonymous SNVs (# total SNVs=34) | (# total SNVs=6) |
 |  |
(# total SNVs=0) | (# total SNVs=0) |
| Top |
| * When you move the cursor on each content, you can see more deailed mutation information on the Tooltip. Those are primary_site,primary_histology,mutation(aa),pubmedID. |
| GRCh37 position | Mutation(aa) | Unique sampleID count |
| chr6:83892687-83892687 | p.L156F | 5 |
| chr6:83898387-83898387 | p.K112I | 2 |
| chr6:83898499-83898499 | p.L75V | 2 |
| chr6:83892684-83892684 | p.L157F | 2 |
| chr6:83891590-83891590 | p.A218T | 1 |
| chr6:83878990-83878990 | p.A531D | 1 |
| chr6:83896753-83896753 | p.V144A | 1 |
| chr6:83881781-83881781 | p.? | 1 |
| chr6:83900638-83900638 | p.A32T | 1 |
| chr6:83889536-83889536 | p.L313P | 1 |
| Top |
|
 |
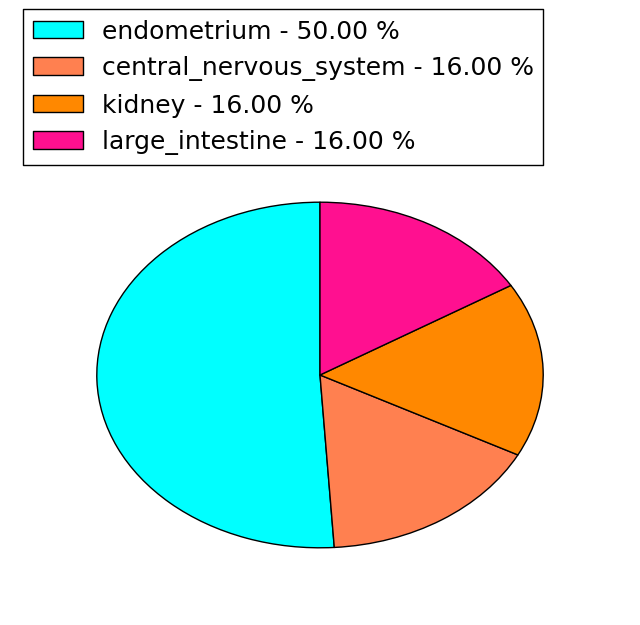
| Point Mutation/ Tissue ID | 1 | 2 | 3 | 4 | 5 | 6 | 7 | 8 | 9 | 10 | 11 | 12 | 13 | 14 | 15 | 16 | 17 | 18 | 19 | 20 |
| # sample | 1 | 7 | 1 | 1 | 1 | 4 | 1 | 3 | 10 | 5 | ||||||||||
| # mutation | 1 | 8 | 1 | 1 | 1 | 5 | 1 | 3 | 11 | 6 | ||||||||||
| nonsynonymous SNV | 1 | 7 | 1 | 1 | 5 | 1 | 1 | 8 | 3 | |||||||||||
| synonymous SNV | 1 | 1 | 2 | 3 | 3 |
| cf) Tissue ID; Tissue type (1; BLCA[Bladder Urothelial Carcinoma], 2; BRCA[Breast invasive carcinoma], 3; CESC[Cervical squamous cell carcinoma and endocervical adenocarcinoma], 4; COAD[Colon adenocarcinoma], 5; GBM[Glioblastoma multiforme], 6; Glioma Low Grade, 7; HNSC[Head and Neck squamous cell carcinoma], 8; KICH[Kidney Chromophobe], 9; KIRC[Kidney renal clear cell carcinoma], 10; KIRP[Kidney renal papillary cell carcinoma], 11; LAML[Acute Myeloid Leukemia], 12; LUAD[Lung adenocarcinoma], 13; LUSC[Lung squamous cell carcinoma], 14; OV[Ovarian serous cystadenocarcinoma ], 15; PAAD[Pancreatic adenocarcinoma], 16; PRAD[Prostate adenocarcinoma], 17; SKCM[Skin Cutaneous Melanoma], 18:STAD[Stomach adenocarcinoma], 19:THCA[Thyroid carcinoma], 20:UCEC[Uterine Corpus Endometrial Carcinoma]) |
| Top |
| * We represented just top 10 SNVs. When you move the cursor on each content, you can see more deailed mutation information on the Tooltip. Those are primary_site, primary_histology, mutation(aa), pubmedID. |
| Genomic Position | Mutation(aa) | Unique sampleID count |
| chr6:83900610 | p.A32T,PGM3 | 1 |
| chr6:83878990 | p.D402Y,PGM3 | 1 |
| chr6:83885738 | p.V202V,PGM3 | 1 |
| chr6:83892642 | p.T30T,PGM3 | 1 |
| chr6:83900638 | p.P394Q,PGM3 | 1 |
| chr6:83880116 | p.G182E,PGM3 | 1 |
| chr6:83885778 | p.T30M,PGM3 | 1 |
| chr6:83892656 | p.D377G,PGM3 | 1 |
| chr6:83900642 | p.S175G,PGM3 | 1 |
| chr6:83880139 | p.N165N,PGM3 | 1 |
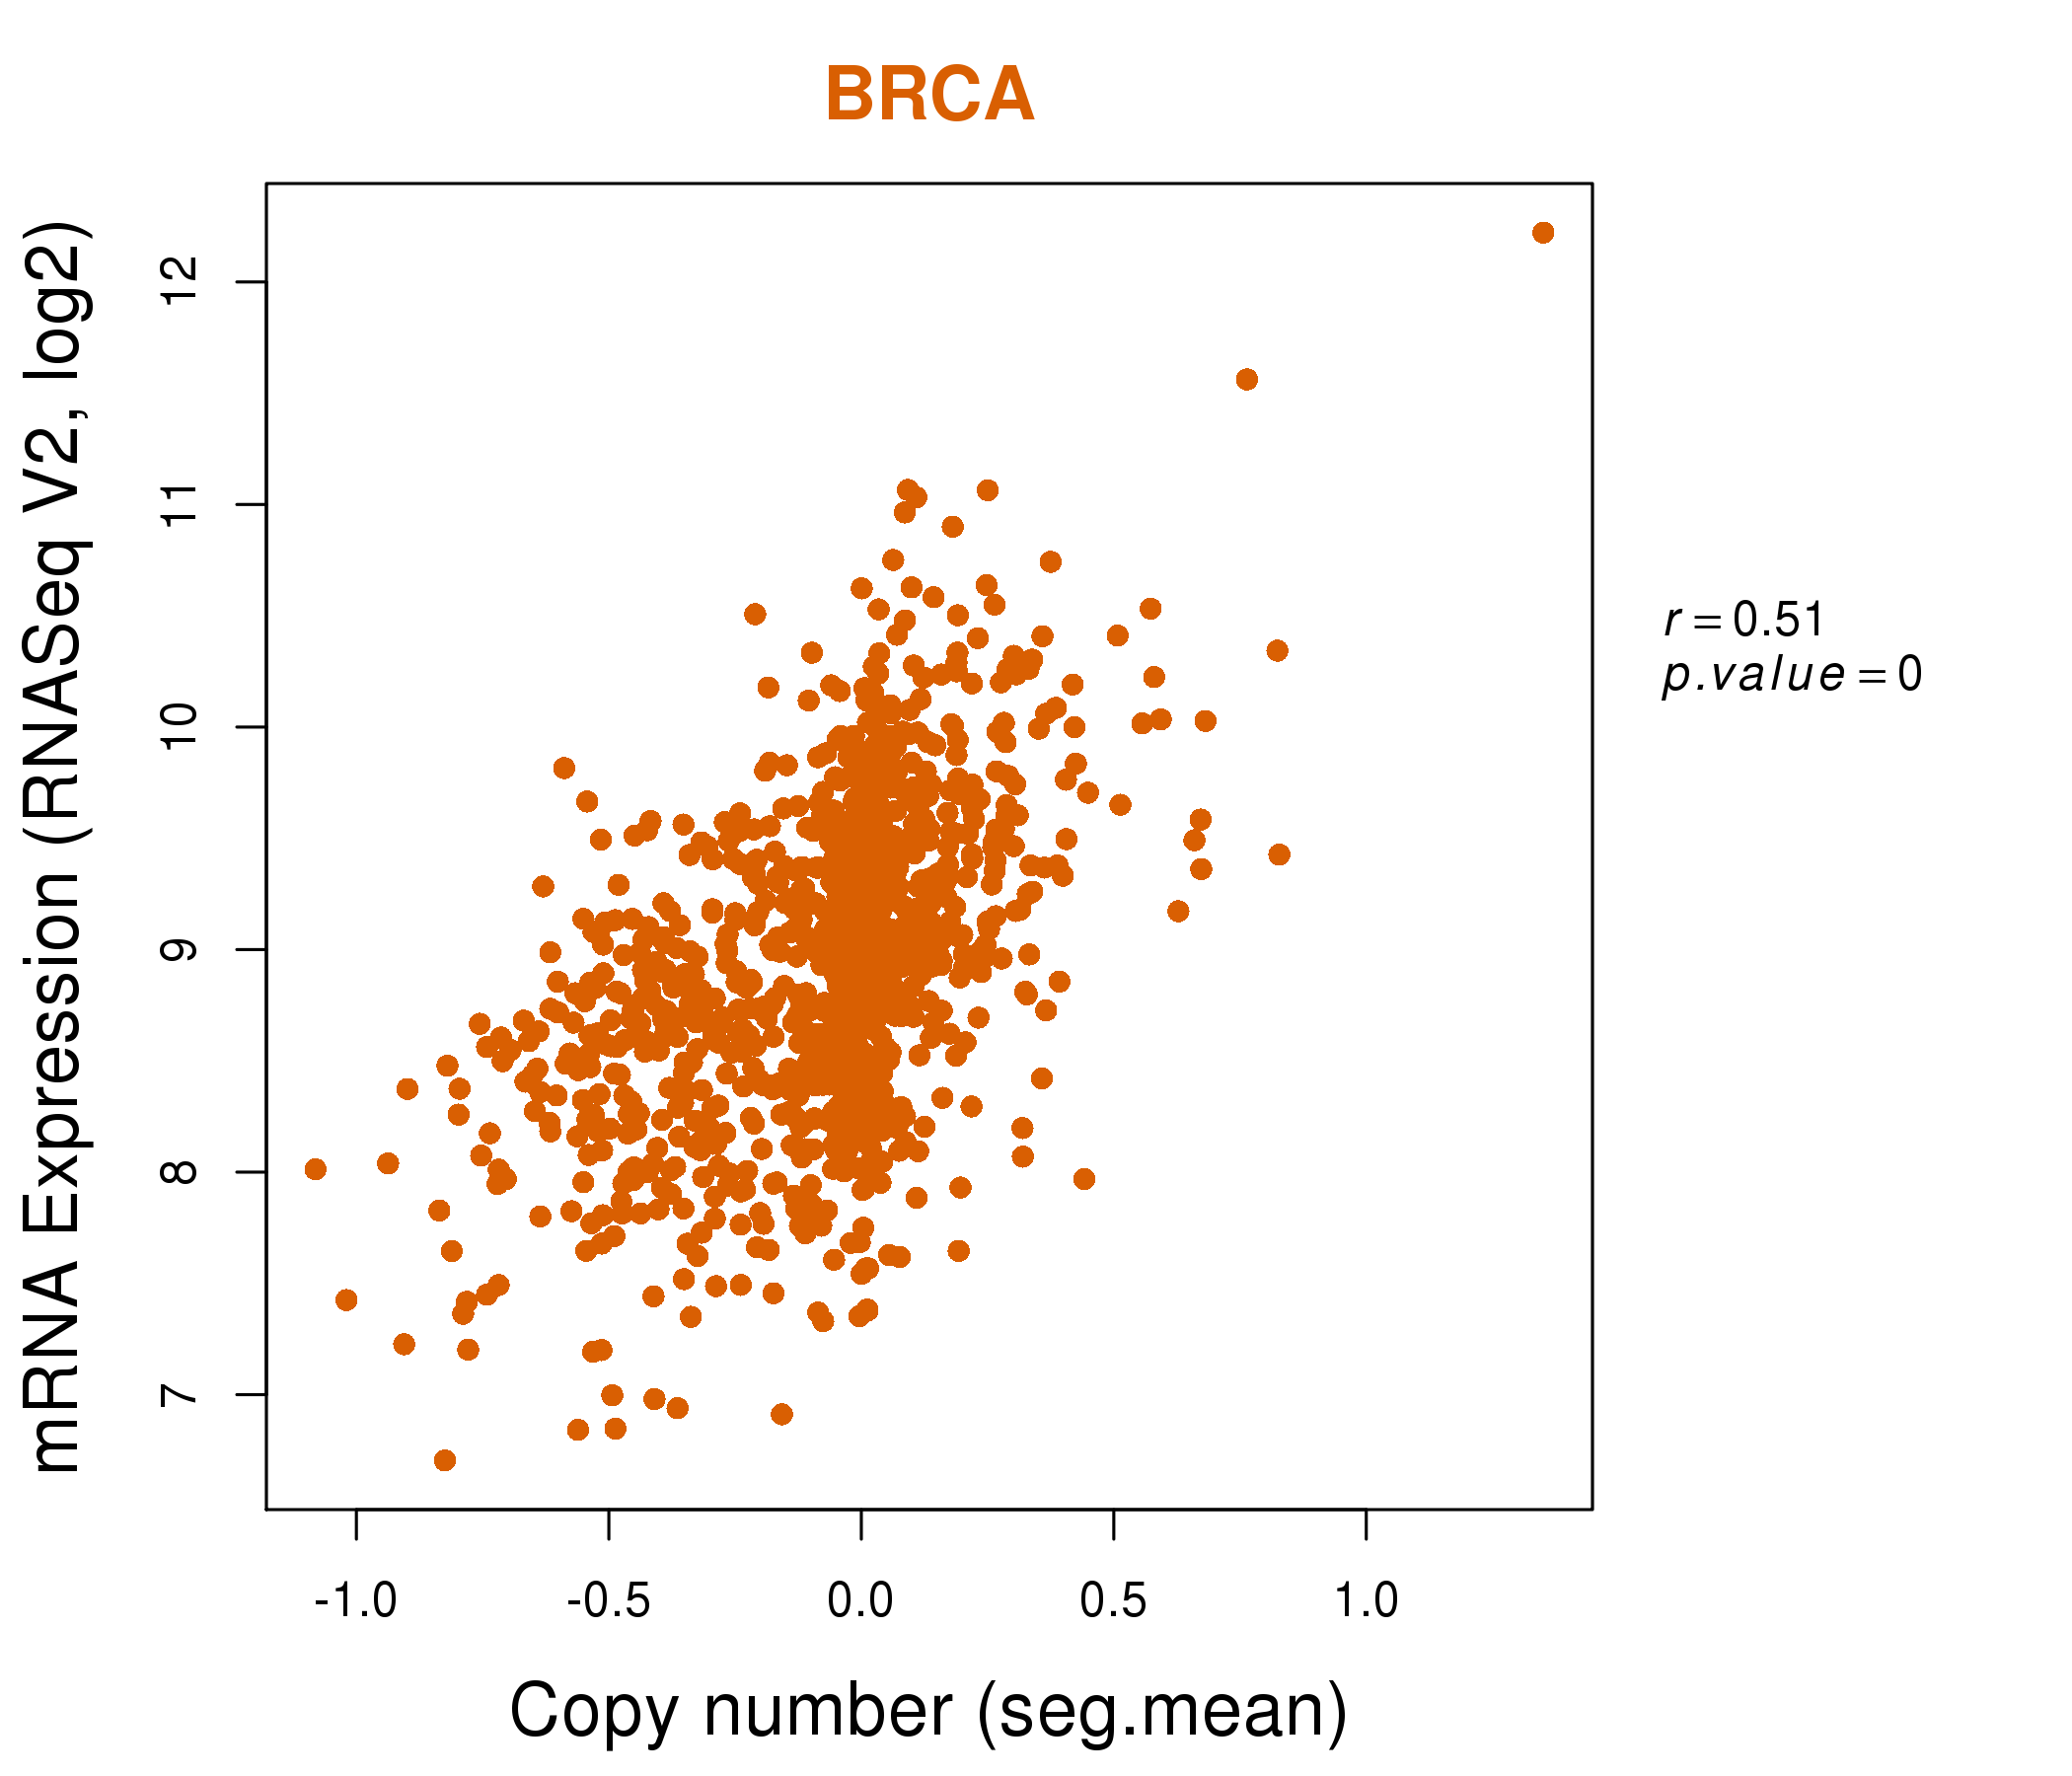
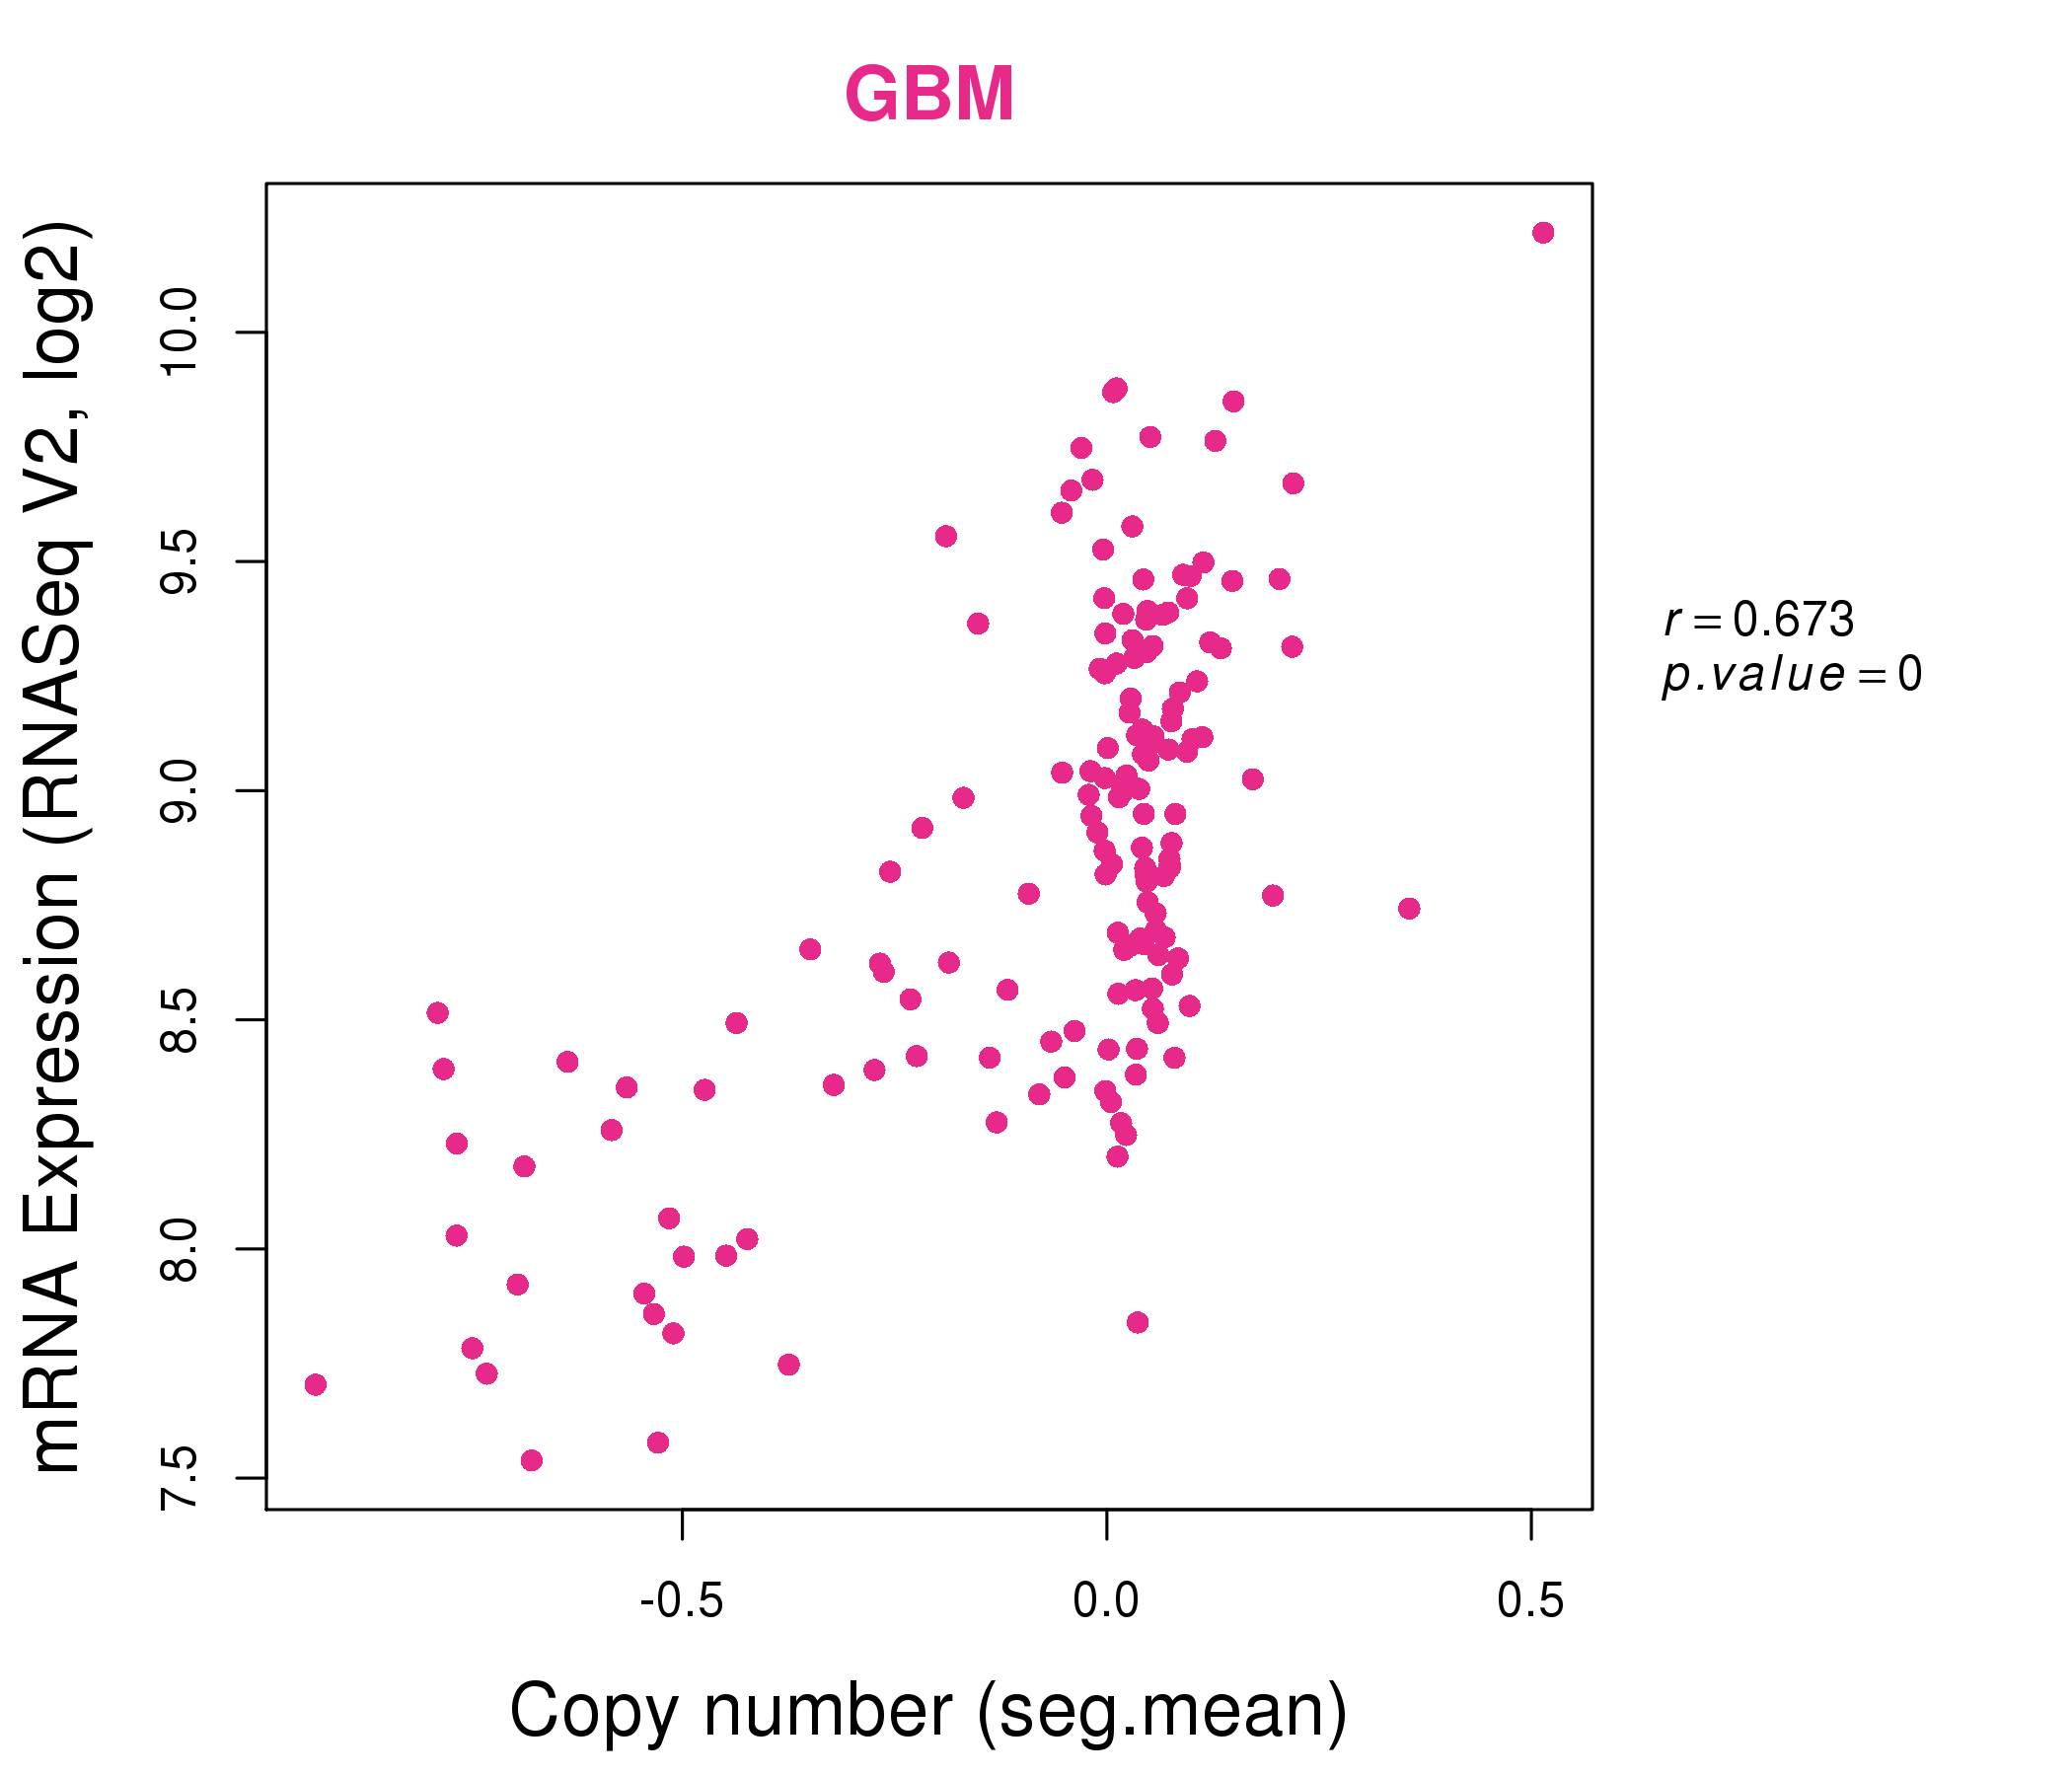
| * Copy number data were extracted from TCGA using R package TCGA-Assembler. The URLs of all public data files on TCGA DCC data server were gathered on Jan-05-2015. Function ProcessCNAData in TCGA-Assembler package was used to obtain gene-level copy number value which is calculated as the average copy number of the genomic region of a gene. |
 |
| cf) Tissue ID[Tissue type]: BLCA[Bladder Urothelial Carcinoma], BRCA[Breast invasive carcinoma], CESC[Cervical squamous cell carcinoma and endocervical adenocarcinoma], COAD[Colon adenocarcinoma], GBM[Glioblastoma multiforme], Glioma Low Grade, HNSC[Head and Neck squamous cell carcinoma], KICH[Kidney Chromophobe], KIRC[Kidney renal clear cell carcinoma], KIRP[Kidney renal papillary cell carcinoma], LAML[Acute Myeloid Leukemia], LUAD[Lung adenocarcinoma], LUSC[Lung squamous cell carcinoma], OV[Ovarian serous cystadenocarcinoma ], PAAD[Pancreatic adenocarcinoma], PRAD[Prostate adenocarcinoma], SKCM[Skin Cutaneous Melanoma], STAD[Stomach adenocarcinoma], THCA[Thyroid carcinoma], UCEC[Uterine Corpus Endometrial Carcinoma] |
| Top |
| Gene Expression for PGM3 |
| * CCLE gene expression data were extracted from CCLE_Expression_Entrez_2012-10-18.res: Gene-centric RMA-normalized mRNA expression data. |
 |
| * Normalized gene expression data of RNASeqV2 was extracted from TCGA using R package TCGA-Assembler. The URLs of all public data files on TCGA DCC data server were gathered at Jan-05-2015. Only eight cancer types have enough normal control samples for differential expression analysis. (t test, adjusted p<0.05 (using Benjamini-Hochberg FDR)) |
 |
| Top |
| * This plots show the correlation between CNV and gene expression. |
: Open all plots for all cancer types
 |
|
 |
|
| Top |
| Gene-Gene Network Information |
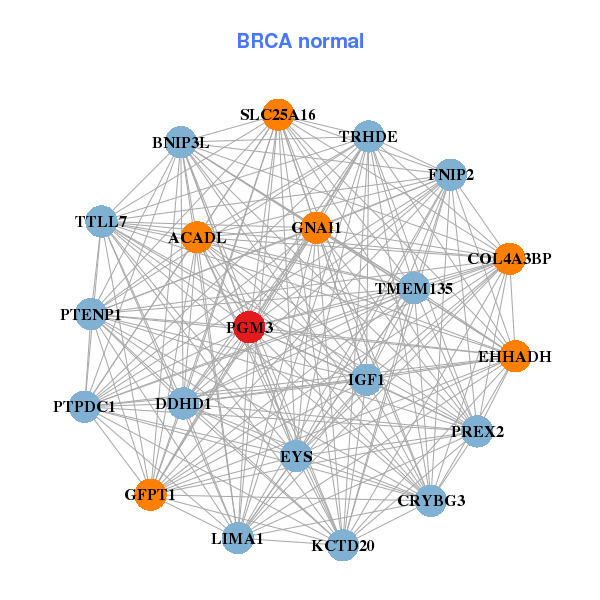
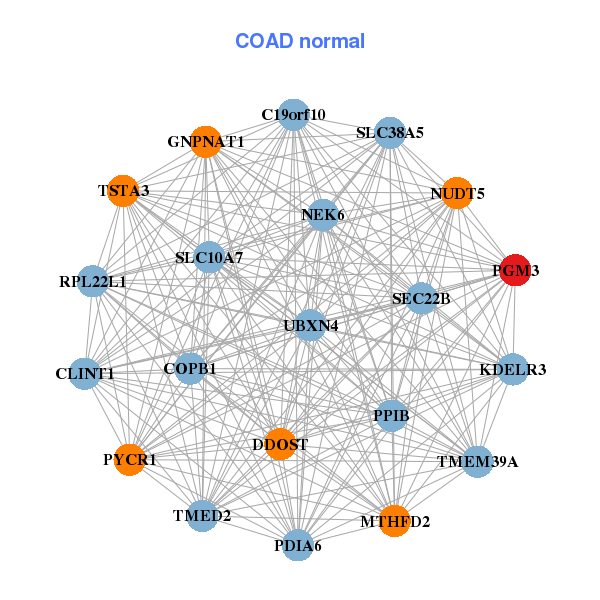
| * Co-Expression network figures were drawn using R package igraph. Only the top 20 genes with the highest correlations were shown. Red circle: input gene, orange circle: cell metabolism gene, sky circle: other gene |
: Open all plots for all cancer types
 |
|
| ACBD3,ARCN1,ASCC3,CCNC,COPB2,DOPEY1,EIF2AK3, FUCA2,HCCS,IBTK,UFL1,ME1,PGM3,PHACTR2, PIGA,RARS2,RNGTT,RWDD2A,SEC24A,SNX14,SYNCRIP | ACADL,BNIP3L,COL4A3BP,CRYBG3,DDHD1,EHHADH,EYS, FNIP2,GFPT1,GNAI1,IGF1,KCTD20,LIMA1,PGM3, PREX2,PTENP1,PTPDC1,SLC25A16,TMEM135,TRHDE,TTLL7 |
 |
|
| AGR2,ARCN1,ARF4,TMEM263,SLC18B1,COPB2,FAM46A, GSTTP2,HSPA5,IBTK,KDELR3,NUCB2,NUS1,PGM3, RWDD2A,SEC24D,SLC30A7,SLC31A1,SLC39A7,SSR1,SSR3 | C19orf10,CLINT1,COPB1,DDOST,GNPNAT1,KDELR3,MTHFD2, NEK6,NUDT5,PDIA6,PGM3,PPIB,PYCR1,RPL22L1, SEC22B,SLC10A7,SLC38A5,TMED2,TMEM39A,TSTA3,UBXN4 |
| * Co-Expression network figures were drawn using R package igraph. Only the top 20 genes with the highest correlations were shown. Red circle: input gene, orange circle: cell metabolism gene, sky circle: other gene |
: Open all plots for all cancer types
| Top |
: Open all interacting genes' information including KEGG pathway for all interacting genes from DAVID
| Top |
| Pharmacological Information for PGM3 |
| There's no related Drug. |
| Top |
| Cross referenced IDs for PGM3 |
| * We obtained these cross-references from Uniprot database. It covers 150 different DBs, 18 categories. http://www.uniprot.org/help/cross_references_section |
: Open all cross reference information
|
Copyright © 2016-Present - The Univsersity of Texas Health Science Center at Houston @ |