|
|||||||||||||||||||||||||||||||||||||||||||||||||||||||||||||||||||||||||||||||||||||||||||||||||||||||||||||||||||||||||||||||||||||||||||||||||||||||||||||||||||||||||||||||||||||||||||||||||||||||||||||||||||||||||||||||||||||||||||||||||||||||||||||||||||||||||||||||||||||||||||||||||||||||||||||||||||||||||||||||||||||||||||||||||||||||||
| |
| Phenotypic Information (metabolism pathway, cancer, disease, phenome) |
| |
| |
| Gene-Gene Network Information: Co-Expression Network, Interacting Genes & KEGG |
| |
|


| Gene Summary for ABCB4 |
| Basic gene info. | Gene symbol | ABCB4 |
| Gene name | ATP-binding cassette, sub-family B (MDR/TAP), member 4 | |
| Synonyms | ABC21|GBD1|ICP3|MDR2|MDR2/3|MDR3|PFIC-3|PGY3 | |
| Cytomap | UCSC genome browser: 7q21.1 | |
| Genomic location | chr7 :87031360-87105019 | |
| Type of gene | protein-coding | |
| RefGenes | NM_000443.3, NM_018849.2,NM_018850.2, | |
| Ensembl id | ENSG00000005471 | |
| Description | ATP-binding cassette sub-family B member 4P glycoprotein 3/multiple drug resistance 3P-glycoprotein 3P-glycoprotein-3/multiple drug resistance-3multidrug resistance protein 3multiple drug resistance 3 | |
| Modification date | 20141207 | |
| dbXrefs | MIM : 171060 | |
| HGNC : HGNC | ||
| Ensembl : ENSG00000005471 | ||
| HPRD : 01371 | ||
| Vega : OTTHUMG00000023396 | ||
| Protein | UniProt: go to UniProt's Cross Reference DB Table | |
| Expression | CleanEX: HS_ABCB4 | |
| BioGPS: 5244 | ||
| Gene Expression Atlas: ENSG00000005471 | ||
| The Human Protein Atlas: ENSG00000005471 | ||
| Pathway | NCI Pathway Interaction Database: ABCB4 | |
| KEGG: ABCB4 | ||
| REACTOME: ABCB4 | ||
| ConsensusPathDB | ||
| Pathway Commons: ABCB4 | ||
| Metabolism | MetaCyc: ABCB4 | |
| HUMANCyc: ABCB4 | ||
| Regulation | Ensembl's Regulation: ENSG00000005471 | |
| miRBase: chr7 :87,031,360-87,105,019 | ||
| TargetScan: NM_000443 | ||
| cisRED: ENSG00000005471 | ||
| Context | iHOP: ABCB4 | |
| cancer metabolism search in PubMed: ABCB4 | ||
| UCL Cancer Institute: ABCB4 | ||
| Assigned class in ccmGDB | C | |
| Top |
| Phenotypic Information for ABCB4(metabolism pathway, cancer, disease, phenome) |
| Cancer | CGAP: ABCB4 |
| Familial Cancer Database: ABCB4 | |
| * This gene is included in those cancer gene databases. |
|
|
|
|
|
| . | |||||||||||||||||||||||||||||||||||||||||||||||||||||||||||||||||||||||||||||||||||||||||||||||||||||||||||||||||||||||||||||||||||||||||||||||||||||||||||||||||||||||||||||||||||||||||||||||||||||||||||||||||||||||||||||||||||||||||||||||||||||||||||||||||||||||||||||||||||||||||||||||||||||||||||||||||||||||||||||||||||||||||||||||||||
Oncogene 1 | Significant driver gene in | ||||||||||||||||||||||||||||||||||||||||||||||||||||||||||||||||||||||||||||||||||||||||||||||||||||||||||||||||||||||||||||||||||||||||||||||||||||||||||||||||||||||||||||||||||||||||||||||||||||||||||||||||||||||||||||||||||||||||||||||||||||||||||||||||||||||||||||||||||||||||||||||||||||||||||||||||||||||||||||||||||||||||||||||||||||||||
| cf) number; DB name 1 Oncogene; http://nar.oxfordjournals.org/content/35/suppl_1/D721.long, 2 Tumor Suppressor gene; https://bioinfo.uth.edu/TSGene/, 3 Cancer Gene Census; http://www.nature.com/nrc/journal/v4/n3/abs/nrc1299.html, 4 CancerGenes; http://nar.oxfordjournals.org/content/35/suppl_1/D721.long, 5 Network of Cancer Gene; http://ncg.kcl.ac.uk/index.php, 1Therapeutic Vulnerabilities in Cancer; http://cbio.mskcc.org/cancergenomics/statius/ |
| REACTOME_METABOLISM_OF_LIPIDS_AND_LIPOPROTEINS | |
| OMIM | |
| Orphanet | |
| Disease | KEGG Disease: ABCB4 |
| MedGen: ABCB4 (Human Medical Genetics with Condition) | |
| ClinVar: ABCB4 | |
| Phenotype | MGI: ABCB4 (International Mouse Phenotyping Consortium) |
| PhenomicDB: ABCB4 | |
| Mutations for ABCB4 |
| * Under tables are showing count per each tissue to give us broad intuition about tissue specific mutation patterns.You can go to the detailed page for each mutation database's web site. |
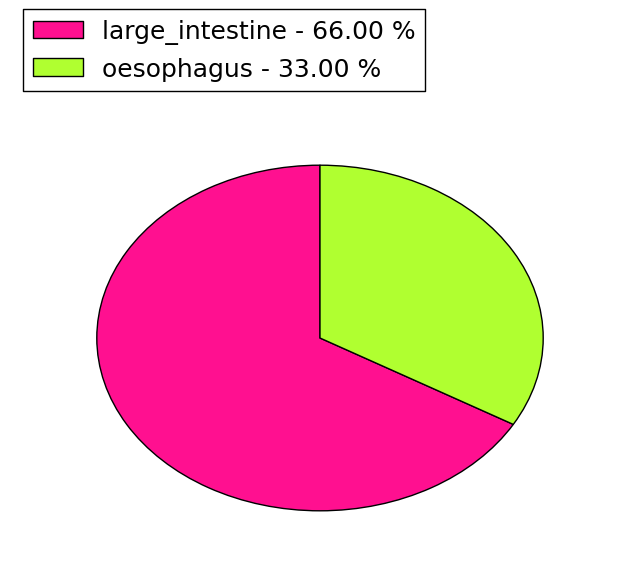
| - Statistics for Tissue and Mutation type | Top |
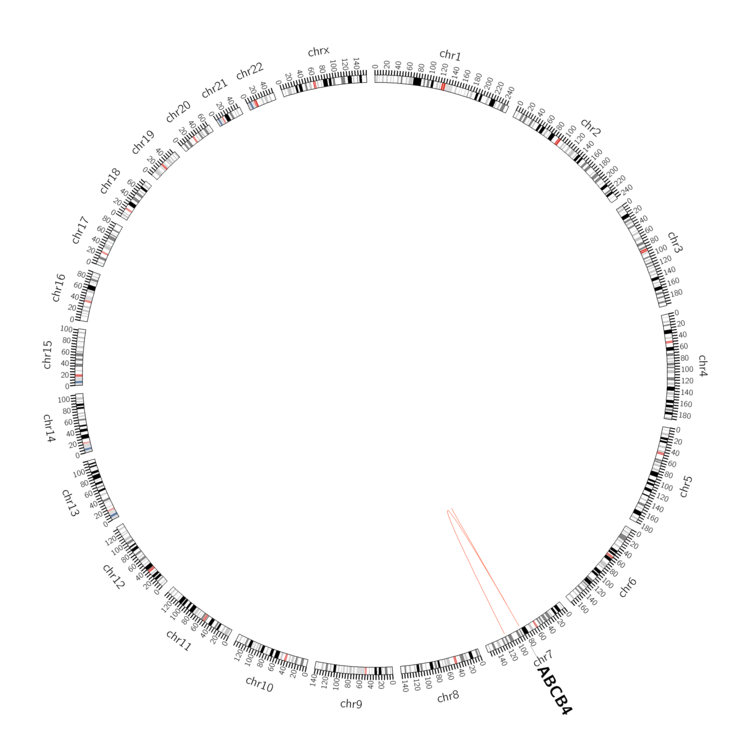 |
| - For Inter-chromosomal Variations |
| There's no inter-chromosomal structural variation. |
| - For Intra-chromosomal Variations |
| * Intra-chromosomal variantions includes 'intrachromosomal amplicon to amplicon', 'intrachromosomal amplicon to non-amplified dna', 'intrachromosomal deletion', 'intrachromosomal fold-back inversion', 'intrachromosomal inversion', 'intrachromosomal tandem duplication', 'Intrachromosomal unknown type', 'intrachromosomal with inverted orientation', 'intrachromosomal with non-inverted orientation'. |
 |
| Sample | Symbol_a | Chr_a | Start_a | End_a | Symbol_b | Chr_b | Start_b | End_b |
| ovary | ABCB4 | chr7 | 87058907 | 87058927 | chr7 | 118123599 | 118123619 | |
| pancreas | ABCB4 | chr7 | 87086664 | 87086684 | ABCB4 | chr7 | 87089933 | 87089953 |
| cf) Tissue number; Tissue name (1;Breast, 2;Central_nervous_system, 3;Haematopoietic_and_lymphoid_tissue, 4;Large_intestine, 5;Liver, 6;Lung, 7;Ovary, 8;Pancreas, 9;Prostate, 10;Skin, 11;Soft_tissue, 12;Upper_aerodigestive_tract) |
| * From mRNA Sanger sequences, Chitars2.0 arranged chimeric transcripts. This table shows ABCB4 related fusion information. |
| ID | Head Gene | Tail Gene | Accession | Gene_a | qStart_a | qEnd_a | Chromosome_a | tStart_a | tEnd_a | Gene_a | qStart_a | qEnd_a | Chromosome_a | tStart_a | tEnd_a |
| Top |
| Mutation type/ Tissue ID | brca | cns | cerv | endome | haematopo | kidn | Lintest | liver | lung | ns | ovary | pancre | prost | skin | stoma | thyro | urina | |||
| Total # sample | 1 | 1 | 1 | 1 | ||||||||||||||||
| GAIN (# sample) | 1 | 1 | 1 | 1 | ||||||||||||||||
| LOSS (# sample) |
| cf) Tissue ID; Tissue type (1; Breast, 2; Central_nervous_system, 3; Cervix, 4; Endometrium, 5; Haematopoietic_and_lymphoid_tissue, 6; Kidney, 7; Large_intestine, 8; Liver, 9; Lung, 10; NS, 11; Ovary, 12; Pancreas, 13; Prostate, 14; Skin, 15; Stomach, 16; Thyroid, 17; Urinary_tract) |
| Top |
|
 |
| Top |
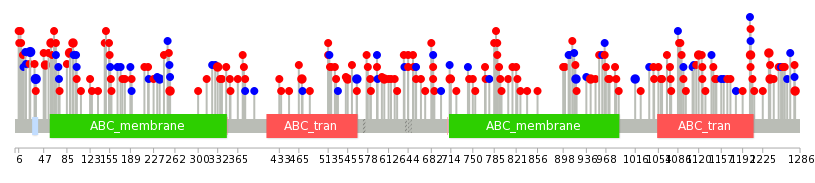
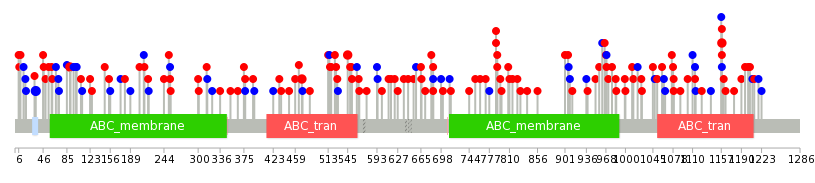
| Stat. for Non-Synonymous SNVs (# total SNVs=159) | (# total SNVs=45) |
 |  |
(# total SNVs=12) | (# total SNVs=3) |
 |  |
| Top |
| * When you move the cursor on each content, you can see more deailed mutation information on the Tooltip. Those are primary_site,primary_histology,mutation(aa),pubmedID. |
| GRCh37 position | Mutation(aa) | Unique sampleID count |
| chr7:87074282-87074282 | p.S339fs*3 | 4 |
| chr7:87104707-87104707 | p.I25I | 3 |
| chr7:87092091-87092091 | p.G90E | 3 |
| chr7:87043015-87043015 | p.E901* | 3 |
| chr7:87031414-87031414 | p.*1280R | 3 |
| chr7:87101970-87101970 | p.T34T | 3 |
| chr7:87092077-87092077 | p.P95S | 2 |
| chr7:87035732-87035732 | p.I1120V | 2 |
| chr7:87092185-87092185 | p.L59V | 2 |
| chr7:87069080-87069080 | p.R545H | 2 |
| Top |
|
 |
| Point Mutation/ Tissue ID | 1 | 2 | 3 | 4 | 5 | 6 | 7 | 8 | 9 | 10 | 11 | 12 | 13 | 14 | 15 | 16 | 17 | 18 | 19 | 20 |
| # sample | 4 | 5 | 21 | 8 | 9 | 3 | 23 | 12 | 7 | 1 | 2 | 18 | 21 | 1 | 20 | |||||
| # mutation | 4 | 5 | 23 | 8 | 10 | 3 | 26 | 13 | 7 | 1 | 2 | 21 | 21 | 1 | 34 | |||||
| nonsynonymous SNV | 3 | 2 | 16 | 5 | 7 | 2 | 20 | 9 | 5 | 1 | 13 | 17 | 1 | 26 | ||||||
| synonymous SNV | 1 | 3 | 7 | 3 | 3 | 1 | 6 | 4 | 2 | 2 | 8 | 4 | 8 |
| cf) Tissue ID; Tissue type (1; BLCA[Bladder Urothelial Carcinoma], 2; BRCA[Breast invasive carcinoma], 3; CESC[Cervical squamous cell carcinoma and endocervical adenocarcinoma], 4; COAD[Colon adenocarcinoma], 5; GBM[Glioblastoma multiforme], 6; Glioma Low Grade, 7; HNSC[Head and Neck squamous cell carcinoma], 8; KICH[Kidney Chromophobe], 9; KIRC[Kidney renal clear cell carcinoma], 10; KIRP[Kidney renal papillary cell carcinoma], 11; LAML[Acute Myeloid Leukemia], 12; LUAD[Lung adenocarcinoma], 13; LUSC[Lung squamous cell carcinoma], 14; OV[Ovarian serous cystadenocarcinoma ], 15; PAAD[Pancreatic adenocarcinoma], 16; PRAD[Prostate adenocarcinoma], 17; SKCM[Skin Cutaneous Melanoma], 18:STAD[Stomach adenocarcinoma], 19:THCA[Thyroid carcinoma], 20:UCEC[Uterine Corpus Endometrial Carcinoma]) |
| Top |
| * We represented just top 10 SNVs. When you move the cursor on each content, you can see more deailed mutation information on the Tooltip. Those are primary_site, primary_histology, mutation(aa), pubmedID. |
| Genomic Position | Mutation(aa) | Unique sampleID count |
| chr7:87101970 | p.T34T,ABCB4 | 3 |
| chr7:87056076 | p.R545H,ABCB4 | 2 |
| chr7:87069080 | p.L1158P,ABCB4 | 2 |
| chr7:87069667 | p.L1158V,ABCB4 | 2 |
| chr7:87092091 | p.G90E,ABCB4 | 2 |
| chr7:87032470 | p.T685N,ABCB4 | 2 |
| chr7:87032471 | p.E470K,ABCB4 | 2 |
| chr7:87060734 | p.A254A,ABCB4 | 1 |
| chr7:87073033 | p.V906I,ABCB4 | 1 |
| chr7:87035723 | p.L123F,ABCB4 | 1 |
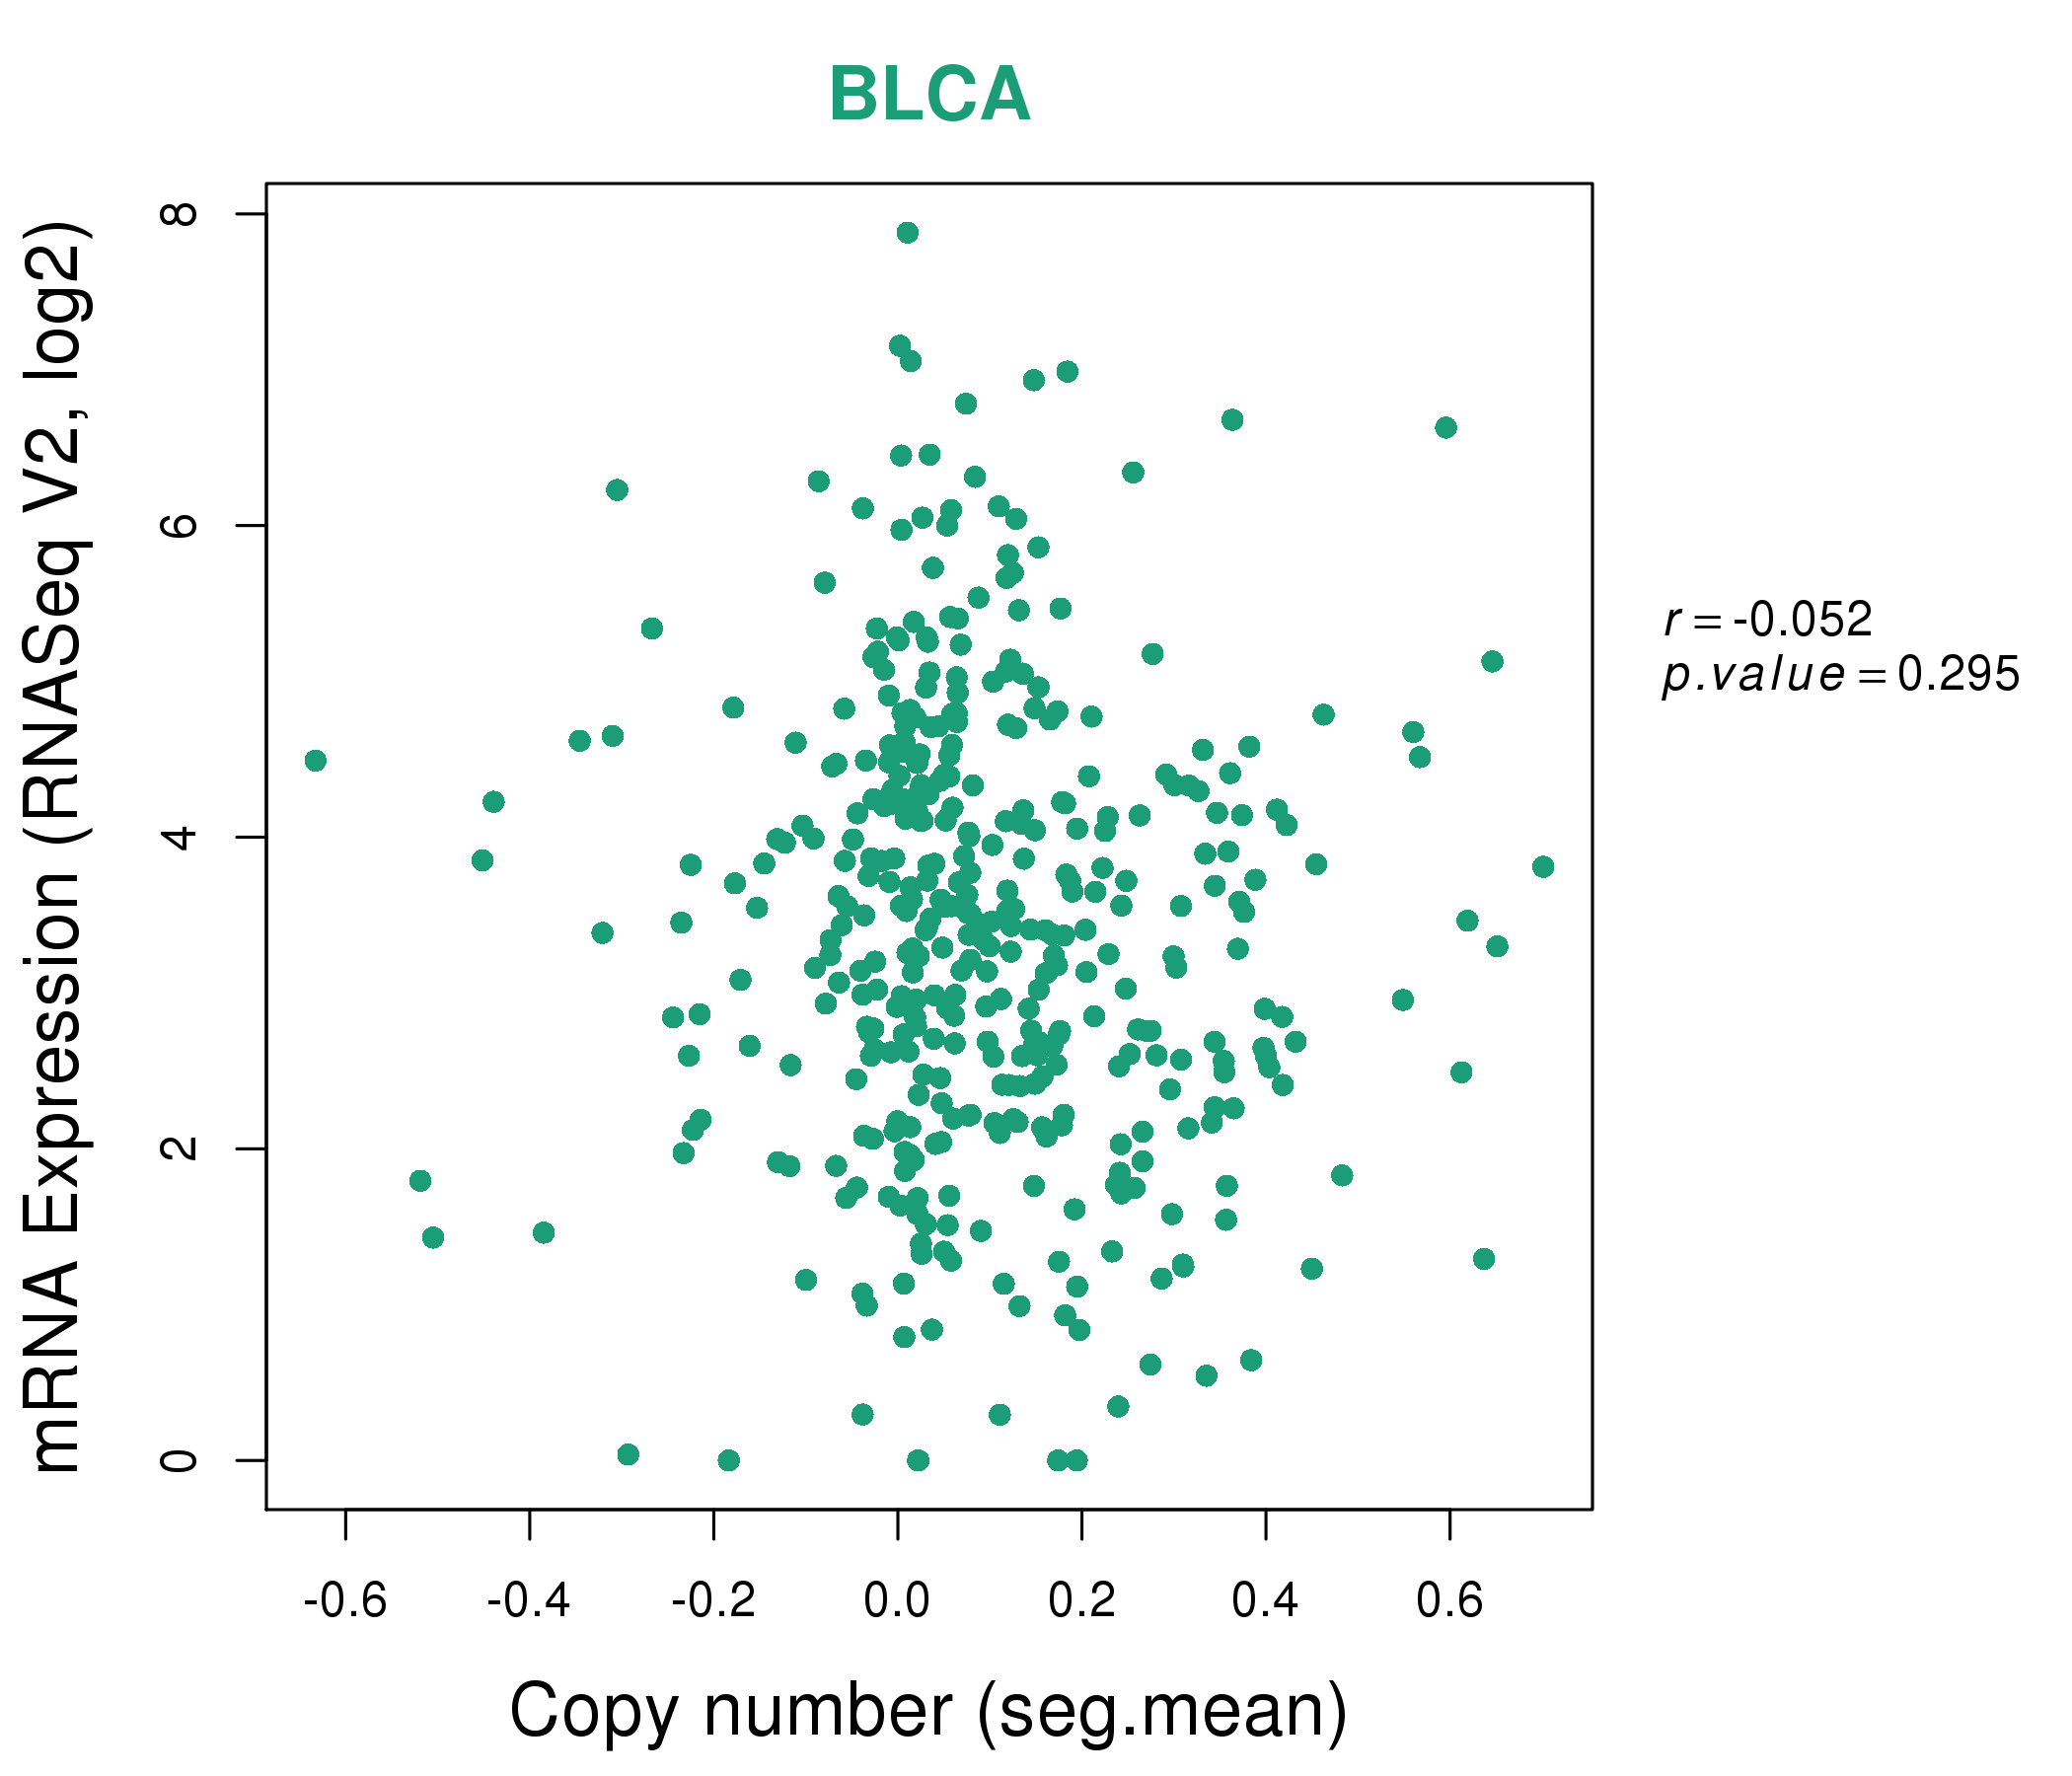
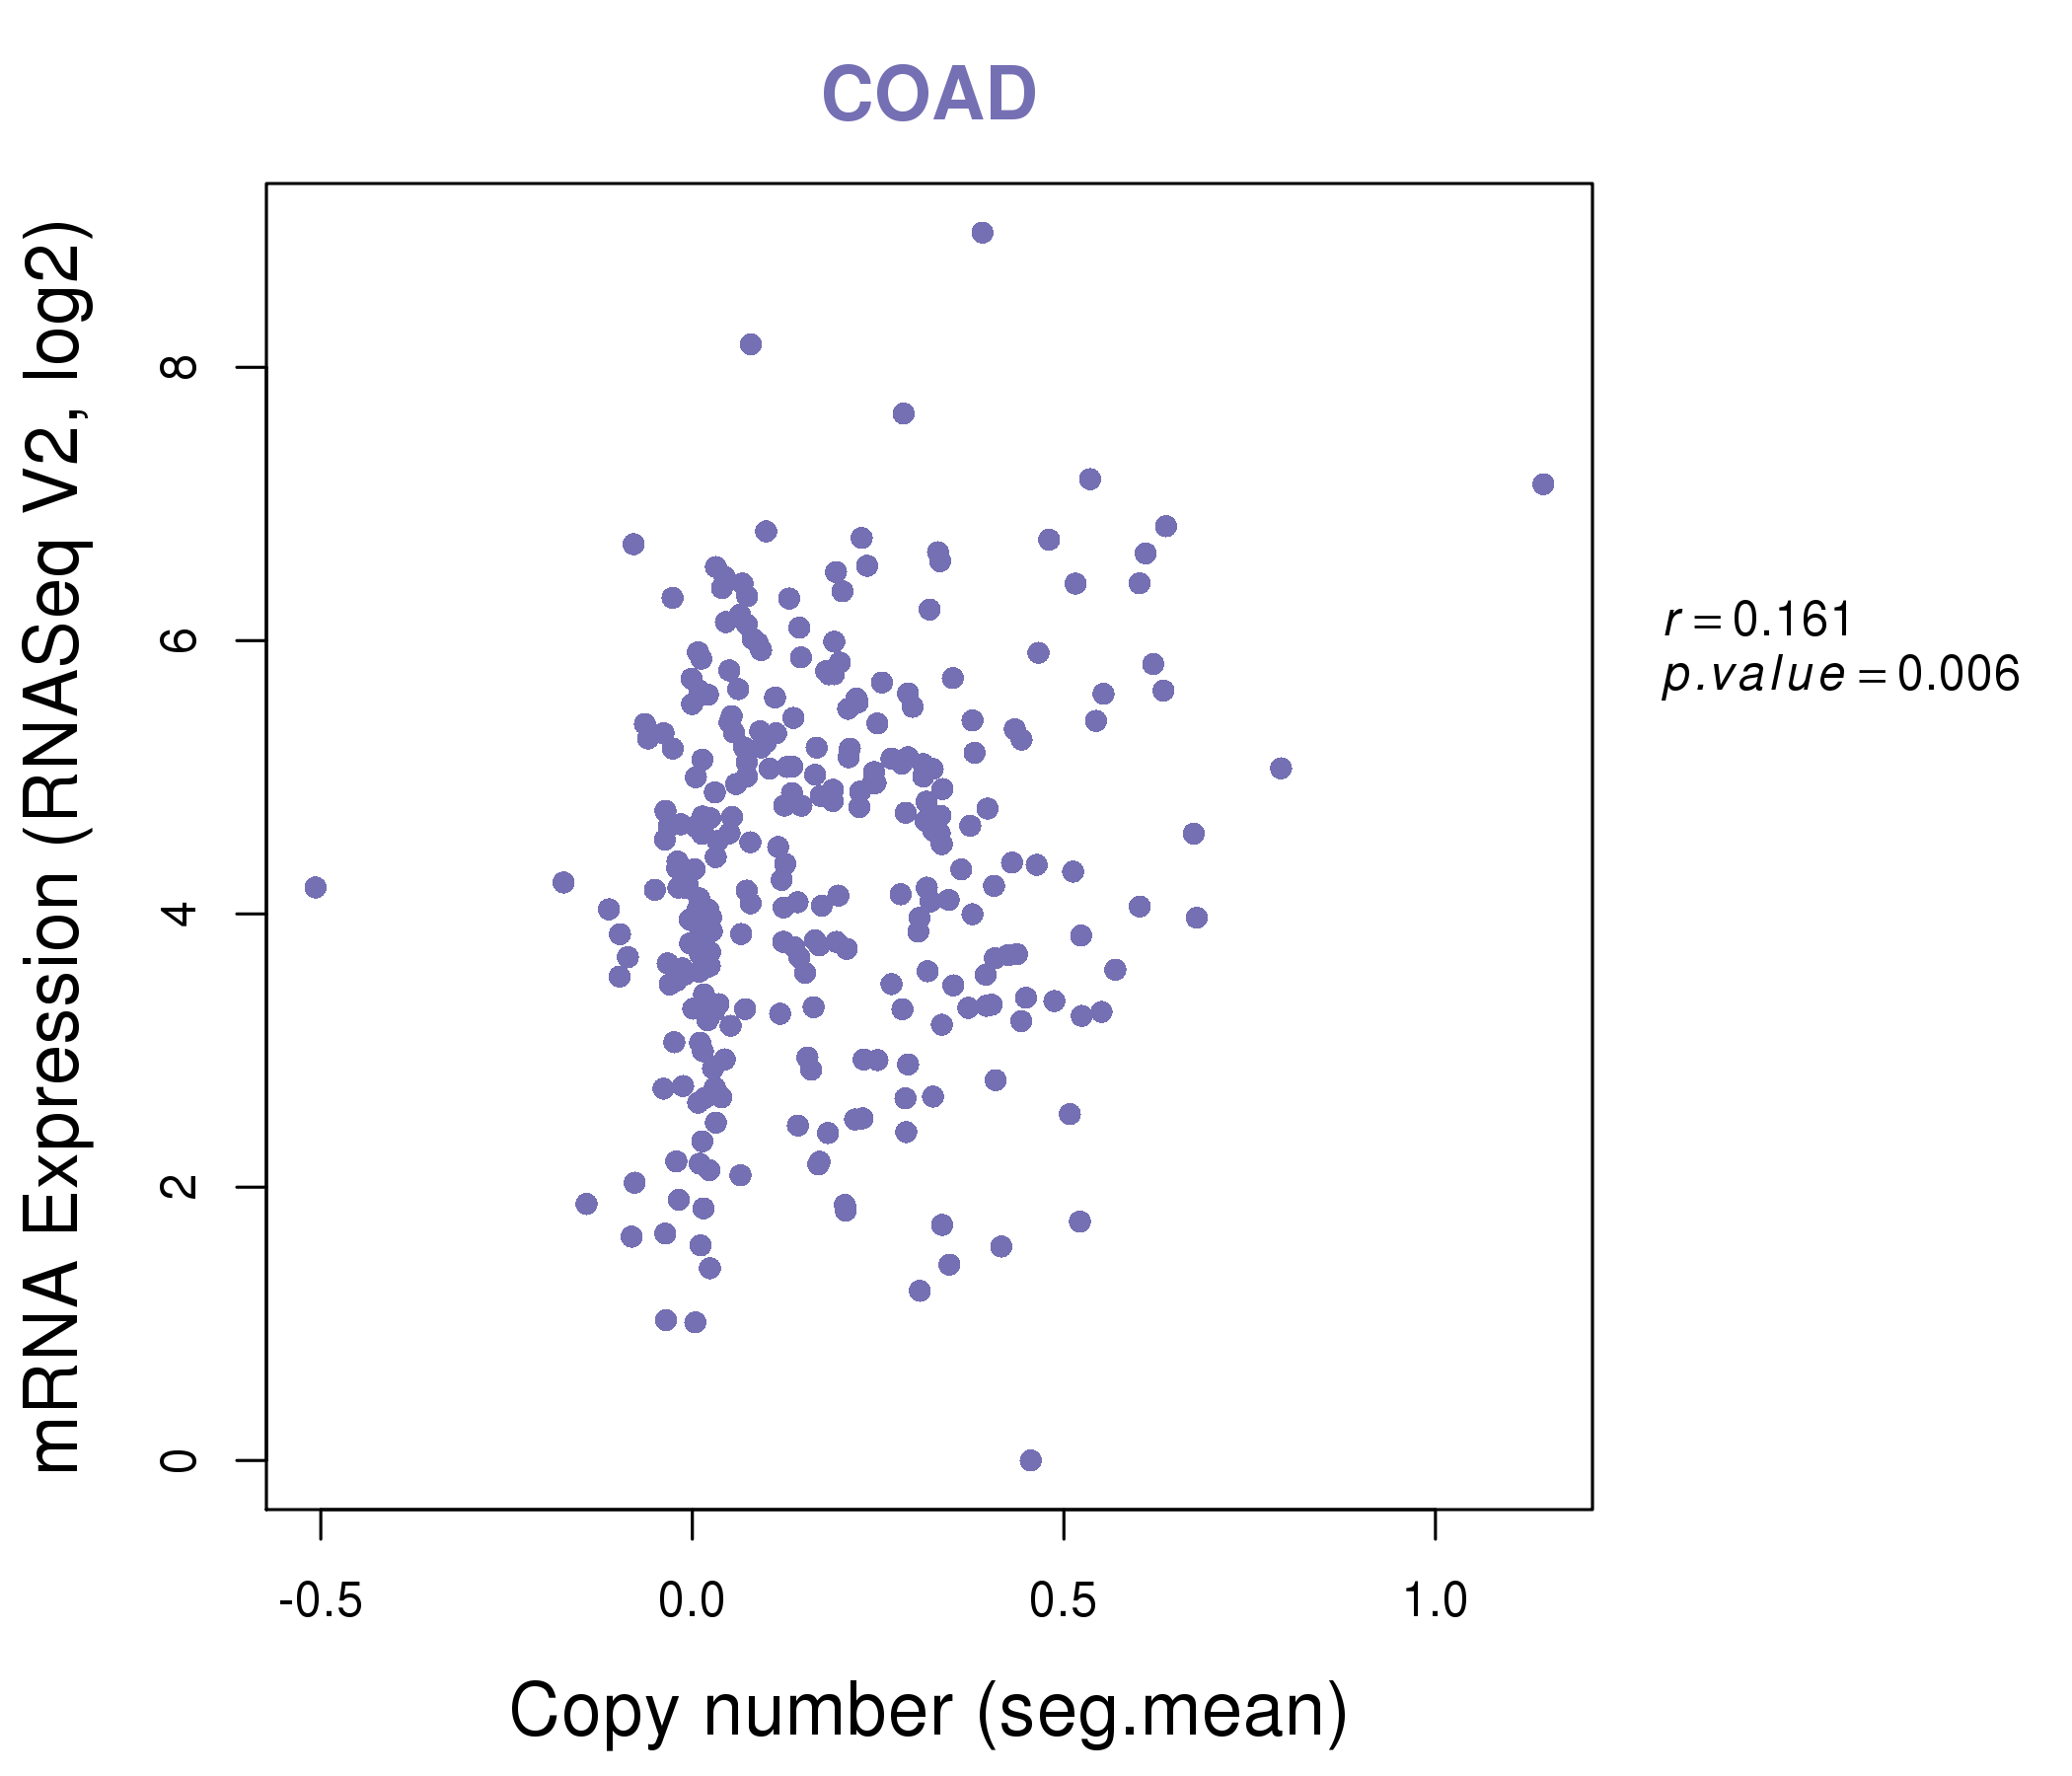
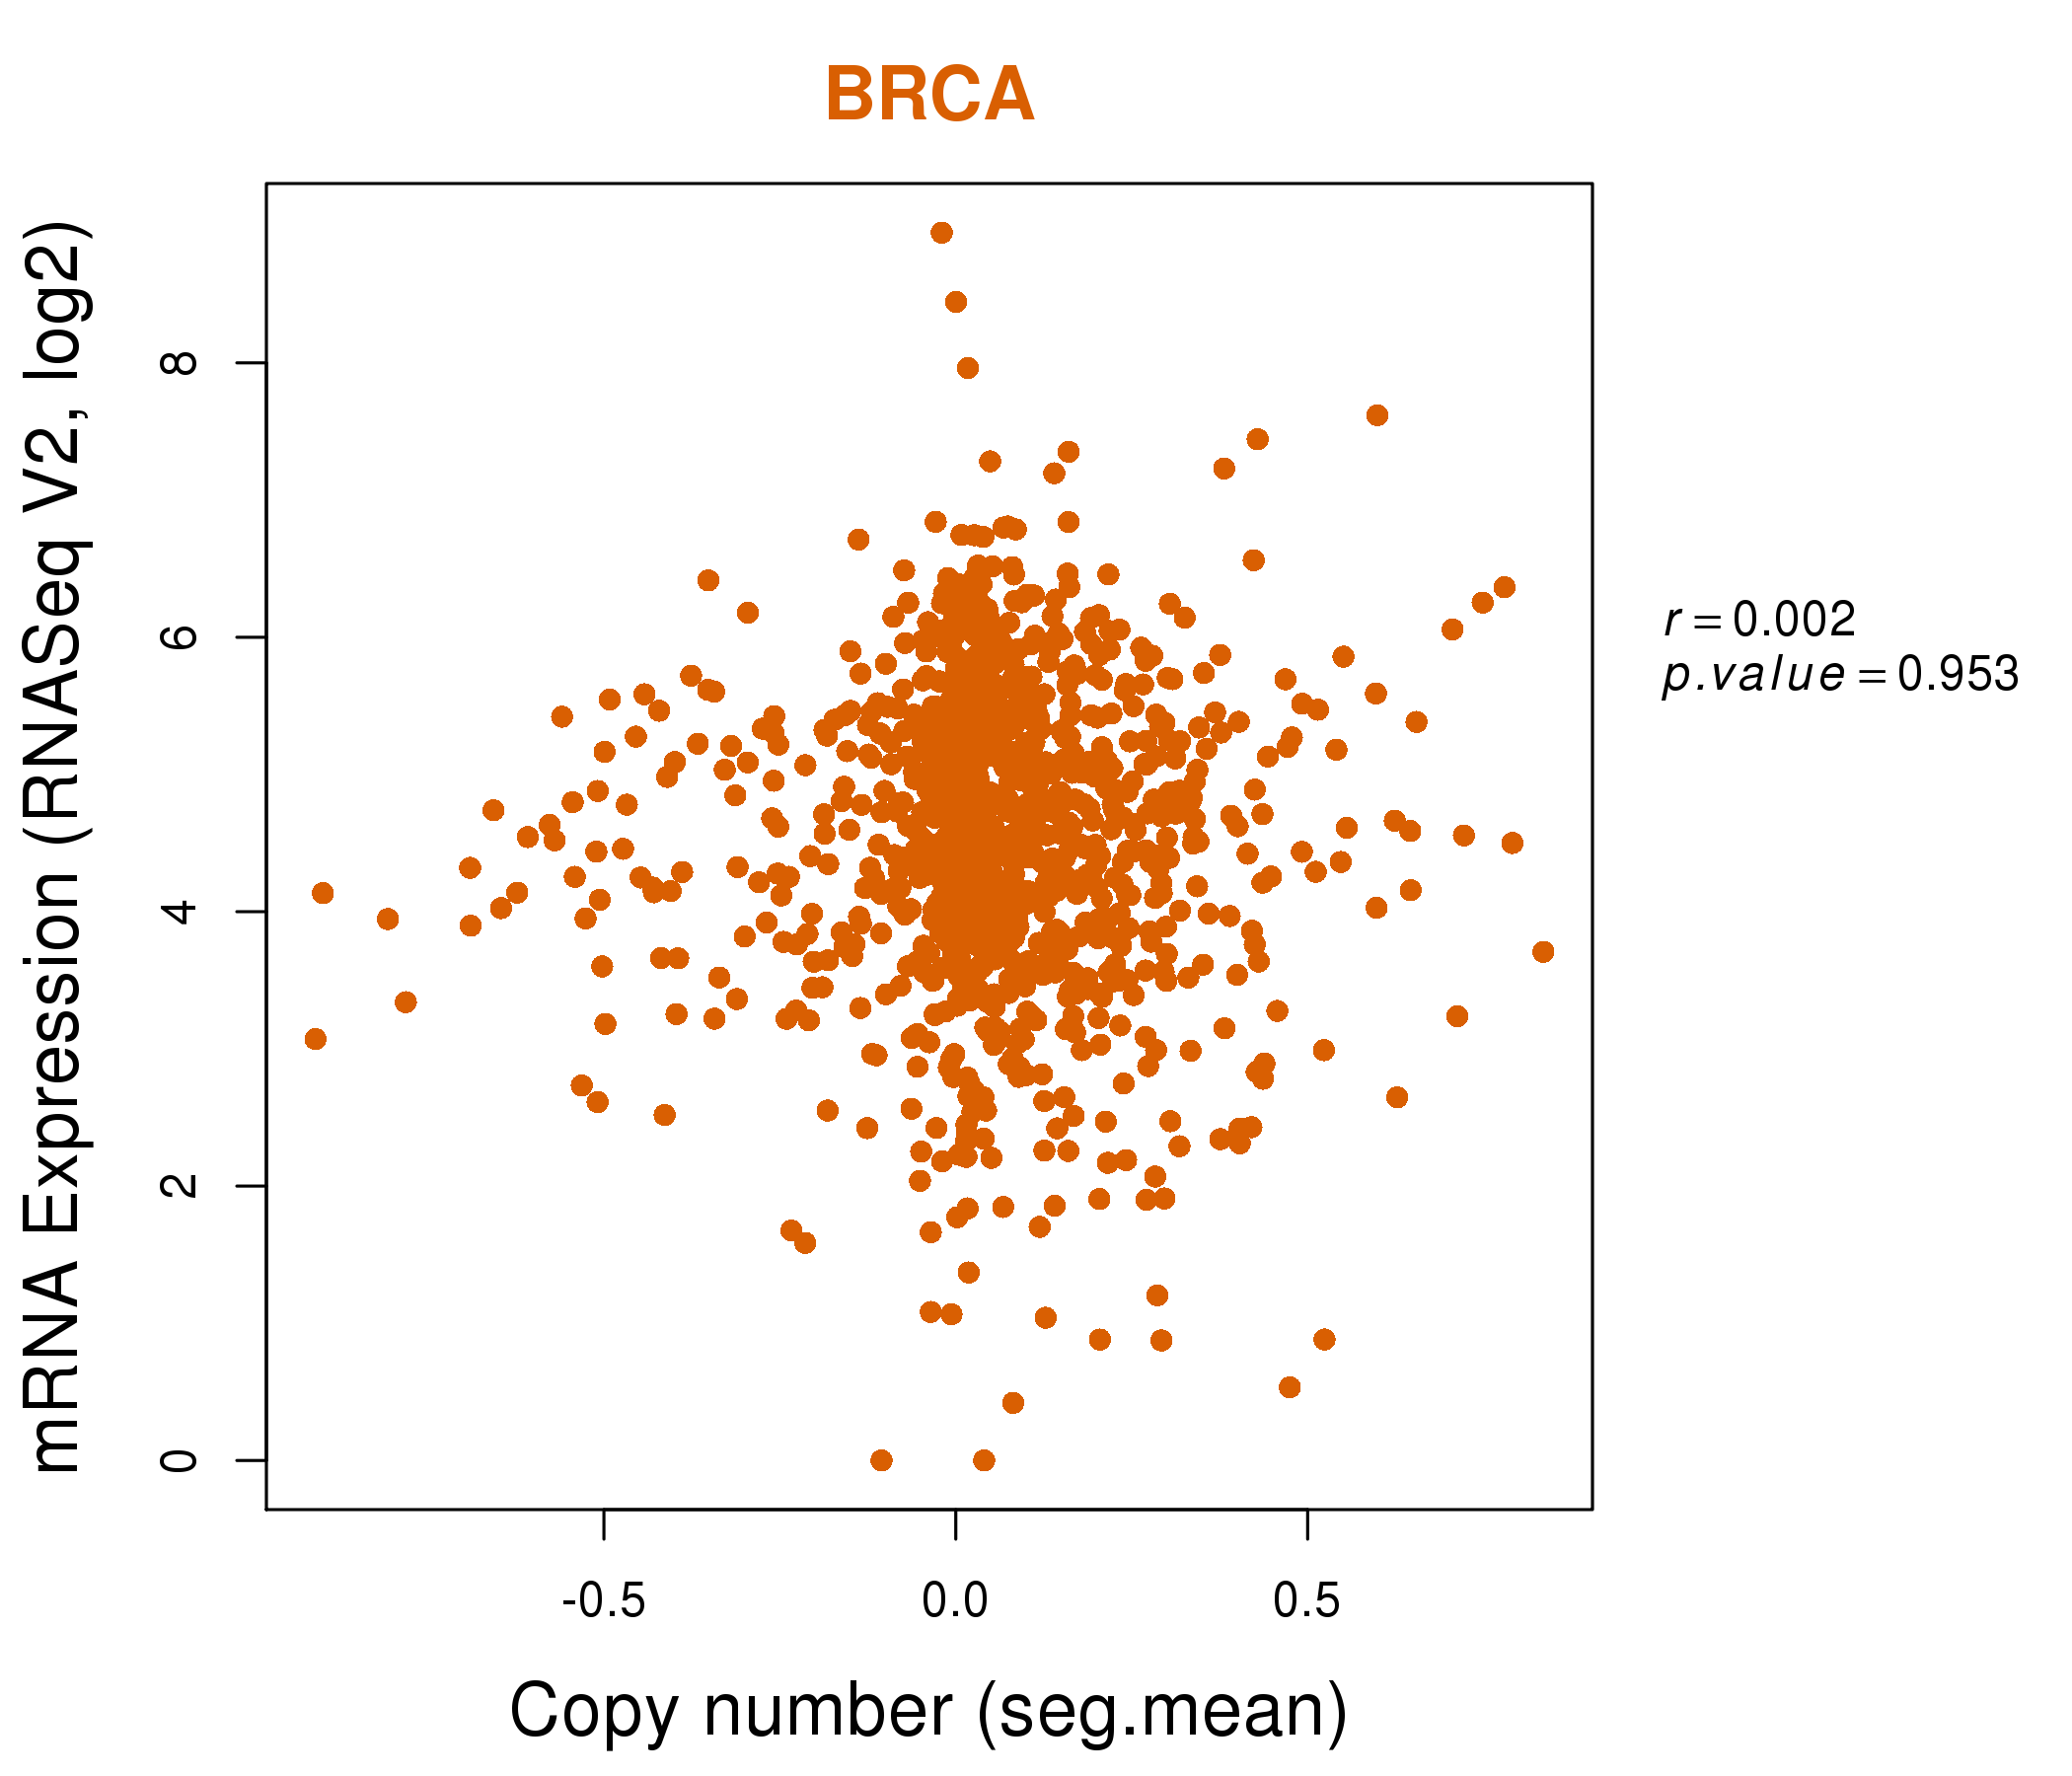
| * Copy number data were extracted from TCGA using R package TCGA-Assembler. The URLs of all public data files on TCGA DCC data server were gathered on Jan-05-2015. Function ProcessCNAData in TCGA-Assembler package was used to obtain gene-level copy number value which is calculated as the average copy number of the genomic region of a gene. |
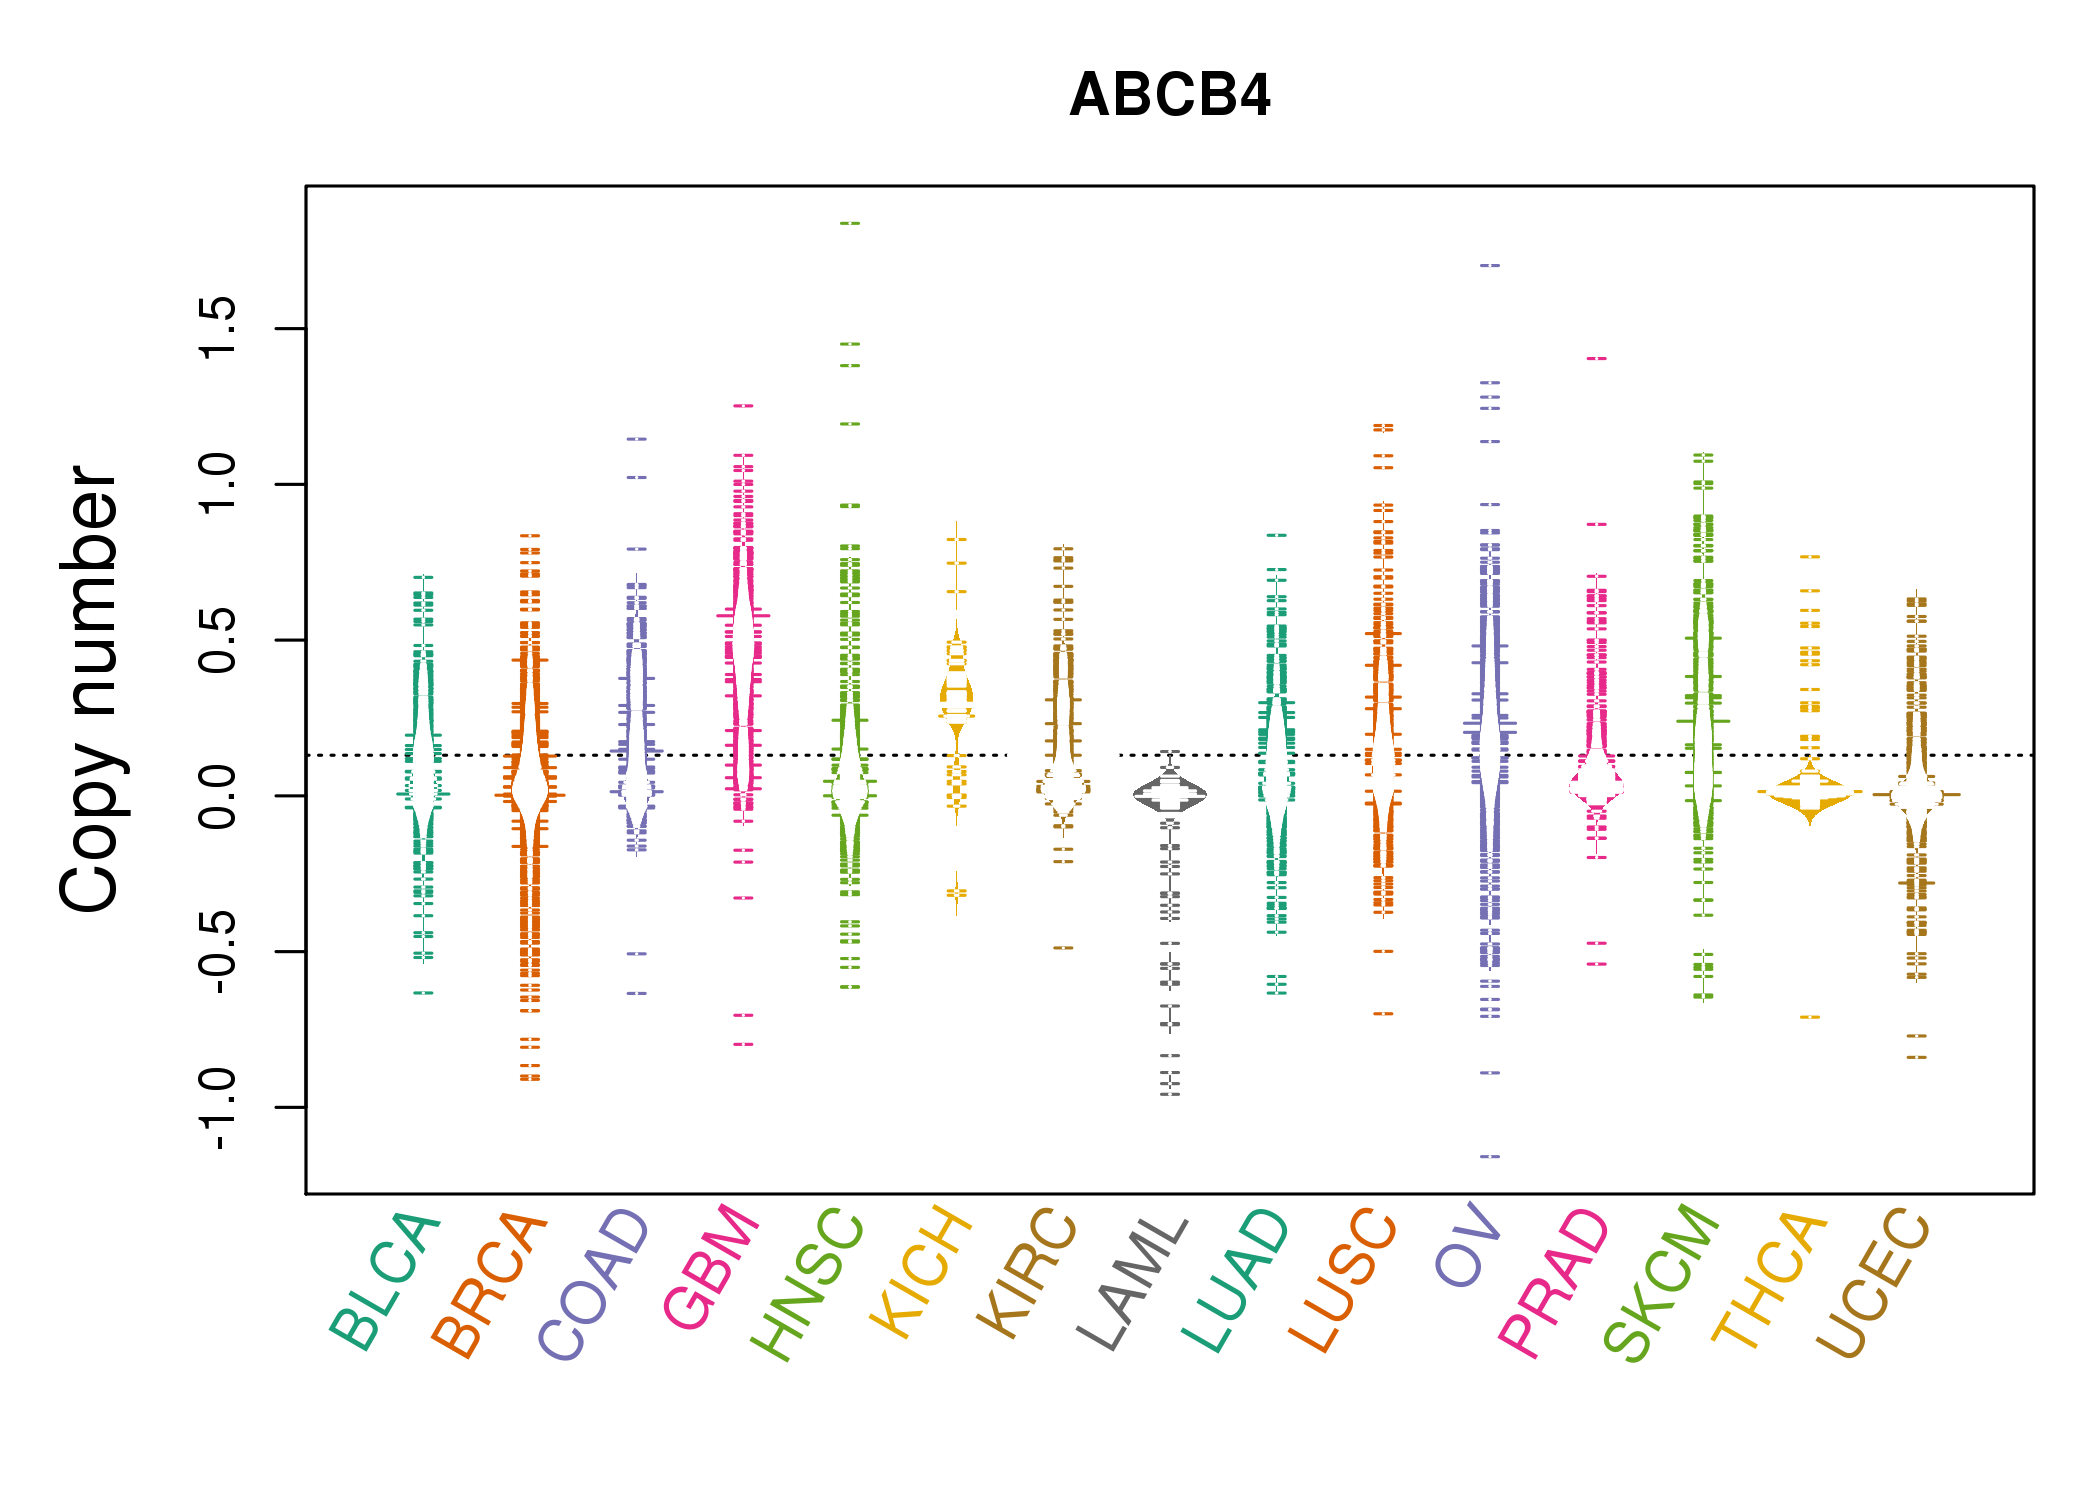 |
| cf) Tissue ID[Tissue type]: BLCA[Bladder Urothelial Carcinoma], BRCA[Breast invasive carcinoma], CESC[Cervical squamous cell carcinoma and endocervical adenocarcinoma], COAD[Colon adenocarcinoma], GBM[Glioblastoma multiforme], Glioma Low Grade, HNSC[Head and Neck squamous cell carcinoma], KICH[Kidney Chromophobe], KIRC[Kidney renal clear cell carcinoma], KIRP[Kidney renal papillary cell carcinoma], LAML[Acute Myeloid Leukemia], LUAD[Lung adenocarcinoma], LUSC[Lung squamous cell carcinoma], OV[Ovarian serous cystadenocarcinoma ], PAAD[Pancreatic adenocarcinoma], PRAD[Prostate adenocarcinoma], SKCM[Skin Cutaneous Melanoma], STAD[Stomach adenocarcinoma], THCA[Thyroid carcinoma], UCEC[Uterine Corpus Endometrial Carcinoma] |
| Top |
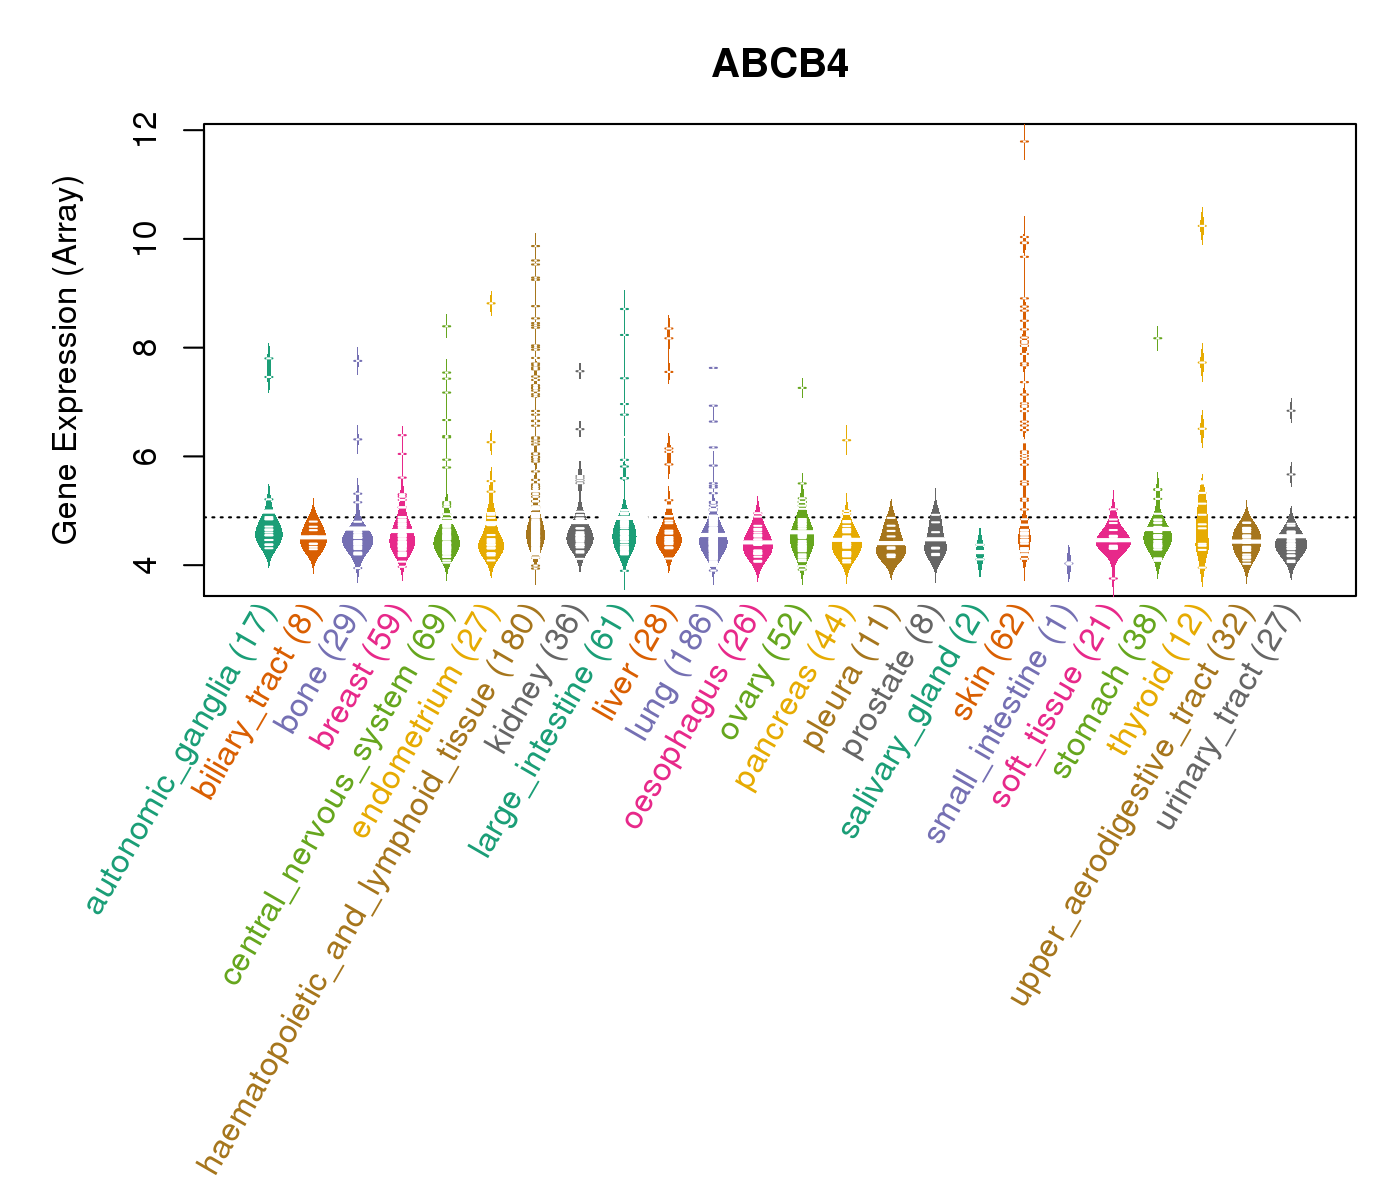
| Gene Expression for ABCB4 |
| * CCLE gene expression data were extracted from CCLE_Expression_Entrez_2012-10-18.res: Gene-centric RMA-normalized mRNA expression data. |
 |
| * Normalized gene expression data of RNASeqV2 was extracted from TCGA using R package TCGA-Assembler. The URLs of all public data files on TCGA DCC data server were gathered at Jan-05-2015. Only eight cancer types have enough normal control samples for differential expression analysis. (t test, adjusted p<0.05 (using Benjamini-Hochberg FDR)) |
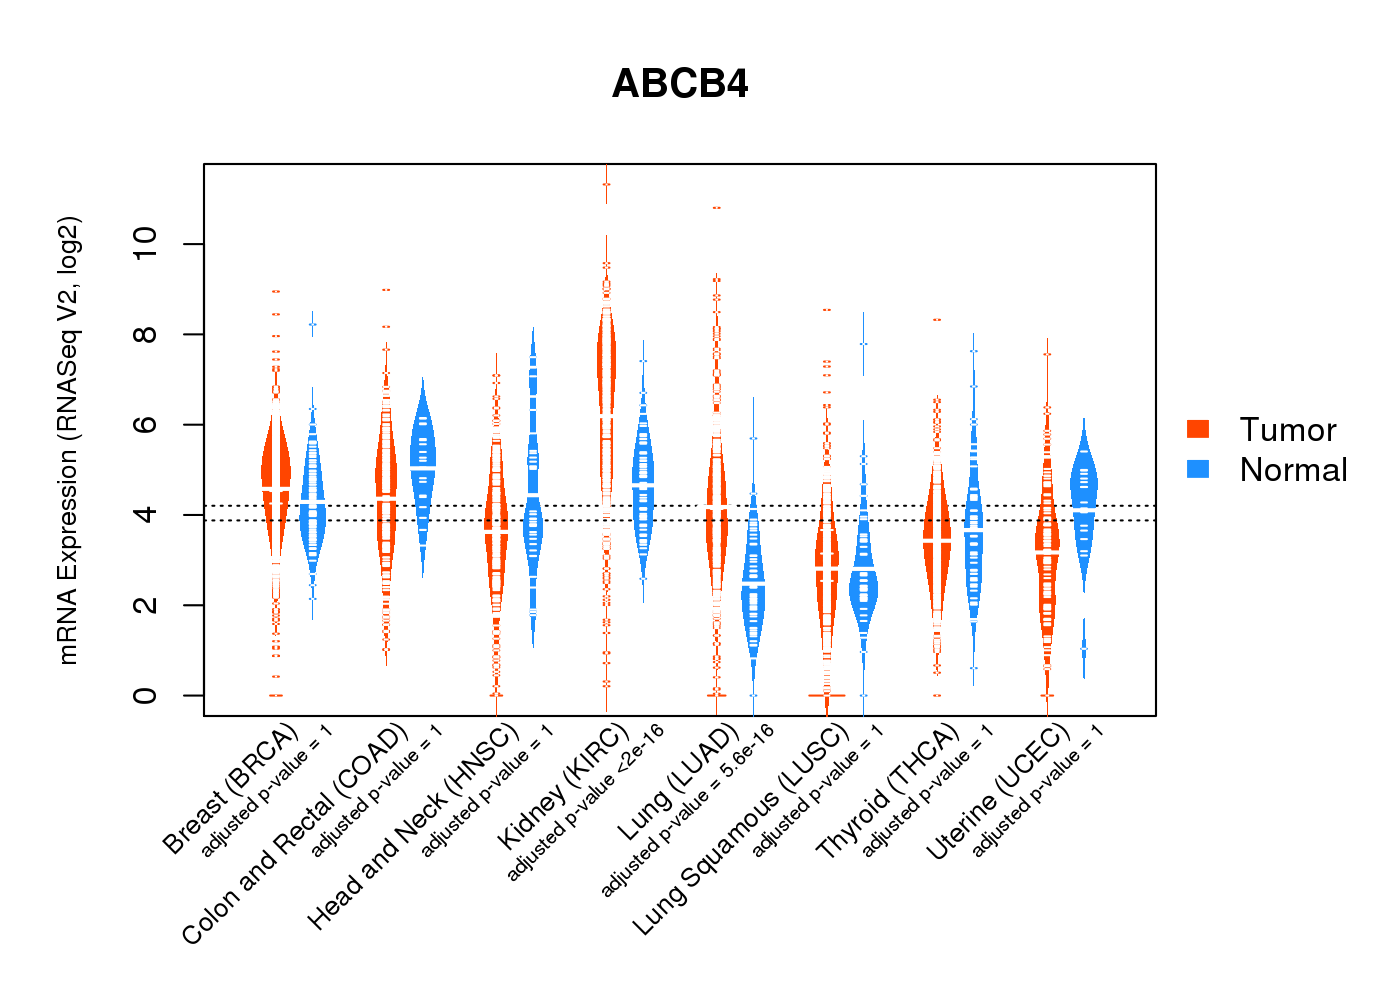 |
| Top |
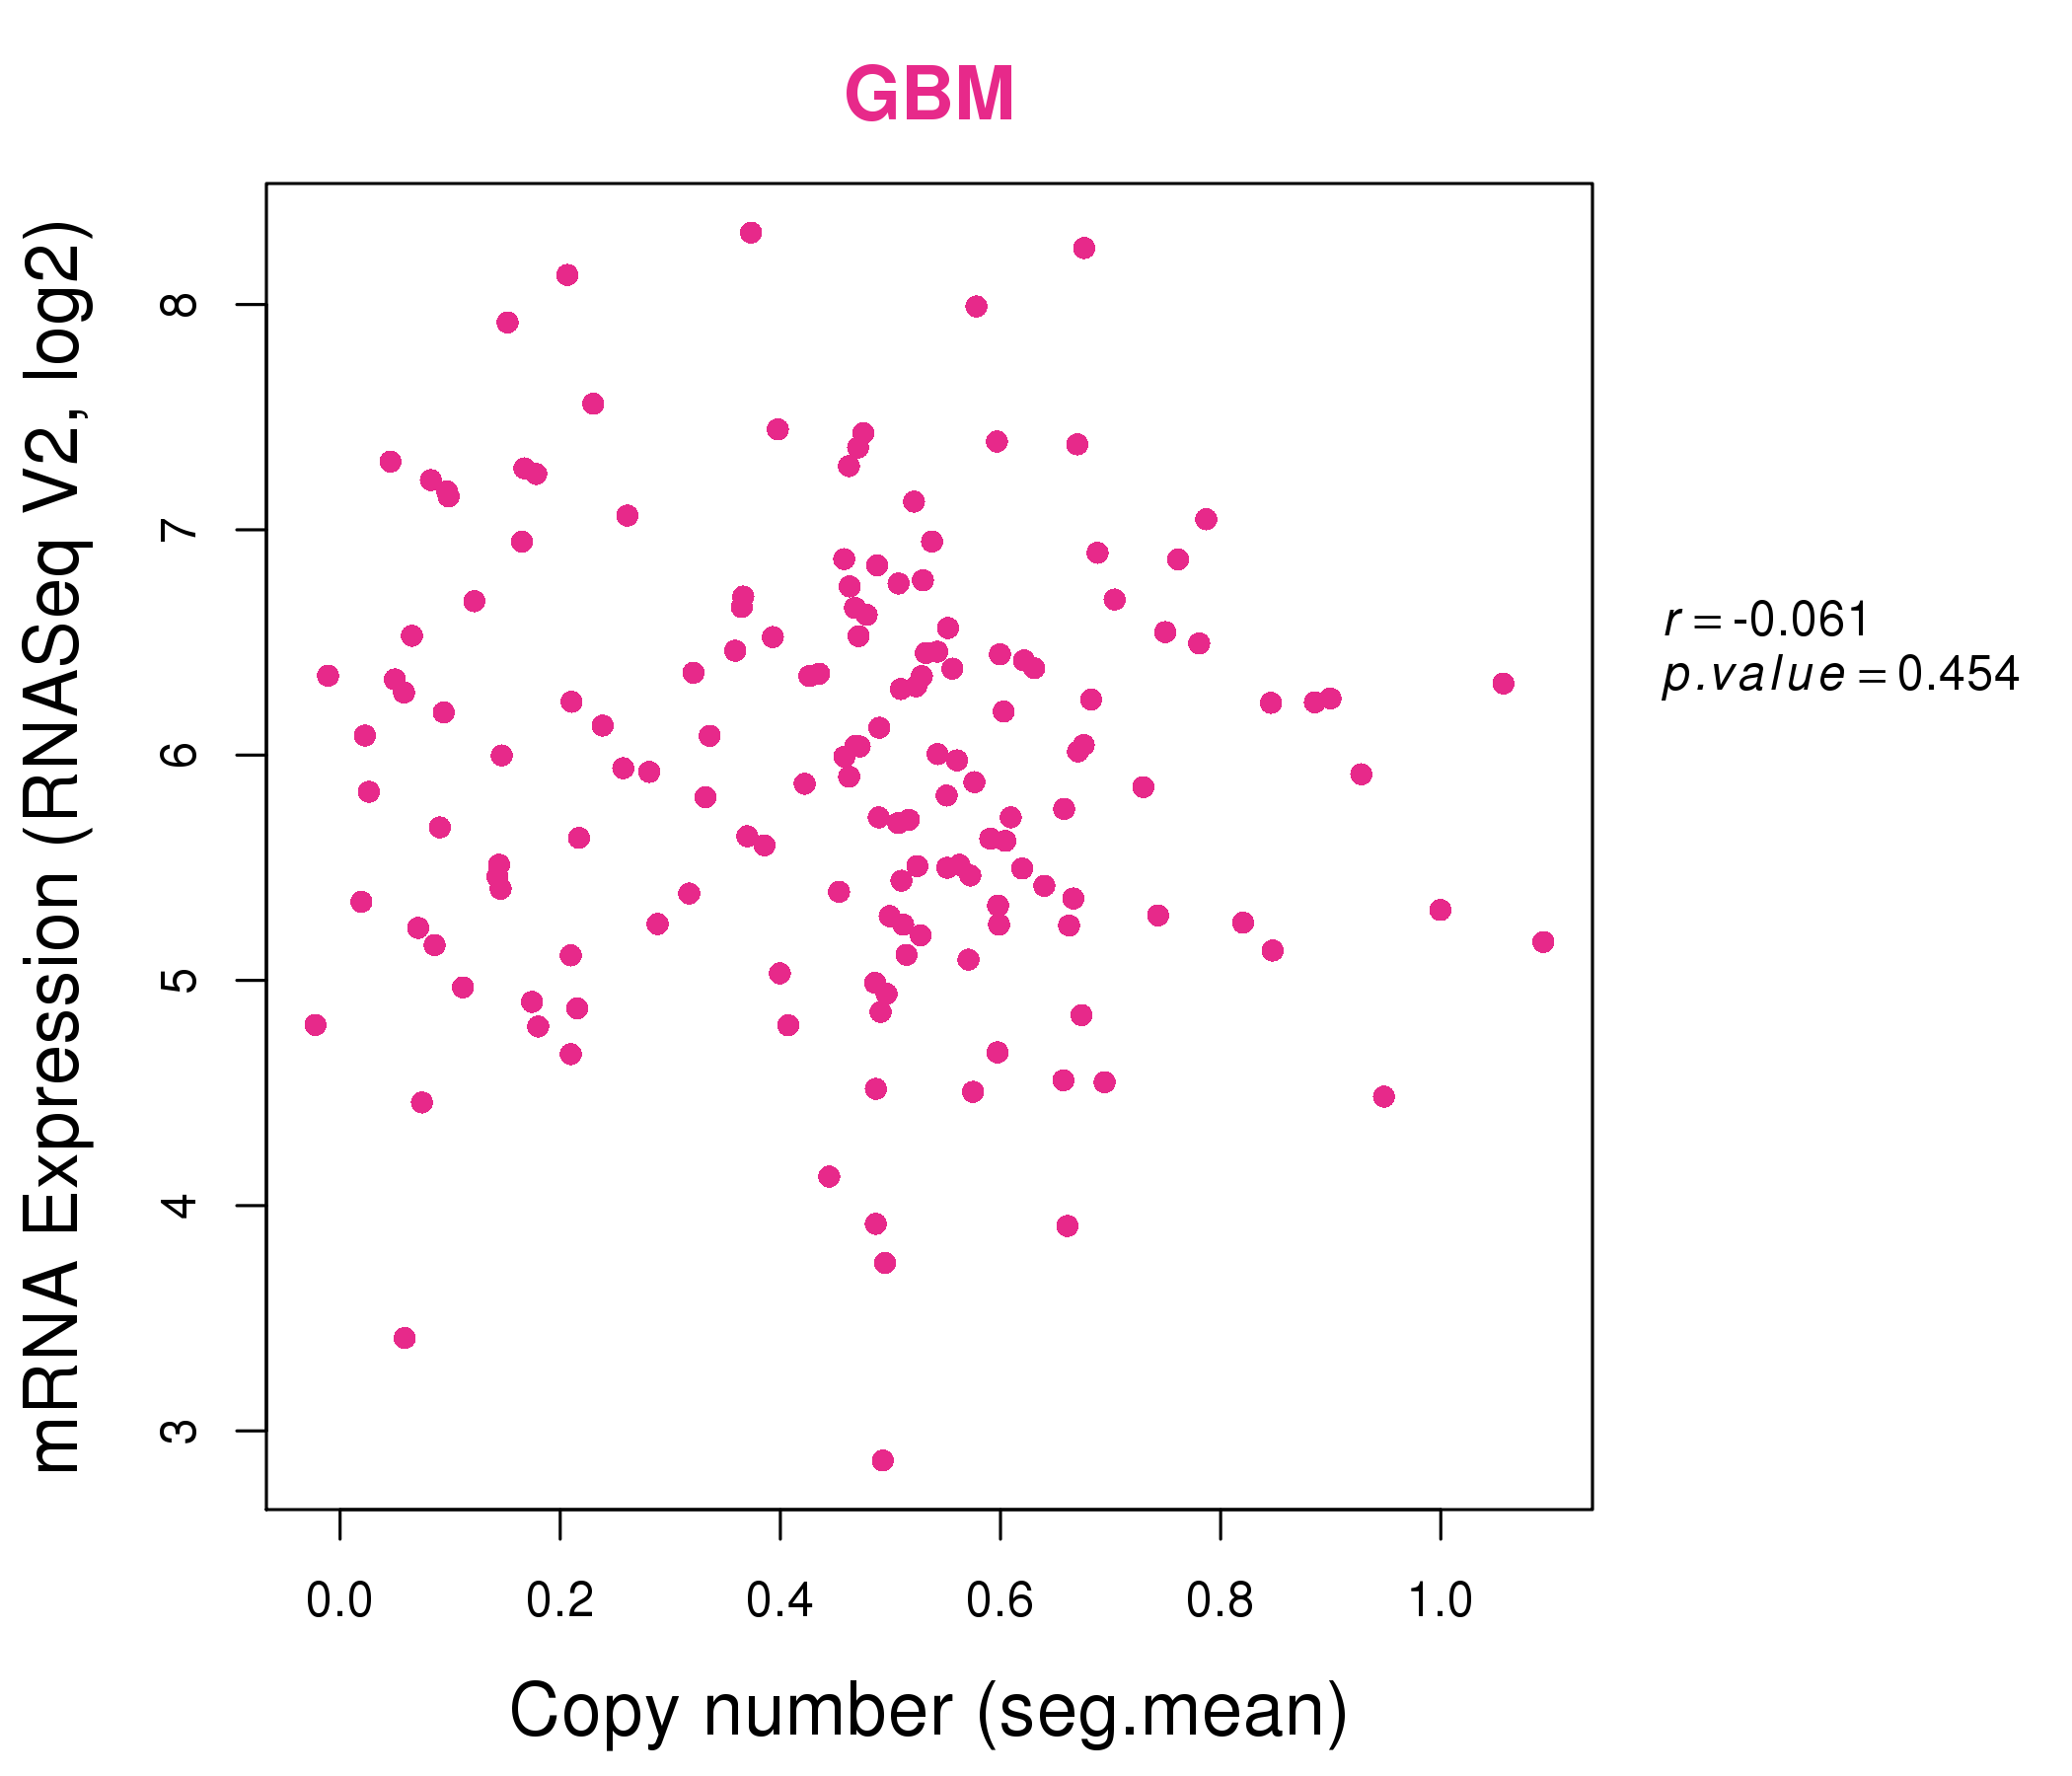
| * This plots show the correlation between CNV and gene expression. |
: Open all plots for all cancer types
 |
|
 |
|
| Top |
| Gene-Gene Network Information |
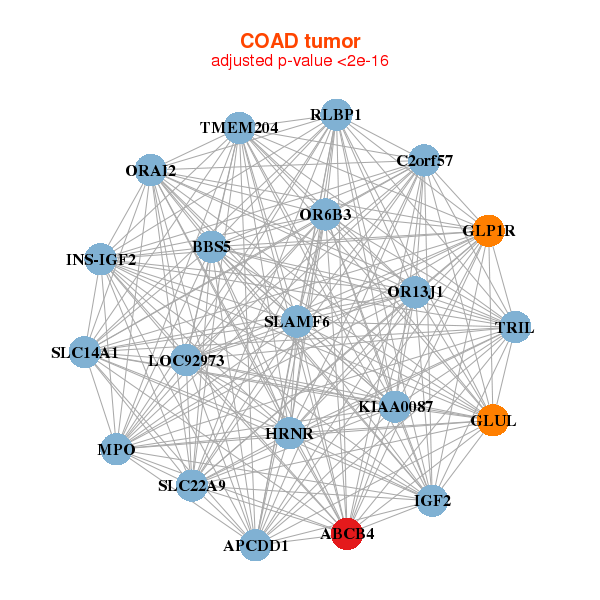
| * Co-Expression network figures were drawn using R package igraph. Only the top 20 genes with the highest correlations were shown. Red circle: input gene, orange circle: cell metabolism gene, sky circle: other gene |
: Open all plots for all cancer types
 |
| ||||
| ABCB4,ANGPTL3,APOB,ASGR2,BMP10,C9,CATSPER1, CD22,CREB3L3,DBH,F2,FABP1,FGF23,ITIH1, ITIH3,PLG,SERPINA7,SLC17A2,SPP2,TM4SF5,VTN | ABCB4,BIN1,CFL2,CLCN4,CLIC5,CLTCL1,COX7A1, CUTC,DYSF,EYA4,FILIP1,FYCO1,IL17D,KCNJ12, MEF2C,MN1,PHKG1,PPAPDC3,TMOD1,TUBA8,ZNF106 | ||||
 |
| ||||
| ABCB4,APCDD1,BBS5,C2orf57,GLP1R,GLUL,HRNR, IGF2,INS-IGF2,KIAA0087,LOC92973,MPO,OR13J1,OR6B3, ORAI2,RLBP1,SLAMF6,SLC14A1,SLC22A9,TMEM204,TRIL | ABCB1,ABCB4,ABCG1,C1orf106,C1orf115,C2CD2L,COBL, DYRK2,GCOM1,HECA,IFNLR1,KCNK5,KIAA0247,LAMB3, MALL,NR1I2,PIGS,PTK2B,SGK223,SLC9A3R1,TGOLN2 |
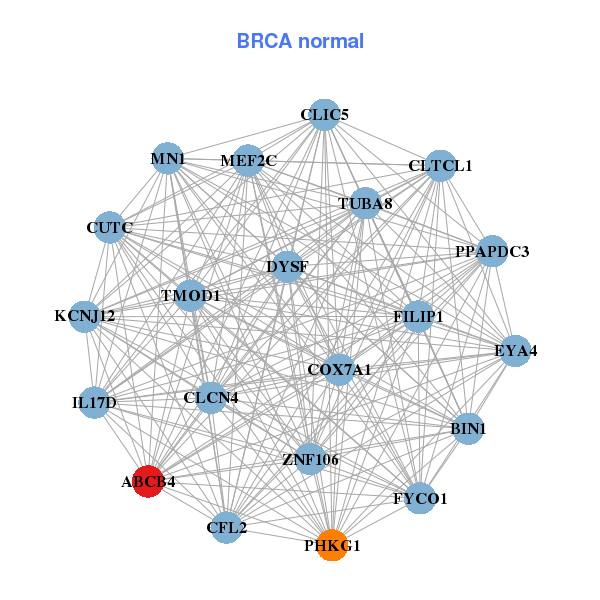
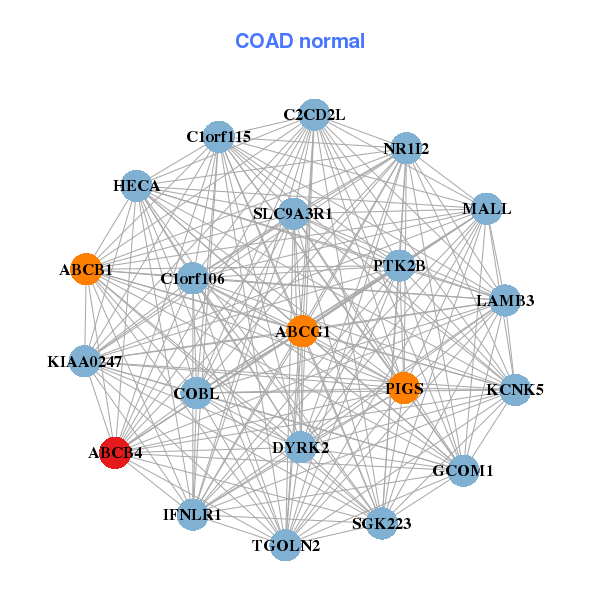
| * Co-Expression network figures were drawn using R package igraph. Only the top 20 genes with the highest correlations were shown. Red circle: input gene, orange circle: cell metabolism gene, sky circle: other gene |
: Open all plots for all cancer types
| Top |
: Open all interacting genes' information including KEGG pathway for all interacting genes from DAVID
| Top |
| Pharmacological Information for ABCB4 |
| DB Category | DB Name | DB's ID and Url link |
| * Gene Centered Interaction Network. |
 |
| * Drug Centered Interaction Network. |
| DrugBank ID | Target Name | Drug Groups | Generic Name | Drug Centered Network | Drug Structure |
| DB00143 | ATP-binding cassette, sub-family B (MDR/TAP), member 4 | approved; nutraceutical | Glutathione |  |  |
| DB00997 | ATP-binding cassette, sub-family B (MDR/TAP), member 4 | approved; investigational | Doxorubicin | 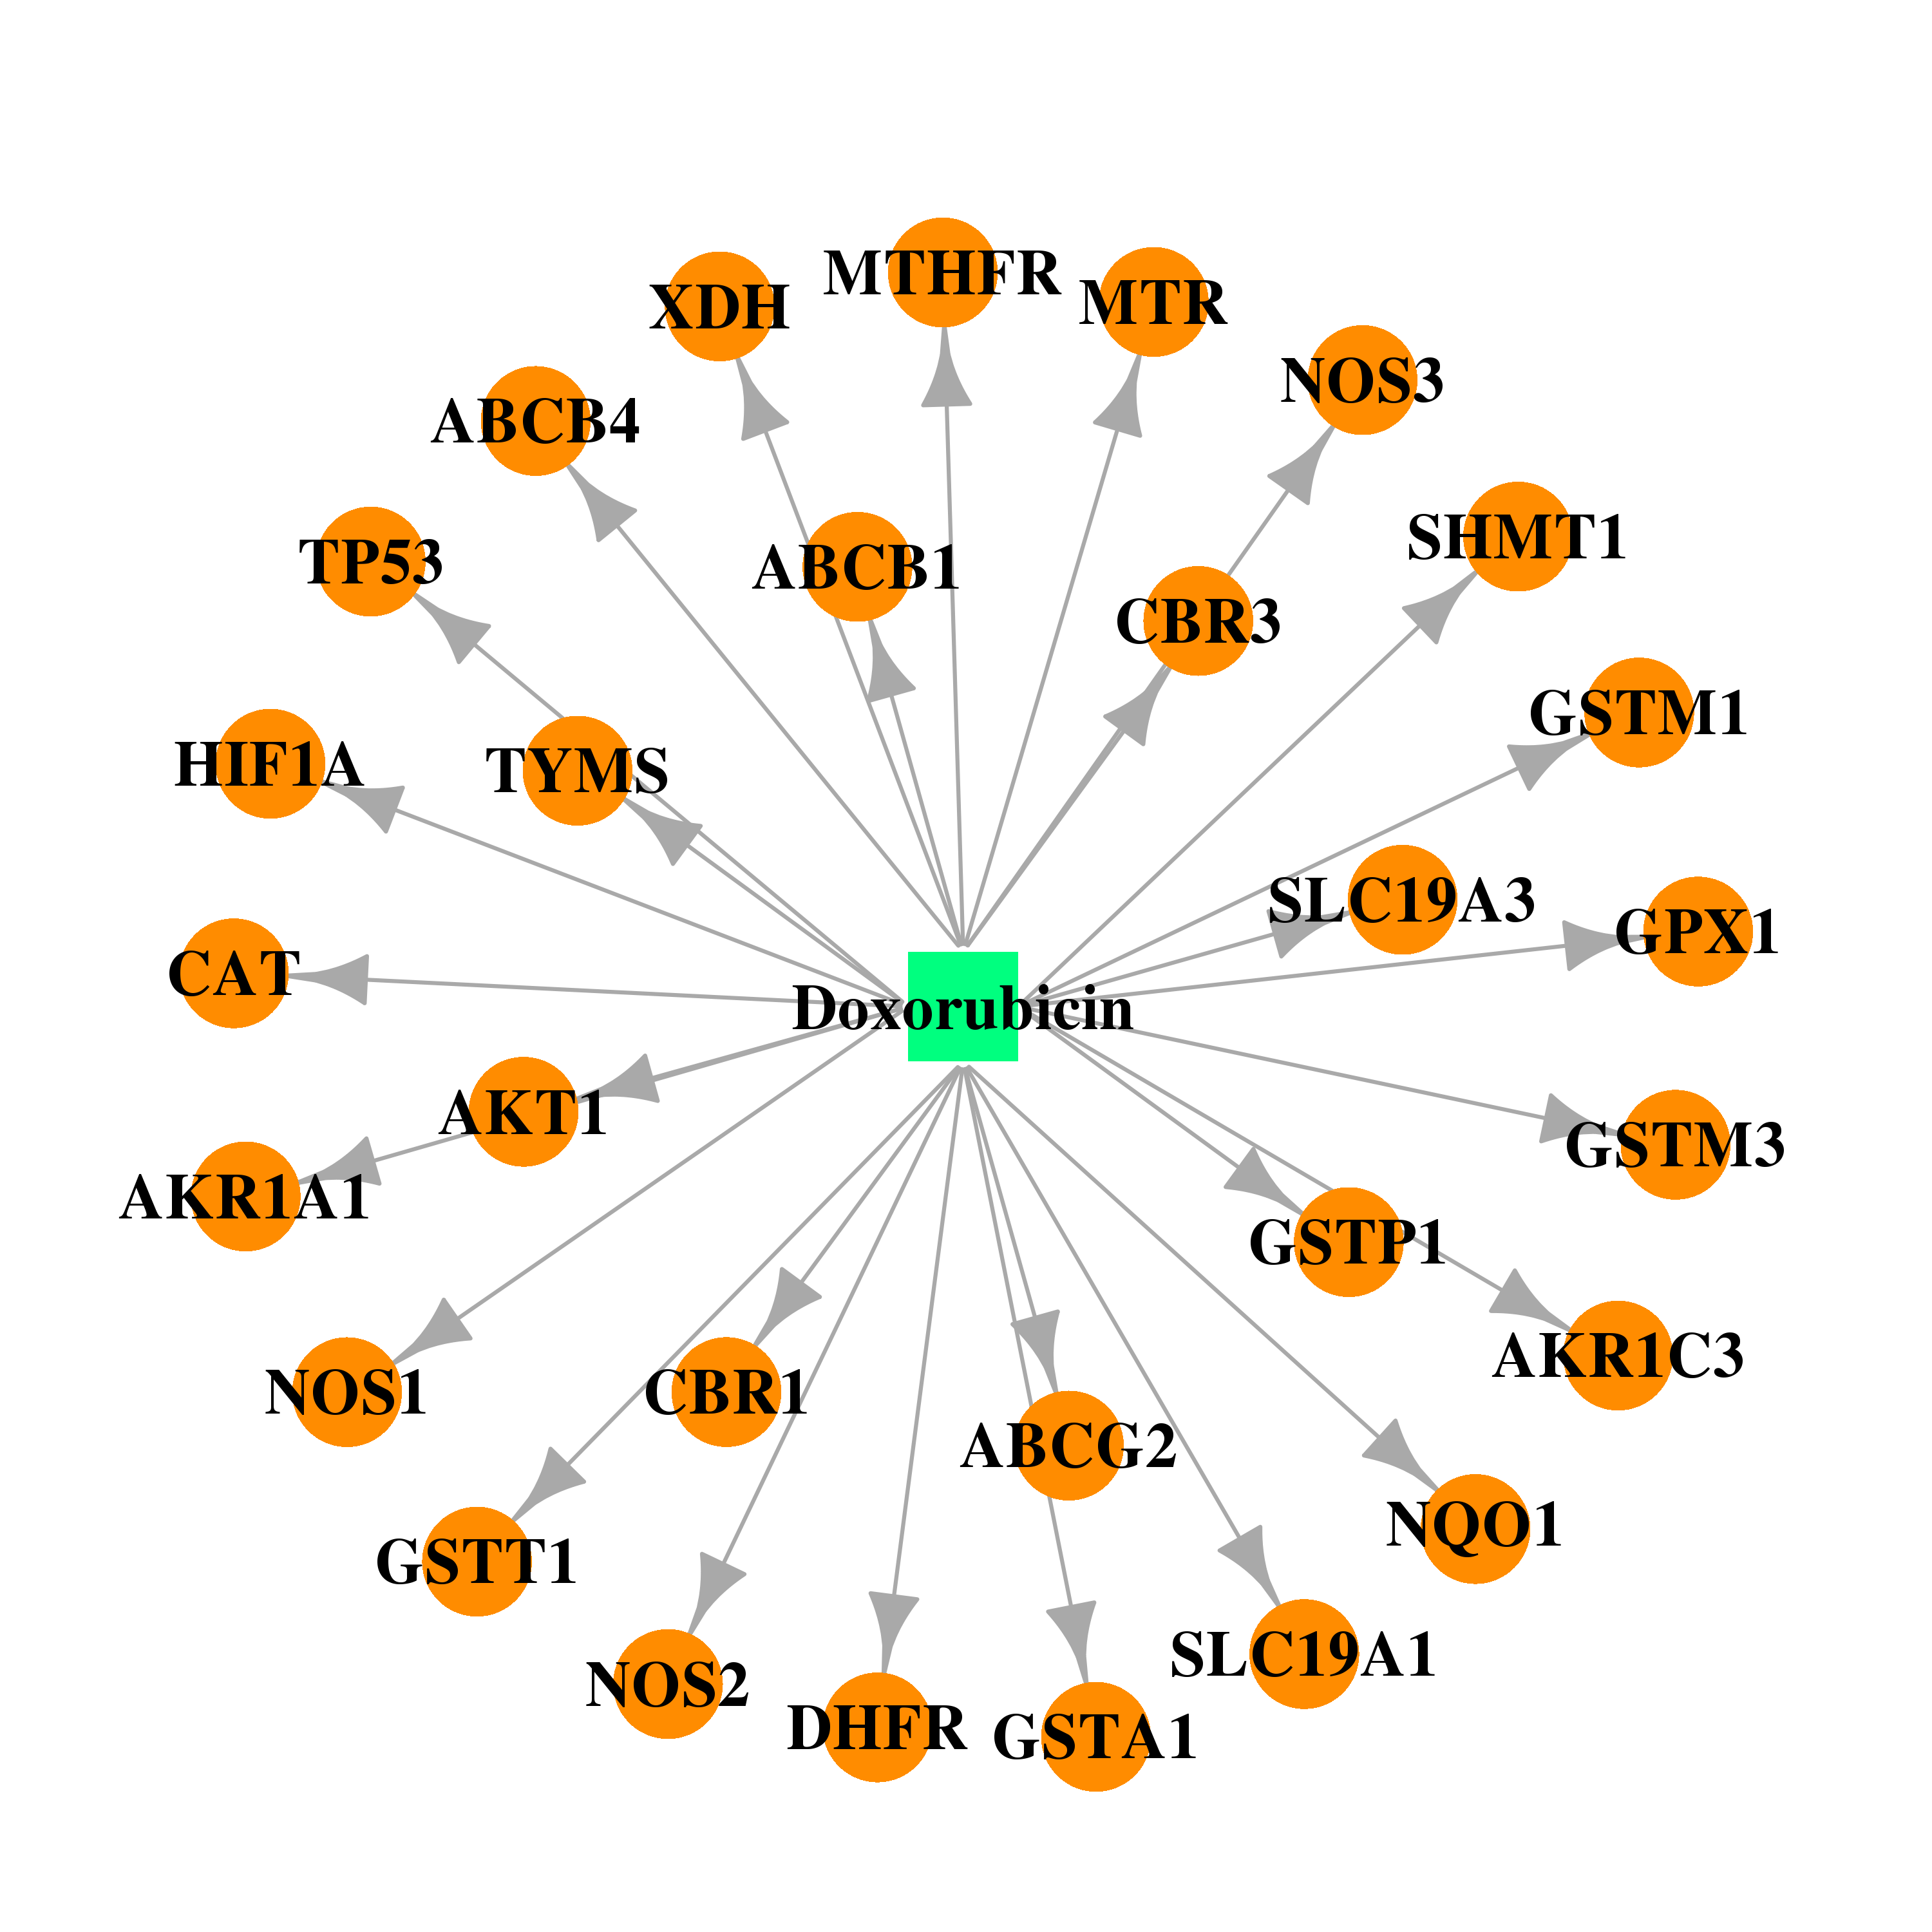 | 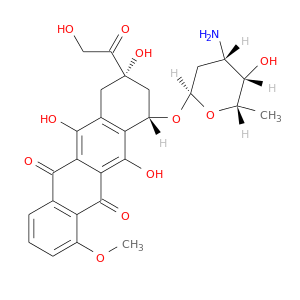 |
| DB00382 | ATP-binding cassette, sub-family B (MDR/TAP), member 4 | approved | Tacrine |  | 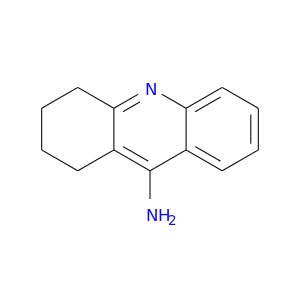 |
| Top |
| Cross referenced IDs for ABCB4 |
| * We obtained these cross-references from Uniprot database. It covers 150 different DBs, 18 categories. http://www.uniprot.org/help/cross_references_section |
: Open all cross reference information
|
Copyright © 2016-Present - The Univsersity of Texas Health Science Center at Houston @ |