|
||||||||||||||||||||
| |
| Phenotypic Information (metabolism pathway, cancer, disease, phenome) |
| |
| |
| Gene-Gene Network Information: Co-Expression Network, Interacting Genes & KEGG |
| |
|


| Gene Summary for PHKA2 |
| Basic gene info. | Gene symbol | PHKA2 |
| Gene name | phosphorylase kinase, alpha 2 (liver) | |
| Synonyms | GSD9A|PHK|PYK|PYKL|XLG|XLG2 | |
| Cytomap | UCSC genome browser: Xp22.2-p22.1 | |
| Genomic location | chrX :18910415-19002480 | |
| Type of gene | protein-coding | |
| RefGenes | NM_000292.2, | |
| Ensembl id | ENSG00000044446 | |
| Description | phosphorylase b kinase regulatory subunit alpha liver isoformphosphorylase b kinase regulatory subunit alpha, liver isoformphosphorylase kinase alpha L subunitphosphorylase kinase alpha-subunit | |
| Modification date | 20141219 | |
| dbXrefs | MIM : 300798 | |
| HGNC : HGNC | ||
| Ensembl : ENSG00000044446 | ||
| HPRD : 02380 | ||
| Vega : OTTHUMG00000021222 | ||
| Protein | UniProt: go to UniProt's Cross Reference DB Table | |
| Expression | CleanEX: HS_PHKA2 | |
| BioGPS: 5256 | ||
| Gene Expression Atlas: ENSG00000044446 | ||
| The Human Protein Atlas: ENSG00000044446 | ||
| Pathway | NCI Pathway Interaction Database: PHKA2 | |
| KEGG: PHKA2 | ||
| REACTOME: PHKA2 | ||
| ConsensusPathDB | ||
| Pathway Commons: PHKA2 | ||
| Metabolism | MetaCyc: PHKA2 | |
| HUMANCyc: PHKA2 | ||
| Regulation | Ensembl's Regulation: ENSG00000044446 | |
| miRBase: chrX :18,910,415-19,002,480 | ||
| TargetScan: NM_000292 | ||
| cisRED: ENSG00000044446 | ||
| Context | iHOP: PHKA2 | |
| cancer metabolism search in PubMed: PHKA2 | ||
| UCL Cancer Institute: PHKA2 | ||
| Assigned class in ccmGDB | C | |
| Top |
| Phenotypic Information for PHKA2(metabolism pathway, cancer, disease, phenome) |
| Cancer | CGAP: PHKA2 |
| Familial Cancer Database: PHKA2 | |
| * This gene is included in those cancer gene databases. |
|
|
|
|
|
| . | ||||||||||||||
Oncogene 1 | Significant driver gene in | |||||||||||||||||||
| cf) number; DB name 1 Oncogene; http://nar.oxfordjournals.org/content/35/suppl_1/D721.long, 2 Tumor Suppressor gene; https://bioinfo.uth.edu/TSGene/, 3 Cancer Gene Census; http://www.nature.com/nrc/journal/v4/n3/abs/nrc1299.html, 4 CancerGenes; http://nar.oxfordjournals.org/content/35/suppl_1/D721.long, 5 Network of Cancer Gene; http://ncg.kcl.ac.uk/index.php, 1Therapeutic Vulnerabilities in Cancer; http://cbio.mskcc.org/cancergenomics/statius/ |
| REACTOME_METABOLISM_OF_CARBOHYDRATES REACTOME_GLUCOSE_METABOLISM | |
| OMIM | |
| Orphanet | |
| Disease | KEGG Disease: PHKA2 |
| MedGen: PHKA2 (Human Medical Genetics with Condition) | |
| ClinVar: PHKA2 | |
| Phenotype | MGI: PHKA2 (International Mouse Phenotyping Consortium) |
| PhenomicDB: PHKA2 | |
| Mutations for PHKA2 |
| * Under tables are showing count per each tissue to give us broad intuition about tissue specific mutation patterns.You can go to the detailed page for each mutation database's web site. |
| There's no structural variation information in COSMIC data for this gene. |
| * From mRNA Sanger sequences, Chitars2.0 arranged chimeric transcripts. This table shows PHKA2 related fusion information. |
| ID | Head Gene | Tail Gene | Accession | Gene_a | qStart_a | qEnd_a | Chromosome_a | tStart_a | tEnd_a | Gene_a | qStart_a | qEnd_a | Chromosome_a | tStart_a | tEnd_a |
| Top |
| There's no copy number variation information in COSMIC data for this gene. |
| Top |
|
 |
| Top |
| Stat. for Non-Synonymous SNVs (# total SNVs=108) | (# total SNVs=24) |
 |  |
(# total SNVs=2) | (# total SNVs=0) |
 |
| Top |
| * When you move the cursor on each content, you can see more deailed mutation information on the Tooltip. Those are primary_site,primary_histology,mutation(aa),pubmedID. |
| GRCh37 position | Mutation(aa) | Unique sampleID count |
| chr23:18924631-18924631 | p.R930W | 3 |
| chr23:18959751-18959751 | p.E254* | 2 |
| chr23:18912471-18912471 | p.R1130G | 2 |
| chr23:18915316-18915316 | p.G1083* | 2 |
| chr23:18911701-18911701 | p.A1204T | 2 |
| chr23:18912487-18912487 | p.V1124V | 2 |
| chr23:18958111-18958111 | p.? | 2 |
| chr23:18961840-18961840 | p.V235V | 2 |
| chr23:18913260-18913260 | p.R1111Q | 2 |
| chr23:18926166-18926166 | p.S790I | 2 |
| Top |
|
 |
| Point Mutation/ Tissue ID | 1 | 2 | 3 | 4 | 5 | 6 | 7 | 8 | 9 | 10 | 11 | 12 | 13 | 14 | 15 | 16 | 17 | 18 | 19 | 20 |
| # sample | 1 | 6 | 2 | 24 | 7 | 2 | 15 | 5 | 11 | 7 | 1 | 11 | ||||||||
| # mutation | 1 | 6 | 2 | 23 | 7 | 2 | 16 | 5 | 11 | 8 | 1 | 17 | ||||||||
| nonsynonymous SNV | 3 | 1 | 16 | 5 | 2 | 12 | 5 | 6 | 5 | 1 | 13 | |||||||||
| synonymous SNV | 1 | 3 | 1 | 8 | 2 | 4 | 5 | 3 | 4 |
| cf) Tissue ID; Tissue type (1; BLCA[Bladder Urothelial Carcinoma], 2; BRCA[Breast invasive carcinoma], 3; CESC[Cervical squamous cell carcinoma and endocervical adenocarcinoma], 4; COAD[Colon adenocarcinoma], 5; GBM[Glioblastoma multiforme], 6; Glioma Low Grade, 7; HNSC[Head and Neck squamous cell carcinoma], 8; KICH[Kidney Chromophobe], 9; KIRC[Kidney renal clear cell carcinoma], 10; KIRP[Kidney renal papillary cell carcinoma], 11; LAML[Acute Myeloid Leukemia], 12; LUAD[Lung adenocarcinoma], 13; LUSC[Lung squamous cell carcinoma], 14; OV[Ovarian serous cystadenocarcinoma ], 15; PAAD[Pancreatic adenocarcinoma], 16; PRAD[Prostate adenocarcinoma], 17; SKCM[Skin Cutaneous Melanoma], 18:STAD[Stomach adenocarcinoma], 19:THCA[Thyroid carcinoma], 20:UCEC[Uterine Corpus Endometrial Carcinoma]) |
| Top |
| * We represented just top 10 SNVs. When you move the cursor on each content, you can see more deailed mutation information on the Tooltip. Those are primary_site, primary_histology, mutation(aa), pubmedID. |
| Genomic Position | Mutation(aa) | Unique sampleID count |
| chrX:18911701 | p.A1204T | 3 |
| chrX:18943834 | p.I155I | 2 |
| chrX:18923936 | p.R930W | 2 |
| chrX:18912487 | p.T891M | 2 |
| chrX:18966934 | p.V1124V | 2 |
| chrX:18924631 | p.V235V | 2 |
| chrX:18911622 | p.S1230L | 2 |
| chrX:18961840 | p.T507T | 2 |
| chrX:18924858 | p.D950N | 2 |
| chrX:18927024 | p.R752K | 1 |
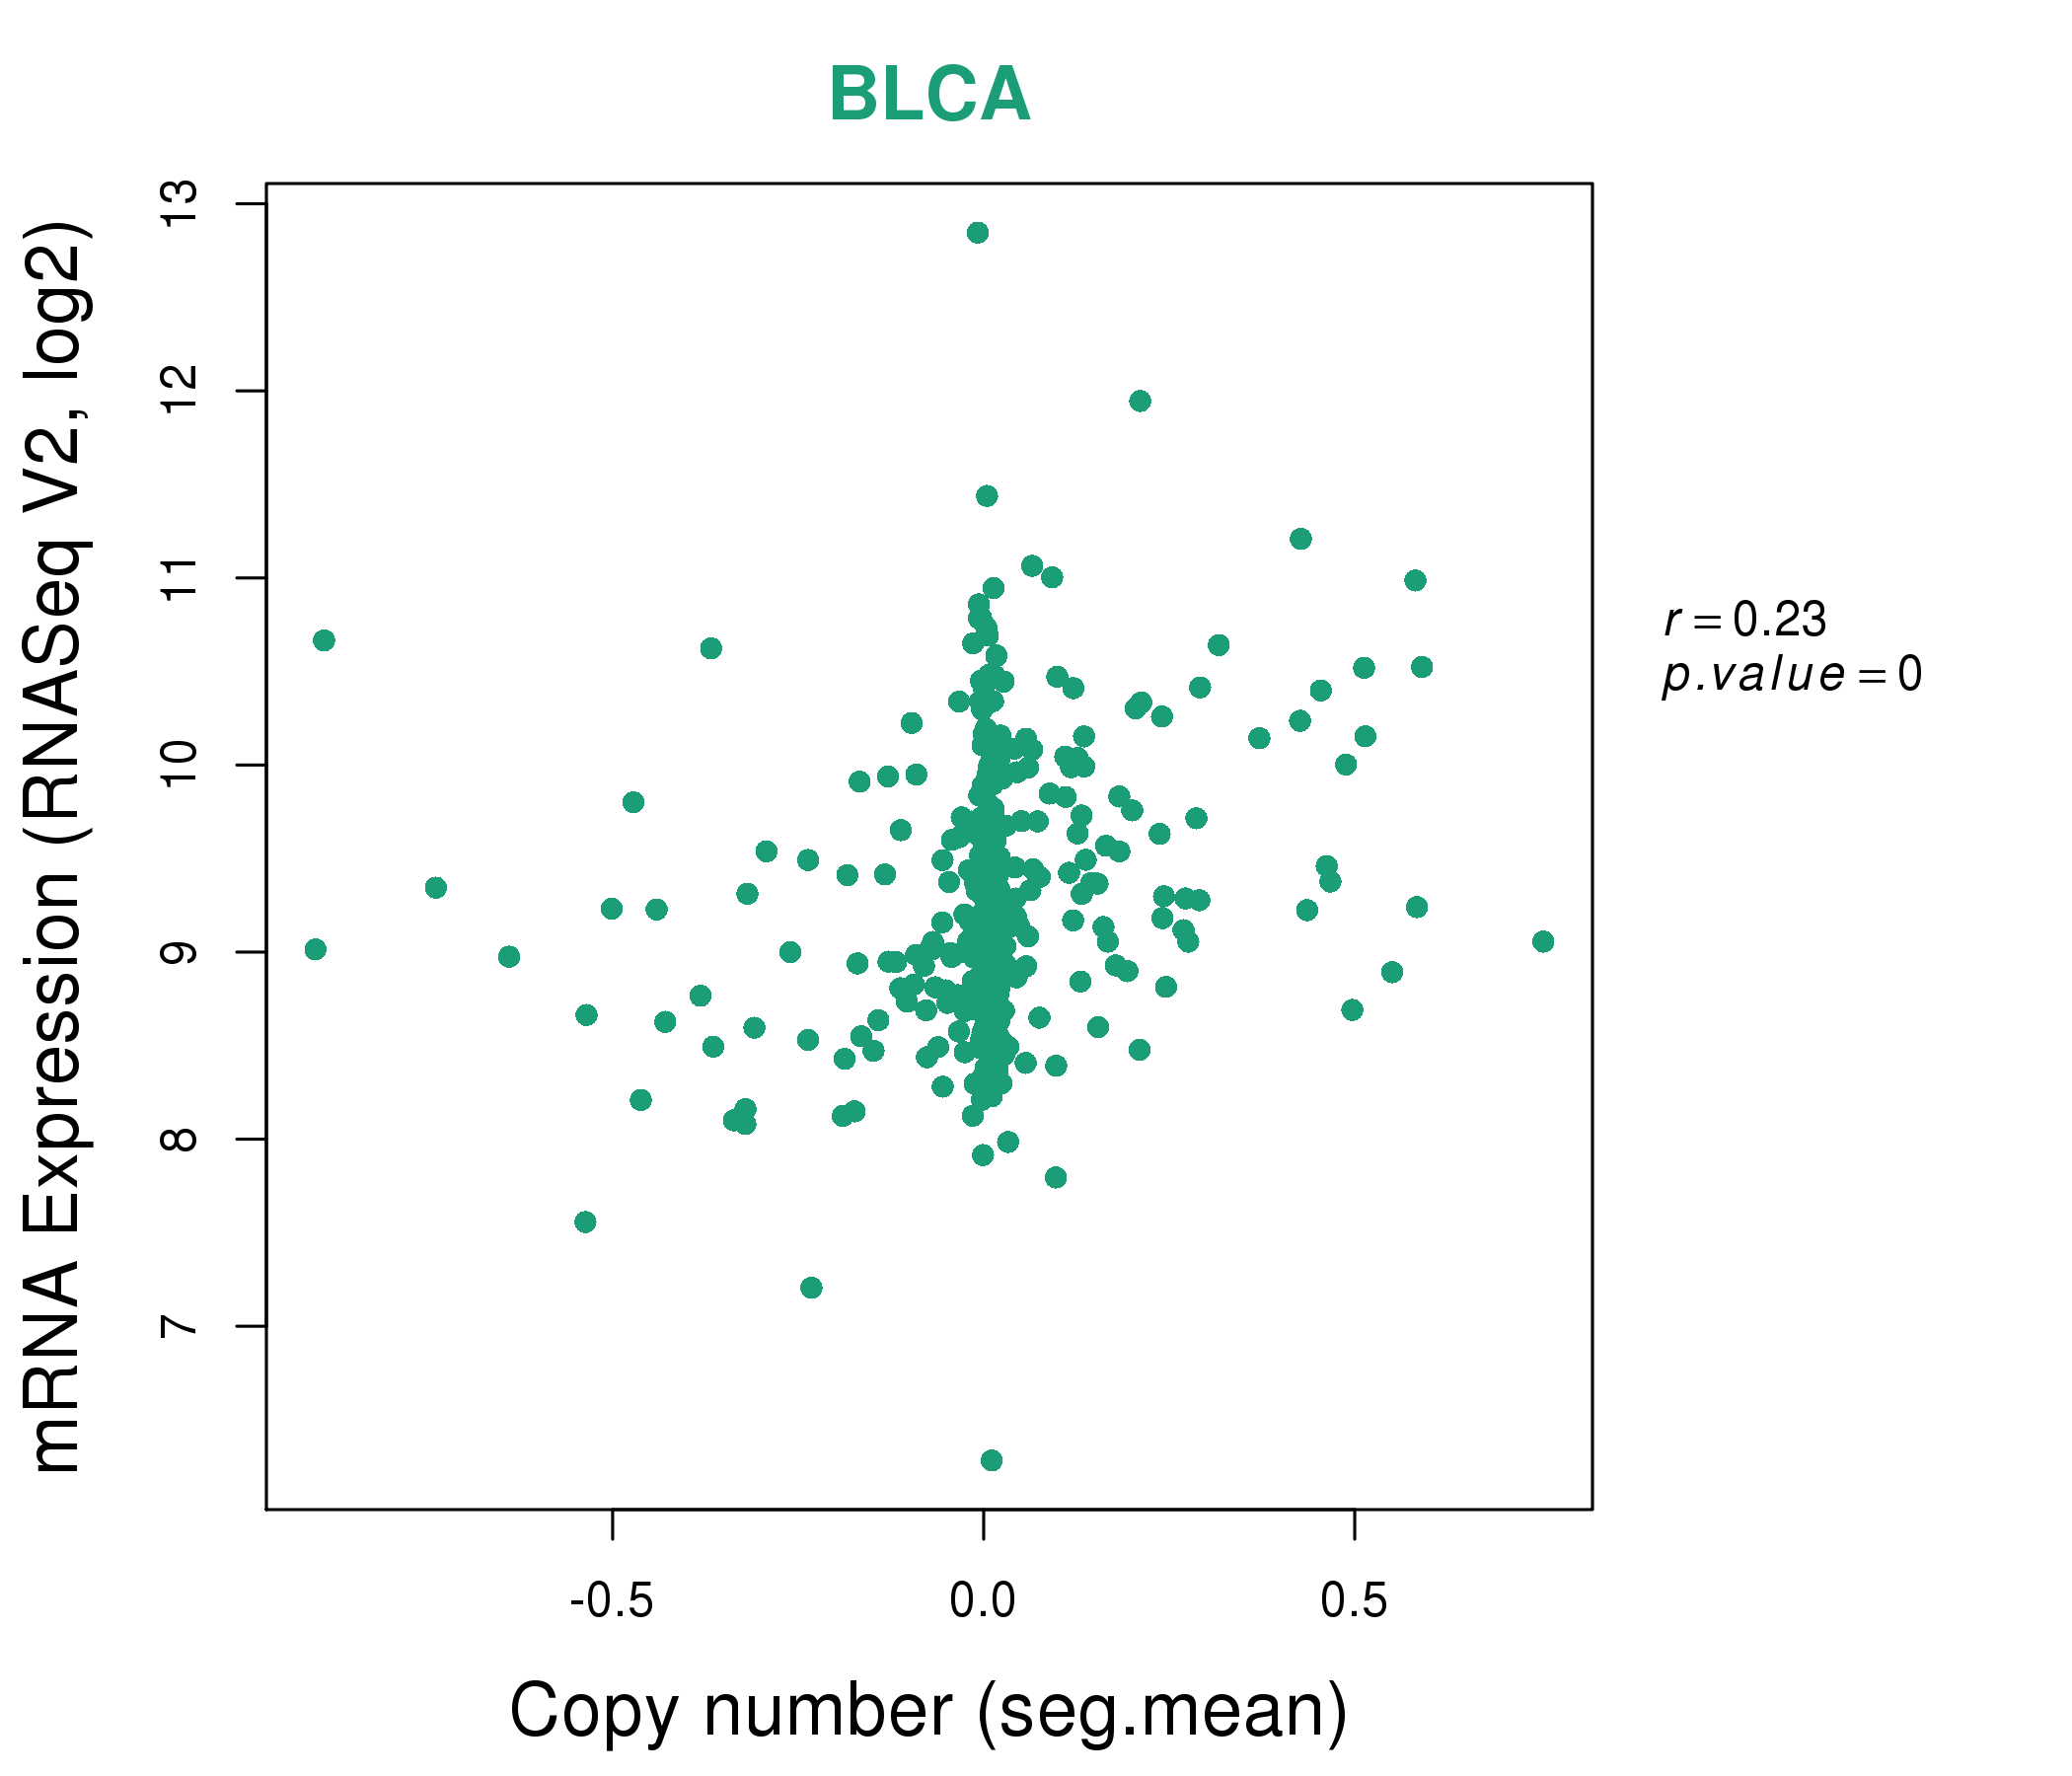
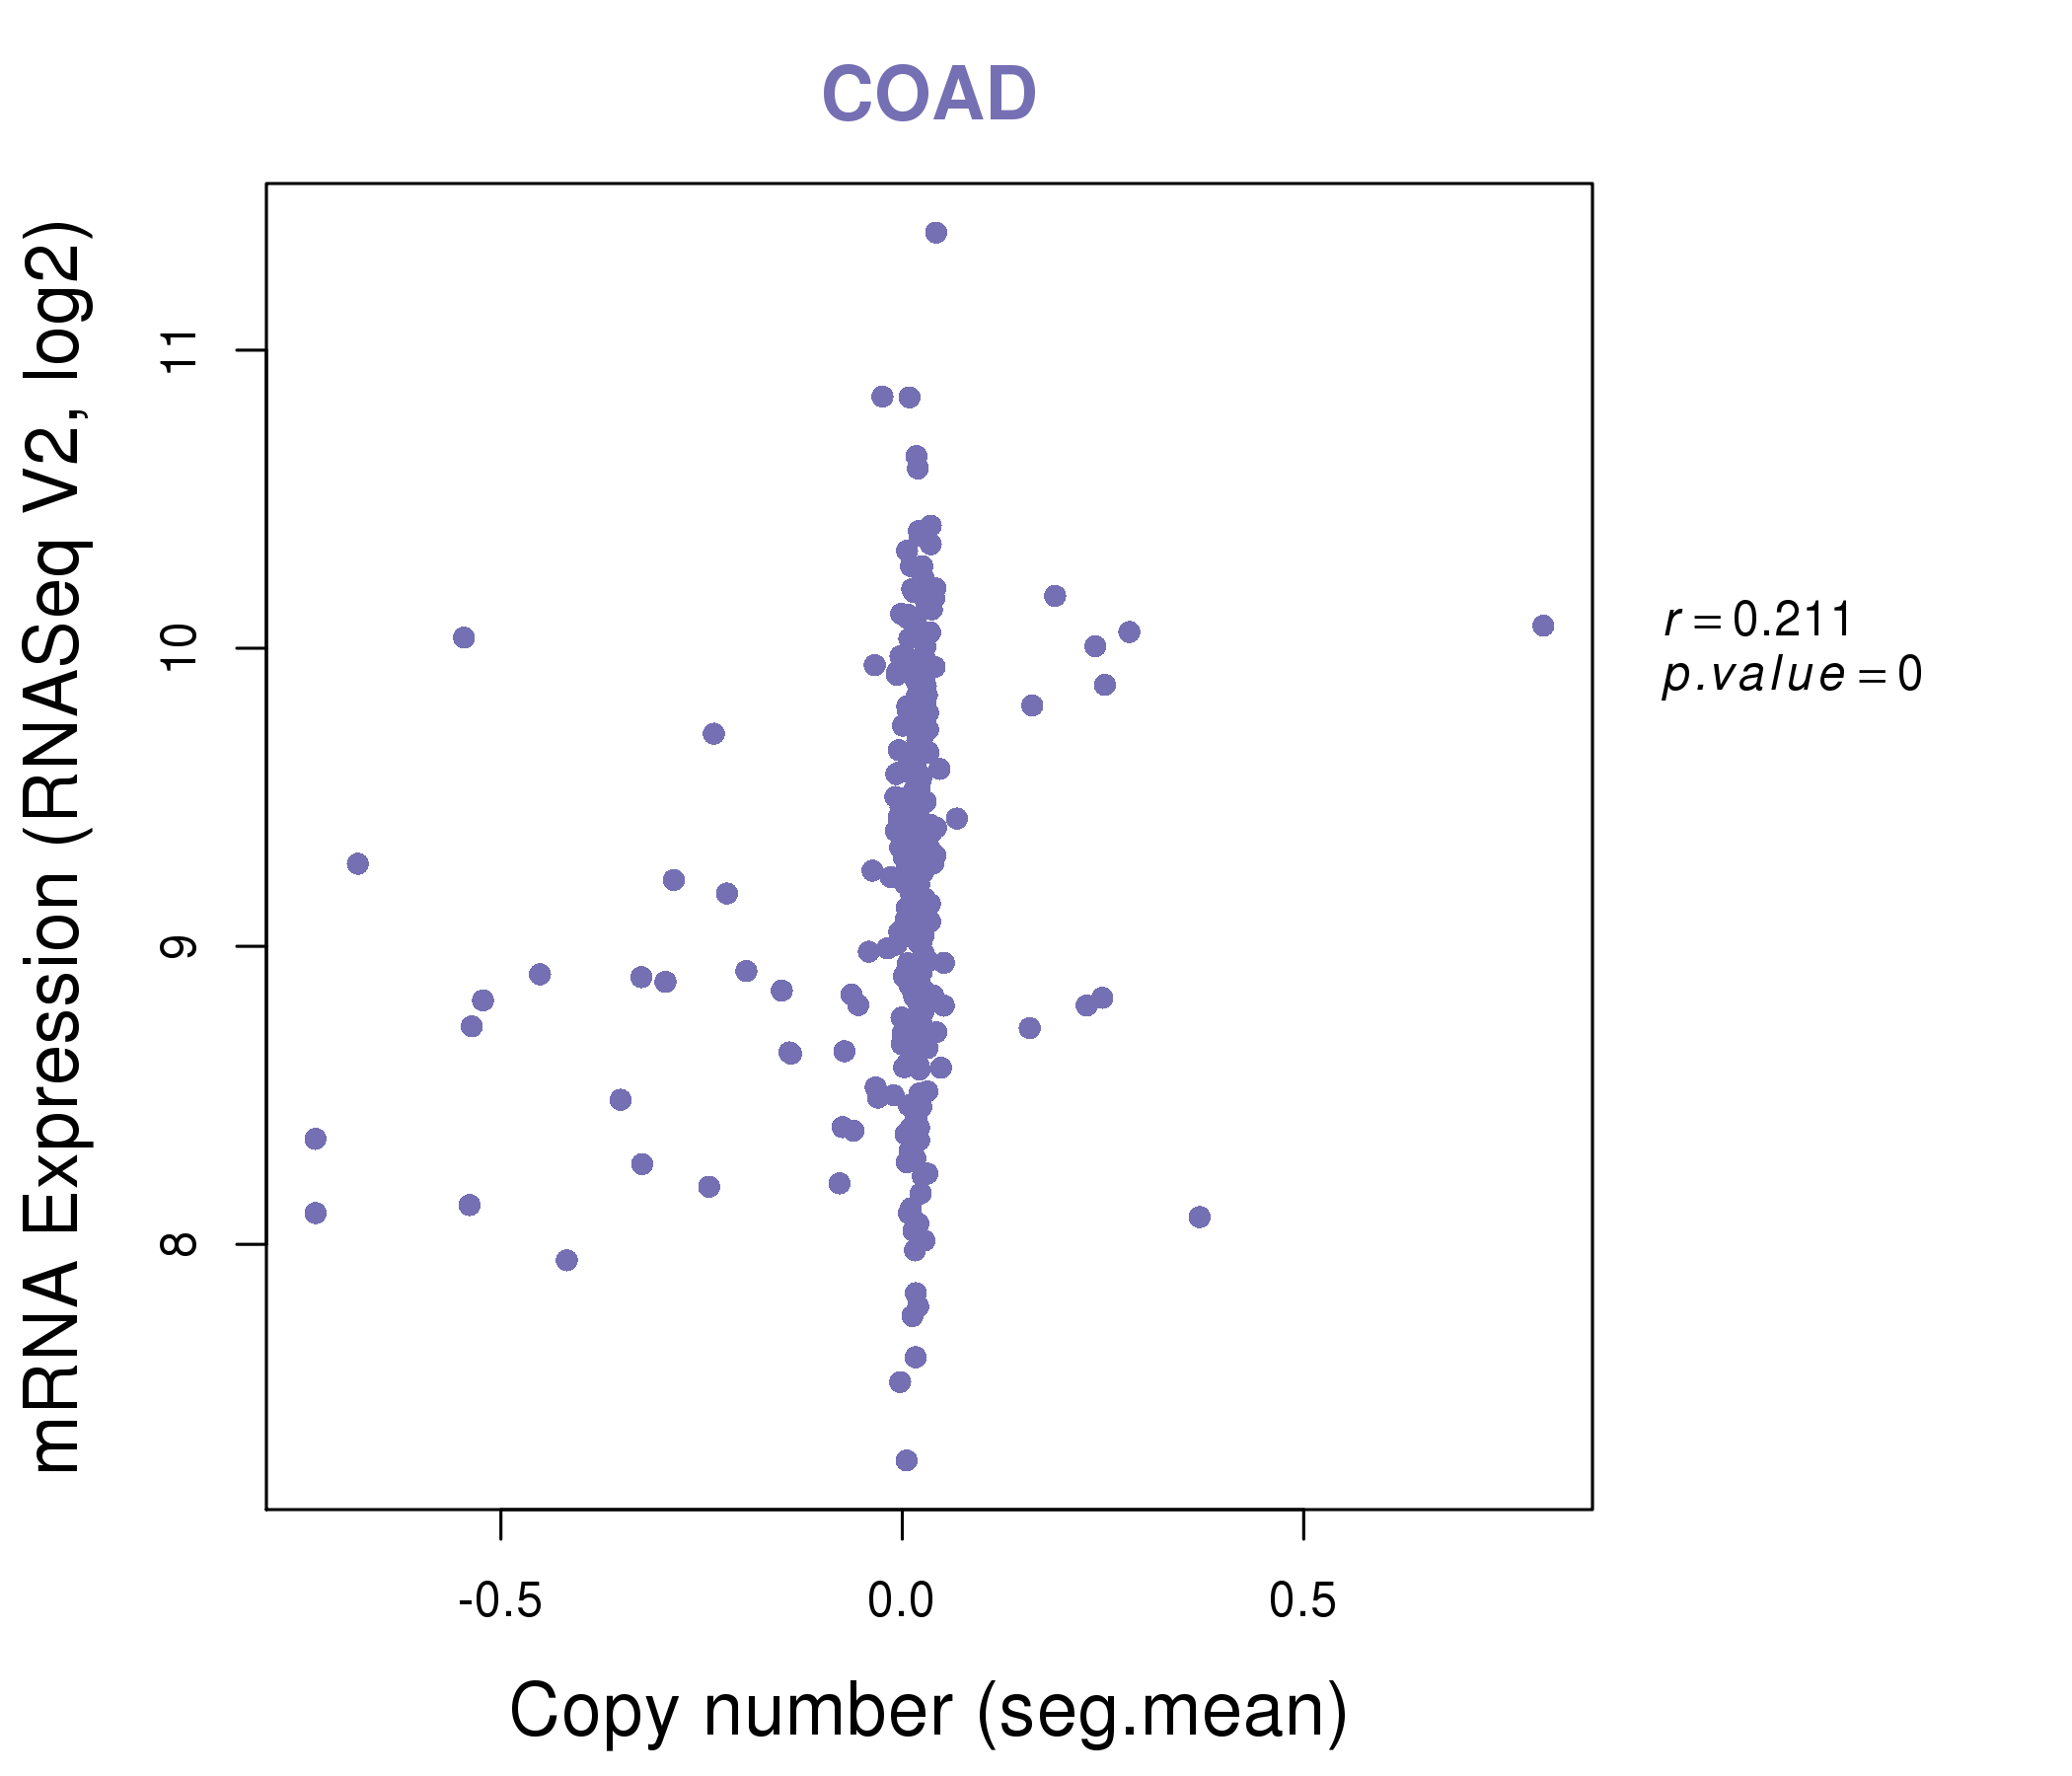
| * Copy number data were extracted from TCGA using R package TCGA-Assembler. The URLs of all public data files on TCGA DCC data server were gathered on Jan-05-2015. Function ProcessCNAData in TCGA-Assembler package was used to obtain gene-level copy number value which is calculated as the average copy number of the genomic region of a gene. |
 |
| cf) Tissue ID[Tissue type]: BLCA[Bladder Urothelial Carcinoma], BRCA[Breast invasive carcinoma], CESC[Cervical squamous cell carcinoma and endocervical adenocarcinoma], COAD[Colon adenocarcinoma], GBM[Glioblastoma multiforme], Glioma Low Grade, HNSC[Head and Neck squamous cell carcinoma], KICH[Kidney Chromophobe], KIRC[Kidney renal clear cell carcinoma], KIRP[Kidney renal papillary cell carcinoma], LAML[Acute Myeloid Leukemia], LUAD[Lung adenocarcinoma], LUSC[Lung squamous cell carcinoma], OV[Ovarian serous cystadenocarcinoma ], PAAD[Pancreatic adenocarcinoma], PRAD[Prostate adenocarcinoma], SKCM[Skin Cutaneous Melanoma], STAD[Stomach adenocarcinoma], THCA[Thyroid carcinoma], UCEC[Uterine Corpus Endometrial Carcinoma] |
| Top |
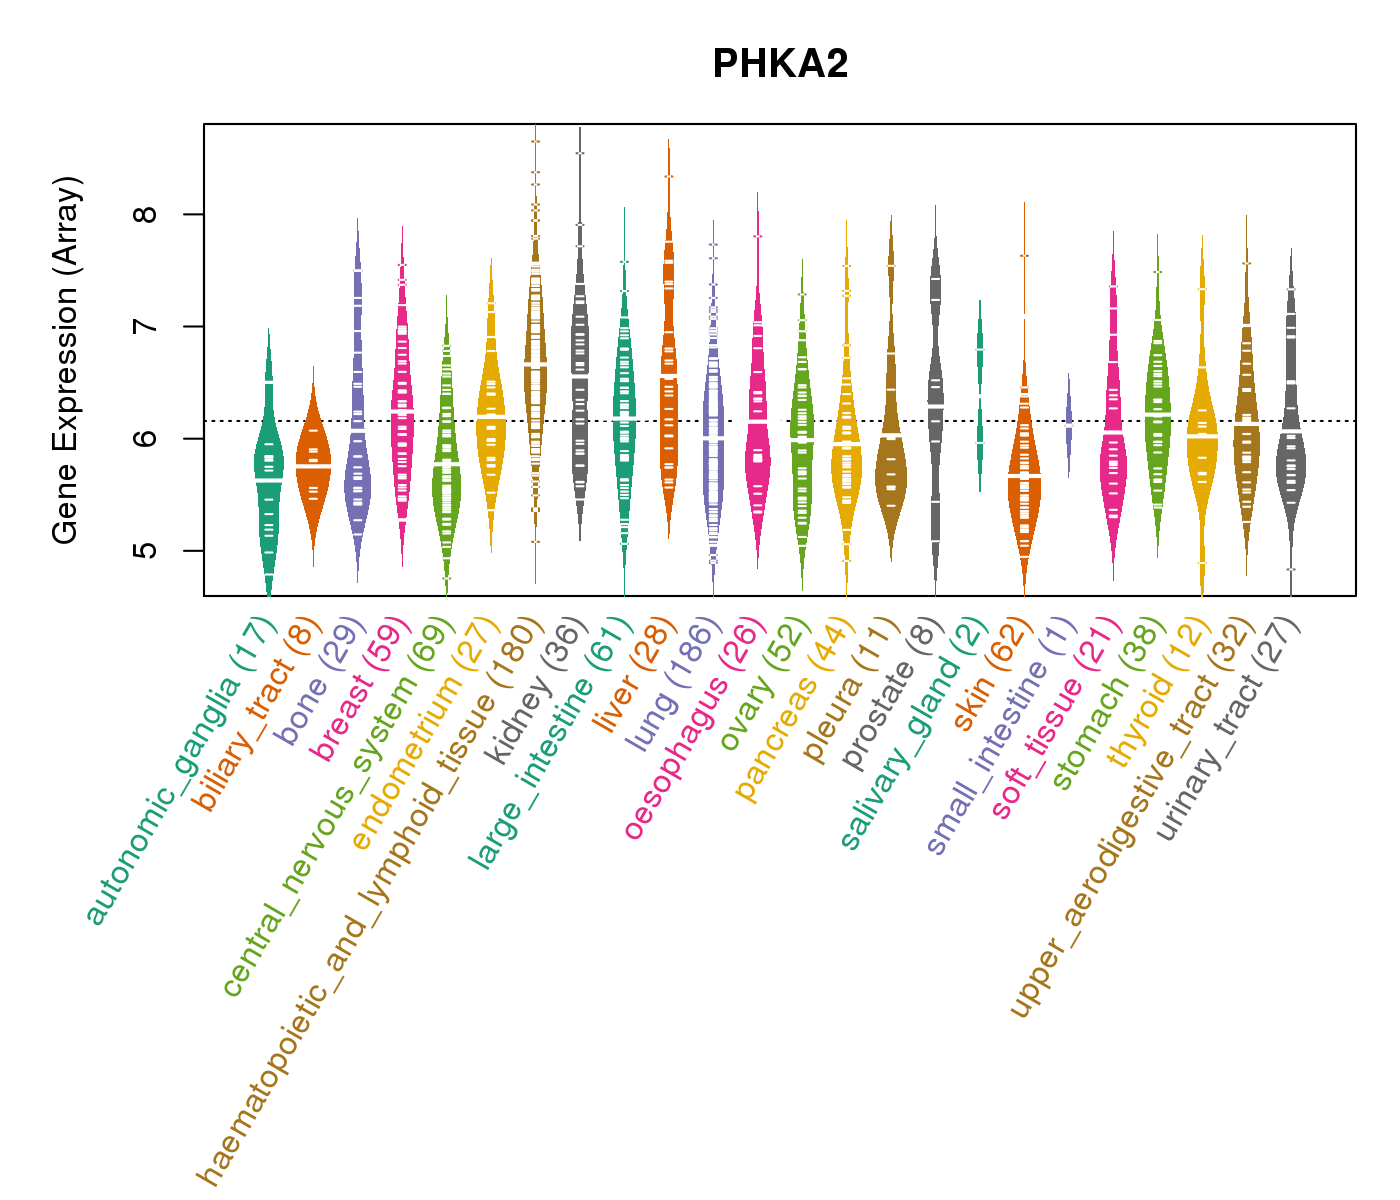
| Gene Expression for PHKA2 |
| * CCLE gene expression data were extracted from CCLE_Expression_Entrez_2012-10-18.res: Gene-centric RMA-normalized mRNA expression data. |
 |
| * Normalized gene expression data of RNASeqV2 was extracted from TCGA using R package TCGA-Assembler. The URLs of all public data files on TCGA DCC data server were gathered at Jan-05-2015. Only eight cancer types have enough normal control samples for differential expression analysis. (t test, adjusted p<0.05 (using Benjamini-Hochberg FDR)) |
 |
| Top |
| * This plots show the correlation between CNV and gene expression. |
: Open all plots for all cancer types
 |
|
 |
|


| Top |
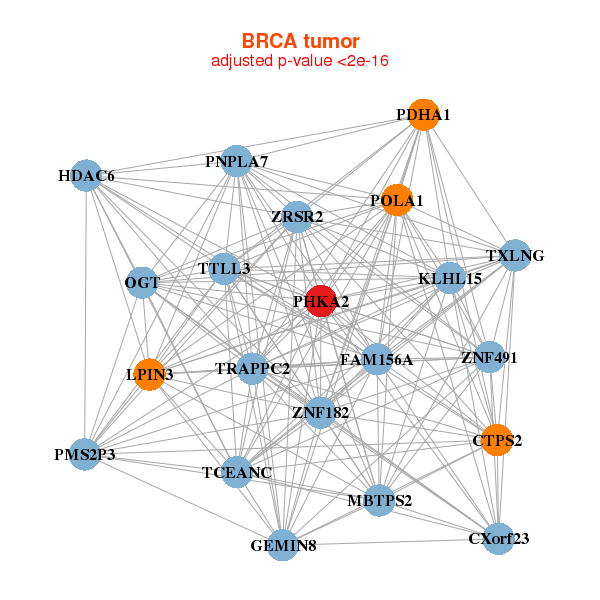
| Gene-Gene Network Information |
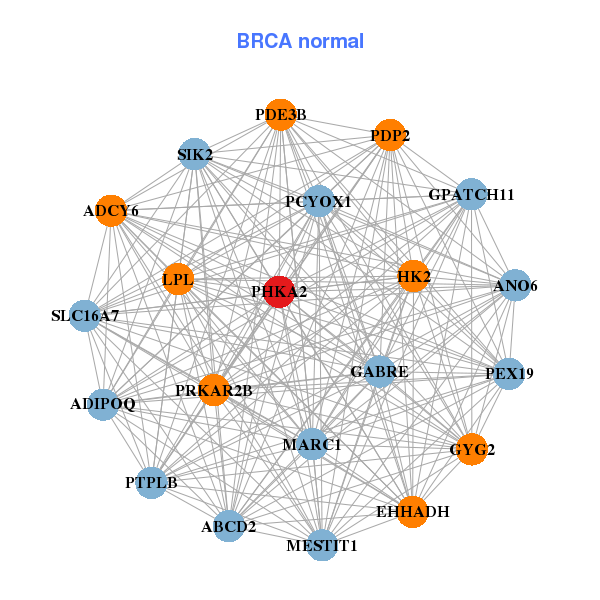
| * Co-Expression network figures were drawn using R package igraph. Only the top 20 genes with the highest correlations were shown. Red circle: input gene, orange circle: cell metabolism gene, sky circle: other gene |
: Open all plots for all cancer types
 |
|
| CTPS2,CXorf23,FAM156A,GEMIN8,HDAC6,KLHL15,LPIN3, MBTPS2,OGT,PDHA1,PHKA2,PMS2P3,PNPLA7,POLA1, TCEANC,TRAPPC2,TTLL3,TXLNG,ZNF182,ZNF491,ZRSR2 | ABCD2,ADCY6,ADIPOQ,ANO6,GPATCH11,EHHADH,GABRE, GYG2,HK2,LPL,MESTIT1,MARC1,PCYOX1,PDE3B, PDP2,PEX19,PHKA2,PRKAR2B,PTPLB,SIK2,SLC16A7 |
 |
|
| CASK,CCDC22,CLCN5,AMER1,GRIPAP1,HDAC6,LAS1L, NONO,OTUD5,JADE3,PHF8,PHKA2,POLA1,SCML1, TAB3,TSR2,USP27X,ZNF182,ZNF275,KRBOX4,ZNF674 | ACAD10,C11orf49,DTX4,ERBB2,FAM53B,FOXO4,INSR, KIAA0195,LRP4,MAML3,MYO1D,NDRG1,PAQR5,PFKL, PHKA2,POMT1,PRKCSH,PTPRF,SCARB1,SORL1,ZNF395 |
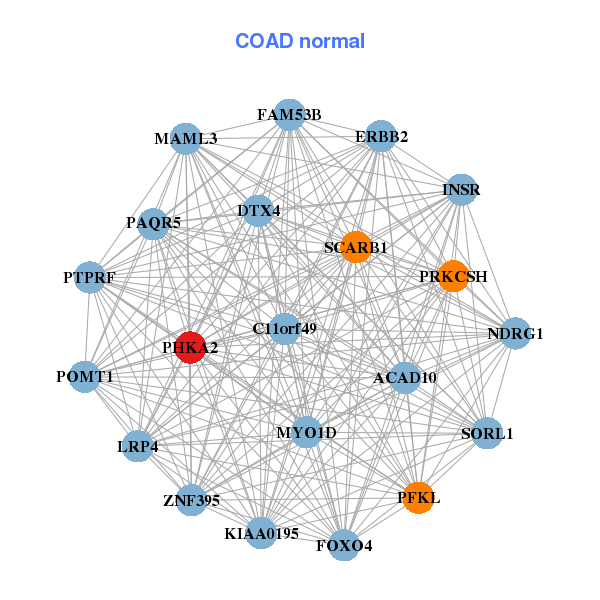
| * Co-Expression network figures were drawn using R package igraph. Only the top 20 genes with the highest correlations were shown. Red circle: input gene, orange circle: cell metabolism gene, sky circle: other gene |
: Open all plots for all cancer types
| Top |
: Open all interacting genes' information including KEGG pathway for all interacting genes from DAVID
| Top |
| Pharmacological Information for PHKA2 |
| There's no related Drug. |
| Top |
| Cross referenced IDs for PHKA2 |
| * We obtained these cross-references from Uniprot database. It covers 150 different DBs, 18 categories. http://www.uniprot.org/help/cross_references_section |
: Open all cross reference information
|
Copyright © 2016-Present - The Univsersity of Texas Health Science Center at Houston @ |