|
||||||||||||||||||||||||||||||||||||||||||||||||||||||||||||||||||||||||||||||||||||||||||||||||||||||||||||||||||||||||||||||||||||||||||||||||||||||||||||||||||||||||||||||||||||||||||||||||||||||||||||||||||||||||||||||||||||||||||||||||||||||||||||||||||||||||||||||||||||||||||||||||||||||||||||||||||||||||||
| |
| Phenotypic Information (metabolism pathway, cancer, disease, phenome) |
| |
| |
| Gene-Gene Network Information: Co-Expression Network, Interacting Genes & KEGG |
| |
|


| Gene Summary for PHKG1 |
| Basic gene info. | Gene symbol | PHKG1 |
| Gene name | phosphorylase kinase, gamma 1 (muscle) | |
| Synonyms | PHKG | |
| Cytomap | UCSC genome browser: 7p11.2 | |
| Genomic location | chr7 :56148674-56160689 | |
| Type of gene | protein-coding | |
| RefGenes | NM_001258459.1, NM_001258460.1,NM_006213.4,NR_047689.1, | |
| Ensembl id | ENSG00000164776 | |
| Description | PHK-gamma-Mphosphorylase b kinase gamma catalytic chain, skeletal muscle isoformphosphorylase b kinase gamma catalytic chain, skeletal muscle/heart isoformphosphorylase kinase gammaphosphorylase kinase subunit gamma-1serine/threonine-protein kinase P | |
| Modification date | 20141207 | |
| dbXrefs | MIM : 172470 | |
| HGNC : HGNC | ||
| Ensembl : ENSG00000164776 | ||
| HPRD : 01404 | ||
| Protein | UniProt: go to UniProt's Cross Reference DB Table | |
| Expression | CleanEX: HS_PHKG1 | |
| BioGPS: 5260 | ||
| Gene Expression Atlas: ENSG00000164776 | ||
| The Human Protein Atlas: ENSG00000164776 | ||
| Pathway | NCI Pathway Interaction Database: PHKG1 | |
| KEGG: PHKG1 | ||
| REACTOME: PHKG1 | ||
| ConsensusPathDB | ||
| Pathway Commons: PHKG1 | ||
| Metabolism | MetaCyc: PHKG1 | |
| HUMANCyc: PHKG1 | ||
| Regulation | Ensembl's Regulation: ENSG00000164776 | |
| miRBase: chr7 :56,148,674-56,160,689 | ||
| TargetScan: NM_001258459 | ||
| cisRED: ENSG00000164776 | ||
| Context | iHOP: PHKG1 | |
| cancer metabolism search in PubMed: PHKG1 | ||
| UCL Cancer Institute: PHKG1 | ||
| Assigned class in ccmGDB | C | |
| Top |
| Phenotypic Information for PHKG1(metabolism pathway, cancer, disease, phenome) |
| Cancer | CGAP: PHKG1 |
| Familial Cancer Database: PHKG1 | |
| * This gene is included in those cancer gene databases. |
|
|
|
|
|
|
| ||||||||||||||||||||||||||||||||||||||||||||||||||||||||||||||||||||||||||||||||||||||||||||||||||||||||||||||||||||||||||||||||||||||||||||||||||||||||||||||||||||||||||||||||||||||||||||||||||||||||||||||||||||||||||||||||||||||||||||||||||||||||||||||||||||||||||||||||||||||||||||||||||||||||||||||||||||
Oncogene 1 | Significant driver gene in | |||||||||||||||||||||||||||||||||||||||||||||||||||||||||||||||||||||||||||||||||||||||||||||||||||||||||||||||||||||||||||||||||||||||||||||||||||||||||||||||||||||||||||||||||||||||||||||||||||||||||||||||||||||||||||||||||||||||||||||||||||||||||||||||||||||||||||||||||||||||||||||||||||||||||||||||||||||||||
| cf) number; DB name 1 Oncogene; http://nar.oxfordjournals.org/content/35/suppl_1/D721.long, 2 Tumor Suppressor gene; https://bioinfo.uth.edu/TSGene/, 3 Cancer Gene Census; http://www.nature.com/nrc/journal/v4/n3/abs/nrc1299.html, 4 CancerGenes; http://nar.oxfordjournals.org/content/35/suppl_1/D721.long, 5 Network of Cancer Gene; http://ncg.kcl.ac.uk/index.php, 1Therapeutic Vulnerabilities in Cancer; http://cbio.mskcc.org/cancergenomics/statius/ |
| REACTOME_METABOLISM_OF_CARBOHYDRATES REACTOME_GLUCOSE_METABOLISM | |
| OMIM | |
| Orphanet | |
| Disease | KEGG Disease: PHKG1 |
| MedGen: PHKG1 (Human Medical Genetics with Condition) | |
| ClinVar: PHKG1 | |
| Phenotype | MGI: PHKG1 (International Mouse Phenotyping Consortium) |
| PhenomicDB: PHKG1 | |
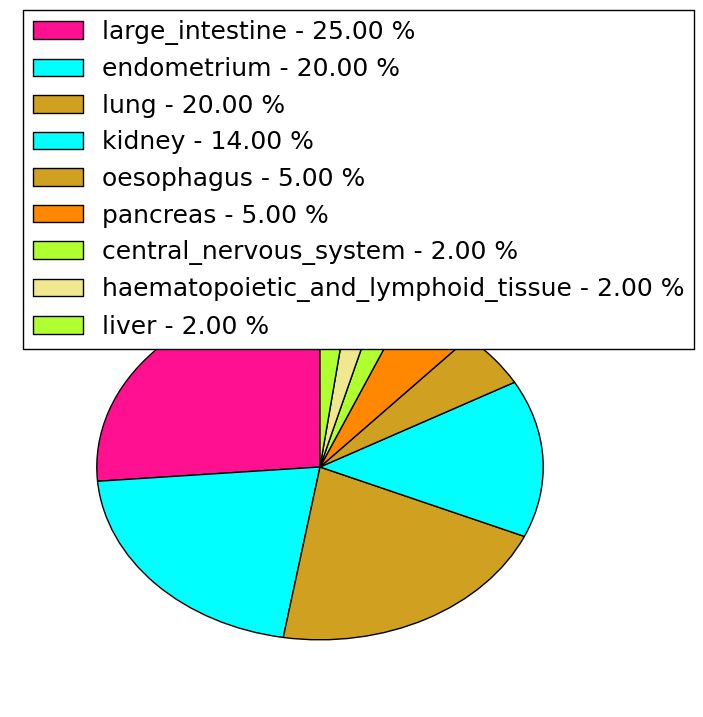
| Mutations for PHKG1 |
| * Under tables are showing count per each tissue to give us broad intuition about tissue specific mutation patterns.You can go to the detailed page for each mutation database's web site. |
| - Statistics for Tissue and Mutation type | Top |
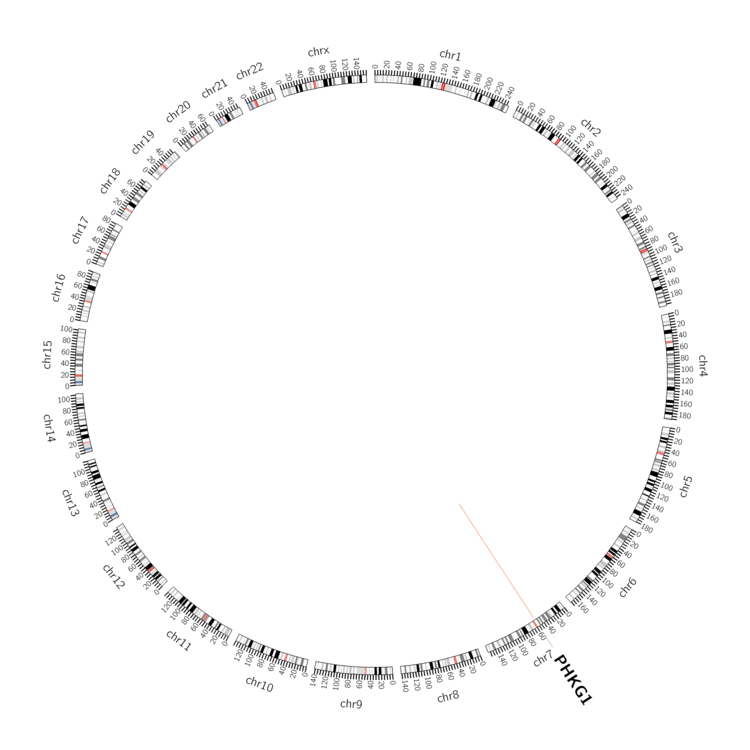 |
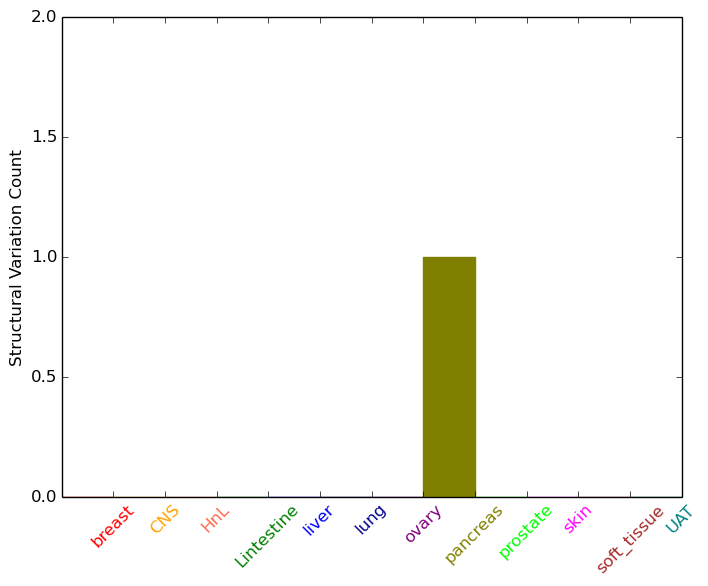
| - For Inter-chromosomal Variations |
| There's no inter-chromosomal structural variation. |
| - For Intra-chromosomal Variations |
| * Intra-chromosomal variantions includes 'intrachromosomal amplicon to amplicon', 'intrachromosomal amplicon to non-amplified dna', 'intrachromosomal deletion', 'intrachromosomal fold-back inversion', 'intrachromosomal inversion', 'intrachromosomal tandem duplication', 'Intrachromosomal unknown type', 'intrachromosomal with inverted orientation', 'intrachromosomal with non-inverted orientation'. |
 |
| Sample | Symbol_a | Chr_a | Start_a | End_a | Symbol_b | Chr_b | Start_b | End_b |
| pancreas | PHKG1 | chr7 | 56156964 | 56156984 | PHKG1 | chr7 | 56157321 | 56157341 |
| cf) Tissue number; Tissue name (1;Breast, 2;Central_nervous_system, 3;Haematopoietic_and_lymphoid_tissue, 4;Large_intestine, 5;Liver, 6;Lung, 7;Ovary, 8;Pancreas, 9;Prostate, 10;Skin, 11;Soft_tissue, 12;Upper_aerodigestive_tract) |
| * From mRNA Sanger sequences, Chitars2.0 arranged chimeric transcripts. This table shows PHKG1 related fusion information. |
| ID | Head Gene | Tail Gene | Accession | Gene_a | qStart_a | qEnd_a | Chromosome_a | tStart_a | tEnd_a | Gene_a | qStart_a | qEnd_a | Chromosome_a | tStart_a | tEnd_a |
| Top |
| Mutation type/ Tissue ID | brca | cns | cerv | endome | haematopo | kidn | Lintest | liver | lung | ns | ovary | pancre | prost | skin | stoma | thyro | urina | |||
| Total # sample | 2 | |||||||||||||||||||
| GAIN (# sample) | 2 | |||||||||||||||||||
| LOSS (# sample) |
| cf) Tissue ID; Tissue type (1; Breast, 2; Central_nervous_system, 3; Cervix, 4; Endometrium, 5; Haematopoietic_and_lymphoid_tissue, 6; Kidney, 7; Large_intestine, 8; Liver, 9; Lung, 10; NS, 11; Ovary, 12; Pancreas, 13; Prostate, 14; Skin, 15; Stomach, 16; Thyroid, 17; Urinary_tract) |
| Top |
|
 |
| Top |
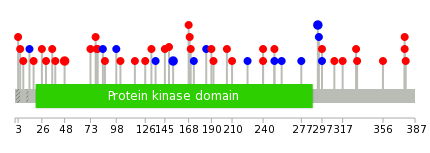
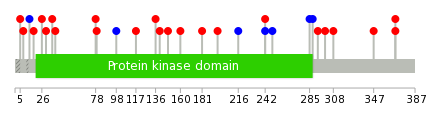
| Stat. for Non-Synonymous SNVs (# total SNVs=35) | (# total SNVs=11) |
 |  |
(# total SNVs=0) | (# total SNVs=0) |
| Top |
| * When you move the cursor on each content, you can see more deailed mutation information on the Tooltip. Those are primary_site,primary_histology,mutation(aa),pubmedID. |
| GRCh37 position | Mutation(aa) | Unique sampleID count |
| chr7:56149362-56149362 | p.V293V | 2 |
| chr7:56148781-56148781 | p.A377V | 2 |
| chr7:56155286-56155286 | p.? | 2 |
| chr7:56151059-56151059 | p.P153P | 2 |
| chr7:56149352-56149352 | p.R297W | 1 |
| chr7:56155317-56155317 | p.R79H | 1 |
| chr7:56149880-56149880 | p.P205L | 1 |
| chr7:56156613-56156613 | p.P8S | 1 |
| chr7:56151110-56151110 | p.E136E | 1 |
| chr7:56149359-56149359 | p.E294E | 1 |
| Top |
|
 |
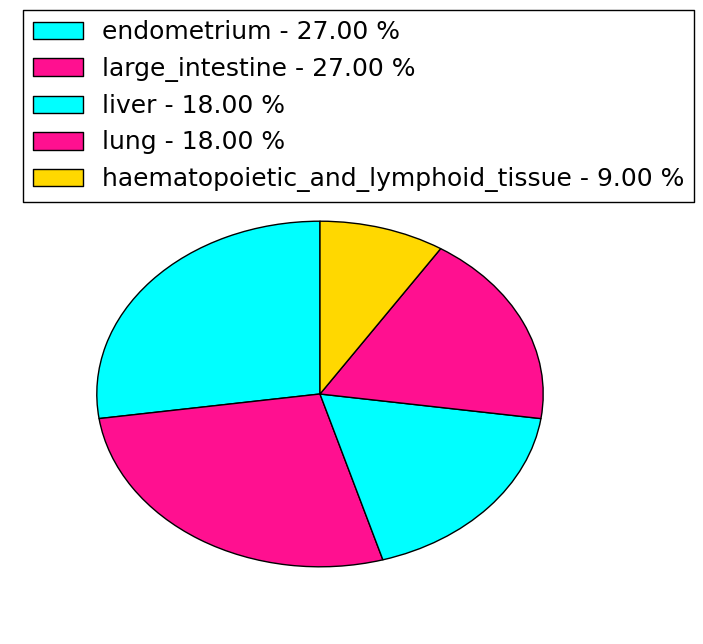
| Point Mutation/ Tissue ID | 1 | 2 | 3 | 4 | 5 | 6 | 7 | 8 | 9 | 10 | 11 | 12 | 13 | 14 | 15 | 16 | 17 | 18 | 19 | 20 |
| # sample | 3 | 1 | 3 | 4 | 2 | 3 | 3 | 7 | ||||||||||||
| # mutation | 3 | 1 | 3 | 4 | 2 | 3 | 3 | 10 | ||||||||||||
| nonsynonymous SNV | 3 | 1 | 3 | 3 | 2 | 1 | 2 | 7 | ||||||||||||
| synonymous SNV | 1 | 2 | 1 | 3 |
| cf) Tissue ID; Tissue type (1; BLCA[Bladder Urothelial Carcinoma], 2; BRCA[Breast invasive carcinoma], 3; CESC[Cervical squamous cell carcinoma and endocervical adenocarcinoma], 4; COAD[Colon adenocarcinoma], 5; GBM[Glioblastoma multiforme], 6; Glioma Low Grade, 7; HNSC[Head and Neck squamous cell carcinoma], 8; KICH[Kidney Chromophobe], 9; KIRC[Kidney renal clear cell carcinoma], 10; KIRP[Kidney renal papillary cell carcinoma], 11; LAML[Acute Myeloid Leukemia], 12; LUAD[Lung adenocarcinoma], 13; LUSC[Lung squamous cell carcinoma], 14; OV[Ovarian serous cystadenocarcinoma ], 15; PAAD[Pancreatic adenocarcinoma], 16; PRAD[Prostate adenocarcinoma], 17; SKCM[Skin Cutaneous Melanoma], 18:STAD[Stomach adenocarcinoma], 19:THCA[Thyroid carcinoma], 20:UCEC[Uterine Corpus Endometrial Carcinoma]) |
| Top |
| * We represented just top 10 SNVs. When you move the cursor on each content, you can see more deailed mutation information on the Tooltip. Those are primary_site, primary_histology, mutation(aa), pubmedID. |
| Genomic Position | Mutation(aa) | Unique sampleID count |
| chr7:56148781 | p.A368V,PHKG1 | 2 |
| chr7:56149625 | p.S249S,PHKG1 | 1 |
| chr7:56155317 | p.V30I,PHKG1 | 1 |
| chr7:56149626 | p.S242S,PHKG1 | 1 |
| chr7:56155321 | p.L26M,PHKG1 | 1 |
| chr7:56149703 | p.S242L,PHKG1 | 1 |
| chr7:56155438 | p.E18Q,PHKG1 | 1 |
| chr7:56149880 | p.A216A,PHKG1 | 1 |
| chr7:56155447 | p.Q14Q,PHKG1 | 1 |
| chr7:56148844 | p.P196L,PHKG1 | 1 |
| * Copy number data were extracted from TCGA using R package TCGA-Assembler. The URLs of all public data files on TCGA DCC data server were gathered on Jan-05-2015. Function ProcessCNAData in TCGA-Assembler package was used to obtain gene-level copy number value which is calculated as the average copy number of the genomic region of a gene. |
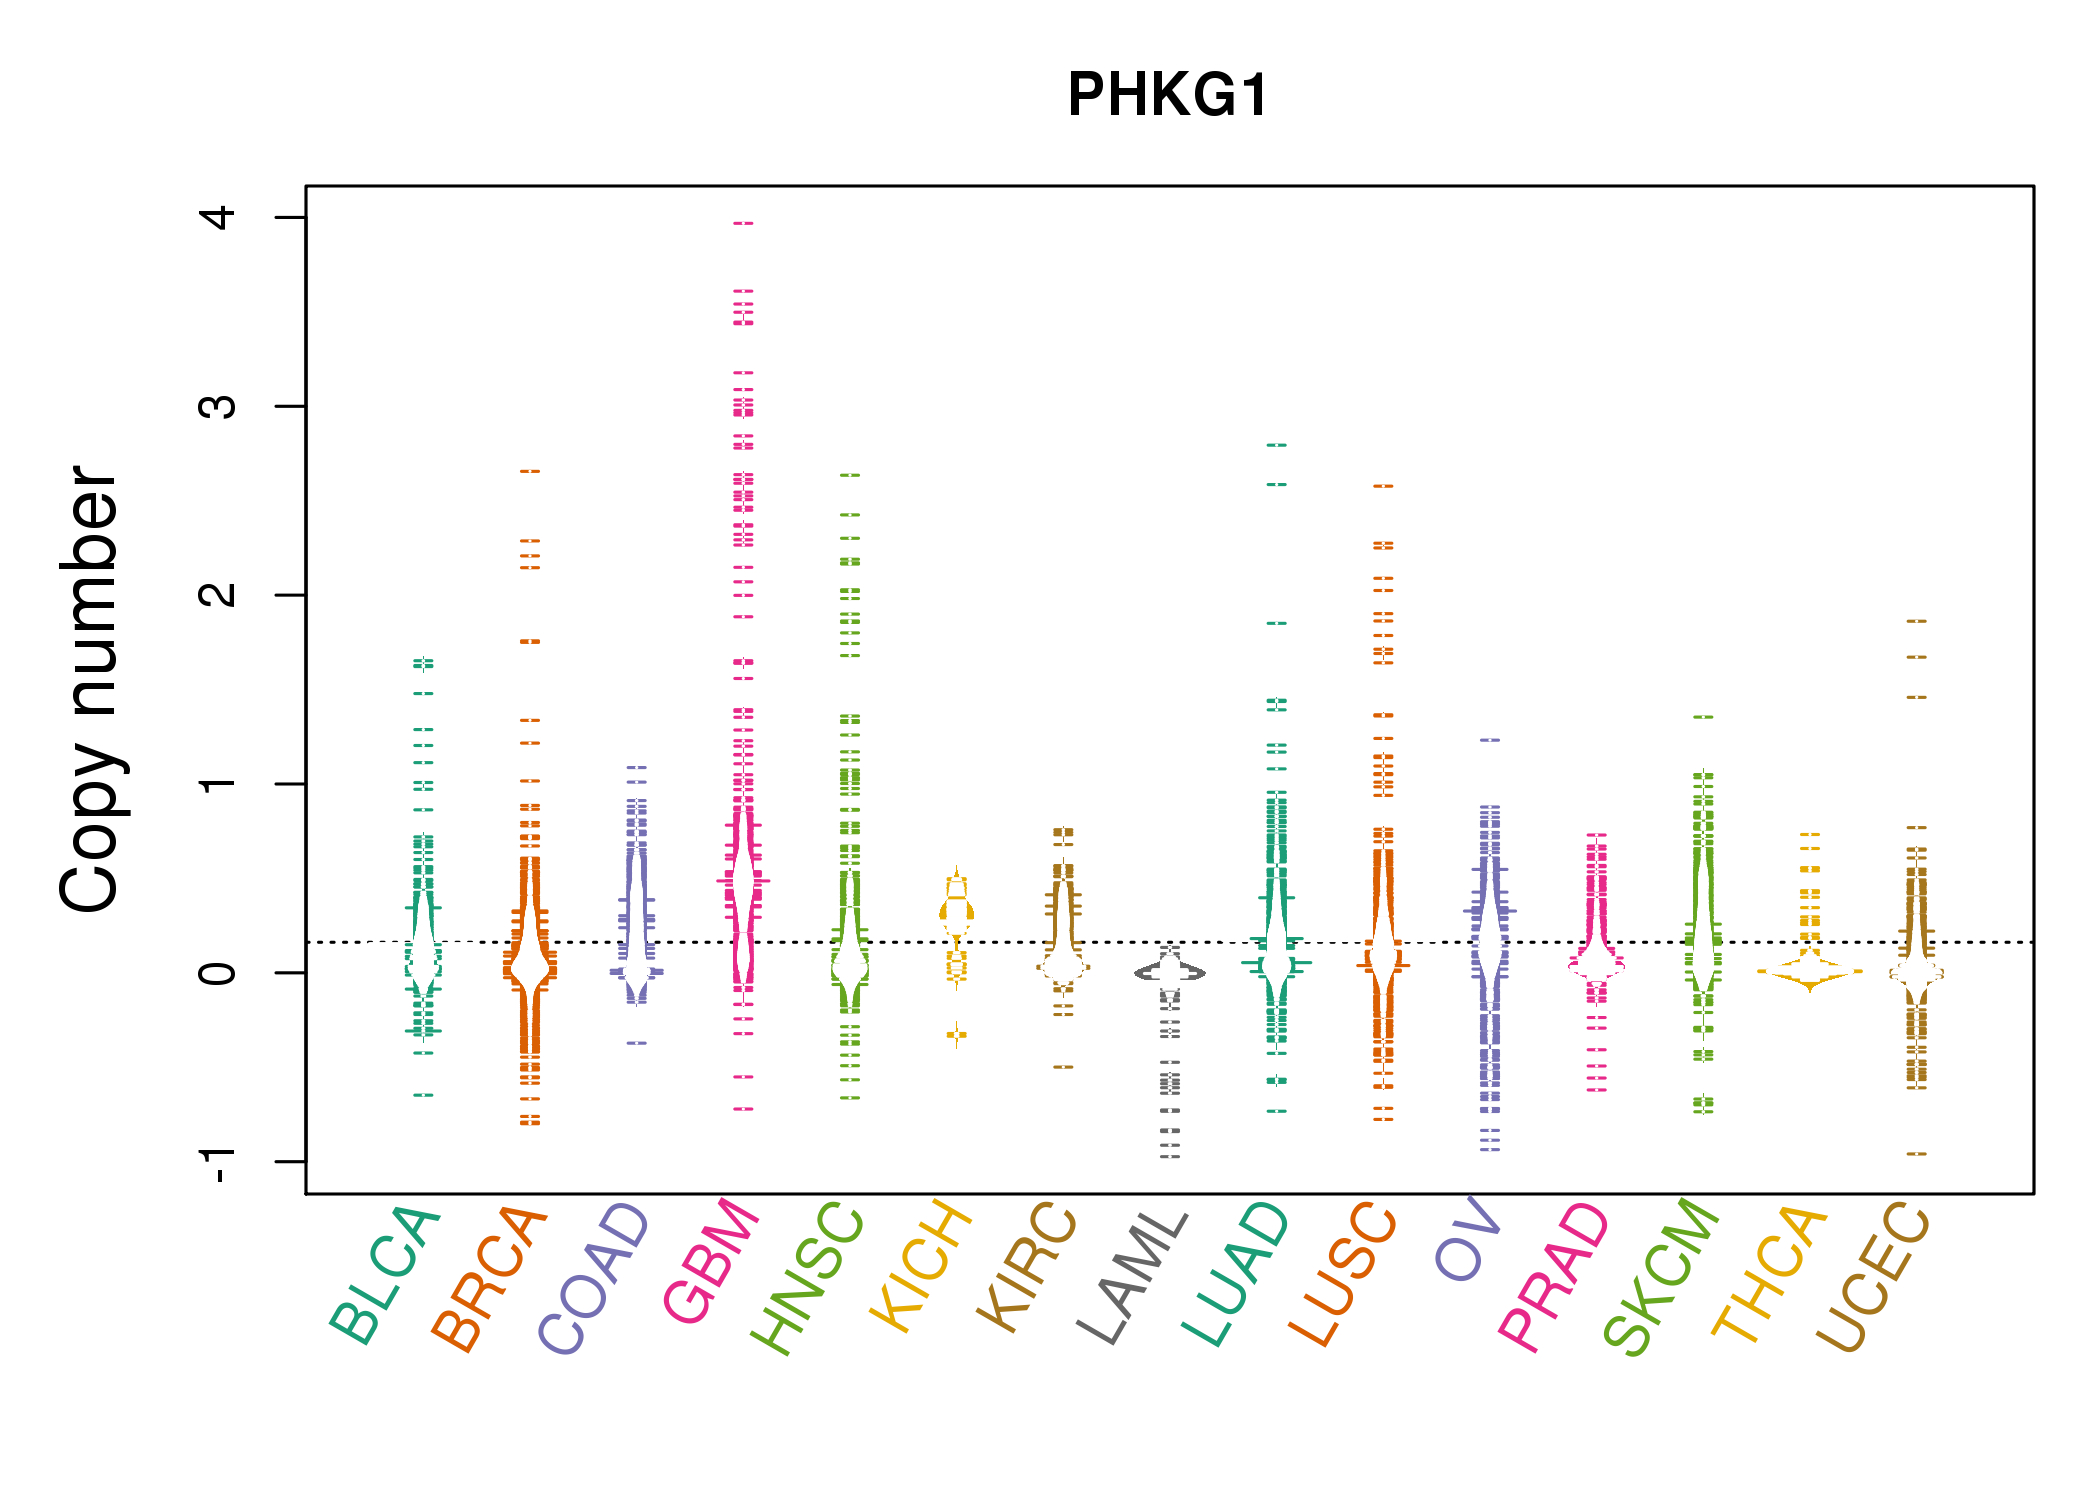 |
| cf) Tissue ID[Tissue type]: BLCA[Bladder Urothelial Carcinoma], BRCA[Breast invasive carcinoma], CESC[Cervical squamous cell carcinoma and endocervical adenocarcinoma], COAD[Colon adenocarcinoma], GBM[Glioblastoma multiforme], Glioma Low Grade, HNSC[Head and Neck squamous cell carcinoma], KICH[Kidney Chromophobe], KIRC[Kidney renal clear cell carcinoma], KIRP[Kidney renal papillary cell carcinoma], LAML[Acute Myeloid Leukemia], LUAD[Lung adenocarcinoma], LUSC[Lung squamous cell carcinoma], OV[Ovarian serous cystadenocarcinoma ], PAAD[Pancreatic adenocarcinoma], PRAD[Prostate adenocarcinoma], SKCM[Skin Cutaneous Melanoma], STAD[Stomach adenocarcinoma], THCA[Thyroid carcinoma], UCEC[Uterine Corpus Endometrial Carcinoma] |
| Top |
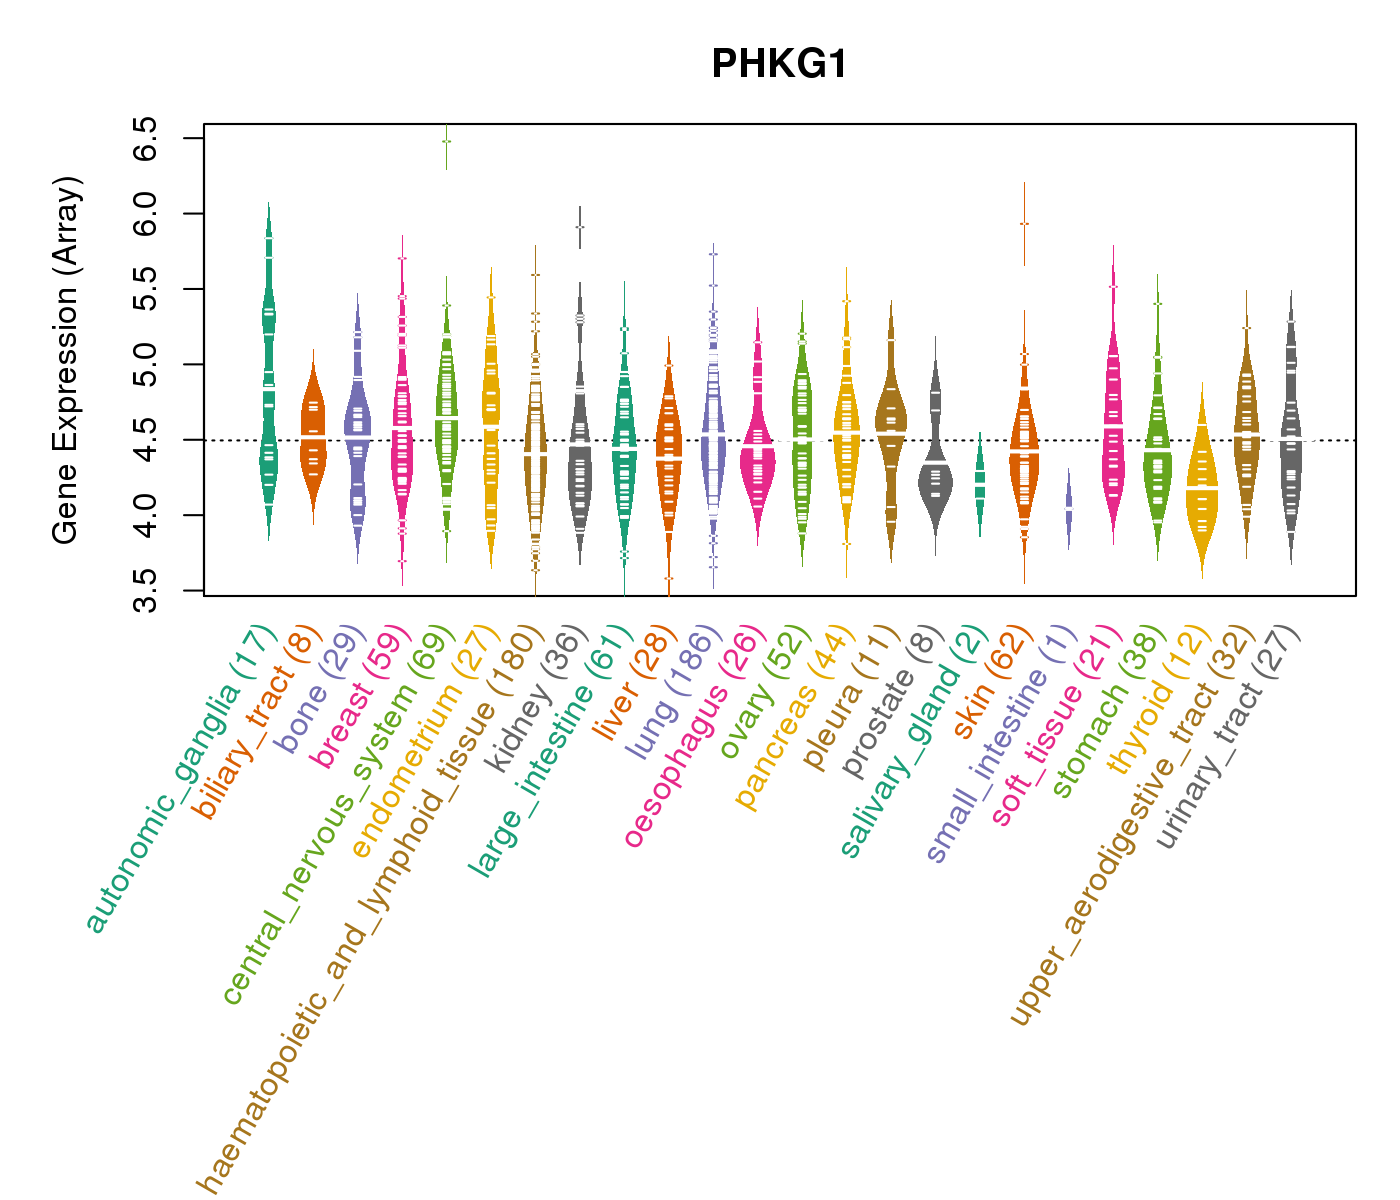
| Gene Expression for PHKG1 |
| * CCLE gene expression data were extracted from CCLE_Expression_Entrez_2012-10-18.res: Gene-centric RMA-normalized mRNA expression data. |
 |
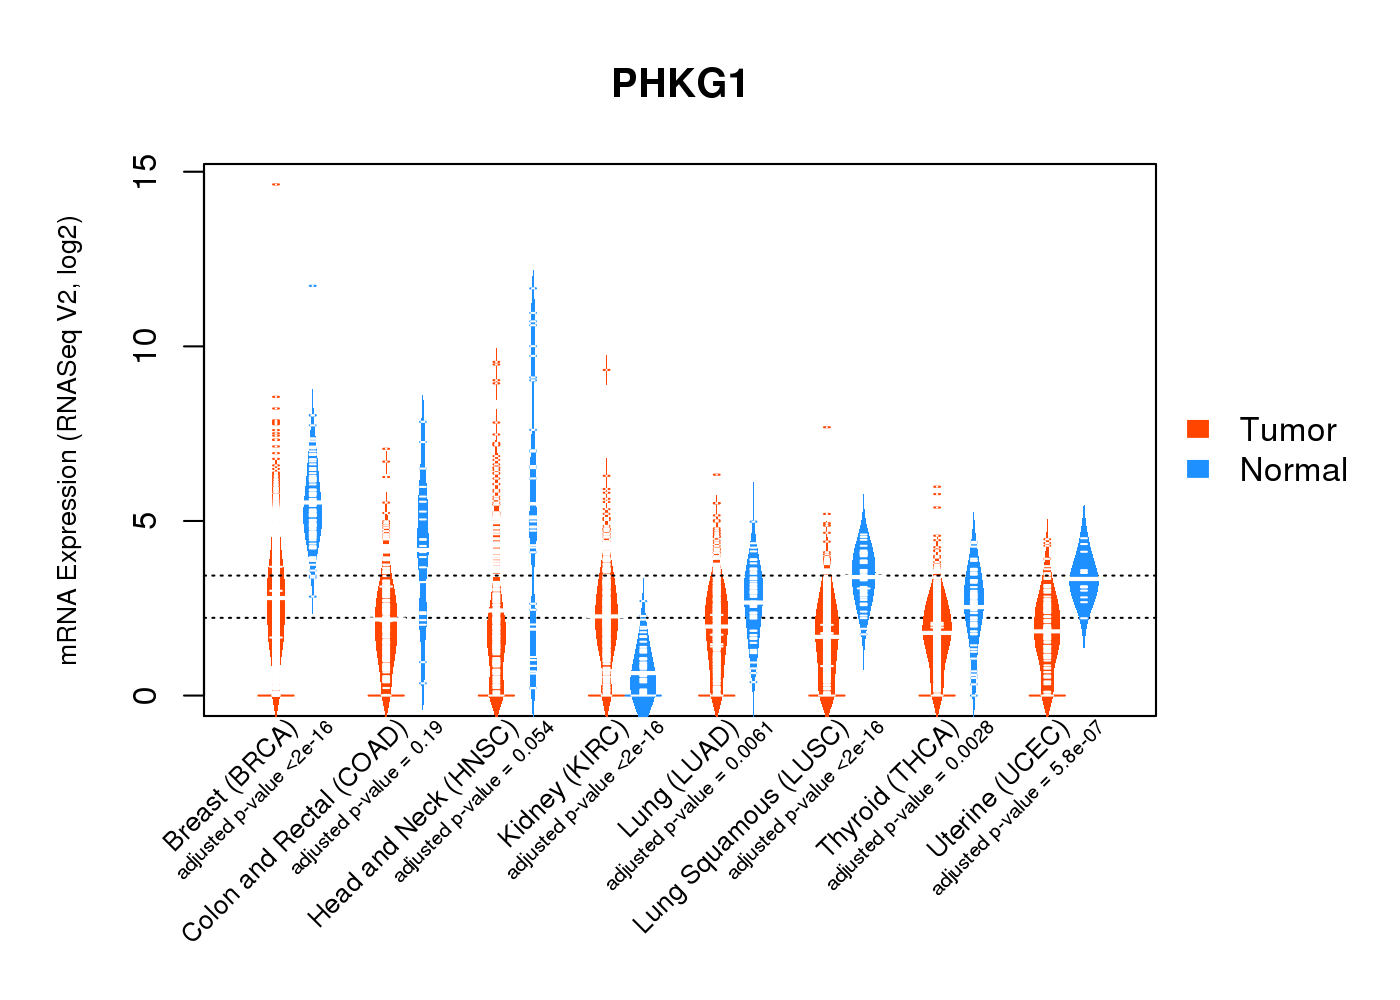
| * Normalized gene expression data of RNASeqV2 was extracted from TCGA using R package TCGA-Assembler. The URLs of all public data files on TCGA DCC data server were gathered at Jan-05-2015. Only eight cancer types have enough normal control samples for differential expression analysis. (t test, adjusted p<0.05 (using Benjamini-Hochberg FDR)) |
 |
| Top |
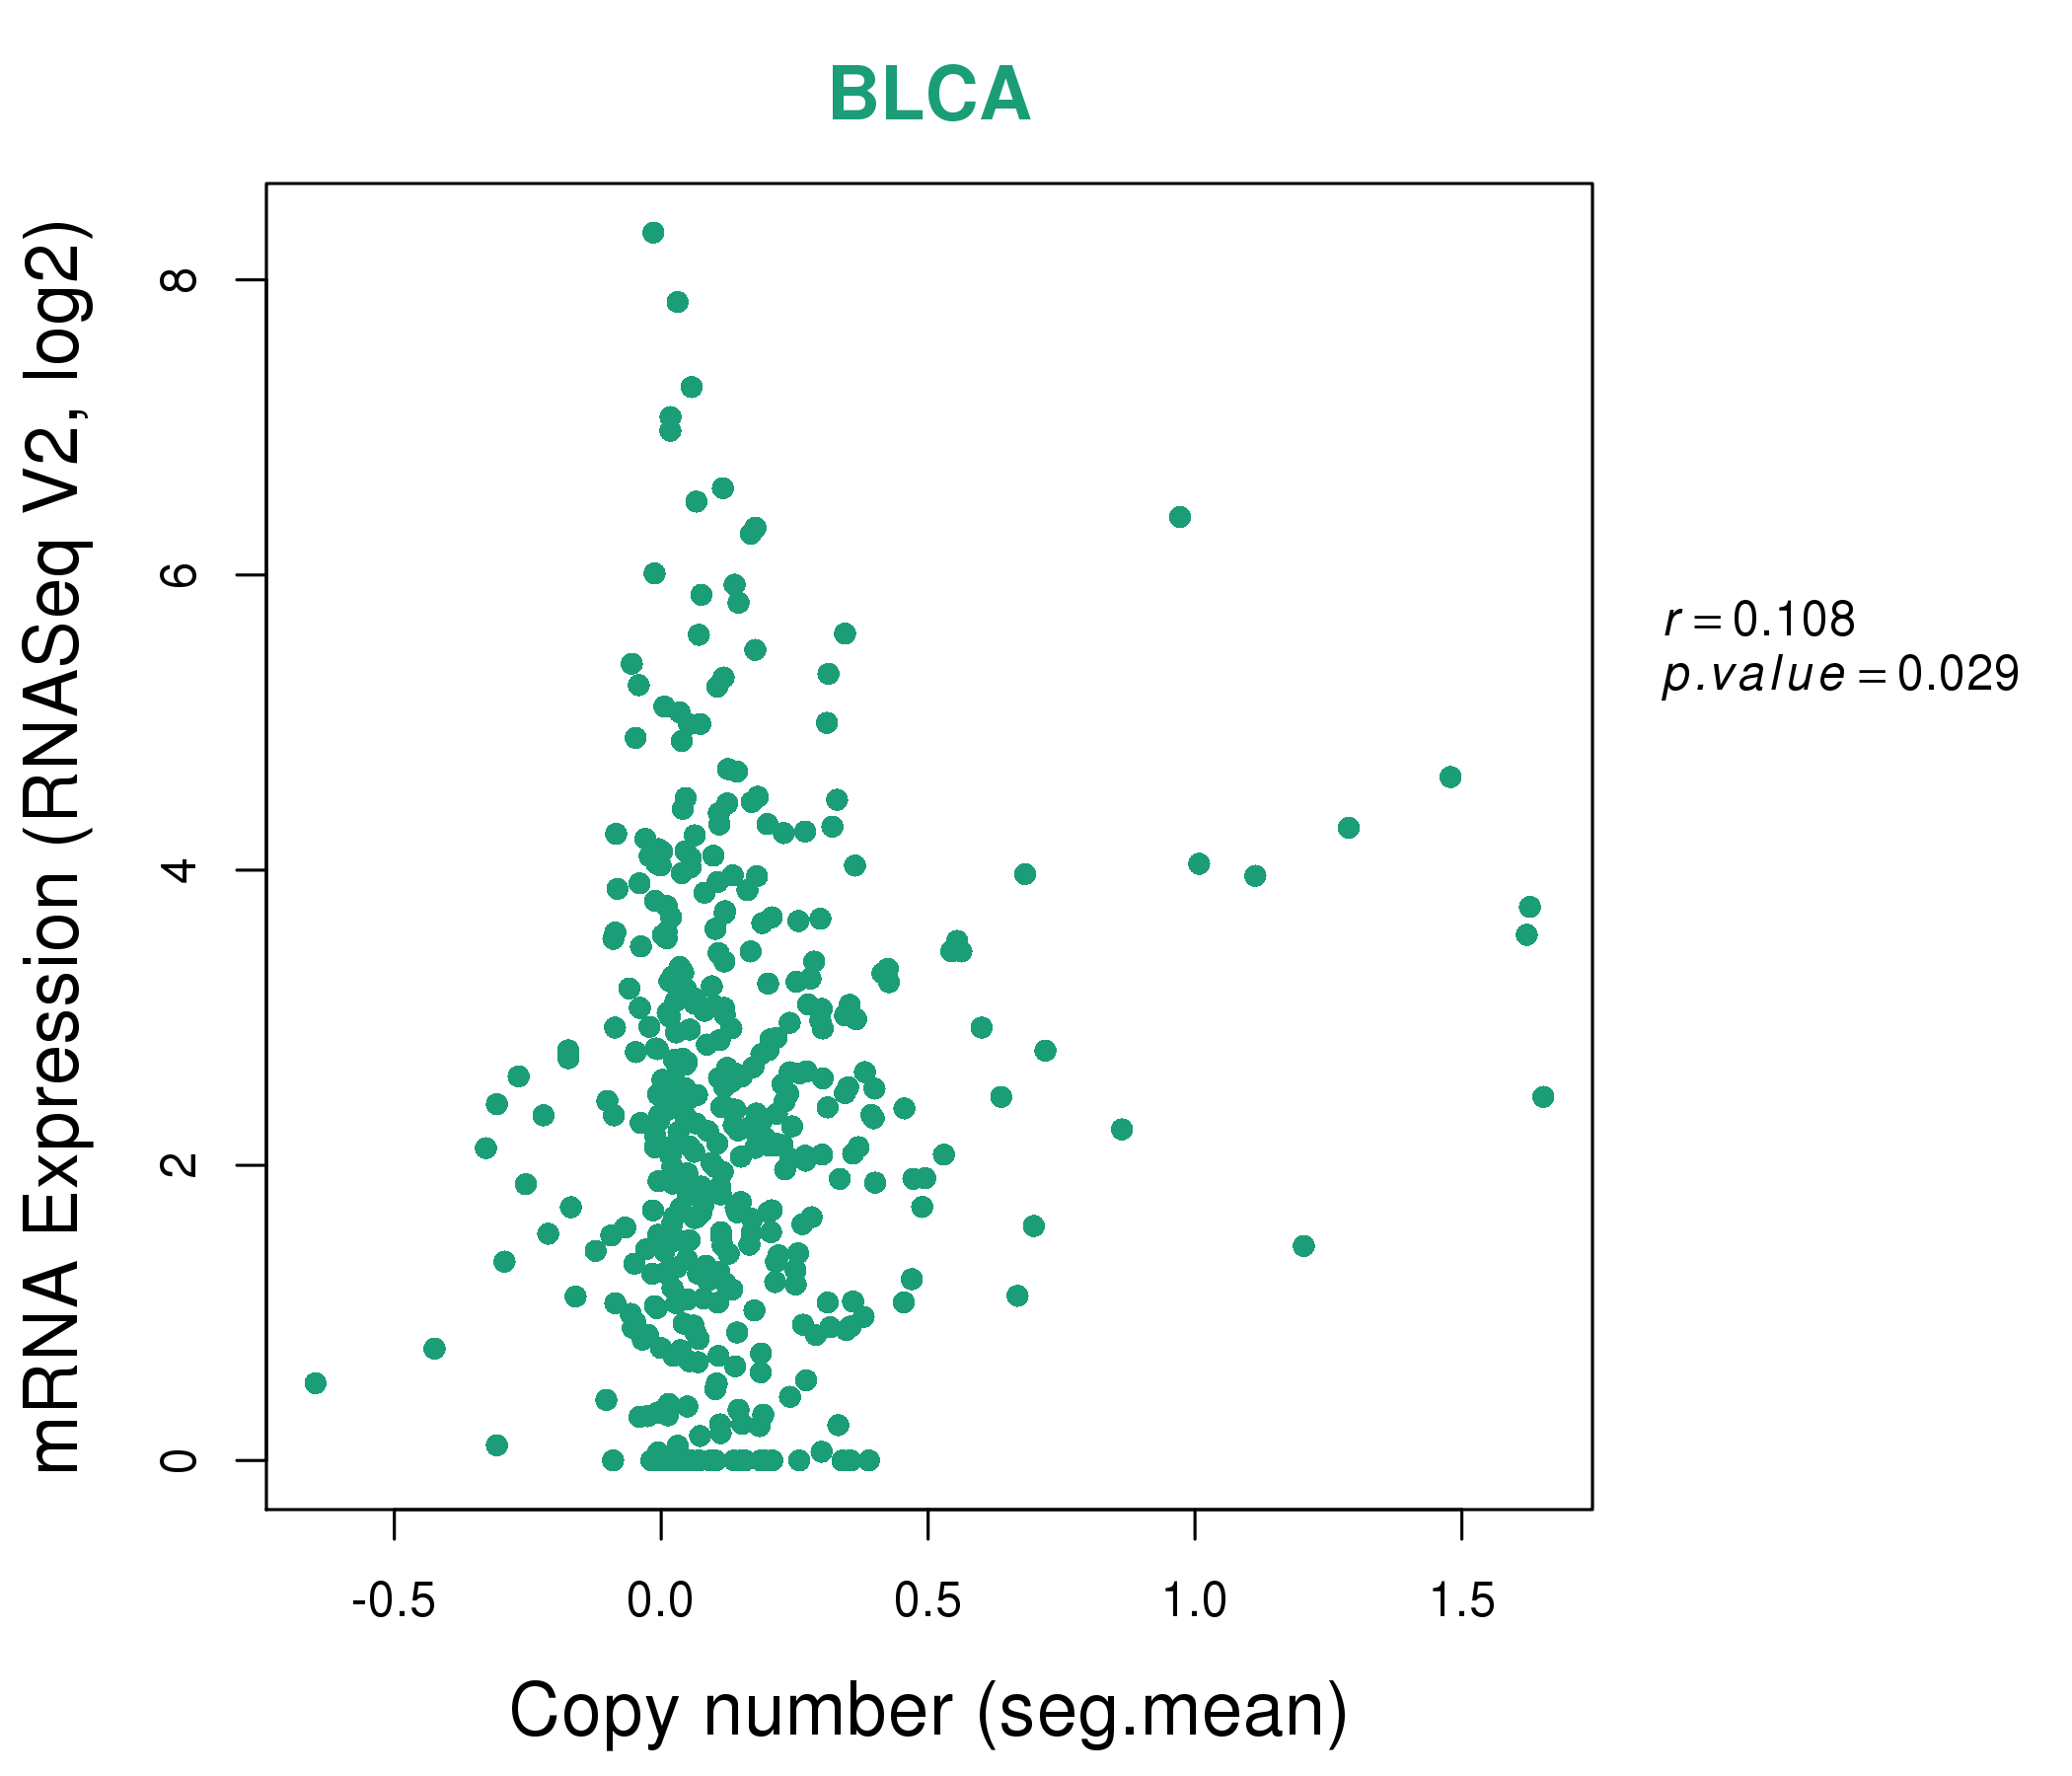
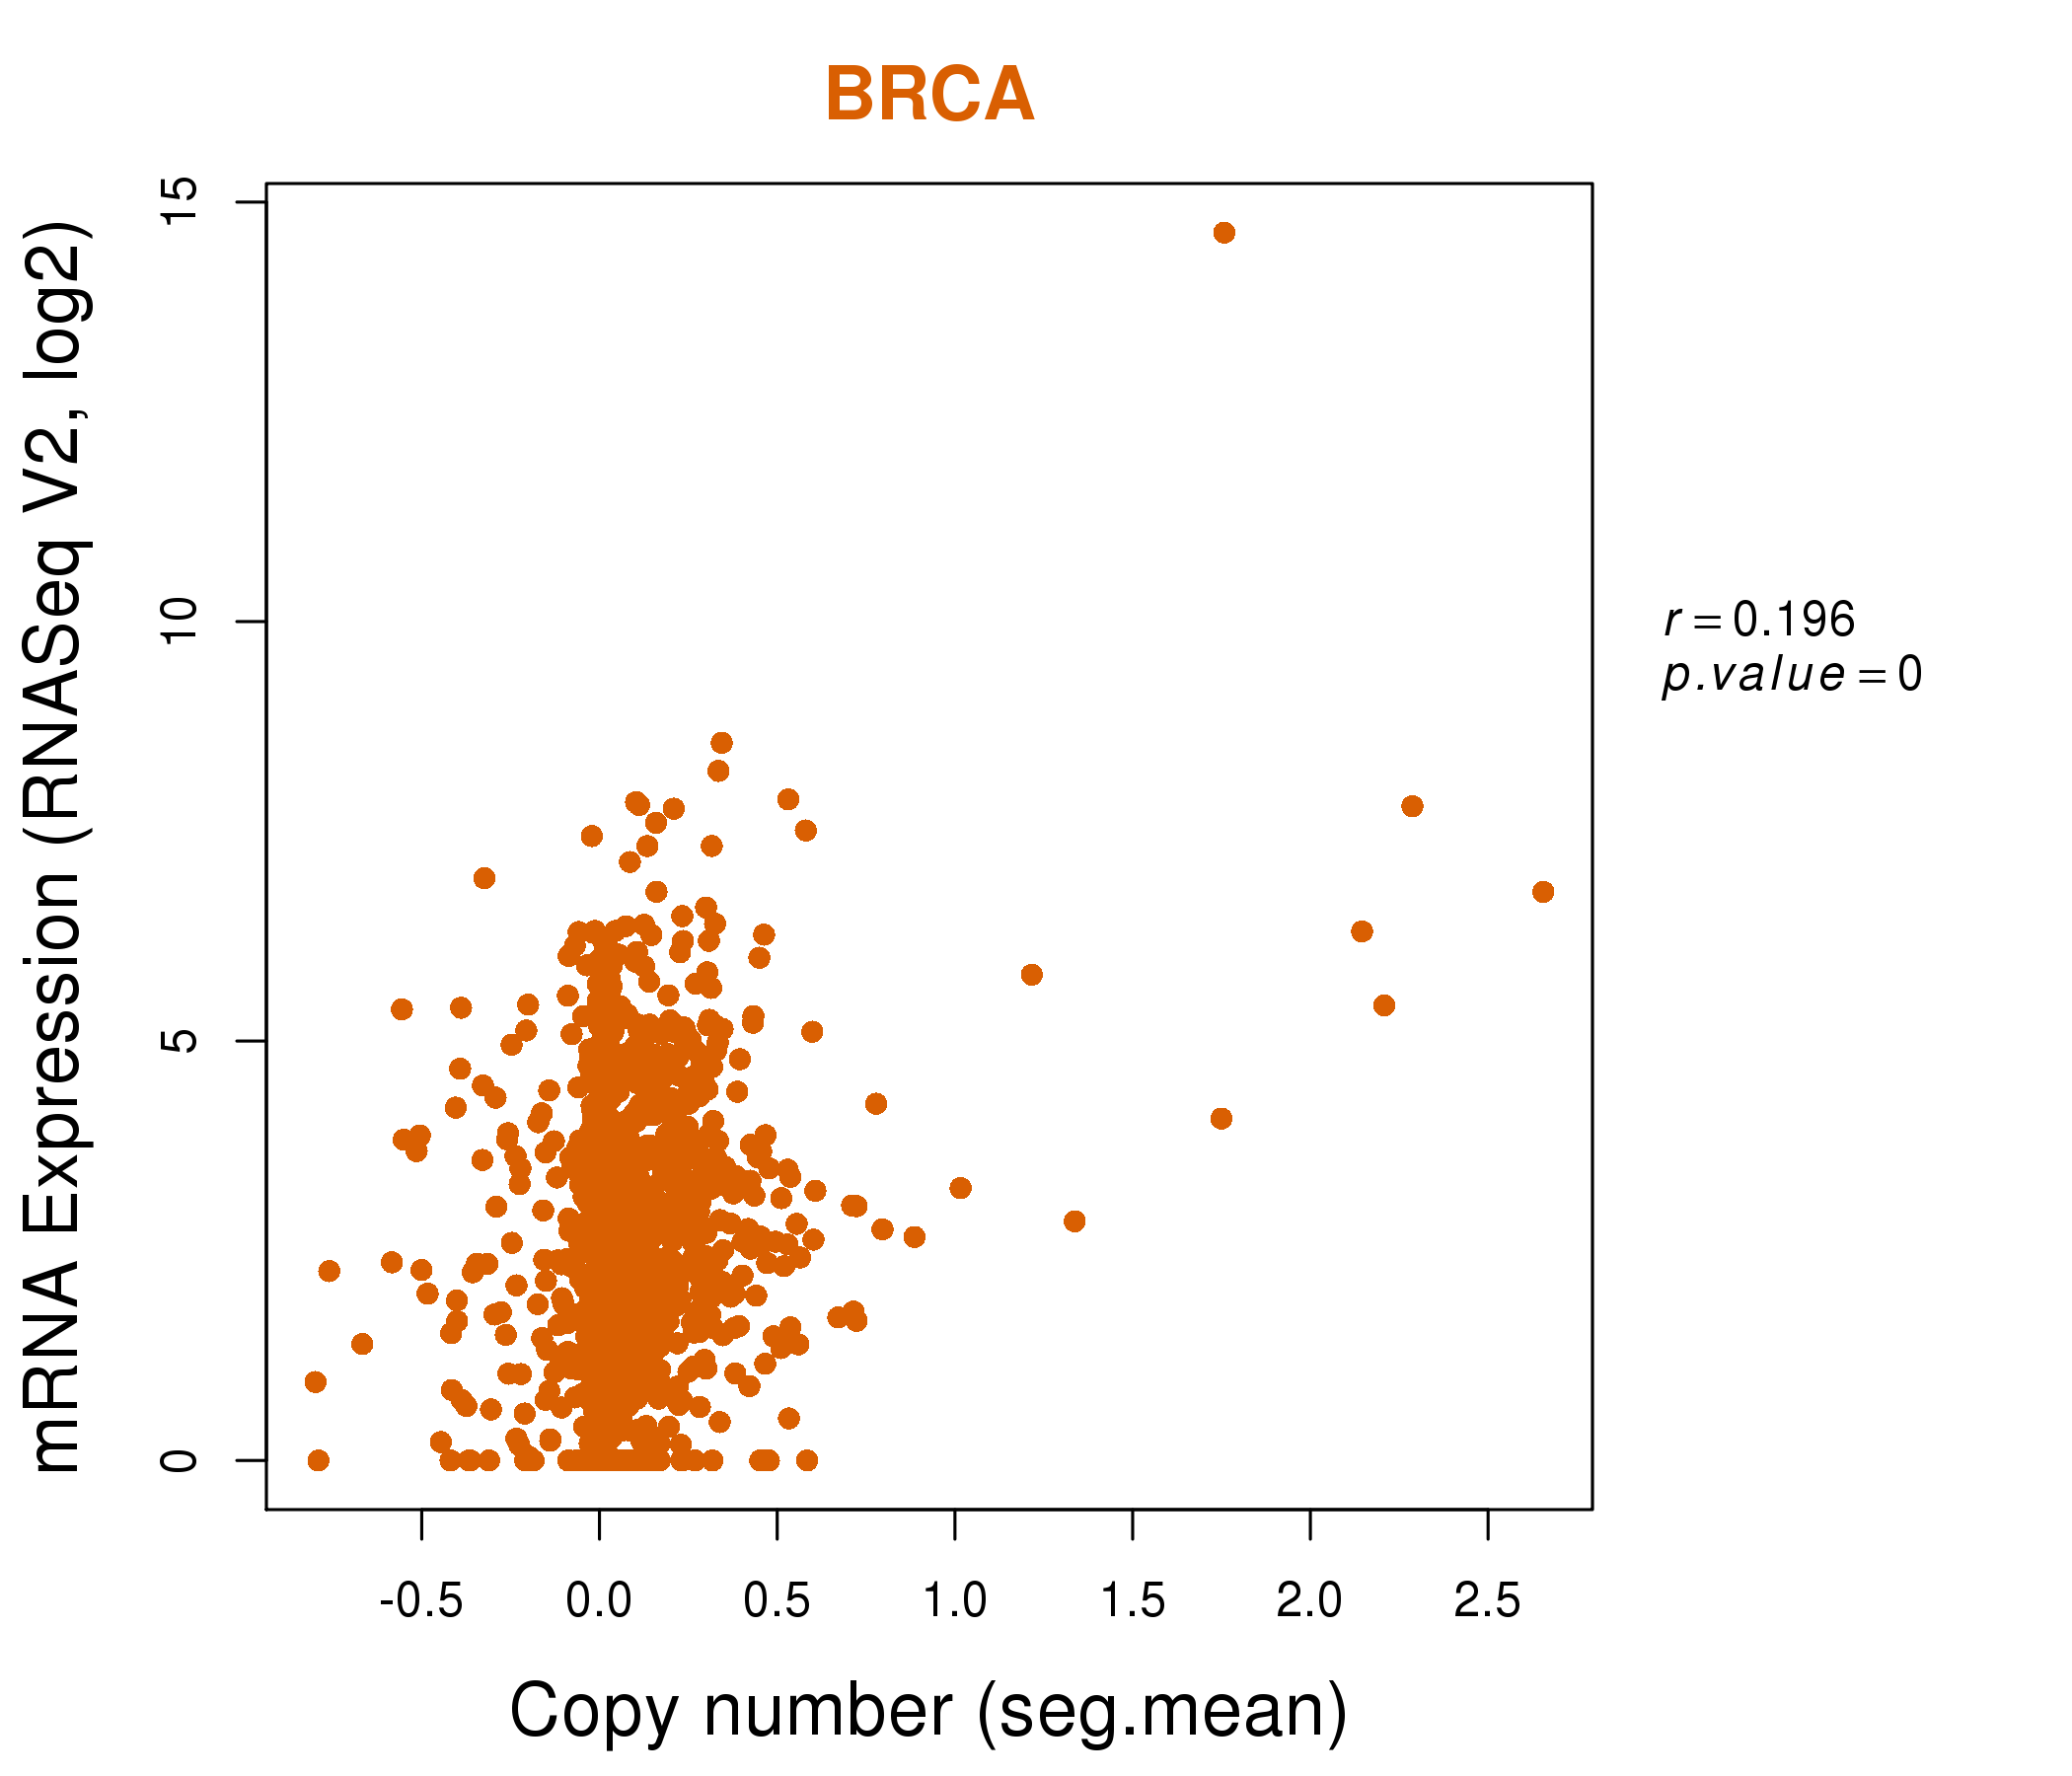
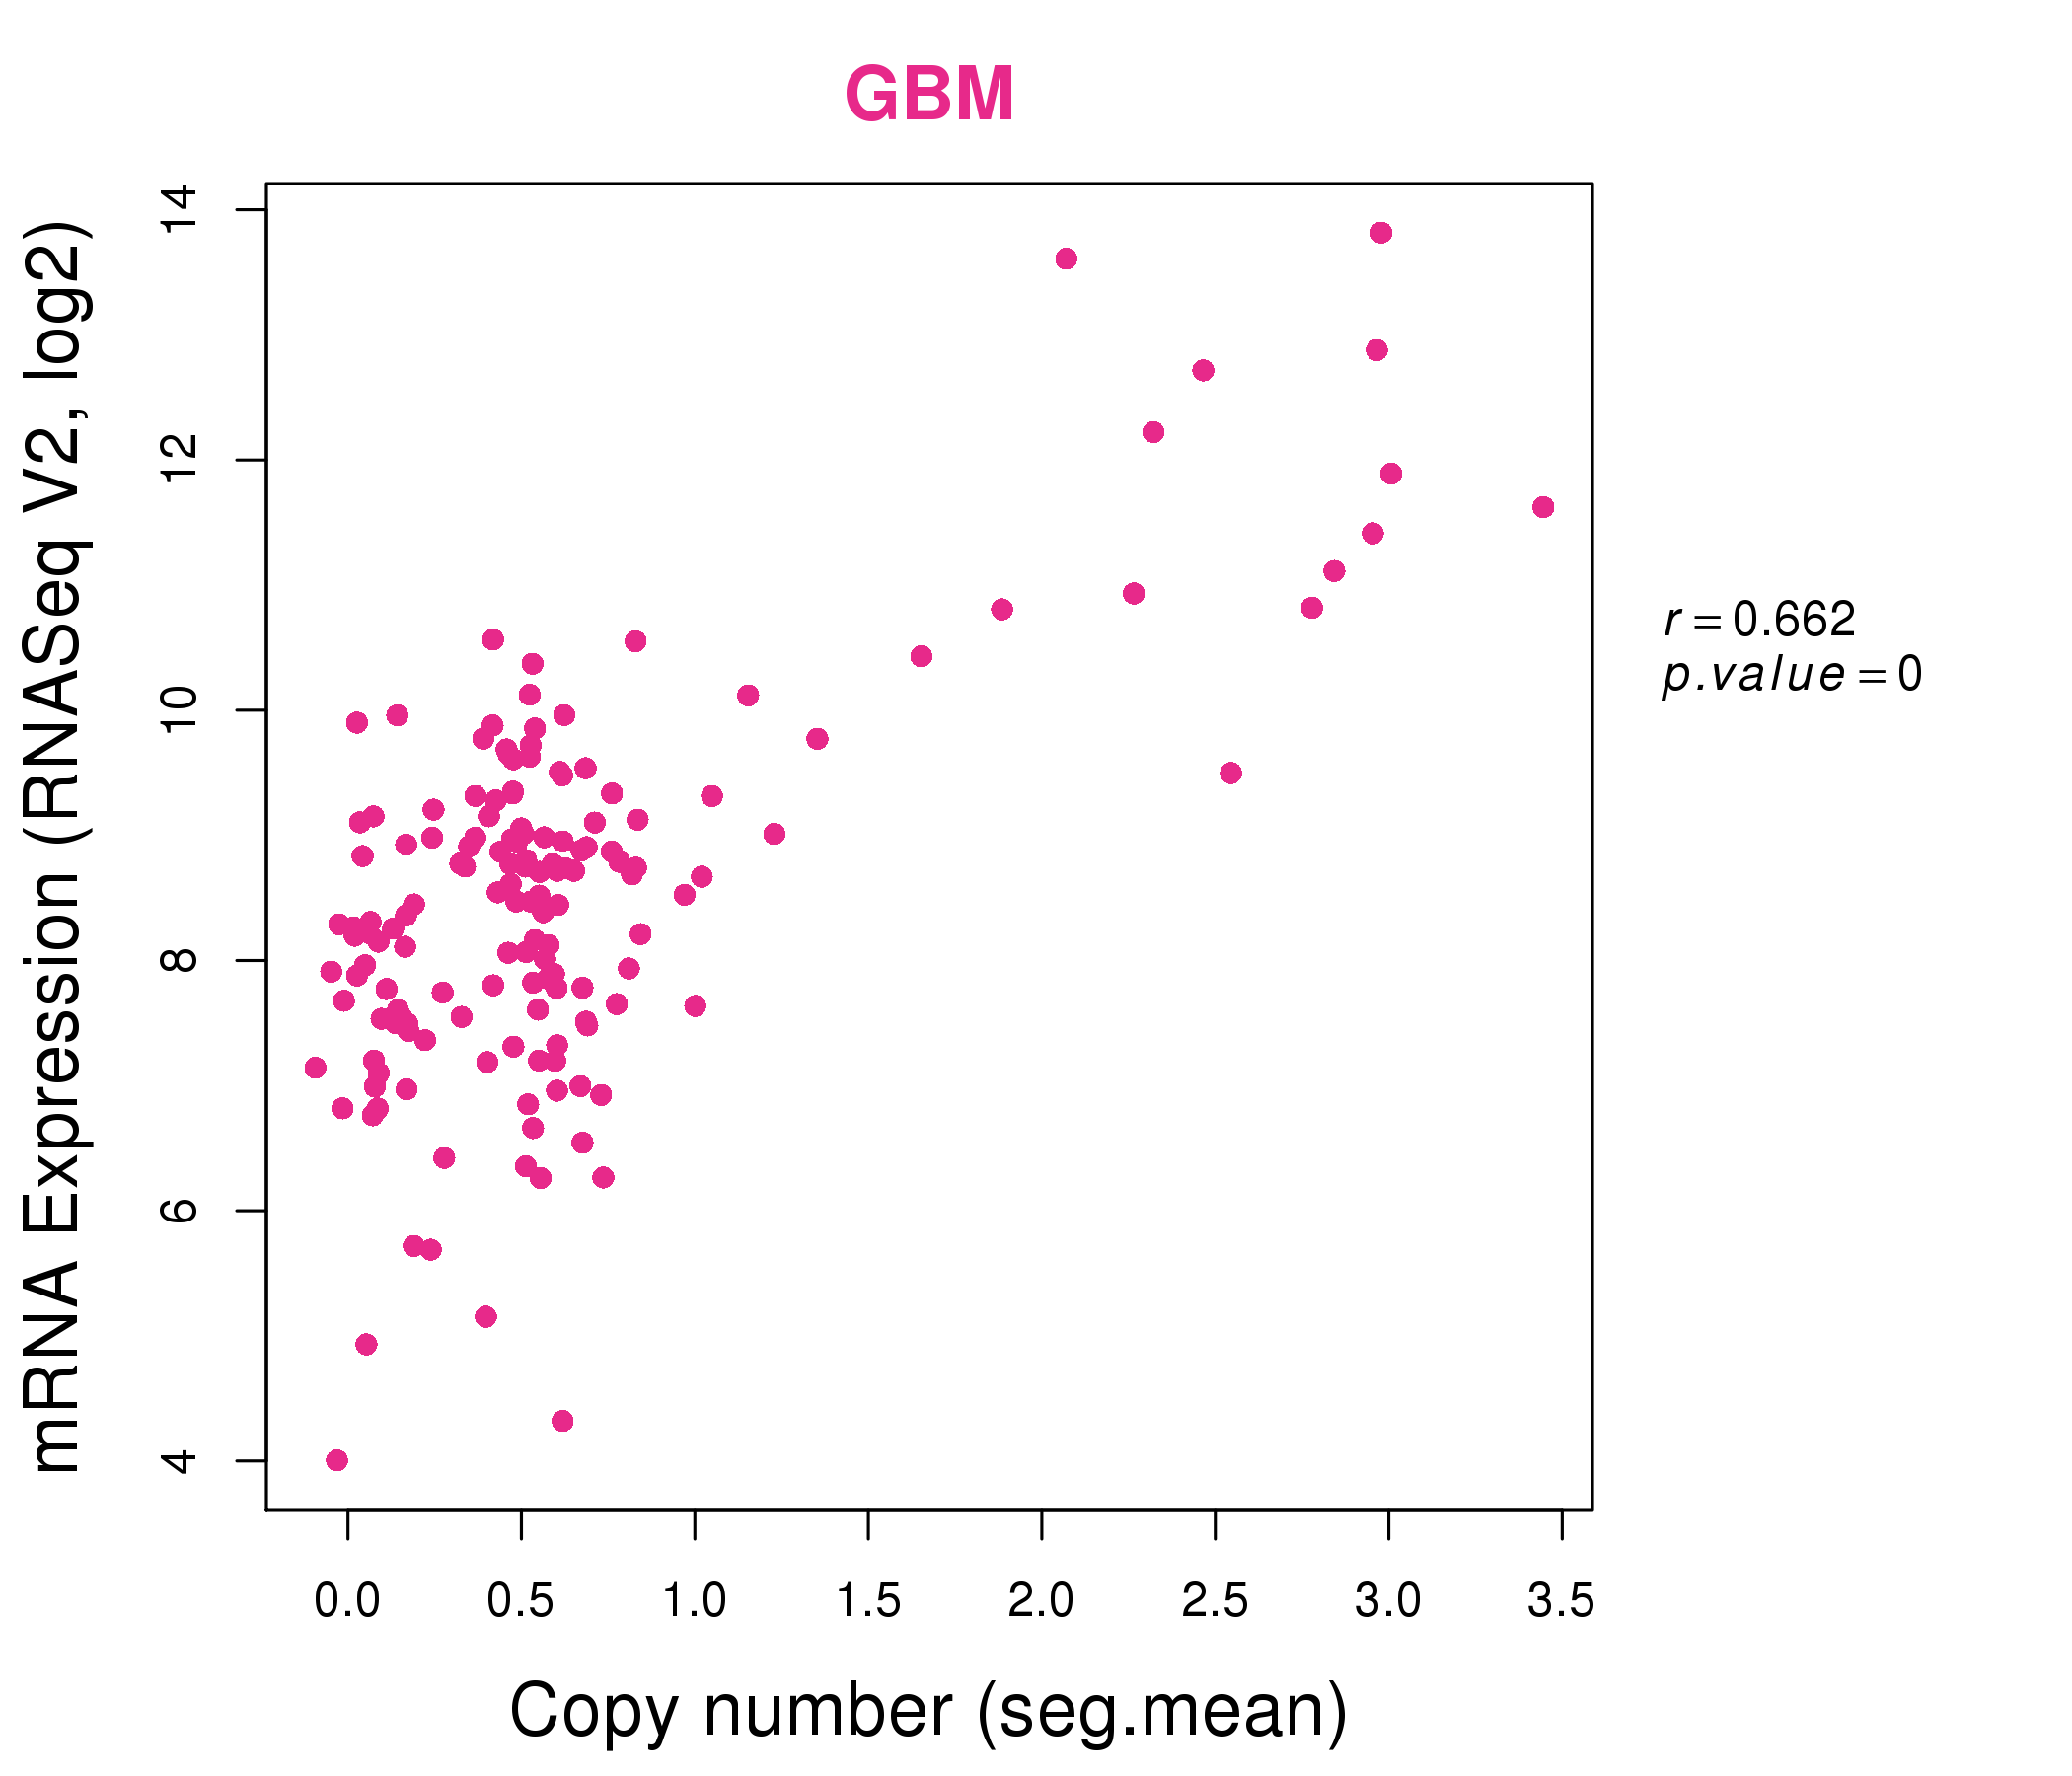
| * This plots show the correlation between CNV and gene expression. |
: Open all plots for all cancer types
 |
|
 |
|
| Top |
| Gene-Gene Network Information |
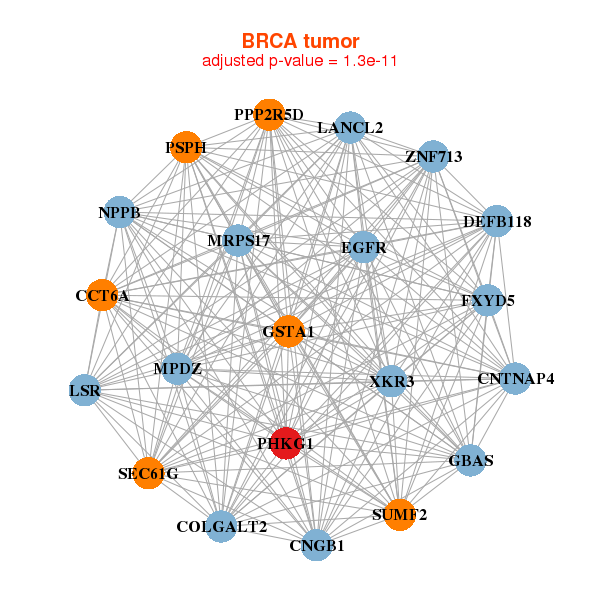
| * Co-Expression network figures were drawn using R package igraph. Only the top 20 genes with the highest correlations were shown. Red circle: input gene, orange circle: cell metabolism gene, sky circle: other gene |
: Open all plots for all cancer types
 |
|
| CCT6A,CNGB1,CNTNAP4,DEFB118,EGFR,FXYD5,GBAS, COLGALT2,GSTA1,LANCL2,LSR,MPDZ,MRPS17,NPPB, PHKG1,PPP2R5D,PSPH,SEC61G,SUMF2,XKR3,ZNF713 | ABLIM2,ADSSL1,BIN1,CKMT2,CLIC5,CLTCL1,CORO6, CUTC,DDIT4L,ENAM,FNDC5,HRC,KLHL33,LRRC2, MYOM1,PDE4DIP,PHKG1,PPAPDC3,SYPL2,TRDN,TRIM7 |
 |
|
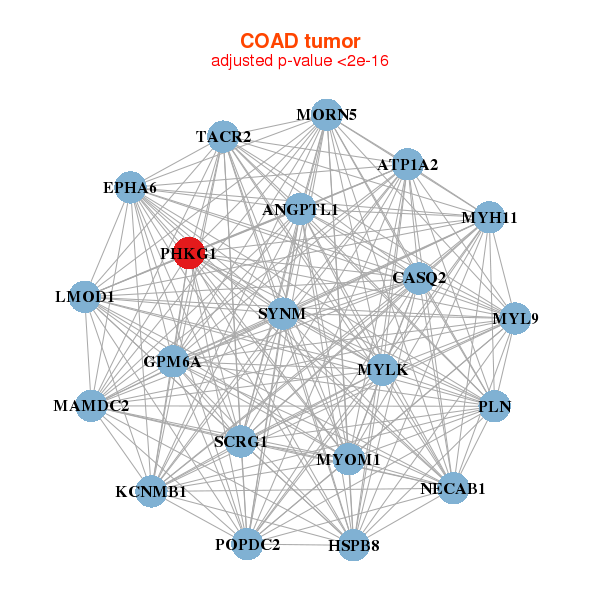
| ANGPTL1,ATP1A2,CASQ2,EPHA6,GPM6A,HSPB8,KCNMB1, LMOD1,MAMDC2,MORN5,MYH11,MYL9,MYLK,MYOM1, NECAB1,PHKG1,PLN,POPDC2,SCRG1,SYNM,TACR2 | BLVRA,C10orf107,CBR3,CCDC160,CDH19,COX7A1,GNB4, HTR1E,IL33,KCNMB2,LOC399959,LRRC4C,NGB,NKAIN4, NME4,PHKG1,S100B,SNCA,TMEM155,WDR86,WNT16 |


| * Co-Expression network figures were drawn using R package igraph. Only the top 20 genes with the highest correlations were shown. Red circle: input gene, orange circle: cell metabolism gene, sky circle: other gene |
: Open all plots for all cancer types
| Top |
: Open all interacting genes' information including KEGG pathway for all interacting genes from DAVID
| Top |
| Pharmacological Information for PHKG1 |
| There's no related Drug. |
| Top |
| Cross referenced IDs for PHKG1 |
| * We obtained these cross-references from Uniprot database. It covers 150 different DBs, 18 categories. http://www.uniprot.org/help/cross_references_section |
: Open all cross reference information
|
Copyright © 2016-Present - The Univsersity of Texas Health Science Center at Houston @ |