|
||||||||||||||||||||||||||||||||||||||||||||||||||||||||||||||||||||||||||||||||||||||||||||||||||||||||||||||||||||||||||||||||||||||||||||||||||||||||||||||||||||||||||||||||||||||||||||||||||||||||||||||||||||||||||||||||||||||||||||||||||||||||||||||||||||||||||||||||||||||||||||||||||
| |
| Phenotypic Information (metabolism pathway, cancer, disease, phenome) |
| |
| |
| Gene-Gene Network Information: Co-Expression Network, Interacting Genes & KEGG |
| |
|


| Gene Summary for PHKG2 |
| Basic gene info. | Gene symbol | PHKG2 |
| Gene name | phosphorylase kinase, gamma 2 (testis) | |
| Synonyms | GSD9C | |
| Cytomap | UCSC genome browser: 16p11.2 | |
| Genomic location | chr16 :30759619-30772497 | |
| Type of gene | protein-coding | |
| RefGenes | NM_000294.2, NM_001172432.1, | |
| Ensembl id | ENSG00000156873 | |
| Description | PHK-gamma-LTPHK-gamma-TPSK-C3Phosphorylase kinase, gamma 2 (testis/liver)phosphorylase b kinase gamma catalytic chain, liver/testis isoformphosphorylase b kinase gamma catalytic chain, testis/liver isoformphosphorylase kinase subunit gamma-2serine/ | |
| Modification date | 20141222 | |
| dbXrefs | MIM : 172471 | |
| HGNC : HGNC | ||
| Ensembl : ENSG00000156873 | ||
| HPRD : 01405 | ||
| Vega : OTTHUMG00000132400 | ||
| Protein | UniProt: P15735 go to UniProt's Cross Reference DB Table | |
| Expression | CleanEX: HS_PHKG2 | |
| BioGPS: 5261 | ||
| Gene Expression Atlas: ENSG00000156873 | ||
| The Human Protein Atlas: ENSG00000156873 | ||
| Pathway | NCI Pathway Interaction Database: PHKG2 | |
| KEGG: PHKG2 | ||
| REACTOME: PHKG2 | ||
| ConsensusPathDB | ||
| Pathway Commons: PHKG2 | ||
| Metabolism | MetaCyc: PHKG2 | |
| HUMANCyc: PHKG2 | ||
| Regulation | Ensembl's Regulation: ENSG00000156873 | |
| miRBase: chr16 :30,759,619-30,772,497 | ||
| TargetScan: NM_000294 | ||
| cisRED: ENSG00000156873 | ||
| Context | iHOP: PHKG2 | |
| cancer metabolism search in PubMed: PHKG2 | ||
| UCL Cancer Institute: PHKG2 | ||
| Assigned class in ccmGDB | B - This gene belongs to cancer gene. | |
| Top |
| Phenotypic Information for PHKG2(metabolism pathway, cancer, disease, phenome) |
| Cancer | CGAP: PHKG2 |
| Familial Cancer Database: PHKG2 | |
| * This gene is included in those cancer gene databases. |
|
|
|
|
|
|
| ||||||||||||||||||||||||||||||||||||||||||||||||||||||||||||||||||||||||||||||||||||||||||||||||||||||||||||||||||||||||||||||||||||||||||||||||||||||||||||||||||||||||||||||||||||||||||||||||||||||||||||||||||||||||||||||||||||||||||||||||||||||||||||||||||||||||||||||||||||||||||||
Oncogene 1 | Significant driver gene in | |||||||||||||||||||||||||||||||||||||||||||||||||||||||||||||||||||||||||||||||||||||||||||||||||||||||||||||||||||||||||||||||||||||||||||||||||||||||||||||||||||||||||||||||||||||||||||||||||||||||||||||||||||||||||||||||||||||||||||||||||||||||||||||||||||||||||||||||||||||||||||||||||
| cf) number; DB name 1 Oncogene; http://nar.oxfordjournals.org/content/35/suppl_1/D721.long, 2 Tumor Suppressor gene; https://bioinfo.uth.edu/TSGene/, 3 Cancer Gene Census; http://www.nature.com/nrc/journal/v4/n3/abs/nrc1299.html, 4 CancerGenes; http://nar.oxfordjournals.org/content/35/suppl_1/D721.long, 5 Network of Cancer Gene; http://ncg.kcl.ac.uk/index.php, 1Therapeutic Vulnerabilities in Cancer; http://cbio.mskcc.org/cancergenomics/statius/ |
| REACTOME_METABOLISM_OF_CARBOHYDRATES REACTOME_GLUCOSE_METABOLISM | |
| OMIM | 172471; gene. 613027; phenotype. |
| Orphanet | 264580; Glycogen storage disease due to liver phosphorylase kinase deficiency. |
| Disease | KEGG Disease: PHKG2 |
| MedGen: PHKG2 (Human Medical Genetics with Condition) | |
| ClinVar: PHKG2 | |
| Phenotype | MGI: PHKG2 (International Mouse Phenotyping Consortium) |
| PhenomicDB: PHKG2 | |
| Mutations for PHKG2 |
| * Under tables are showing count per each tissue to give us broad intuition about tissue specific mutation patterns.You can go to the detailed page for each mutation database's web site. |
| - Statistics for Tissue and Mutation type | Top |
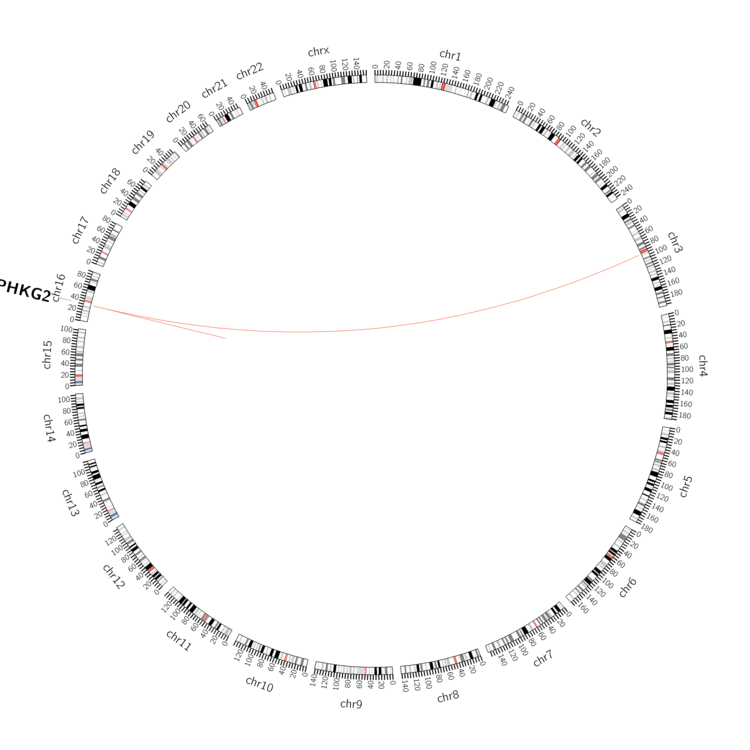 |
| - For Inter-chromosomal Variations |
| * Inter-chromosomal variantions includes 'interchromosomal amplicon to amplicon', 'interchromosomal amplicon to non-amplified dna', 'interchromosomal insertion', 'Interchromosomal unknown type'. |
 |
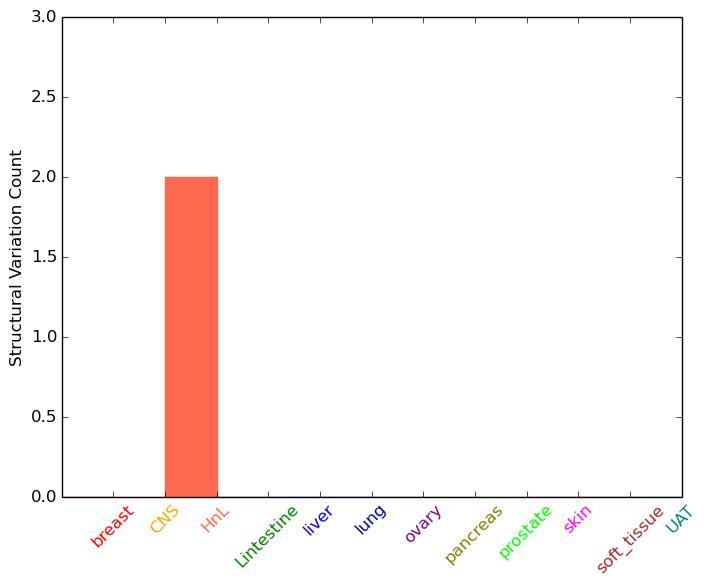
| - For Intra-chromosomal Variations |
| * Intra-chromosomal variantions includes 'intrachromosomal amplicon to amplicon', 'intrachromosomal amplicon to non-amplified dna', 'intrachromosomal deletion', 'intrachromosomal fold-back inversion', 'intrachromosomal inversion', 'intrachromosomal tandem duplication', 'Intrachromosomal unknown type', 'intrachromosomal with inverted orientation', 'intrachromosomal with non-inverted orientation'. |
 |
| Sample | Symbol_a | Chr_a | Start_a | End_a | Symbol_b | Chr_b | Start_b | End_b |
| haematopoietic_and_lymphoid_tissue | PHKG2 | chr16 | 30763283 | 30763283 | PHKG2 | chr16 | 30763283 | 30763283 |
| cf) Tissue number; Tissue name (1;Breast, 2;Central_nervous_system, 3;Haematopoietic_and_lymphoid_tissue, 4;Large_intestine, 5;Liver, 6;Lung, 7;Ovary, 8;Pancreas, 9;Prostate, 10;Skin, 11;Soft_tissue, 12;Upper_aerodigestive_tract) |
| * From mRNA Sanger sequences, Chitars2.0 arranged chimeric transcripts. This table shows PHKG2 related fusion information. |
| ID | Head Gene | Tail Gene | Accession | Gene_a | qStart_a | qEnd_a | Chromosome_a | tStart_a | tEnd_a | Gene_a | qStart_a | qEnd_a | Chromosome_a | tStart_a | tEnd_a |
| BF853022 | C16orf93 | 3 | 305 | 16 | 30772598 | 30772901 | PHKG2 | 299 | 416 | 16 | 30768842 | 30768958 | |
| Top |
| Mutation type/ Tissue ID | brca | cns | cerv | endome | haematopo | kidn | Lintest | liver | lung | ns | ovary | pancre | prost | skin | stoma | thyro | urina | |||
| Total # sample | 1 | 1 | ||||||||||||||||||
| GAIN (# sample) | 1 | |||||||||||||||||||
| LOSS (# sample) | 1 |
| cf) Tissue ID; Tissue type (1; Breast, 2; Central_nervous_system, 3; Cervix, 4; Endometrium, 5; Haematopoietic_and_lymphoid_tissue, 6; Kidney, 7; Large_intestine, 8; Liver, 9; Lung, 10; NS, 11; Ovary, 12; Pancreas, 13; Prostate, 14; Skin, 15; Stomach, 16; Thyroid, 17; Urinary_tract) |
| Top |
|
 |
| Top |
| Stat. for Non-Synonymous SNVs (# total SNVs=0) | (# total SNVs=1) |
 | |
(# total SNVs=0) | (# total SNVs=0) |
| Top |
| * When you move the cursor on each content, you can see more deailed mutation information on the Tooltip. Those are primary_site,primary_histology,mutation(aa),pubmedID. |
| GRCh37 position | Mutation(aa) | Unique sampleID count |
| chr16:30762590-30762590 | p.H87N | 1 |
| chr16:30768418-30768418 | p.*407* | 1 |
| Top |
|
 |
| Point Mutation/ Tissue ID | 1 | 2 | 3 | 4 | 5 | 6 | 7 | 8 | 9 | 10 | 11 | 12 | 13 | 14 | 15 | 16 | 17 | 18 | 19 | 20 |
| # sample | 2 | 1 | 2 | 5 | 1 | 6 | 1 | 2 | 2 | 9 | 5 | |||||||||
| # mutation | 2 | 1 | 2 | 5 | 1 | 7 | 1 | 2 | 2 | 9 | 5 | |||||||||
| nonsynonymous SNV | 2 | 1 | 1 | 4 | 1 | 4 | 1 | 1 | 8 | 3 | ||||||||||
| synonymous SNV | 1 | 1 | 3 | 2 | 1 | 1 | 2 |
| cf) Tissue ID; Tissue type (1; BLCA[Bladder Urothelial Carcinoma], 2; BRCA[Breast invasive carcinoma], 3; CESC[Cervical squamous cell carcinoma and endocervical adenocarcinoma], 4; COAD[Colon adenocarcinoma], 5; GBM[Glioblastoma multiforme], 6; Glioma Low Grade, 7; HNSC[Head and Neck squamous cell carcinoma], 8; KICH[Kidney Chromophobe], 9; KIRC[Kidney renal clear cell carcinoma], 10; KIRP[Kidney renal papillary cell carcinoma], 11; LAML[Acute Myeloid Leukemia], 12; LUAD[Lung adenocarcinoma], 13; LUSC[Lung squamous cell carcinoma], 14; OV[Ovarian serous cystadenocarcinoma ], 15; PAAD[Pancreatic adenocarcinoma], 16; PRAD[Prostate adenocarcinoma], 17; SKCM[Skin Cutaneous Melanoma], 18:STAD[Stomach adenocarcinoma], 19:THCA[Thyroid carcinoma], 20:UCEC[Uterine Corpus Endometrial Carcinoma]) |
| Top |
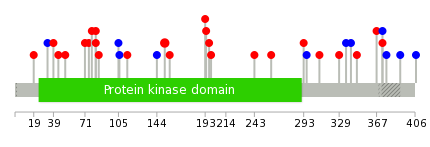
| * We represented just top 10 SNVs. When you move the cursor on each content, you can see more deailed mutation information on the Tooltip. Those are primary_site, primary_histology, mutation(aa), pubmedID. |
| Genomic Position | Mutation(aa) | Unique sampleID count |
| chr16:30764777 | p.R152Q,PHKG2 | 2 |
| chr16:30767541 | p.V106V,PHKG2 | 1 |
| chr16:30768315 | p.Y341Y,PHKG2 | 1 |
| chr16:30762584 | p.E114K,PHKG2 | 1 |
| chr16:30767768 | p.R347W,PHKG2 | 1 |
| chr16:30760196 | p.L144L,PHKG2 | 1 |
| chr16:30768316 | p.Q367R | 1 |
| chr16:30762913 | p.L373P | 1 |
| chr16:30767819 | p.E19K,PHKG2 | 1 |
| chr16:30762430 | p.E157K,PHKG2 | 1 |
| * Copy number data were extracted from TCGA using R package TCGA-Assembler. The URLs of all public data files on TCGA DCC data server were gathered on Jan-05-2015. Function ProcessCNAData in TCGA-Assembler package was used to obtain gene-level copy number value which is calculated as the average copy number of the genomic region of a gene. |
 |
| cf) Tissue ID[Tissue type]: BLCA[Bladder Urothelial Carcinoma], BRCA[Breast invasive carcinoma], CESC[Cervical squamous cell carcinoma and endocervical adenocarcinoma], COAD[Colon adenocarcinoma], GBM[Glioblastoma multiforme], Glioma Low Grade, HNSC[Head and Neck squamous cell carcinoma], KICH[Kidney Chromophobe], KIRC[Kidney renal clear cell carcinoma], KIRP[Kidney renal papillary cell carcinoma], LAML[Acute Myeloid Leukemia], LUAD[Lung adenocarcinoma], LUSC[Lung squamous cell carcinoma], OV[Ovarian serous cystadenocarcinoma ], PAAD[Pancreatic adenocarcinoma], PRAD[Prostate adenocarcinoma], SKCM[Skin Cutaneous Melanoma], STAD[Stomach adenocarcinoma], THCA[Thyroid carcinoma], UCEC[Uterine Corpus Endometrial Carcinoma] |
| Top |
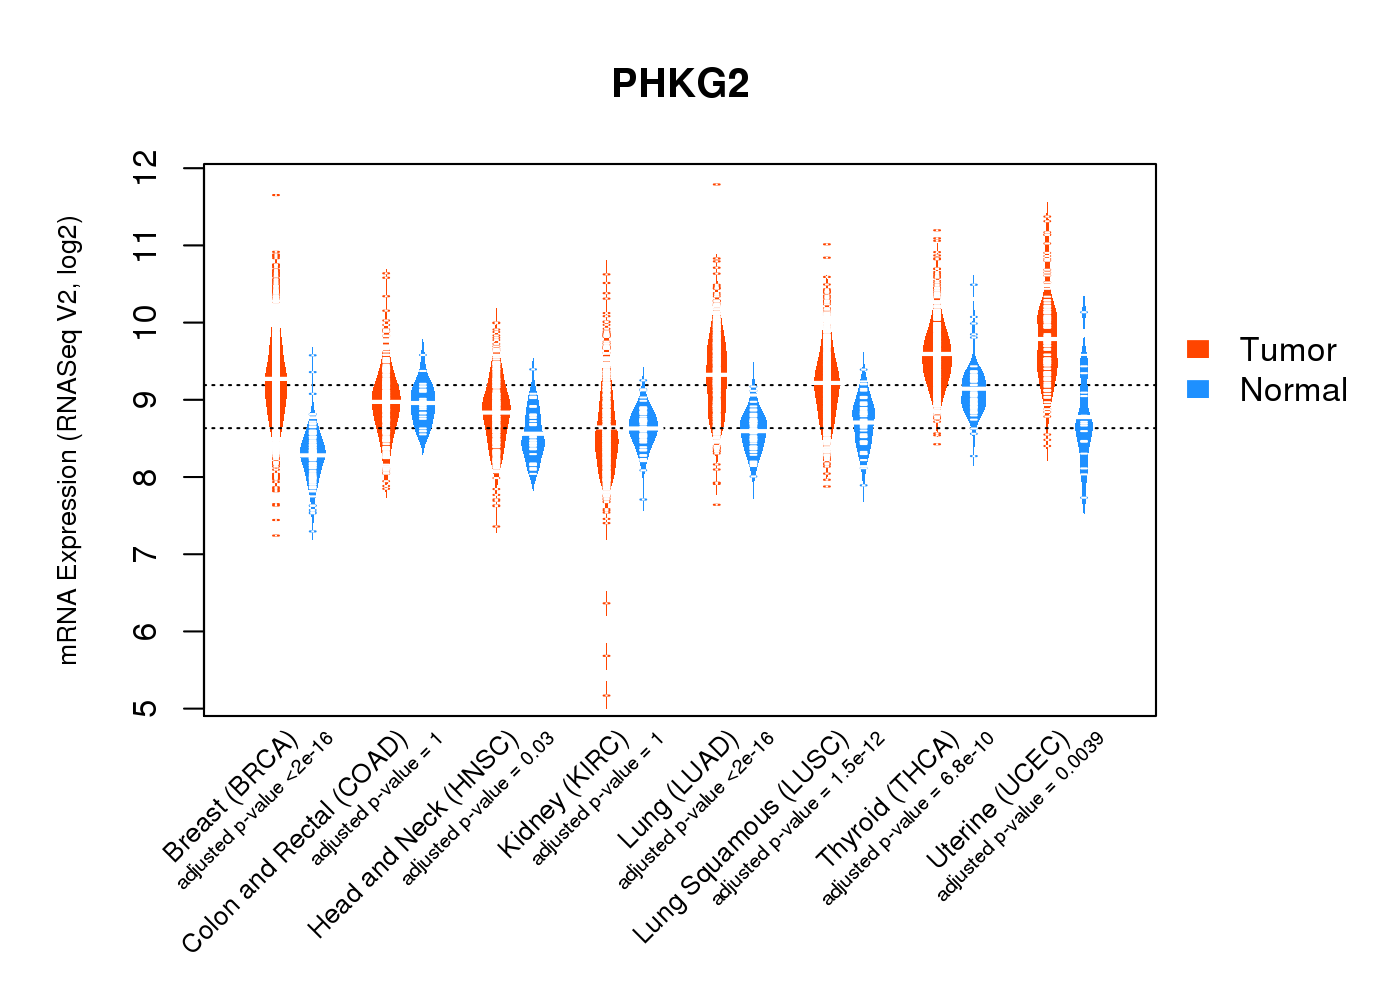
| Gene Expression for PHKG2 |
| * CCLE gene expression data were extracted from CCLE_Expression_Entrez_2012-10-18.res: Gene-centric RMA-normalized mRNA expression data. |
 |
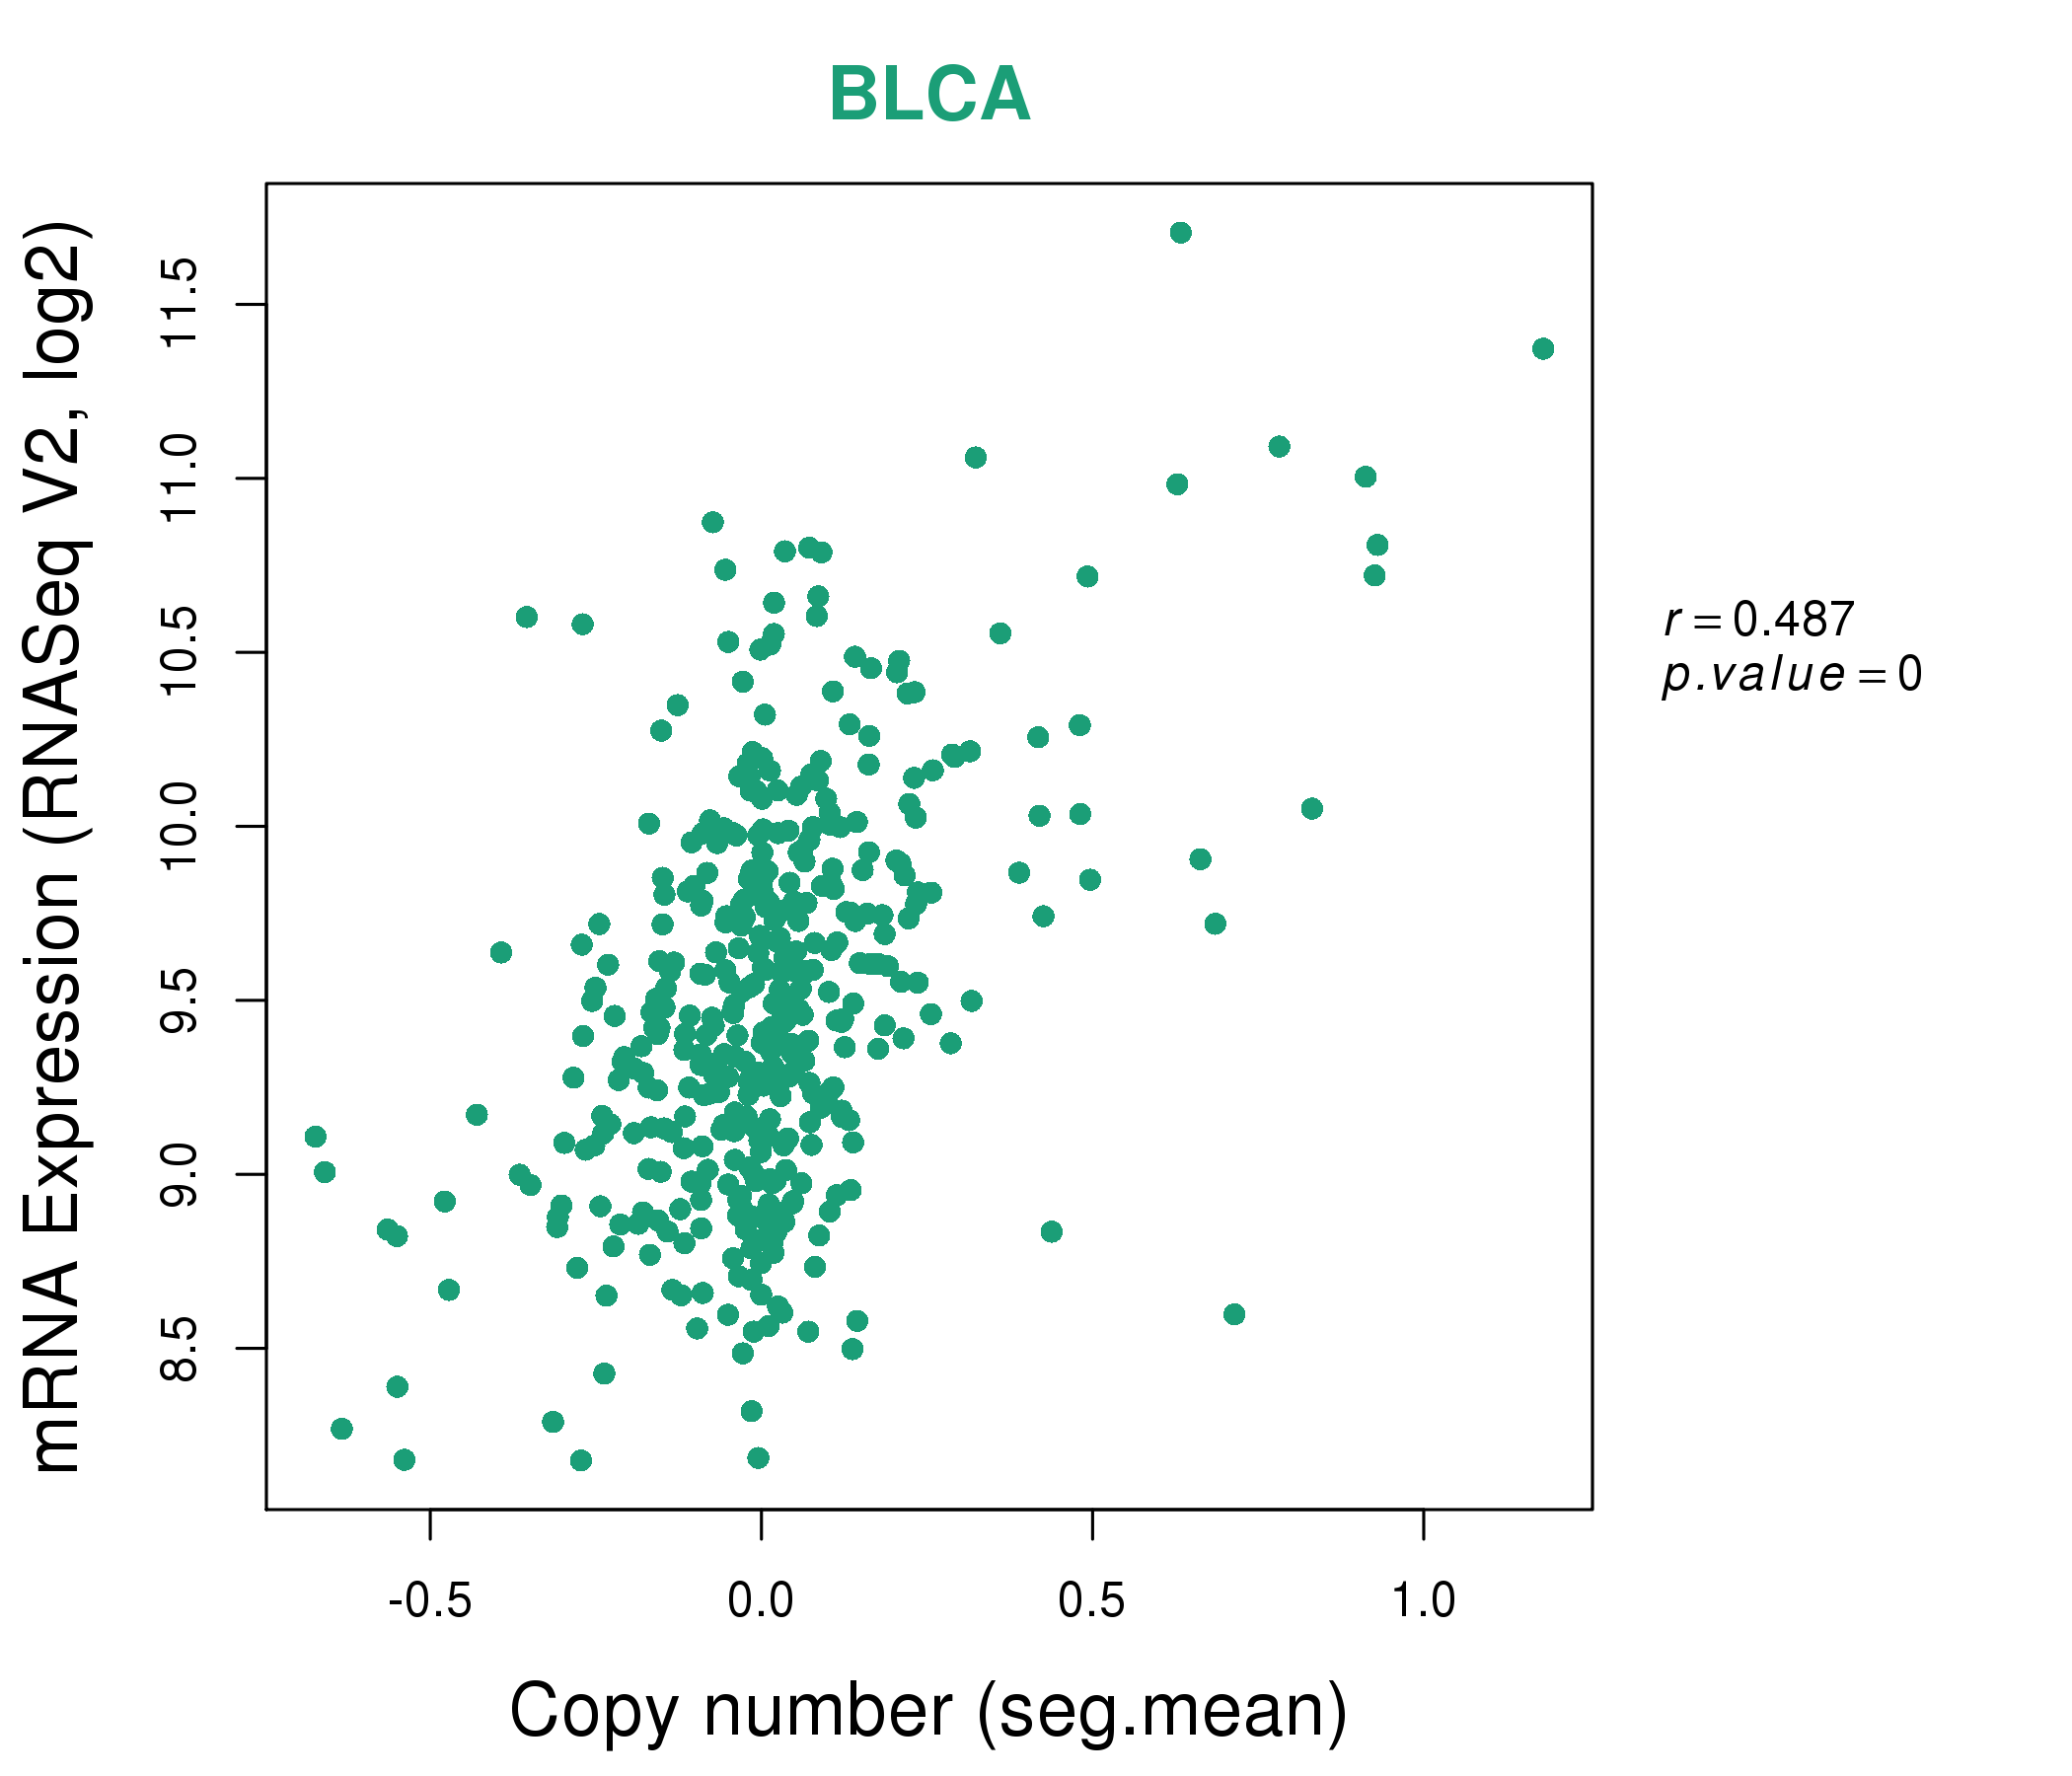
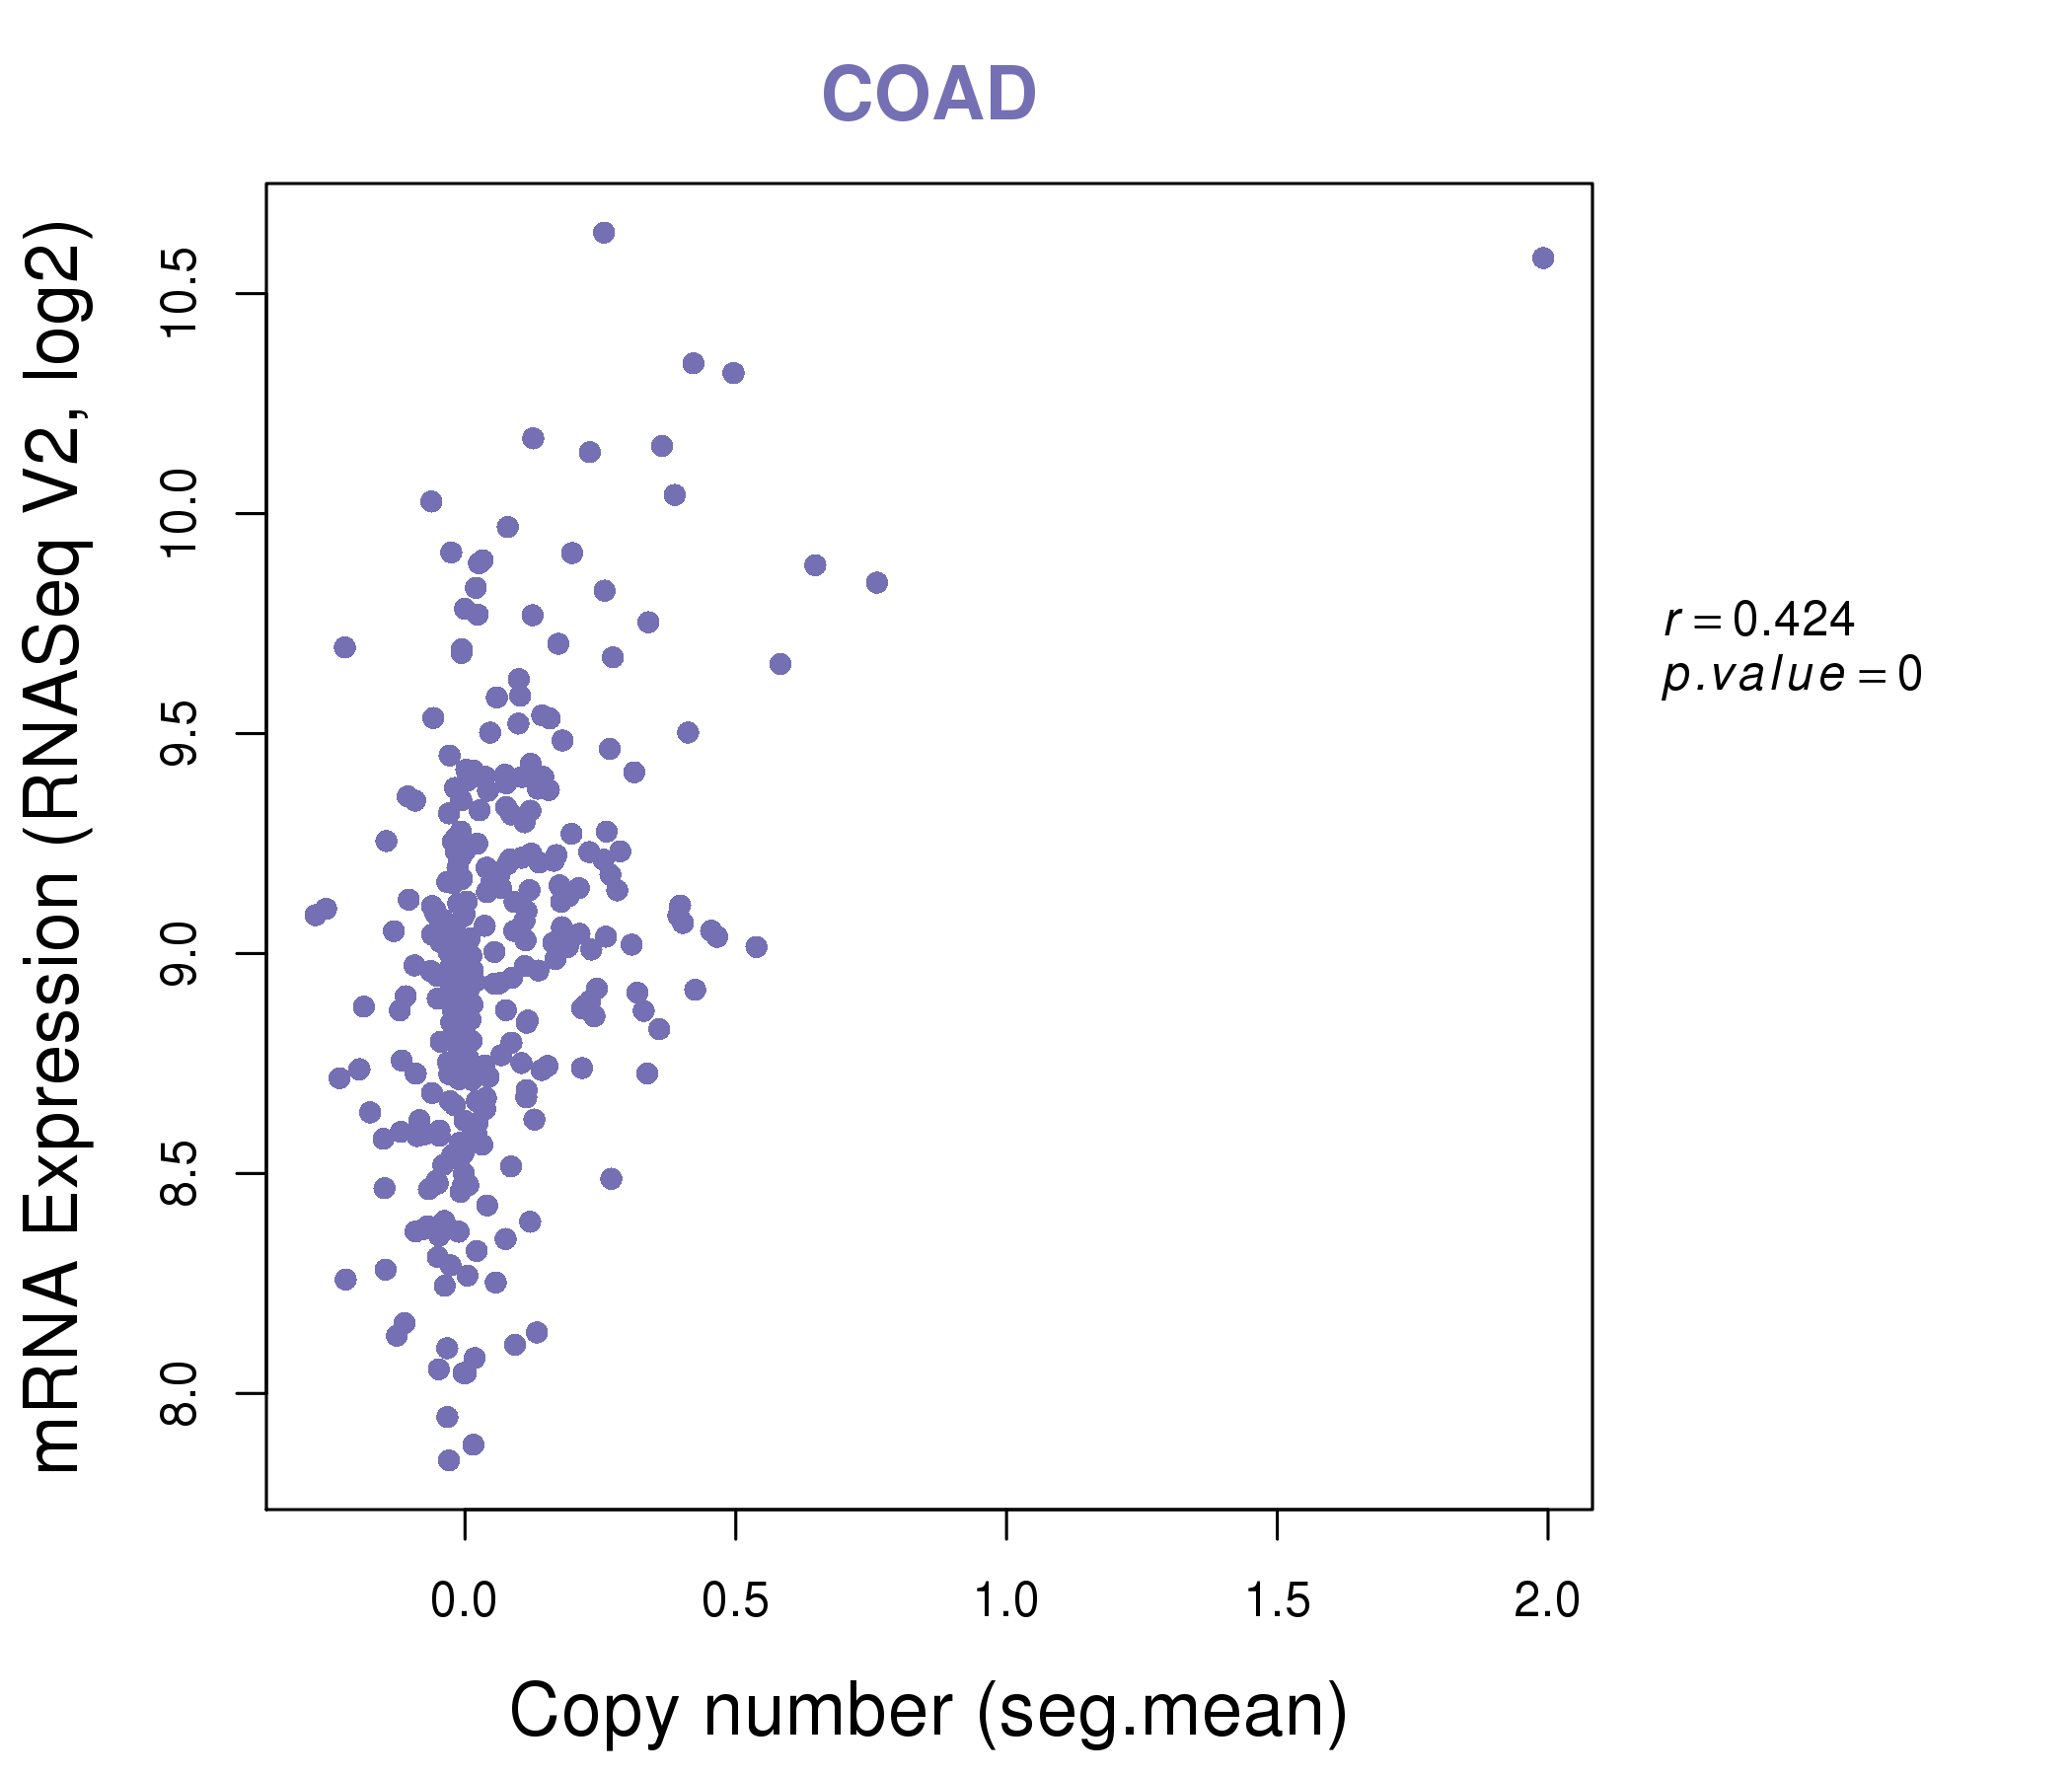
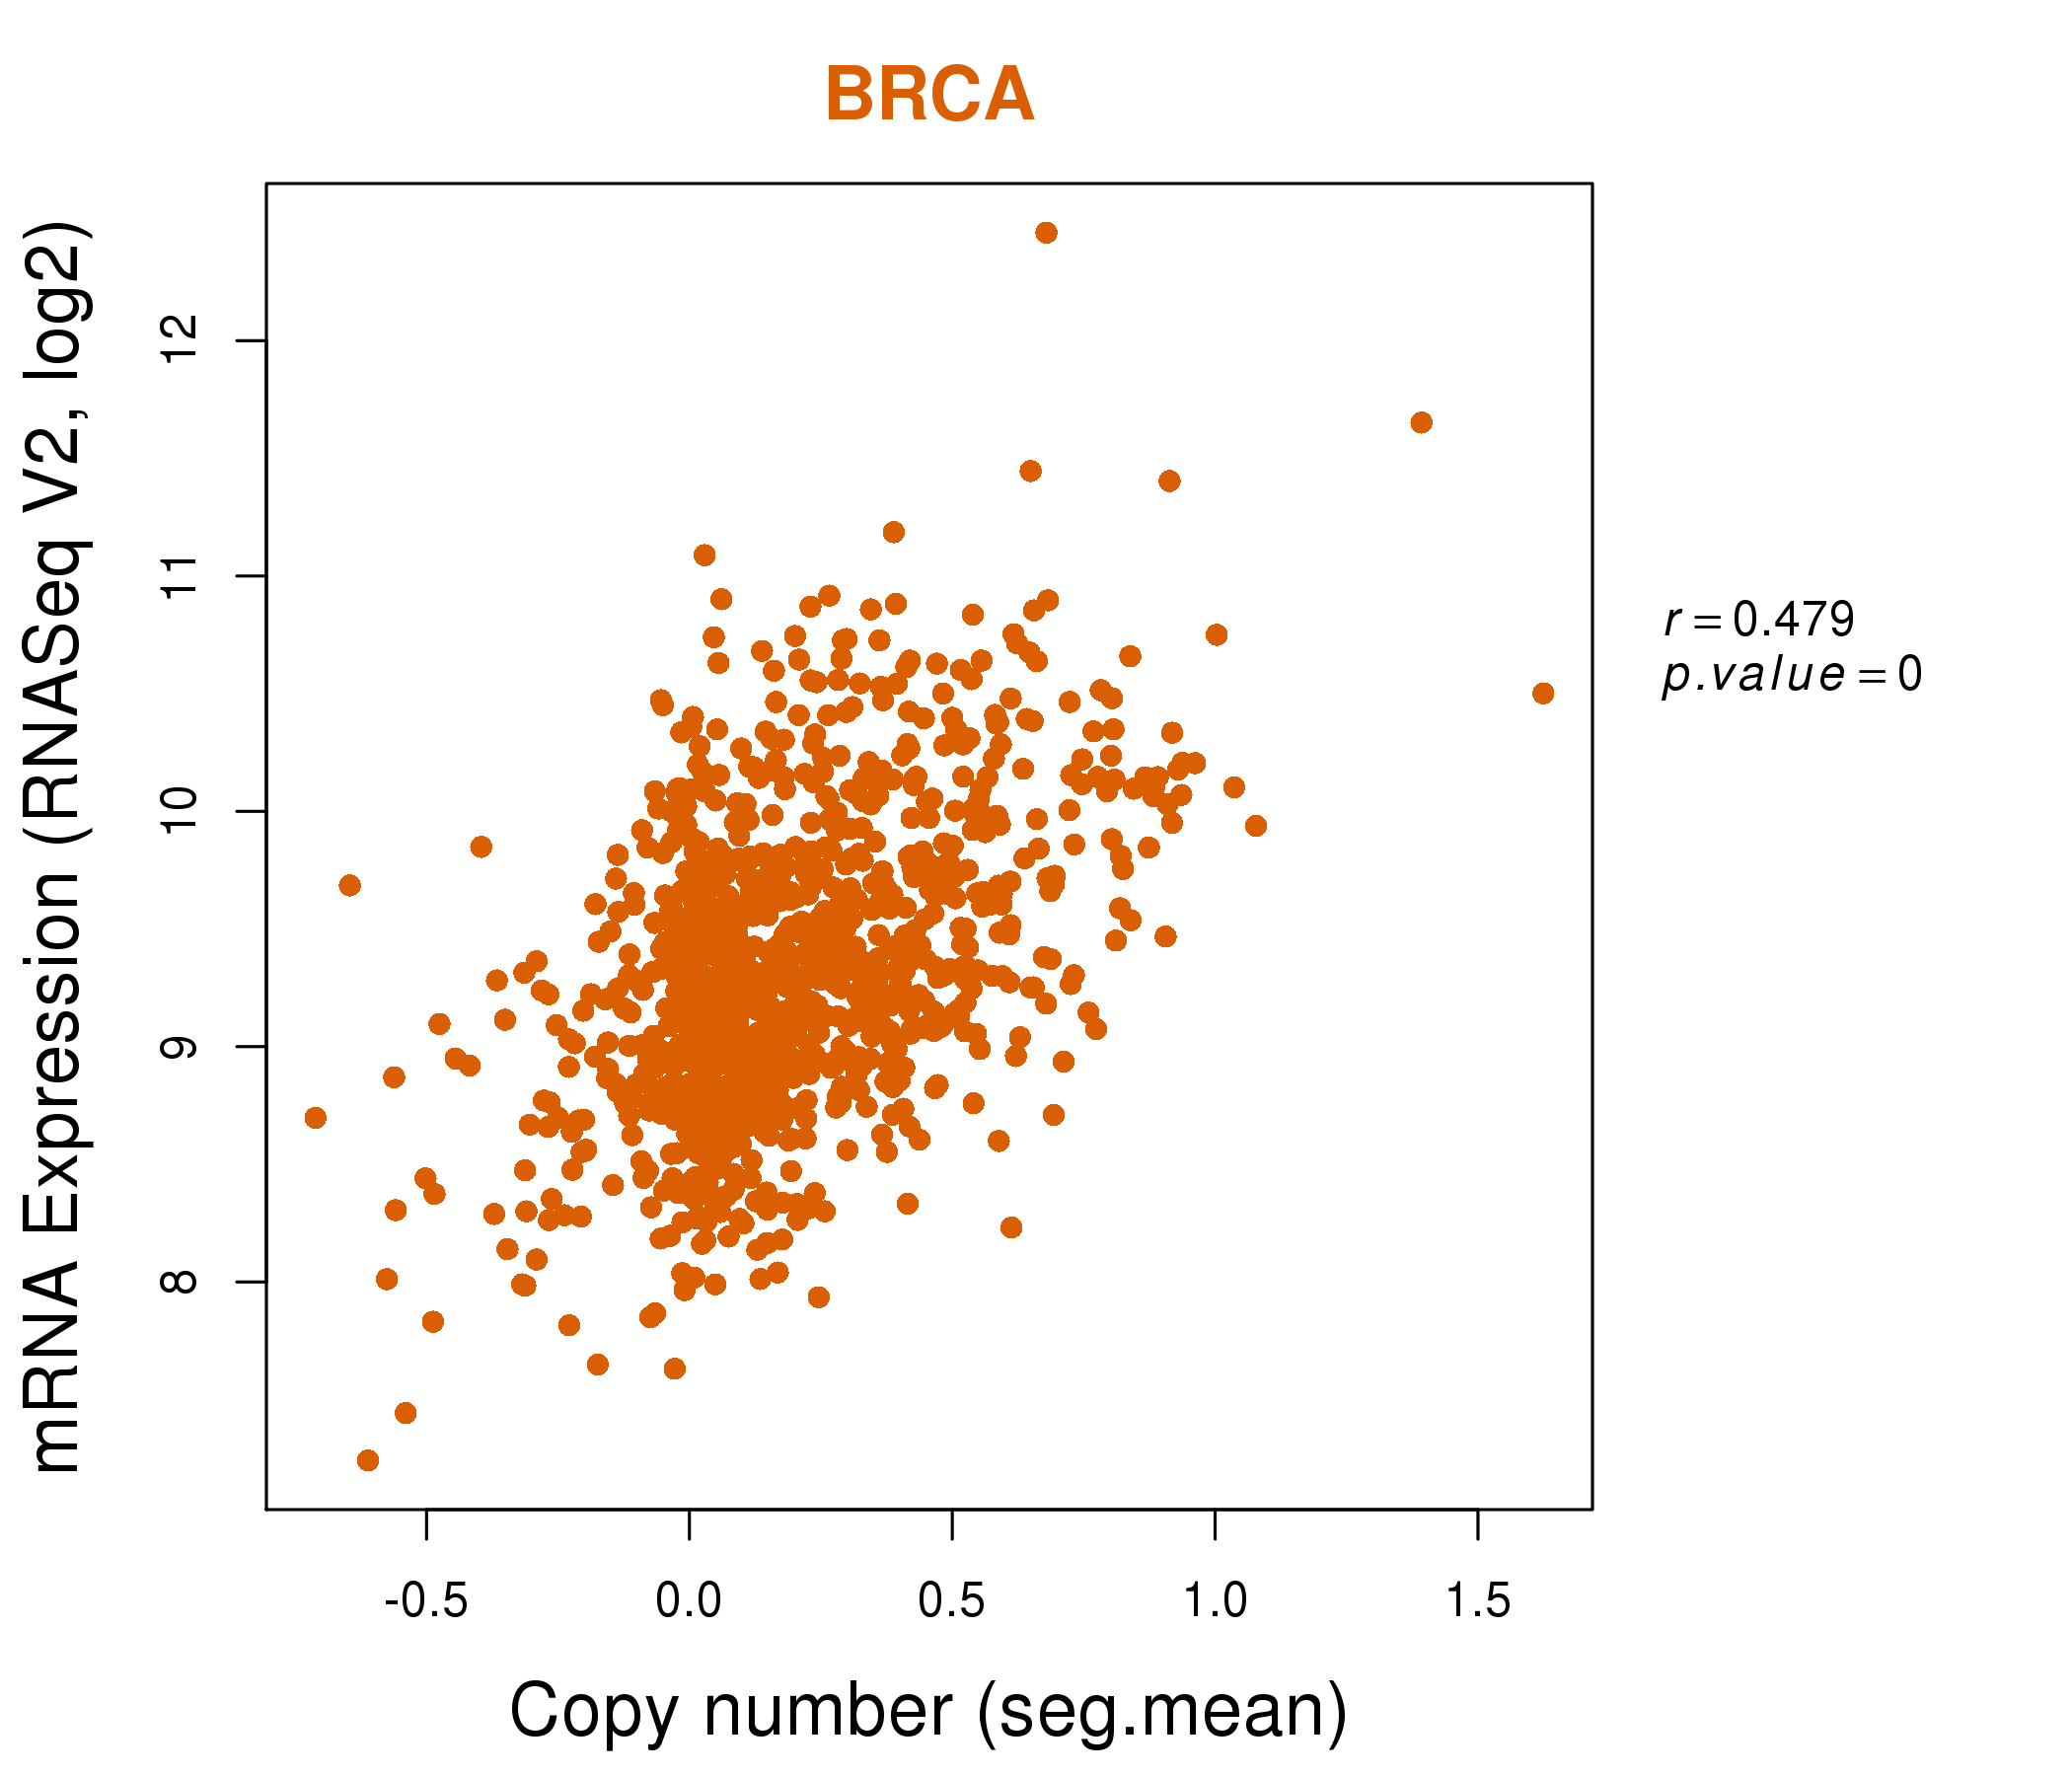
| * Normalized gene expression data of RNASeqV2 was extracted from TCGA using R package TCGA-Assembler. The URLs of all public data files on TCGA DCC data server were gathered at Jan-05-2015. Only eight cancer types have enough normal control samples for differential expression analysis. (t test, adjusted p<0.05 (using Benjamini-Hochberg FDR)) |
 |
| Top |
| * This plots show the correlation between CNV and gene expression. |
: Open all plots for all cancer types
 |
|
 |
|

| Top |
| Gene-Gene Network Information |
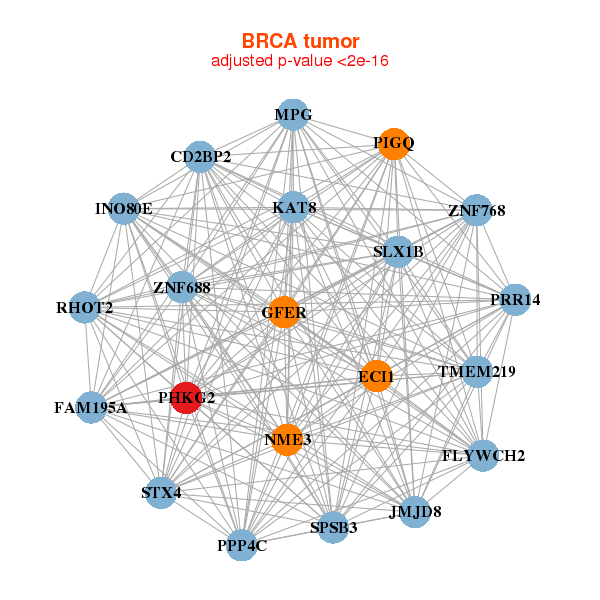
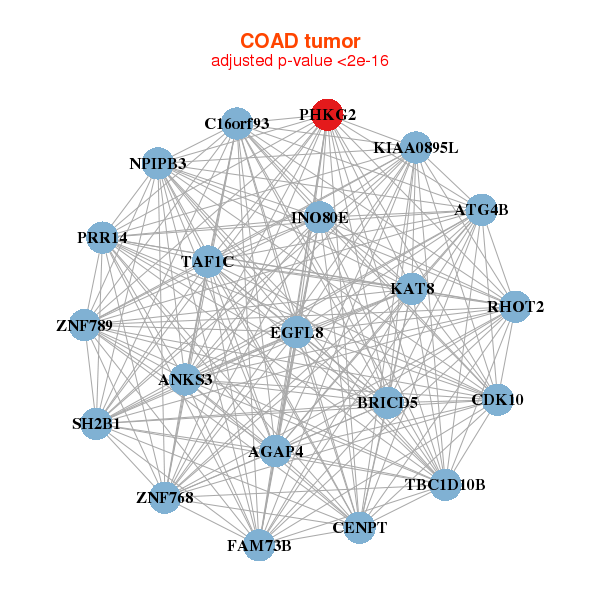
| * Co-Expression network figures were drawn using R package igraph. Only the top 20 genes with the highest correlations were shown. Red circle: input gene, orange circle: cell metabolism gene, sky circle: other gene |
: Open all plots for all cancer types
 |
|
| CD2BP2,ECI1,FAM195A,FLYWCH2,GFER,SLX1B,INO80E, JMJD8,MPG,KAT8,NME3,PHKG2,PIGQ,PPP4C, PRR14,RHOT2,SPSB3,STX4,TMEM219,ZNF688,ZNF768 | ATG4B,B3GAT3,BRMS1,VPS9D1,OXLD1,C19orf25,C9orf142, COQ4,HMG20B,LYPLA2,NMRAL1,PHKG2,PIGQ,QTRT1, RFXANK,SIRT6,TARBP2,TMEM141,TRAPPC6A,WDR34,ZNF446 |
 |
|
| AGAP4,ANKS3,ATG4B,BRICD5,C16orf93,CDK10,CENPT, EGFL8,FAM73B,INO80E,KIAA0895L,KAT8,NPIPB3,PHKG2, PRR14,RHOT2,SH2B1,TAF1C,TBC1D10B,ZNF768,ZNF789 | ASPSCR1,AUP1,DFFB,DUS3L,FASTK,FLAD1,FPGS, METTL17,MTX1,NOL12,PHKG2,PNKP,RASSF7,RPS6KB2, RPUSD1,SLC25A10,TAZ,TRMU,UCKL1,YIF1B,ZSCAN5A |
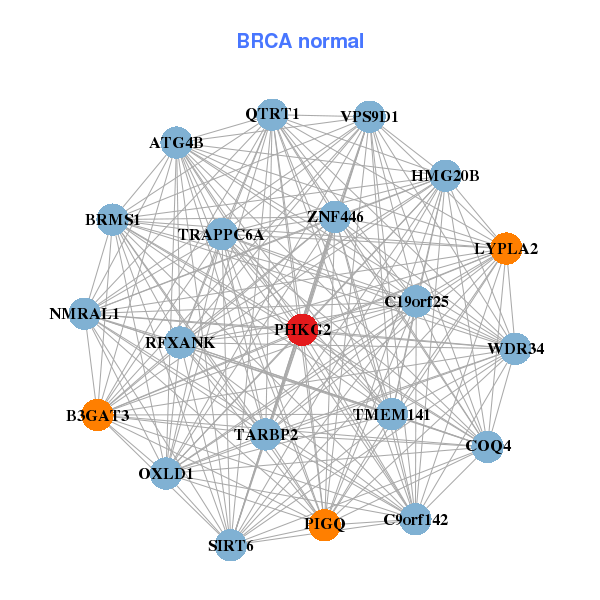

| * Co-Expression network figures were drawn using R package igraph. Only the top 20 genes with the highest correlations were shown. Red circle: input gene, orange circle: cell metabolism gene, sky circle: other gene |
: Open all plots for all cancer types
| Top |
: Open all interacting genes' information including KEGG pathway for all interacting genes from DAVID
| Top |
| Pharmacological Information for PHKG2 |
| There's no related Drug. |
| Top |
| Cross referenced IDs for PHKG2 |
| * We obtained these cross-references from Uniprot database. It covers 150 different DBs, 18 categories. http://www.uniprot.org/help/cross_references_section |
: Open all cross reference information
|
Copyright © 2016-Present - The Univsersity of Texas Health Science Center at Houston @ |