|
|||||||||||||||||||||||||||||||||||||||||||||||||||||||||||||||||||||||||||||||||||||||||||||||||||||||||||||||||||||||||||||||||||||||||||||||||||||||||||||||||||||||||||||||||||||||||||||||||||||||||||||||||||||||||||||||||||||||||||||||||||||||||||||||||||||||||||||||||||||||||||||||||||||||||||||||||||||||||||||||||||||||||||||
| |
| Phenotypic Information (metabolism pathway, cancer, disease, phenome) |
| |
| |
| Gene-Gene Network Information: Co-Expression Network, Interacting Genes & KEGG |
| |
|


| Gene Summary for PHYH |
| Basic gene info. | Gene symbol | PHYH |
| Gene name | phytanoyl-CoA 2-hydroxylase | |
| Synonyms | LN1|LNAP1|PAHX|PHYH1|RD | |
| Cytomap | UCSC genome browser: 10p13 | |
| Genomic location | chr10 :13319795-13341746 | |
| Type of gene | protein-coding | |
| RefGenes | NM_001037537.1, NM_006214.3, | |
| Ensembl id | ENSG00000107537 | |
| Description | phytanic acid oxidasephytanoil-CoA alpha hydroxylasephytanoyl-CoA 2 oxoglutarate dioxygenasephytanoyl-CoA alpha-hydroxylasephytanoyl-CoA dioxygenase, peroxisomal | |
| Modification date | 20141219 | |
| dbXrefs | MIM : 602026 | |
| HGNC : HGNC | ||
| Ensembl : ENSG00000107537 | ||
| HPRD : 03609 | ||
| Vega : OTTHUMG00000017693 | ||
| Protein | UniProt: go to UniProt's Cross Reference DB Table | |
| Expression | CleanEX: HS_PHYH | |
| BioGPS: 5264 | ||
| Gene Expression Atlas: ENSG00000107537 | ||
| The Human Protein Atlas: ENSG00000107537 | ||
| Pathway | NCI Pathway Interaction Database: PHYH | |
| KEGG: PHYH | ||
| REACTOME: PHYH | ||
| ConsensusPathDB | ||
| Pathway Commons: PHYH | ||
| Metabolism | MetaCyc: PHYH | |
| HUMANCyc: PHYH | ||
| Regulation | Ensembl's Regulation: ENSG00000107537 | |
| miRBase: chr10 :13,319,795-13,341,746 | ||
| TargetScan: NM_001037537 | ||
| cisRED: ENSG00000107537 | ||
| Context | iHOP: PHYH | |
| cancer metabolism search in PubMed: PHYH | ||
| UCL Cancer Institute: PHYH | ||
| Assigned class in ccmGDB | C | |
| Top |
| Phenotypic Information for PHYH(metabolism pathway, cancer, disease, phenome) |
| Cancer | CGAP: PHYH |
| Familial Cancer Database: PHYH | |
| * This gene is included in those cancer gene databases. |
|
|
|
|
|
| . | |||||||||||||||||||||||||||||||||||||||||||||||||||||||||||||||||||||||||||||||||||||||||||||||||||||||||||||||||||||||||||||||||||||||||||||||||||||||||||||||||||||||||||||||||||||||||||||||||||||||||||||||||||||||||||||||||||||||||||||||||||||||||||||||||||||||||||||||||||||||||||||||||||||||||||||||||||||||||||||||||||||||
Oncogene 1 | Significant driver gene in | ||||||||||||||||||||||||||||||||||||||||||||||||||||||||||||||||||||||||||||||||||||||||||||||||||||||||||||||||||||||||||||||||||||||||||||||||||||||||||||||||||||||||||||||||||||||||||||||||||||||||||||||||||||||||||||||||||||||||||||||||||||||||||||||||||||||||||||||||||||||||||||||||||||||||||||||||||||||||||||||||||||||||||||
| cf) number; DB name 1 Oncogene; http://nar.oxfordjournals.org/content/35/suppl_1/D721.long, 2 Tumor Suppressor gene; https://bioinfo.uth.edu/TSGene/, 3 Cancer Gene Census; http://www.nature.com/nrc/journal/v4/n3/abs/nrc1299.html, 4 CancerGenes; http://nar.oxfordjournals.org/content/35/suppl_1/D721.long, 5 Network of Cancer Gene; http://ncg.kcl.ac.uk/index.php, 1Therapeutic Vulnerabilities in Cancer; http://cbio.mskcc.org/cancergenomics/statius/ |
| REACTOME_PEROXISOMAL_LIPID_METABOLISM REACTOME_METABOLISM_OF_LIPIDS_AND_LIPOPROTEINS | |
| OMIM | |
| Orphanet | |
| Disease | KEGG Disease: PHYH |
| MedGen: PHYH (Human Medical Genetics with Condition) | |
| ClinVar: PHYH | |
| Phenotype | MGI: PHYH (International Mouse Phenotyping Consortium) |
| PhenomicDB: PHYH | |
| Mutations for PHYH |
| * Under tables are showing count per each tissue to give us broad intuition about tissue specific mutation patterns.You can go to the detailed page for each mutation database's web site. |
| There's no structural variation information in COSMIC data for this gene. |
| * From mRNA Sanger sequences, Chitars2.0 arranged chimeric transcripts. This table shows PHYH related fusion information. |
| ID | Head Gene | Tail Gene | Accession | Gene_a | qStart_a | qEnd_a | Chromosome_a | tStart_a | tEnd_a | Gene_a | qStart_a | qEnd_a | Chromosome_a | tStart_a | tEnd_a |
| Top |
| Mutation type/ Tissue ID | brca | cns | cerv | endome | haematopo | kidn | Lintest | liver | lung | ns | ovary | pancre | prost | skin | stoma | thyro | urina | |||
| Total # sample | 1 | |||||||||||||||||||
| GAIN (# sample) | 1 | |||||||||||||||||||
| LOSS (# sample) |
| cf) Tissue ID; Tissue type (1; Breast, 2; Central_nervous_system, 3; Cervix, 4; Endometrium, 5; Haematopoietic_and_lymphoid_tissue, 6; Kidney, 7; Large_intestine, 8; Liver, 9; Lung, 10; NS, 11; Ovary, 12; Pancreas, 13; Prostate, 14; Skin, 15; Stomach, 16; Thyroid, 17; Urinary_tract) |
| Top |
|
 |
| Top |
| Stat. for Non-Synonymous SNVs (# total SNVs=33) | (# total SNVs=13) |
 | 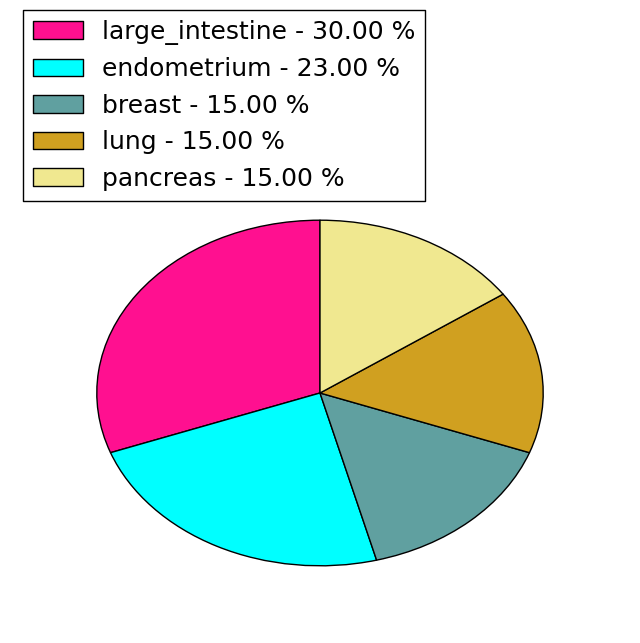 |
(# total SNVs=2) | (# total SNVs=1) |
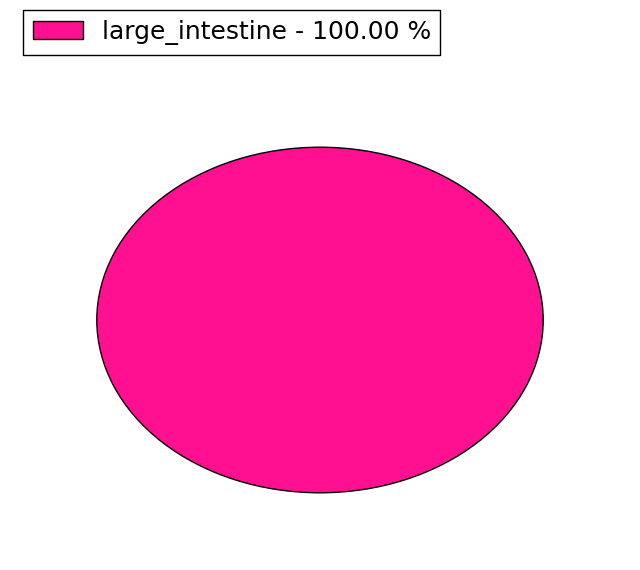 |  |
| Top |
| * When you move the cursor on each content, you can see more deailed mutation information on the Tooltip. Those are primary_site,primary_histology,mutation(aa),pubmedID. |
| GRCh37 position | Mutation(aa) | Unique sampleID count |
| chr10:13336521-13336521 | p.S107S | 4 |
| chr10:13340234-13340234 | p.P29P | 2 |
| chr10:13330526-13330526 | p.R171H | 2 |
| chr10:13337497-13337497 | p.R82W | 2 |
| chr10:13323083-13323083 | p.D286N | 2 |
| chr10:13323103-13323103 | p.S279F | 2 |
| chr10:13325816-13325816 | p.H234Q | 2 |
| chr10:13320306-13320306 | p.L338F | 2 |
| chr10:13325835-13325835 | p.G228fs*22 | 2 |
| chr10:13337568-13337568 | p.R58I | 2 |
| Top |
|
 |
| Point Mutation/ Tissue ID | 1 | 2 | 3 | 4 | 5 | 6 | 7 | 8 | 9 | 10 | 11 | 12 | 13 | 14 | 15 | 16 | 17 | 18 | 19 | 20 |
| # sample | 3 | 4 | 2 | 2 | 3 | 4 | 1 | 10 | 3 | 11 | ||||||||||
| # mutation | 3 | 5 | 2 | 2 | 3 | 4 | 1 | 9 | 3 | 13 | ||||||||||
| nonsynonymous SNV | 1 | 3 | 2 | 2 | 2 | 4 | 1 | 6 | 2 | 10 | ||||||||||
| synonymous SNV | 2 | 2 | 1 | 3 | 1 | 3 |
| cf) Tissue ID; Tissue type (1; BLCA[Bladder Urothelial Carcinoma], 2; BRCA[Breast invasive carcinoma], 3; CESC[Cervical squamous cell carcinoma and endocervical adenocarcinoma], 4; COAD[Colon adenocarcinoma], 5; GBM[Glioblastoma multiforme], 6; Glioma Low Grade, 7; HNSC[Head and Neck squamous cell carcinoma], 8; KICH[Kidney Chromophobe], 9; KIRC[Kidney renal clear cell carcinoma], 10; KIRP[Kidney renal papillary cell carcinoma], 11; LAML[Acute Myeloid Leukemia], 12; LUAD[Lung adenocarcinoma], 13; LUSC[Lung squamous cell carcinoma], 14; OV[Ovarian serous cystadenocarcinoma ], 15; PAAD[Pancreatic adenocarcinoma], 16; PRAD[Prostate adenocarcinoma], 17; SKCM[Skin Cutaneous Melanoma], 18:STAD[Stomach adenocarcinoma], 19:THCA[Thyroid carcinoma], 20:UCEC[Uterine Corpus Endometrial Carcinoma]) |
| Top |
| * We represented just top 10 SNVs. When you move the cursor on each content, you can see more deailed mutation information on the Tooltip. Those are primary_site, primary_histology, mutation(aa), pubmedID. |
| Genomic Position | Mutation(aa) | Unique sampleID count |
| chr10:13323083 | p.D186N,PHYH | 2 |
| chr10:13330526 | p.S179F,PHYH | 2 |
| chr10:13323103 | p.R58I | 2 |
| chr10:13337568 | p.R71H,PHYH | 2 |
| chr10:13323039 | p.E140K,PHYH | 1 |
| chr10:13336521 | p.P37L,PHYH | 1 |
| chr10:13325814 | p.G135V,PHYH | 1 |
| chr10:13330474 | p.Y33Y,PHYH | 1 |
| chr10:13323076 | p.G135W,PHYH | 1 |
| chr10:13336522 | p.F24F,PHYH | 1 |
| * Copy number data were extracted from TCGA using R package TCGA-Assembler. The URLs of all public data files on TCGA DCC data server were gathered on Jan-05-2015. Function ProcessCNAData in TCGA-Assembler package was used to obtain gene-level copy number value which is calculated as the average copy number of the genomic region of a gene. |
 |
| cf) Tissue ID[Tissue type]: BLCA[Bladder Urothelial Carcinoma], BRCA[Breast invasive carcinoma], CESC[Cervical squamous cell carcinoma and endocervical adenocarcinoma], COAD[Colon adenocarcinoma], GBM[Glioblastoma multiforme], Glioma Low Grade, HNSC[Head and Neck squamous cell carcinoma], KICH[Kidney Chromophobe], KIRC[Kidney renal clear cell carcinoma], KIRP[Kidney renal papillary cell carcinoma], LAML[Acute Myeloid Leukemia], LUAD[Lung adenocarcinoma], LUSC[Lung squamous cell carcinoma], OV[Ovarian serous cystadenocarcinoma ], PAAD[Pancreatic adenocarcinoma], PRAD[Prostate adenocarcinoma], SKCM[Skin Cutaneous Melanoma], STAD[Stomach adenocarcinoma], THCA[Thyroid carcinoma], UCEC[Uterine Corpus Endometrial Carcinoma] |
| Top |
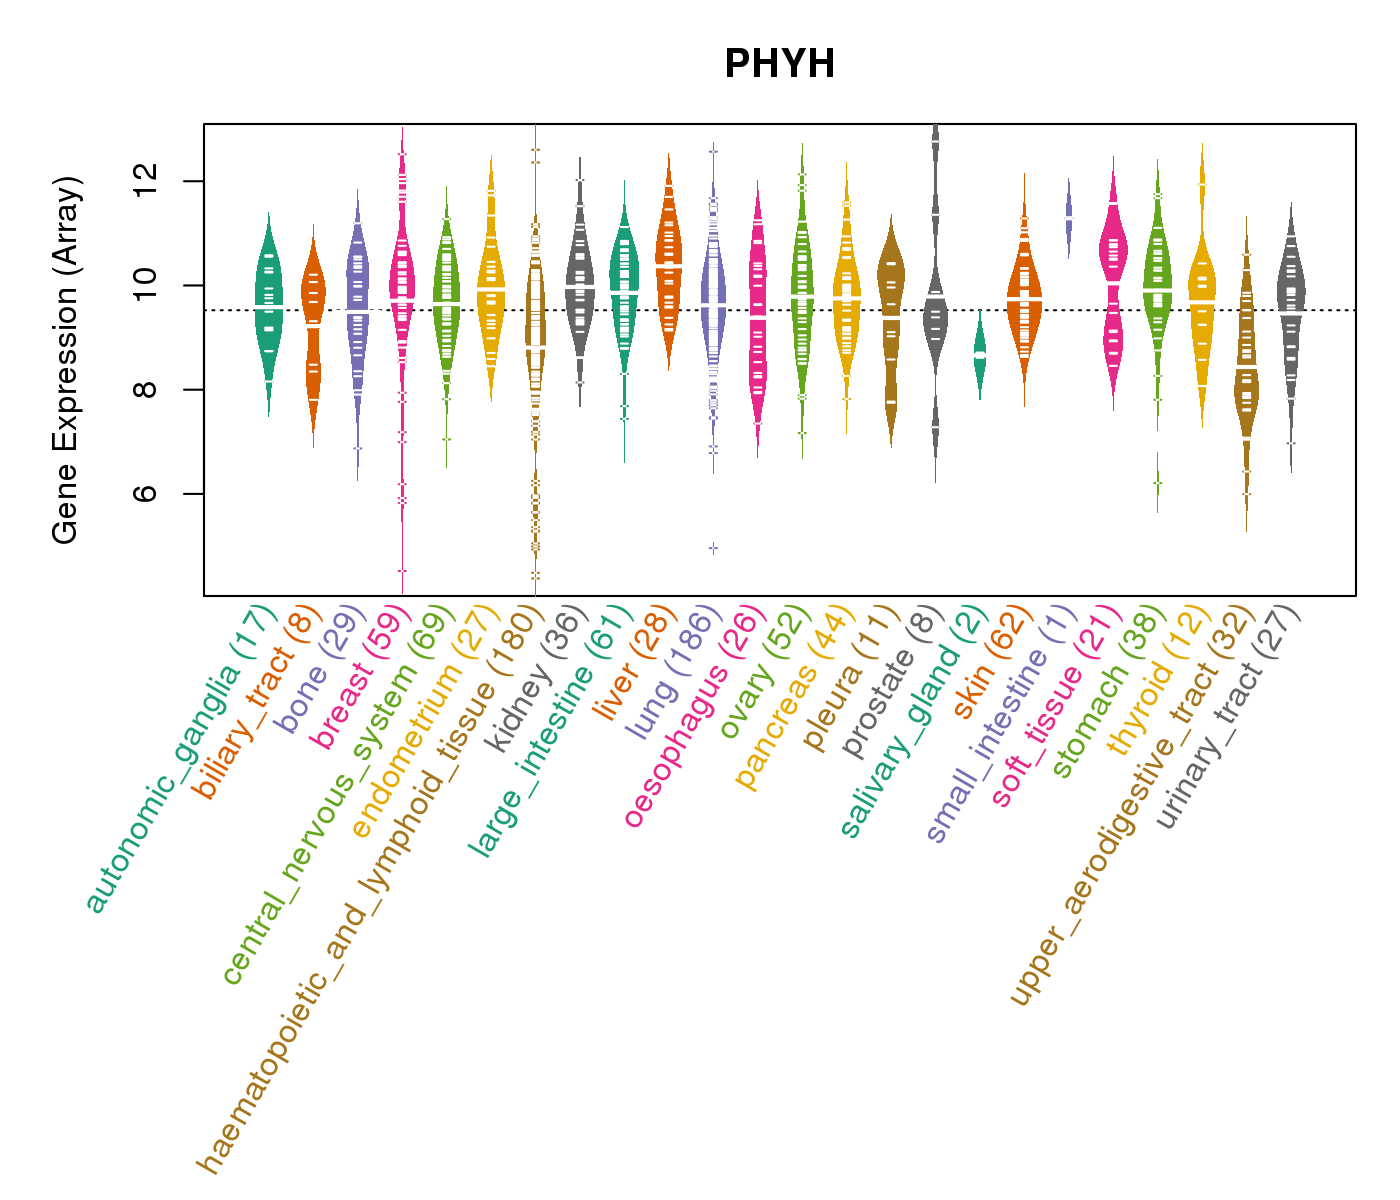
| Gene Expression for PHYH |
| * CCLE gene expression data were extracted from CCLE_Expression_Entrez_2012-10-18.res: Gene-centric RMA-normalized mRNA expression data. |
 |
| * Normalized gene expression data of RNASeqV2 was extracted from TCGA using R package TCGA-Assembler. The URLs of all public data files on TCGA DCC data server were gathered at Jan-05-2015. Only eight cancer types have enough normal control samples for differential expression analysis. (t test, adjusted p<0.05 (using Benjamini-Hochberg FDR)) |
 |
| Top |
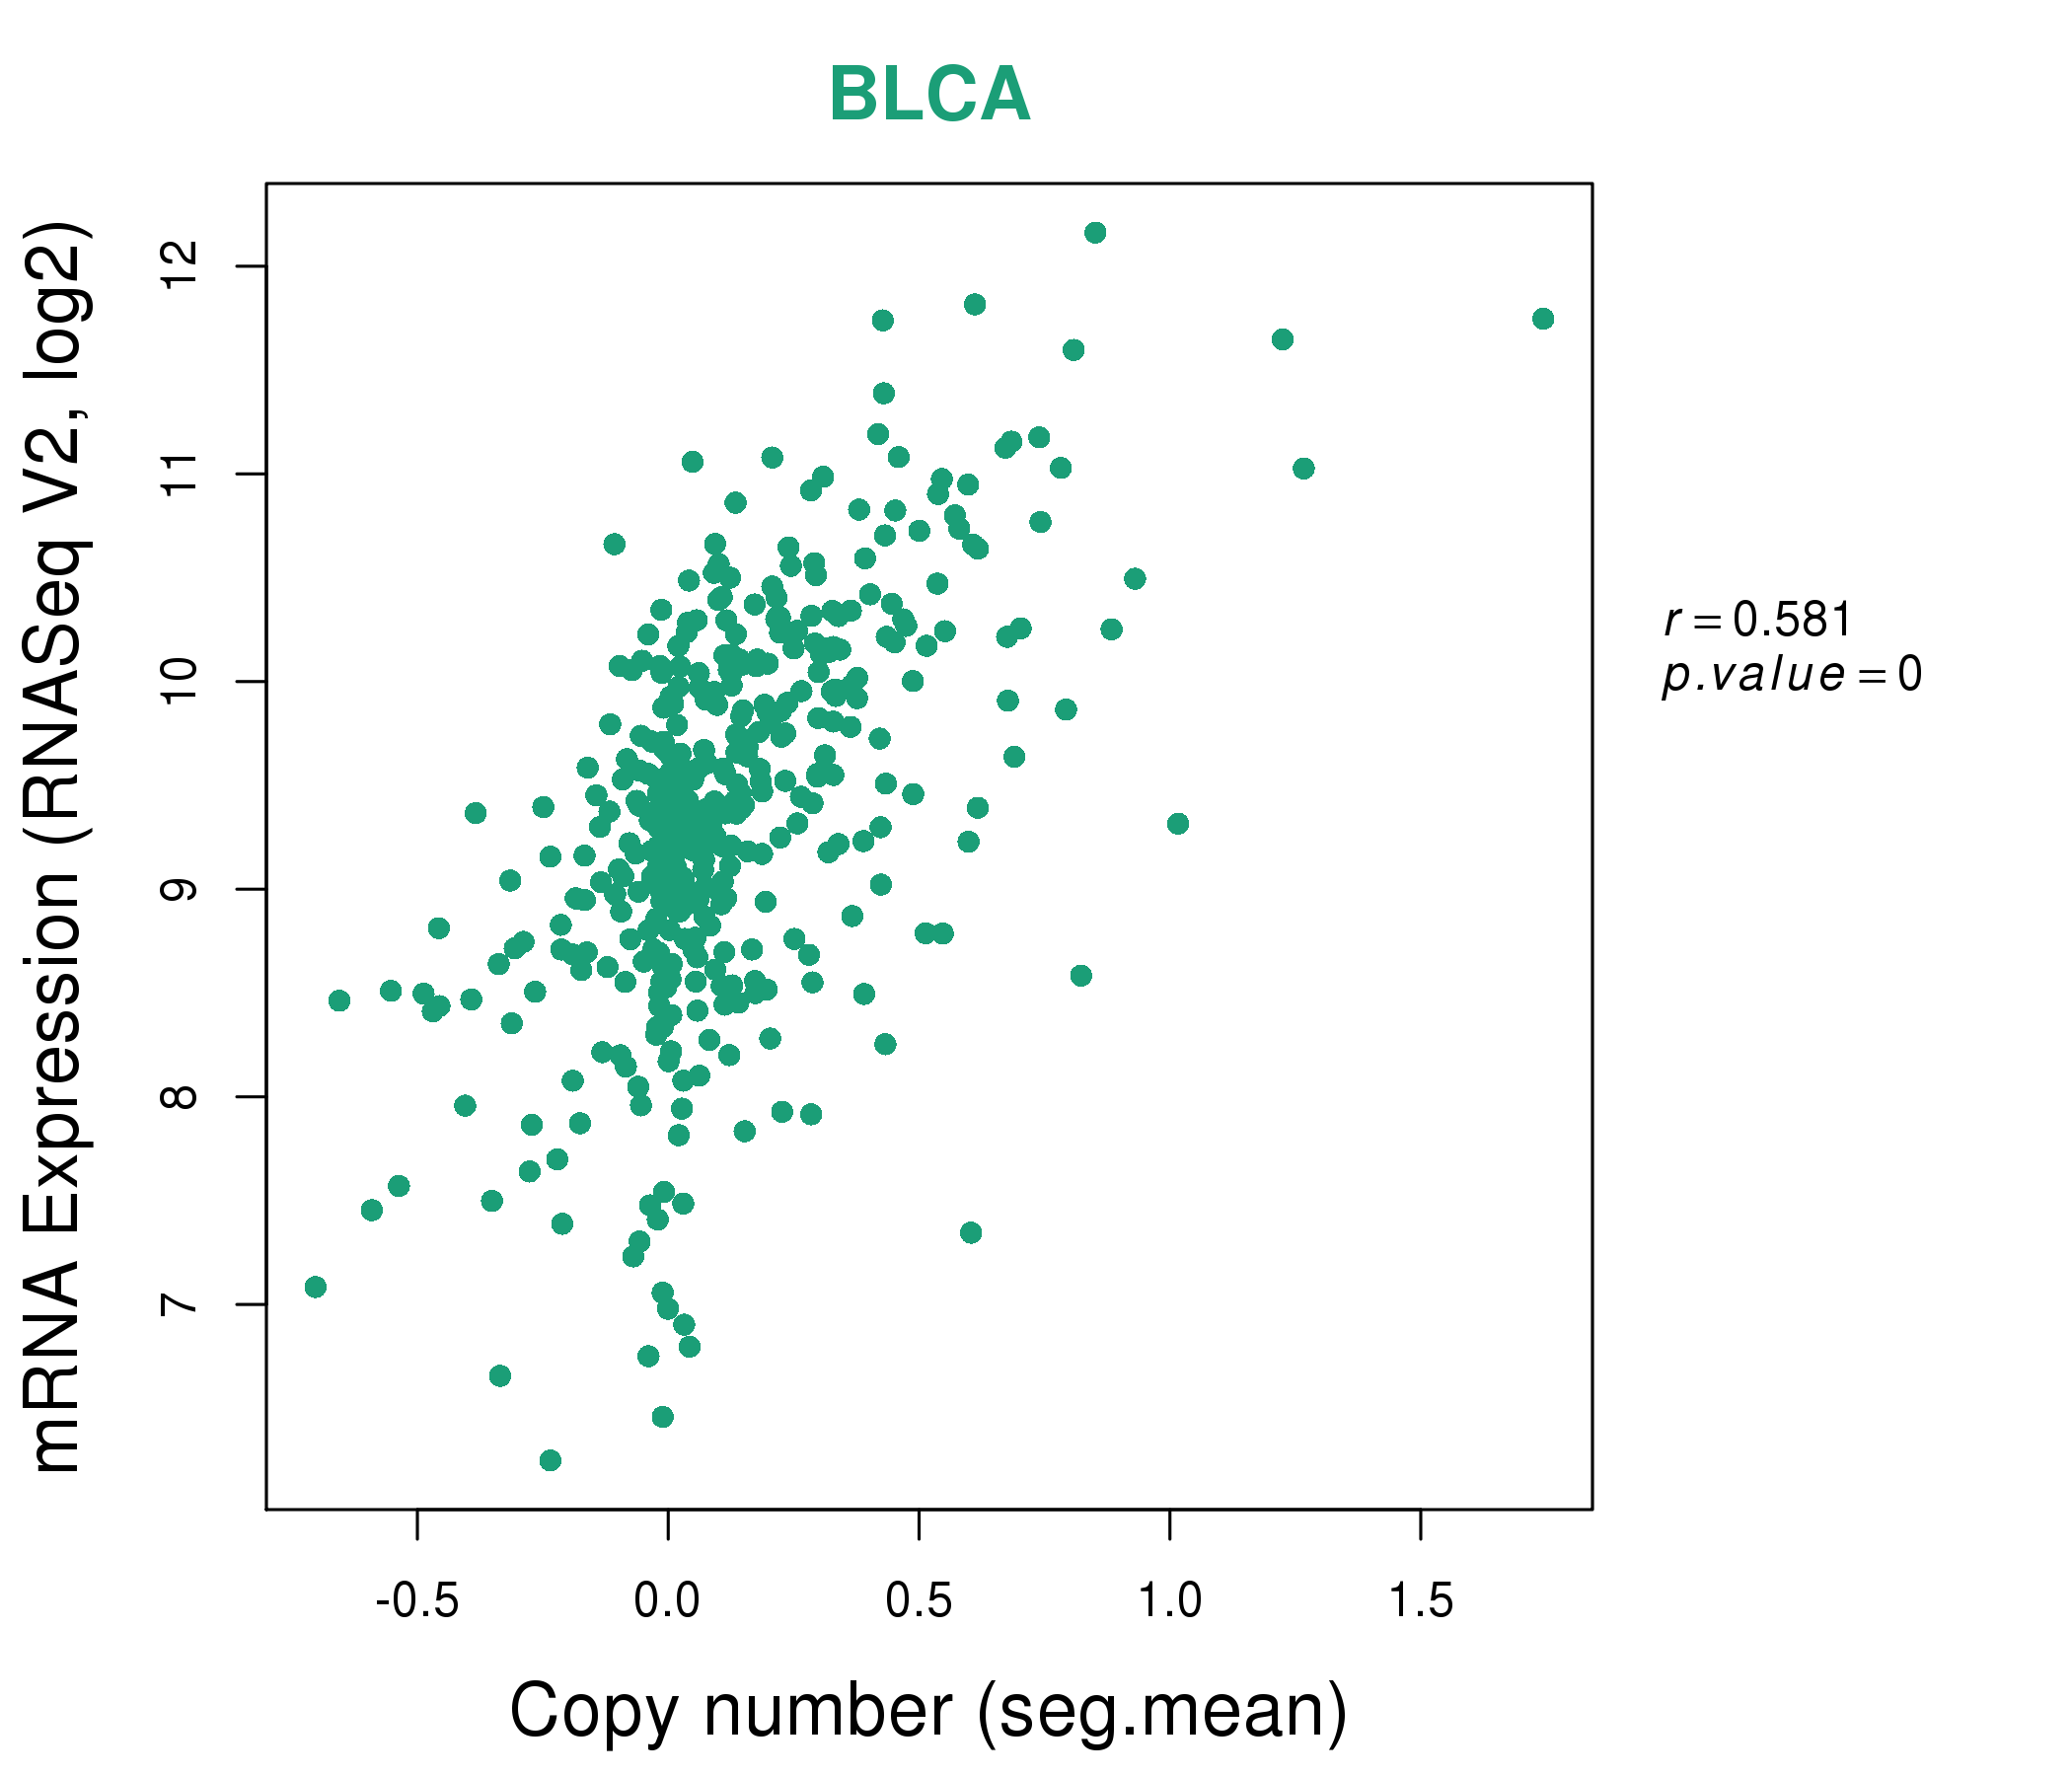
| * This plots show the correlation between CNV and gene expression. |
: Open all plots for all cancer types
 |
|
 |
|


| Top |
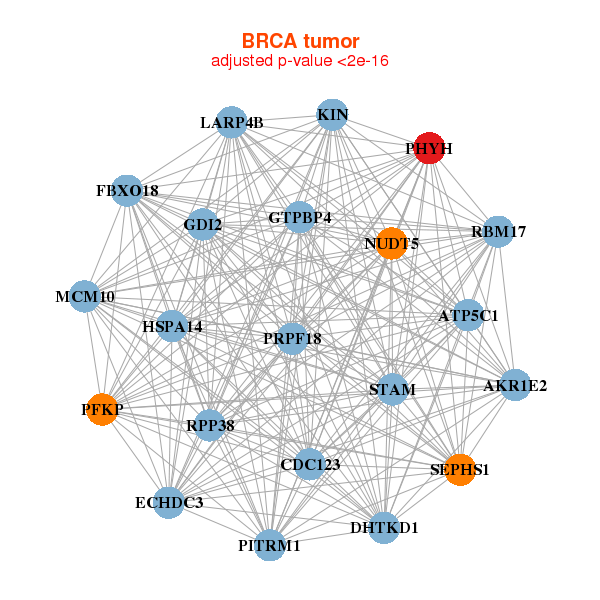
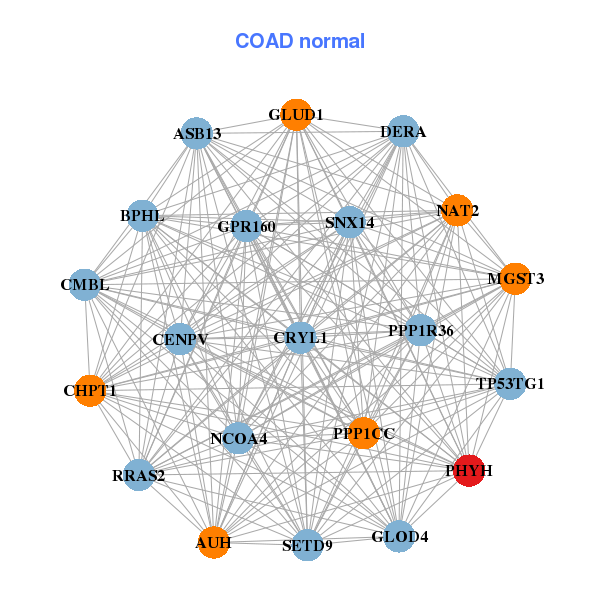
| Gene-Gene Network Information |
| * Co-Expression network figures were drawn using R package igraph. Only the top 20 genes with the highest correlations were shown. Red circle: input gene, orange circle: cell metabolism gene, sky circle: other gene |
: Open all plots for all cancer types
 |
| ||||
| AKR1E2,ATP5C1,CDC123,DHTKD1,ECHDC3,FBXO18,GDI2, GTPBP4,HSPA14,KIN,LARP4B,MCM10,NUDT5,PFKP, PHYH,PITRM1,PRPF18,RBM17,RPP38,SEPHS1,STAM | ACAT1,ATPAF1,CHCHD3,DLD,ETFDH,GHITM,GNPAT, HADHB,HOXA10,HSPB6,OPTN,PGM1,PHYH,PPP3CB, RRAGD,SDHB,SGCG,SNTA1,ST3GAL3,SUCLA2,TBX15 | ||||
 |
| ||||
| APLF,DHTKD1,ENPP5,FMO4,GPR160,HIBADH,HTATIP2, KIAA1841,KIN,LOC375190,LYRM7,NUDT7,PCTP,PHYH, RAB32,RSU1,RWDD3,TDGF1,TMEM176A,TP53TG1,TSPAN6 | ASB13,AUH,BPHL,PPP1R36,SETD9,CENPV,CHPT1, CMBL,CRYL1,DERA,GLOD4,GLUD1,GPR160,MGST3, NAT2,NCOA4,PHYH,PPP1CC,RRAS2,SNX14,TP53TG1 |

| * Co-Expression network figures were drawn using R package igraph. Only the top 20 genes with the highest correlations were shown. Red circle: input gene, orange circle: cell metabolism gene, sky circle: other gene |
: Open all plots for all cancer types
| Top |
: Open all interacting genes' information including KEGG pathway for all interacting genes from DAVID
| Top |
| Pharmacological Information for PHYH |
| DB Category | DB Name | DB's ID and Url link |
| * Gene Centered Interaction Network. |
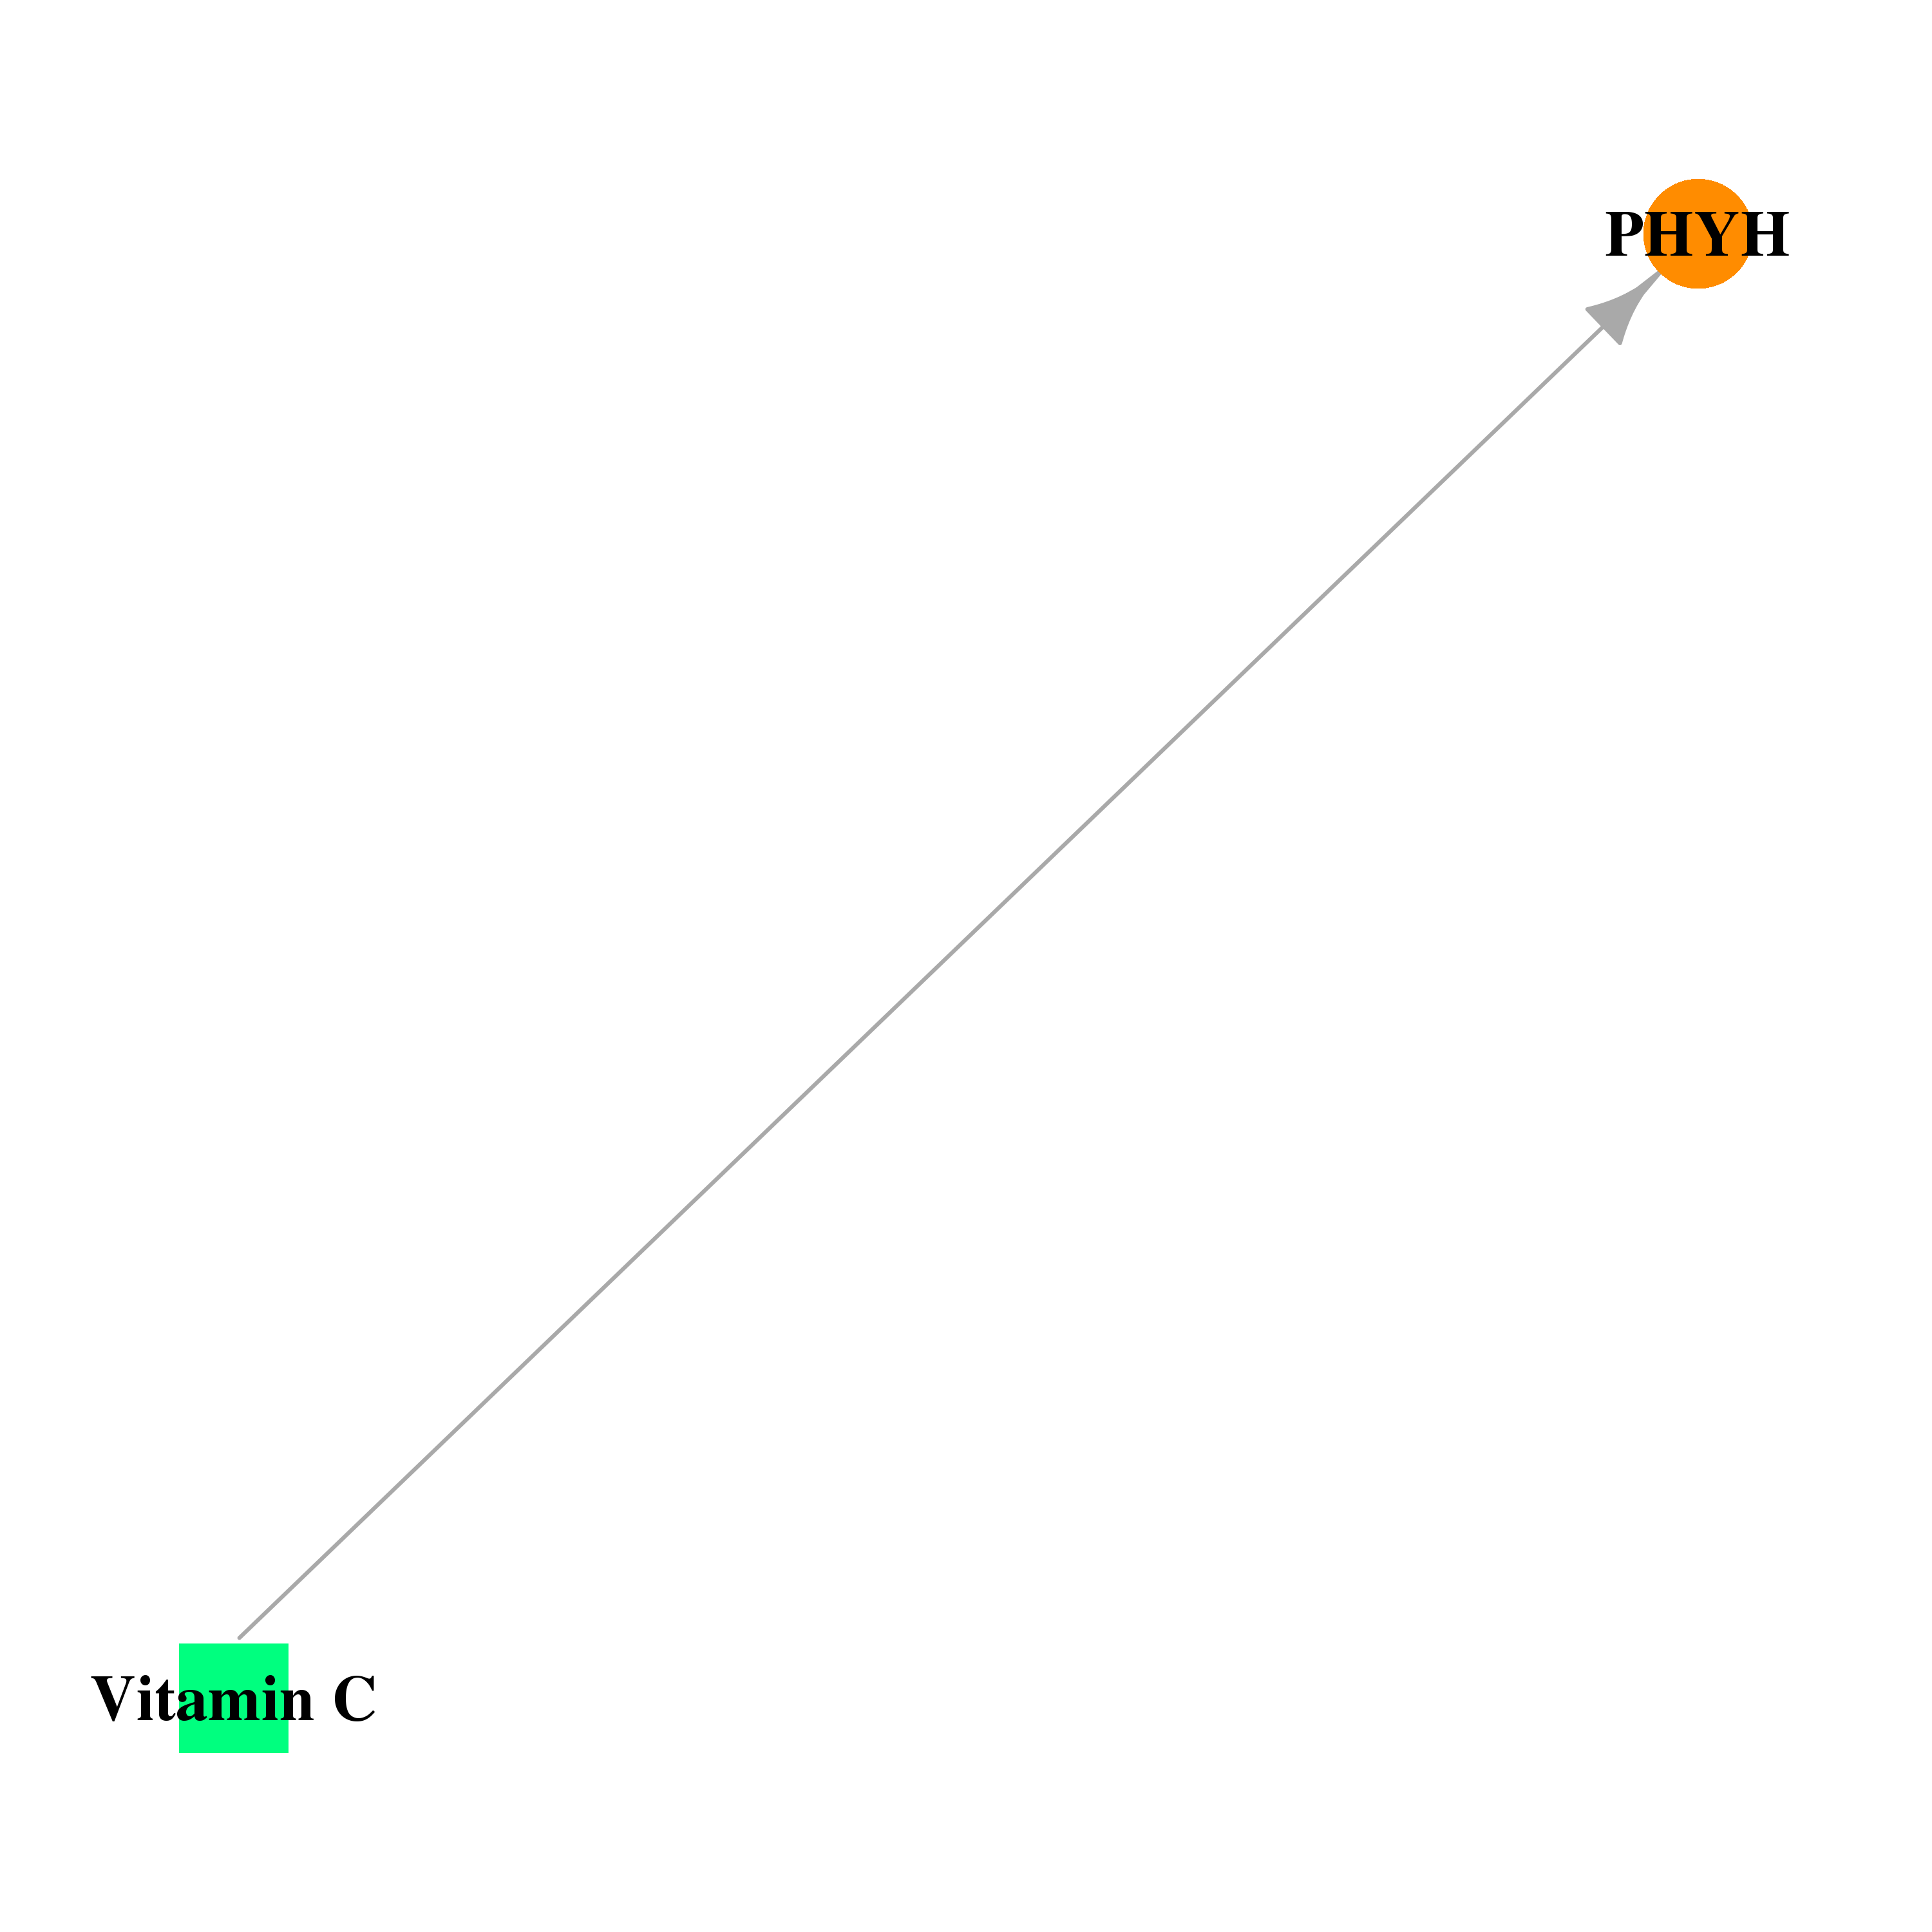 |
| * Drug Centered Interaction Network. |
| DrugBank ID | Target Name | Drug Groups | Generic Name | Drug Centered Network | Drug Structure |
| DB00126 | phytanoyl-CoA 2-hydroxylase | approved; nutraceutical | Vitamin C | 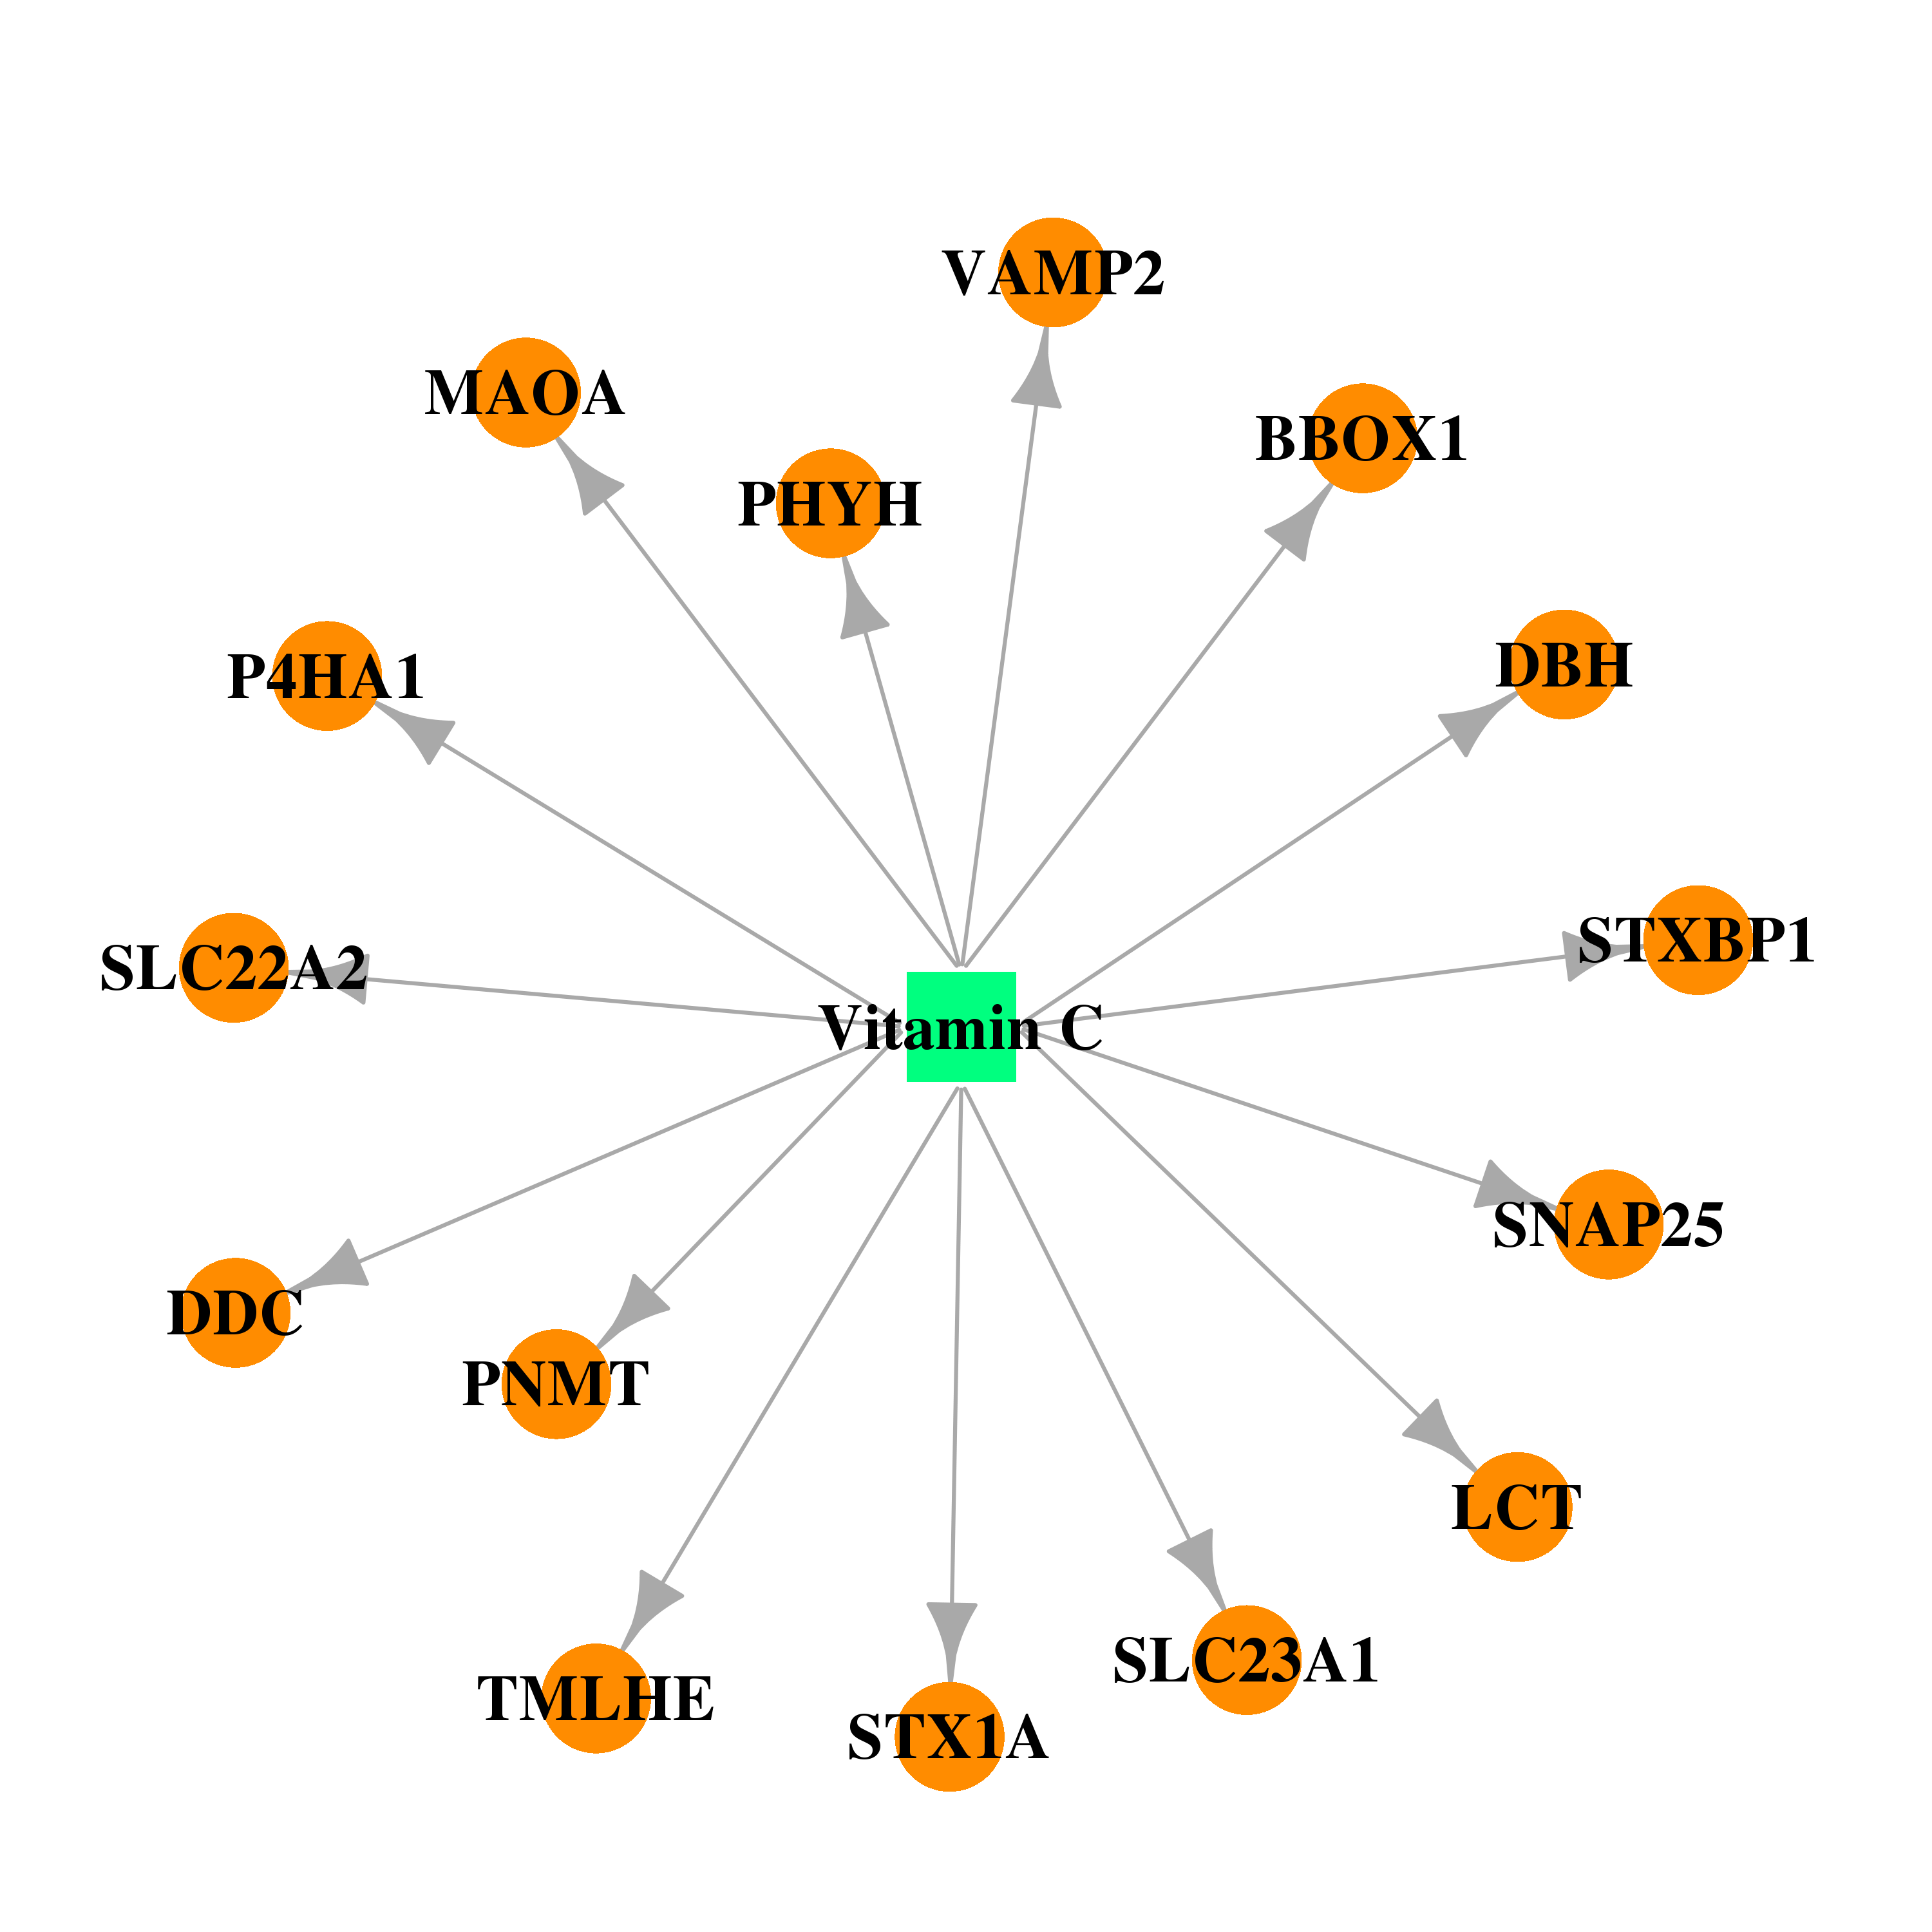 | 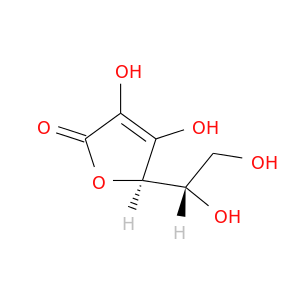 |
| Top |
| Cross referenced IDs for PHYH |
| * We obtained these cross-references from Uniprot database. It covers 150 different DBs, 18 categories. http://www.uniprot.org/help/cross_references_section |
: Open all cross reference information
|
Copyright © 2016-Present - The Univsersity of Texas Health Science Center at Houston @ |