|
||||||||||||||||||||
| |
| Phenotypic Information (metabolism pathway, cancer, disease, phenome) |
| |
| |
| Gene-Gene Network Information: Co-Expression Network, Interacting Genes & KEGG |
| |
|


| Gene Summary for PIGA |
| Basic gene info. | Gene symbol | PIGA |
| Gene name | phosphatidylinositol glycan anchor biosynthesis, class A | |
| Synonyms | GPI3|MCAHS2|PIG-A|PNH1 | |
| Cytomap | UCSC genome browser: Xp22.1 | |
| Genomic location | chrX :15337572-15353676 | |
| Type of gene | protein-coding | |
| RefGenes | NM_002641.3, NM_020473.3,NR_033835.1,NR_033836.1,NM_020472.1, | |
| Ensembl id | ENSG00000165195 | |
| Description | GLCNAC-PI synthesis proteinGPI anchor biosynthesisclass A GlcNAc-inositol phospholipid assembly proteinphosphatidylinositol N-acetylglucosaminyltransferase subunit Aphosphatidylinositol-glycan biosynthesis, class A protein | |
| Modification date | 20141207 | |
| dbXrefs | MIM : 311770 | |
| HGNC : HGNC | ||
| Ensembl : ENSG00000165195 | ||
| HPRD : 02410 | ||
| Vega : OTTHUMG00000021174 | ||
| Protein | UniProt: go to UniProt's Cross Reference DB Table | |
| Expression | CleanEX: HS_PIGA | |
| BioGPS: 5277 | ||
| Gene Expression Atlas: ENSG00000165195 | ||
| The Human Protein Atlas: ENSG00000165195 | ||
| Pathway | NCI Pathway Interaction Database: PIGA | |
| KEGG: PIGA | ||
| REACTOME: PIGA | ||
| ConsensusPathDB | ||
| Pathway Commons: PIGA | ||
| Metabolism | MetaCyc: PIGA | |
| HUMANCyc: PIGA | ||
| Regulation | Ensembl's Regulation: ENSG00000165195 | |
| miRBase: chrX :15,337,572-15,353,676 | ||
| TargetScan: NM_002641 | ||
| cisRED: ENSG00000165195 | ||
| Context | iHOP: PIGA | |
| cancer metabolism search in PubMed: PIGA | ||
| UCL Cancer Institute: PIGA | ||
| Assigned class in ccmGDB | C | |
| Top |
| Phenotypic Information for PIGA(metabolism pathway, cancer, disease, phenome) |
| Cancer | CGAP: PIGA |
| Familial Cancer Database: PIGA | |
| * This gene is included in those cancer gene databases. |
|
|
|
|
|
| . | ||||||||||||||
Oncogene 1 | Significant driver gene in | |||||||||||||||||||
| cf) number; DB name 1 Oncogene; http://nar.oxfordjournals.org/content/35/suppl_1/D721.long, 2 Tumor Suppressor gene; https://bioinfo.uth.edu/TSGene/, 3 Cancer Gene Census; http://www.nature.com/nrc/journal/v4/n3/abs/nrc1299.html, 4 CancerGenes; http://nar.oxfordjournals.org/content/35/suppl_1/D721.long, 5 Network of Cancer Gene; http://ncg.kcl.ac.uk/index.php, 1Therapeutic Vulnerabilities in Cancer; http://cbio.mskcc.org/cancergenomics/statius/ |
| REACTOME_METABOLISM_OF_PROTEINS | |
| OMIM | |
| Orphanet | |
| Disease | KEGG Disease: PIGA |
| MedGen: PIGA (Human Medical Genetics with Condition) | |
| ClinVar: PIGA | |
| Phenotype | MGI: PIGA (International Mouse Phenotyping Consortium) |
| PhenomicDB: PIGA | |
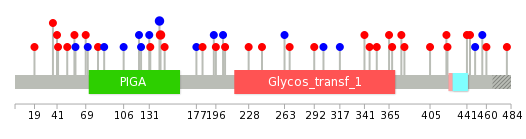
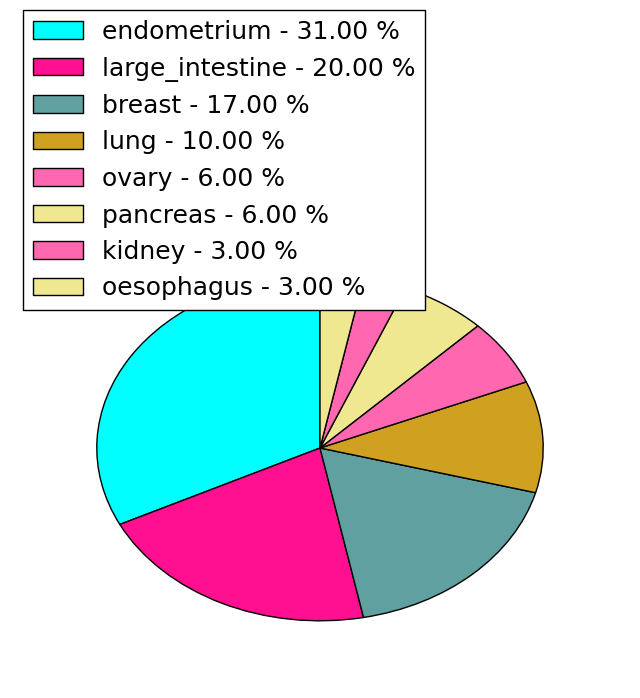
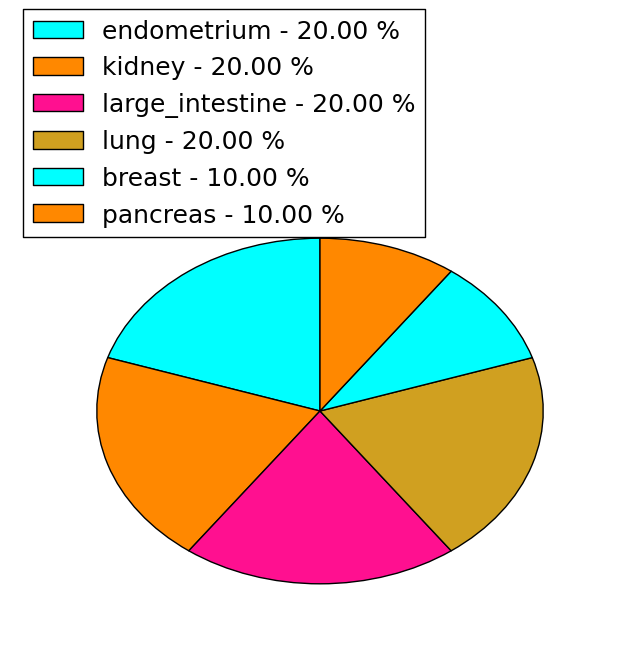
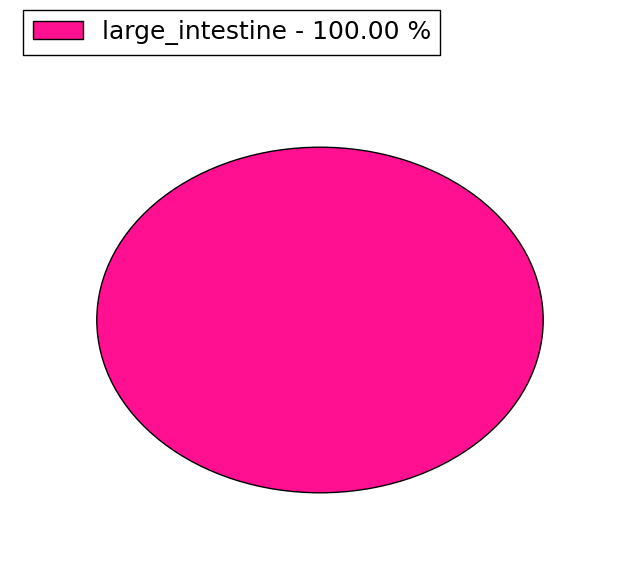
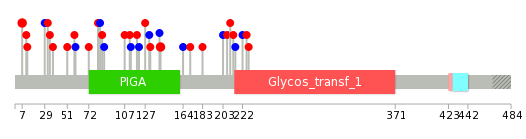
| Mutations for PIGA |
| * Under tables are showing count per each tissue to give us broad intuition about tissue specific mutation patterns.You can go to the detailed page for each mutation database's web site. |
| There's no structural variation information in COSMIC data for this gene. |
| * From mRNA Sanger sequences, Chitars2.0 arranged chimeric transcripts. This table shows PIGA related fusion information. |
| ID | Head Gene | Tail Gene | Accession | Gene_a | qStart_a | qEnd_a | Chromosome_a | tStart_a | tEnd_a | Gene_a | qStart_a | qEnd_a | Chromosome_a | tStart_a | tEnd_a |
| Top |
| There's no copy number variation information in COSMIC data for this gene. |
| Top |
|
 |
| Top |
| Stat. for Non-Synonymous SNVs (# total SNVs=29) | (# total SNVs=10) |
 |  |
(# total SNVs=1) | (# total SNVs=0) |
 |
| Top |
| * When you move the cursor on each content, you can see more deailed mutation information on the Tooltip. Those are primary_site,primary_histology,mutation(aa),pubmedID. |
| GRCh37 position | Mutation(aa) | Unique sampleID count |
| chr23:15349629-15349629 | p.A142T | 2 |
| chr23:15349630-15349630 | p.H141H | 2 |
| chr23:15342846-15342846 | p.I377F | 1 |
| chr23:15349876-15349876 | p.C59C | 1 |
| chr23:15344163-15344163 | p.D241N | 1 |
| chr23:15339644-15339644 | p.I480T | 1 |
| chr23:15349658-15349658 | p.S132Y | 1 |
| chr23:15342872-15342872 | p.S368L | 1 |
| chr23:15349879-15349879 | p.Q58H | 1 |
| chr23:15349370-15349370 | p.I228S | 1 |
| Top |
|
 |
| Point Mutation/ Tissue ID | 1 | 2 | 3 | 4 | 5 | 6 | 7 | 8 | 9 | 10 | 11 | 12 | 13 | 14 | 15 | 16 | 17 | 18 | 19 | 20 |
| # sample | 1 | 2 | 1 | 4 | 3 | 2 | 5 | 1 | 1 | 3 | 2 | 10 | ||||||||
| # mutation | 1 | 2 | 1 | 4 | 3 | 2 | 5 | 1 | 1 | 4 | 2 | 10 | ||||||||
| nonsynonymous SNV | 2 | 1 | 2 | 1 | 4 | 1 | 1 | 3 | 1 | 8 | ||||||||||
| synonymous SNV | 1 | 2 | 2 | 2 | 1 | 1 | 1 | 2 |
| cf) Tissue ID; Tissue type (1; BLCA[Bladder Urothelial Carcinoma], 2; BRCA[Breast invasive carcinoma], 3; CESC[Cervical squamous cell carcinoma and endocervical adenocarcinoma], 4; COAD[Colon adenocarcinoma], 5; GBM[Glioblastoma multiforme], 6; Glioma Low Grade, 7; HNSC[Head and Neck squamous cell carcinoma], 8; KICH[Kidney Chromophobe], 9; KIRC[Kidney renal clear cell carcinoma], 10; KIRP[Kidney renal papillary cell carcinoma], 11; LAML[Acute Myeloid Leukemia], 12; LUAD[Lung adenocarcinoma], 13; LUSC[Lung squamous cell carcinoma], 14; OV[Ovarian serous cystadenocarcinoma ], 15; PAAD[Pancreatic adenocarcinoma], 16; PRAD[Prostate adenocarcinoma], 17; SKCM[Skin Cutaneous Melanoma], 18:STAD[Stomach adenocarcinoma], 19:THCA[Thyroid carcinoma], 20:UCEC[Uterine Corpus Endometrial Carcinoma]) |
| Top |
| * We represented just top 10 SNVs. When you move the cursor on each content, you can see more deailed mutation information on the Tooltip. Those are primary_site, primary_histology, mutation(aa), pubmedID. |
| Genomic Position | Mutation(aa) | Unique sampleID count |
| chrX:15349629 | p.D7N,PIGA | 2 |
| chrX:15344163 | p.A142T | 2 |
| chrX:15343172 | p.G11R,PIGA | 1 |
| chrX:15339705 | p.H72R | 1 |
| chrX:15349879 | p.C59C | 1 |
| chrX:15344081 | p.P226S,PIGA | 1 |
| chrX:15349630 | p.I228S | 1 |
| chrX:15339715 | p.Q58H | 1 |
| chrX:15349901 | p.D222D,PIGA | 1 |
| chrX:15344087 | p.T213I | 1 |
| * Copy number data were extracted from TCGA using R package TCGA-Assembler. The URLs of all public data files on TCGA DCC data server were gathered on Jan-05-2015. Function ProcessCNAData in TCGA-Assembler package was used to obtain gene-level copy number value which is calculated as the average copy number of the genomic region of a gene. |
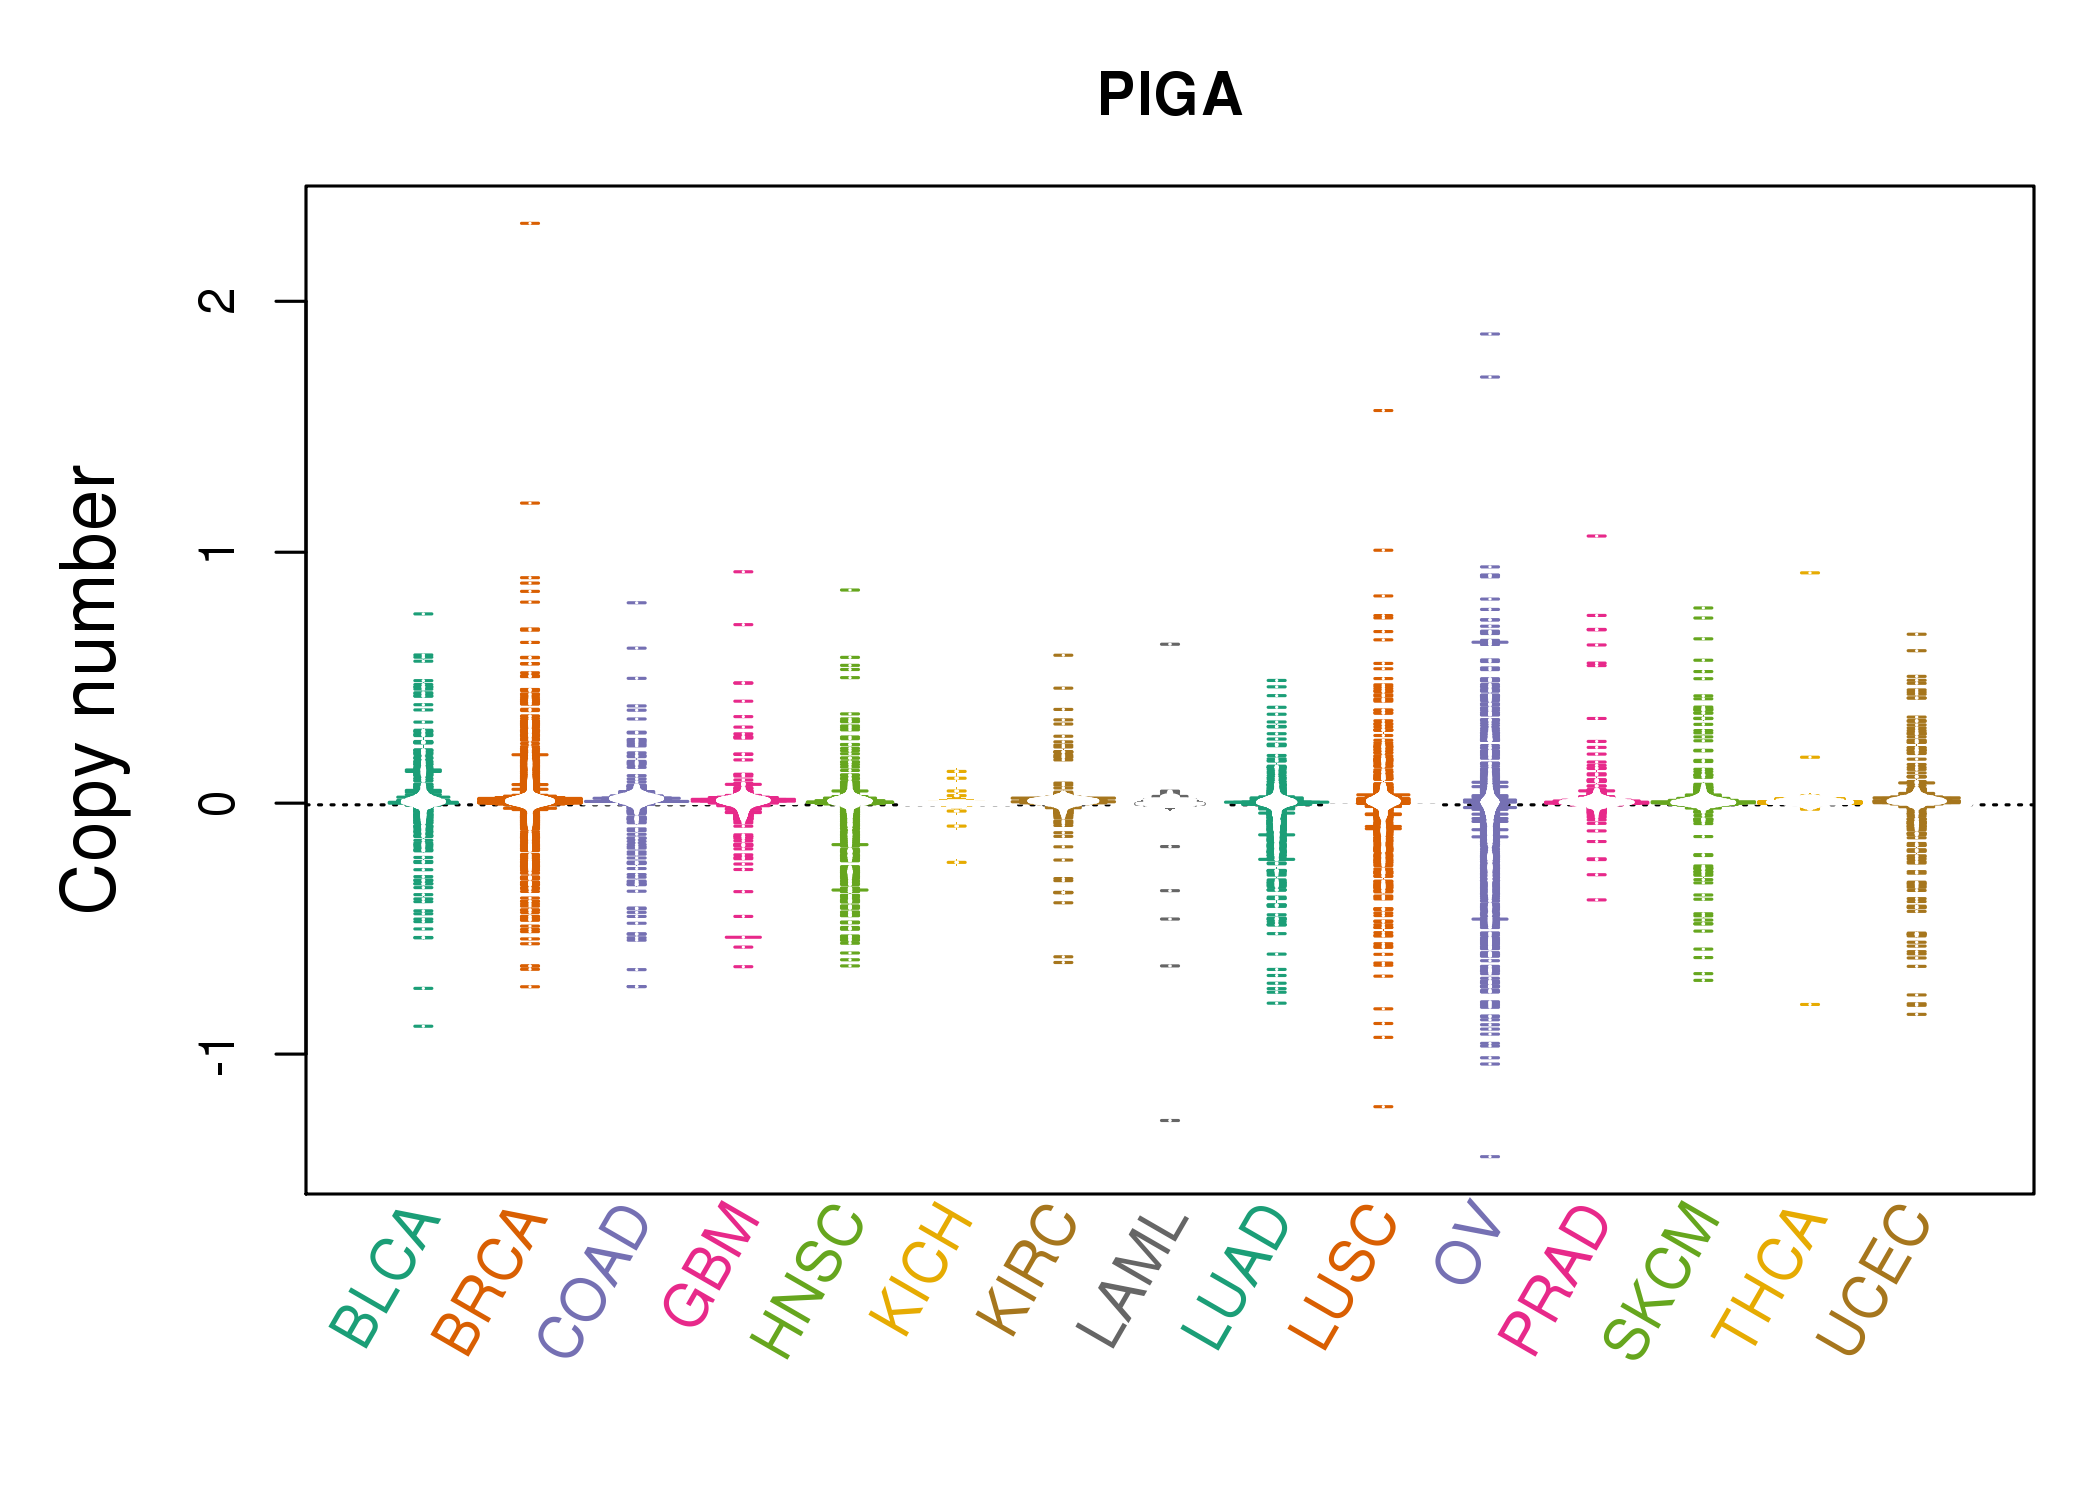 |
| cf) Tissue ID[Tissue type]: BLCA[Bladder Urothelial Carcinoma], BRCA[Breast invasive carcinoma], CESC[Cervical squamous cell carcinoma and endocervical adenocarcinoma], COAD[Colon adenocarcinoma], GBM[Glioblastoma multiforme], Glioma Low Grade, HNSC[Head and Neck squamous cell carcinoma], KICH[Kidney Chromophobe], KIRC[Kidney renal clear cell carcinoma], KIRP[Kidney renal papillary cell carcinoma], LAML[Acute Myeloid Leukemia], LUAD[Lung adenocarcinoma], LUSC[Lung squamous cell carcinoma], OV[Ovarian serous cystadenocarcinoma ], PAAD[Pancreatic adenocarcinoma], PRAD[Prostate adenocarcinoma], SKCM[Skin Cutaneous Melanoma], STAD[Stomach adenocarcinoma], THCA[Thyroid carcinoma], UCEC[Uterine Corpus Endometrial Carcinoma] |
| Top |
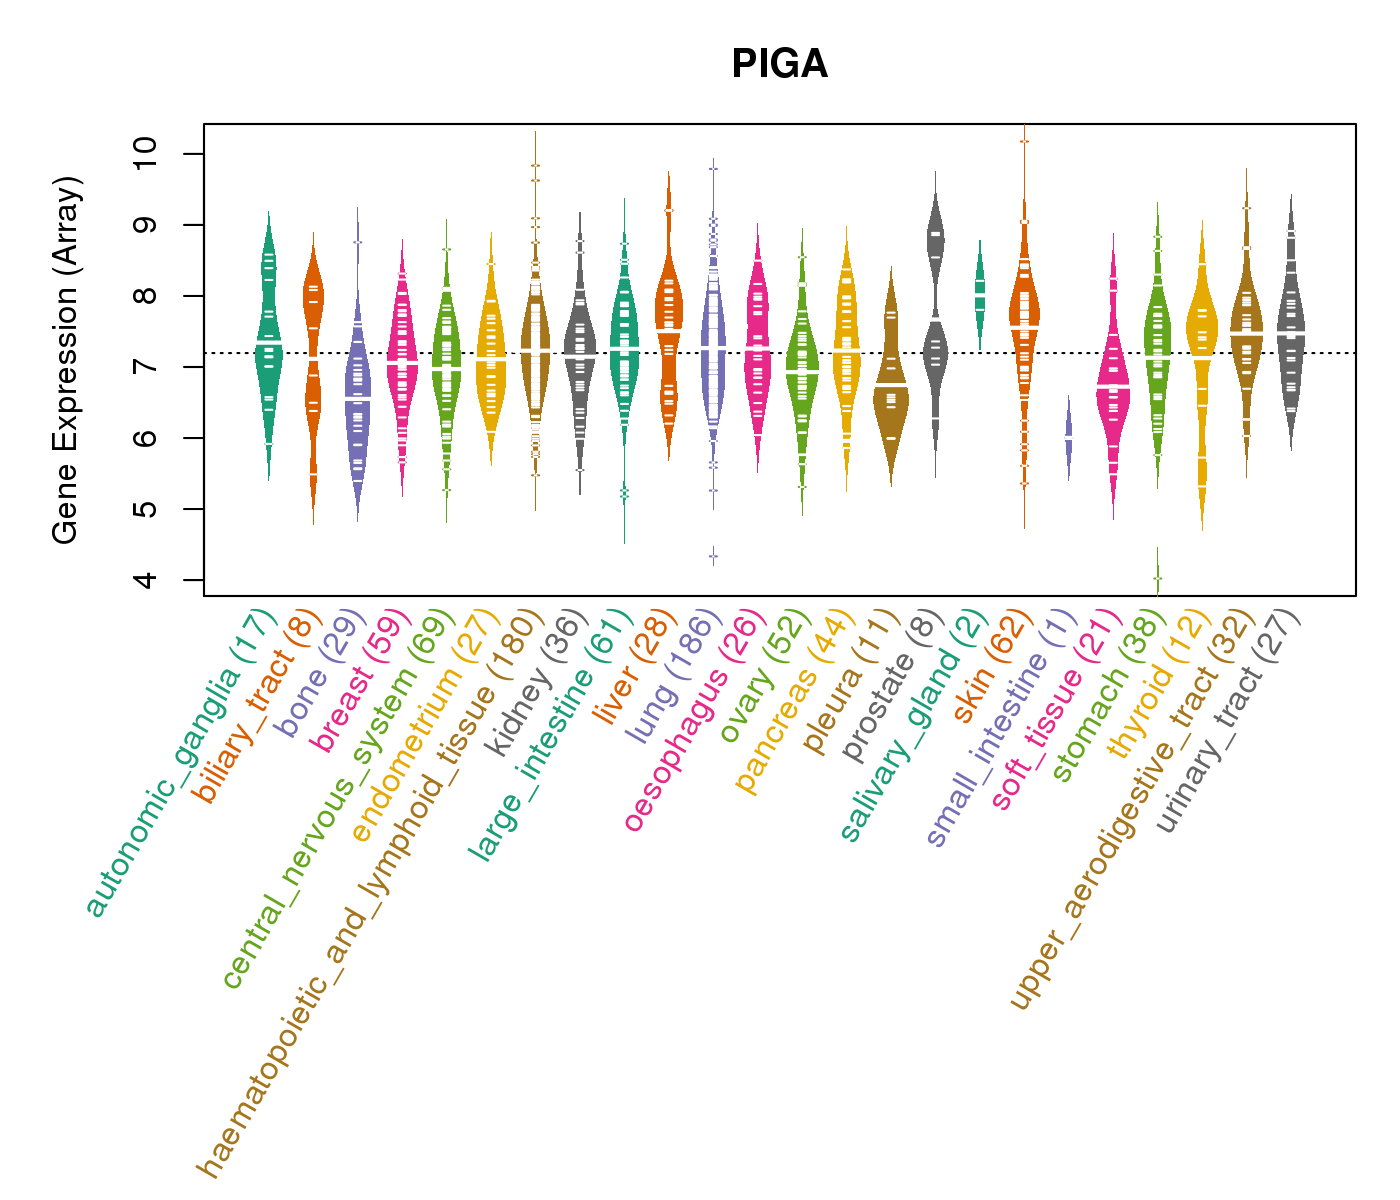
| Gene Expression for PIGA |
| * CCLE gene expression data were extracted from CCLE_Expression_Entrez_2012-10-18.res: Gene-centric RMA-normalized mRNA expression data. |
 |
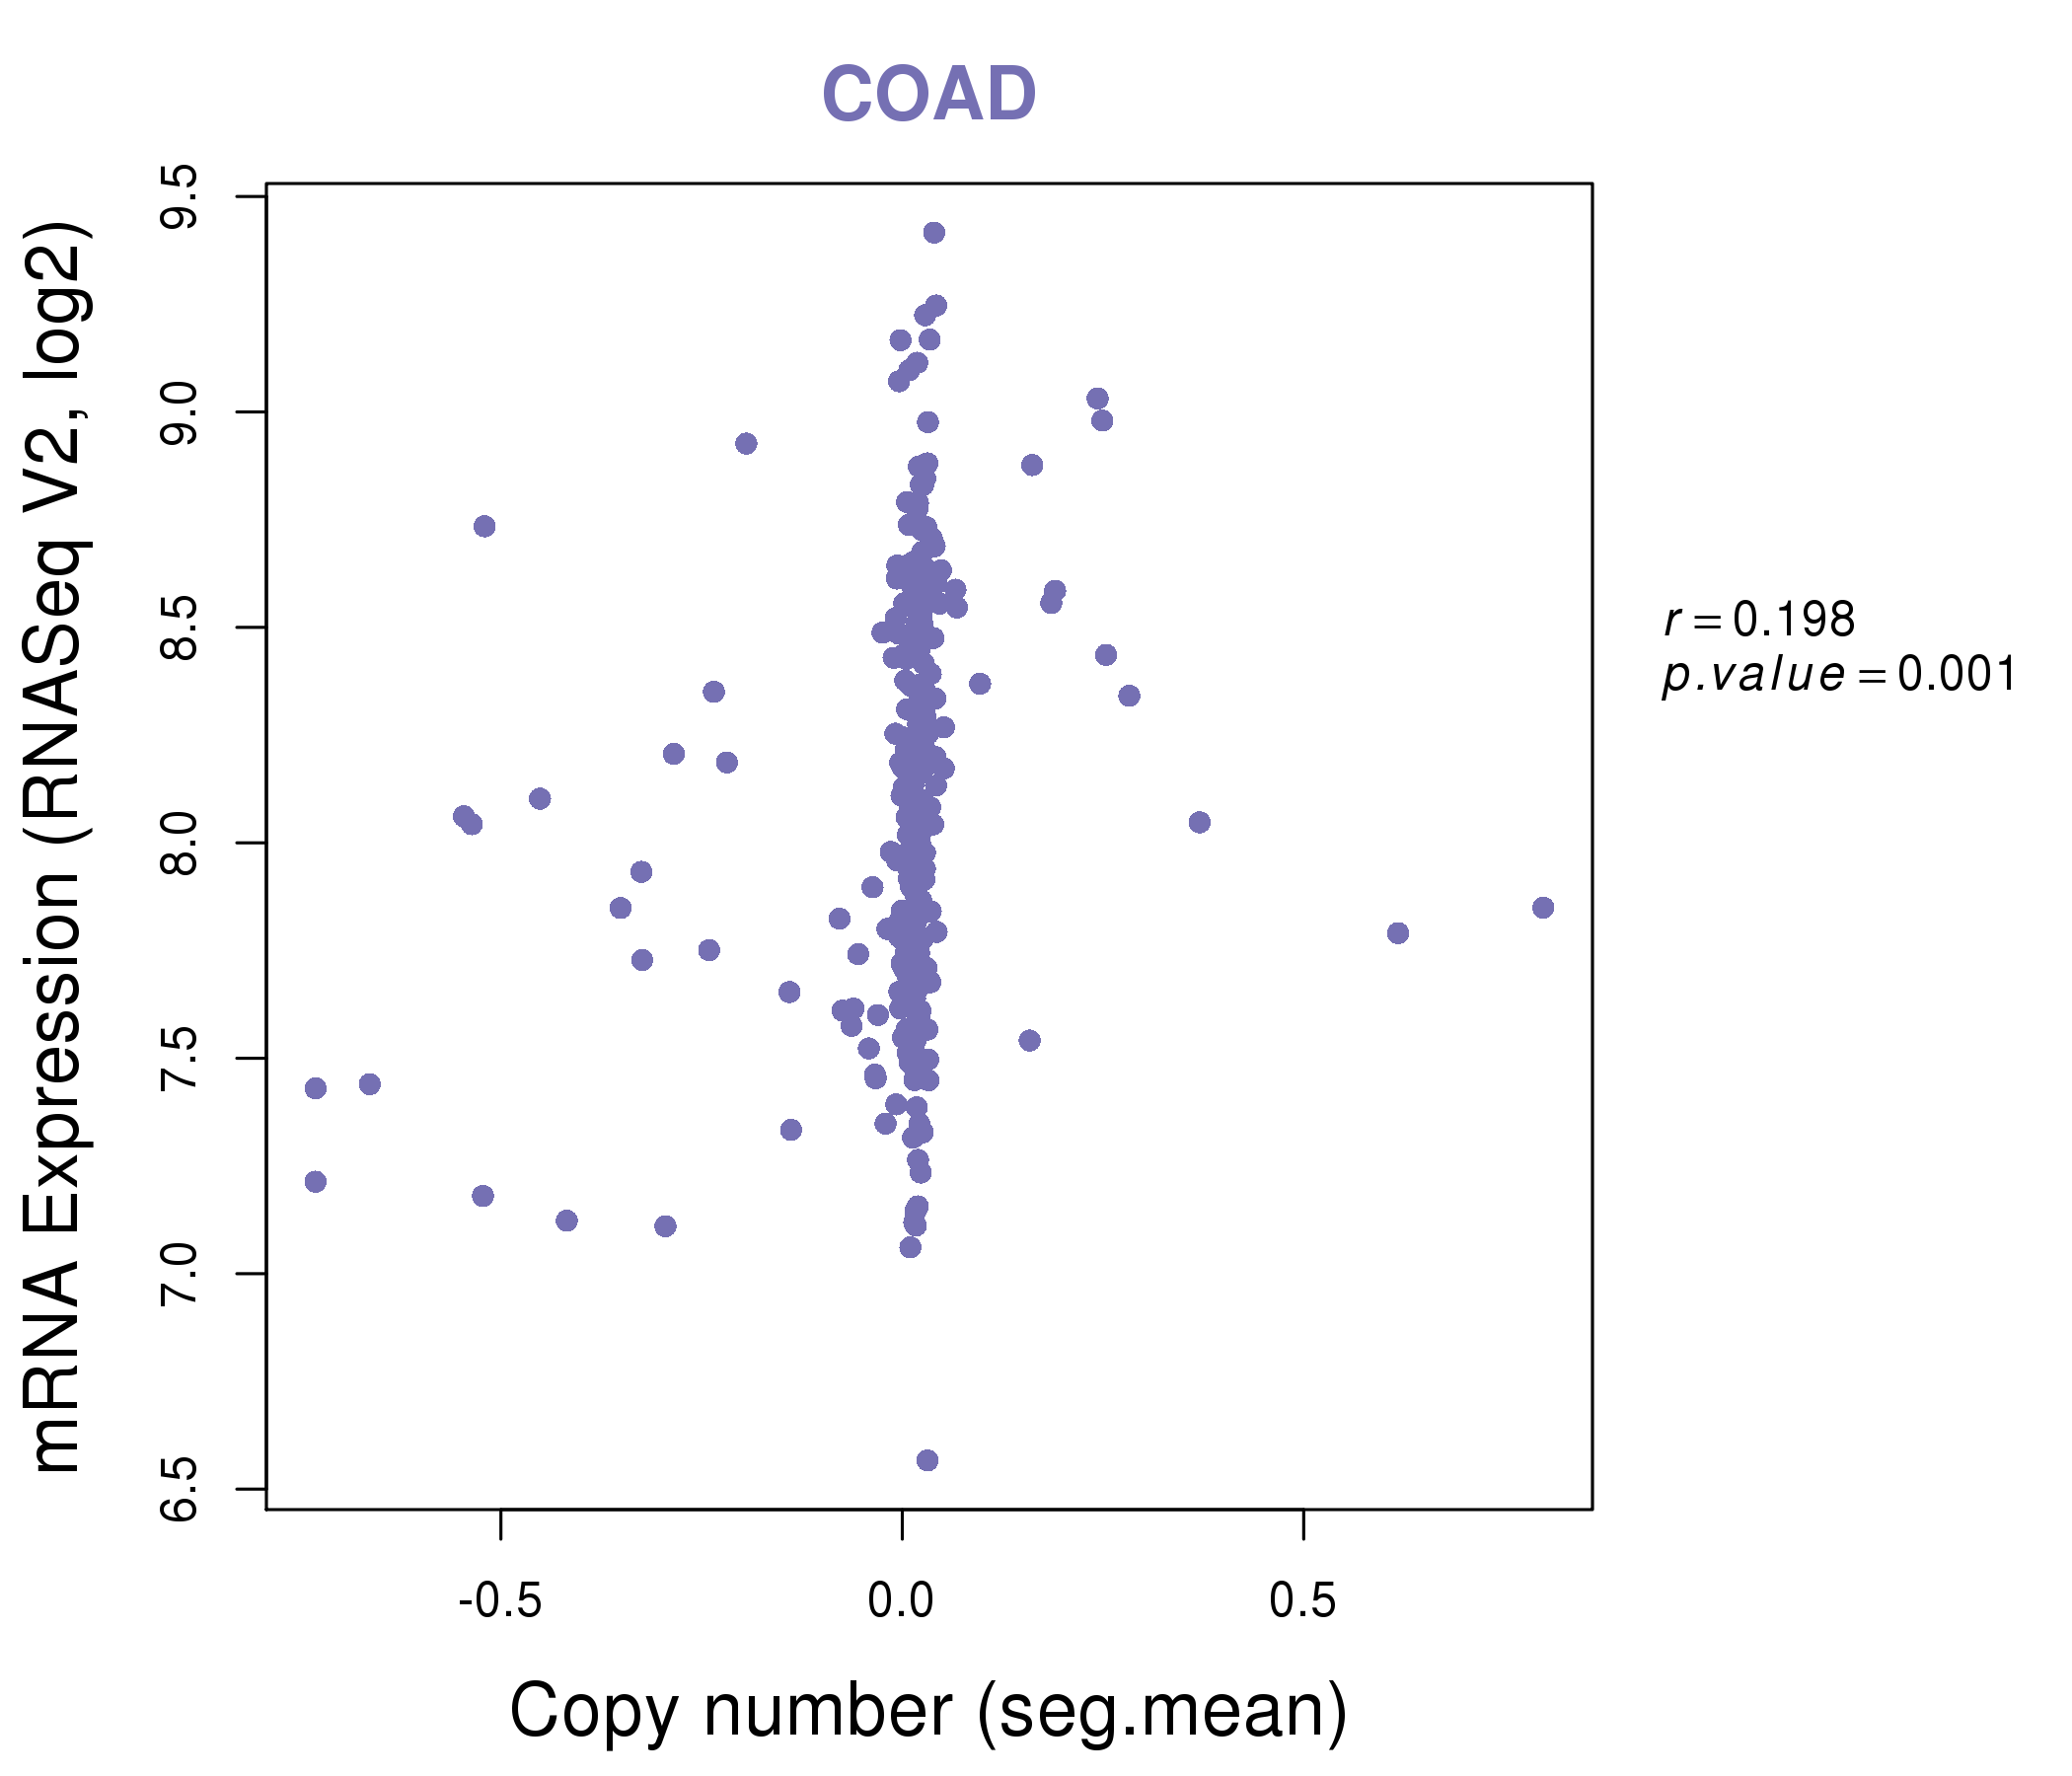
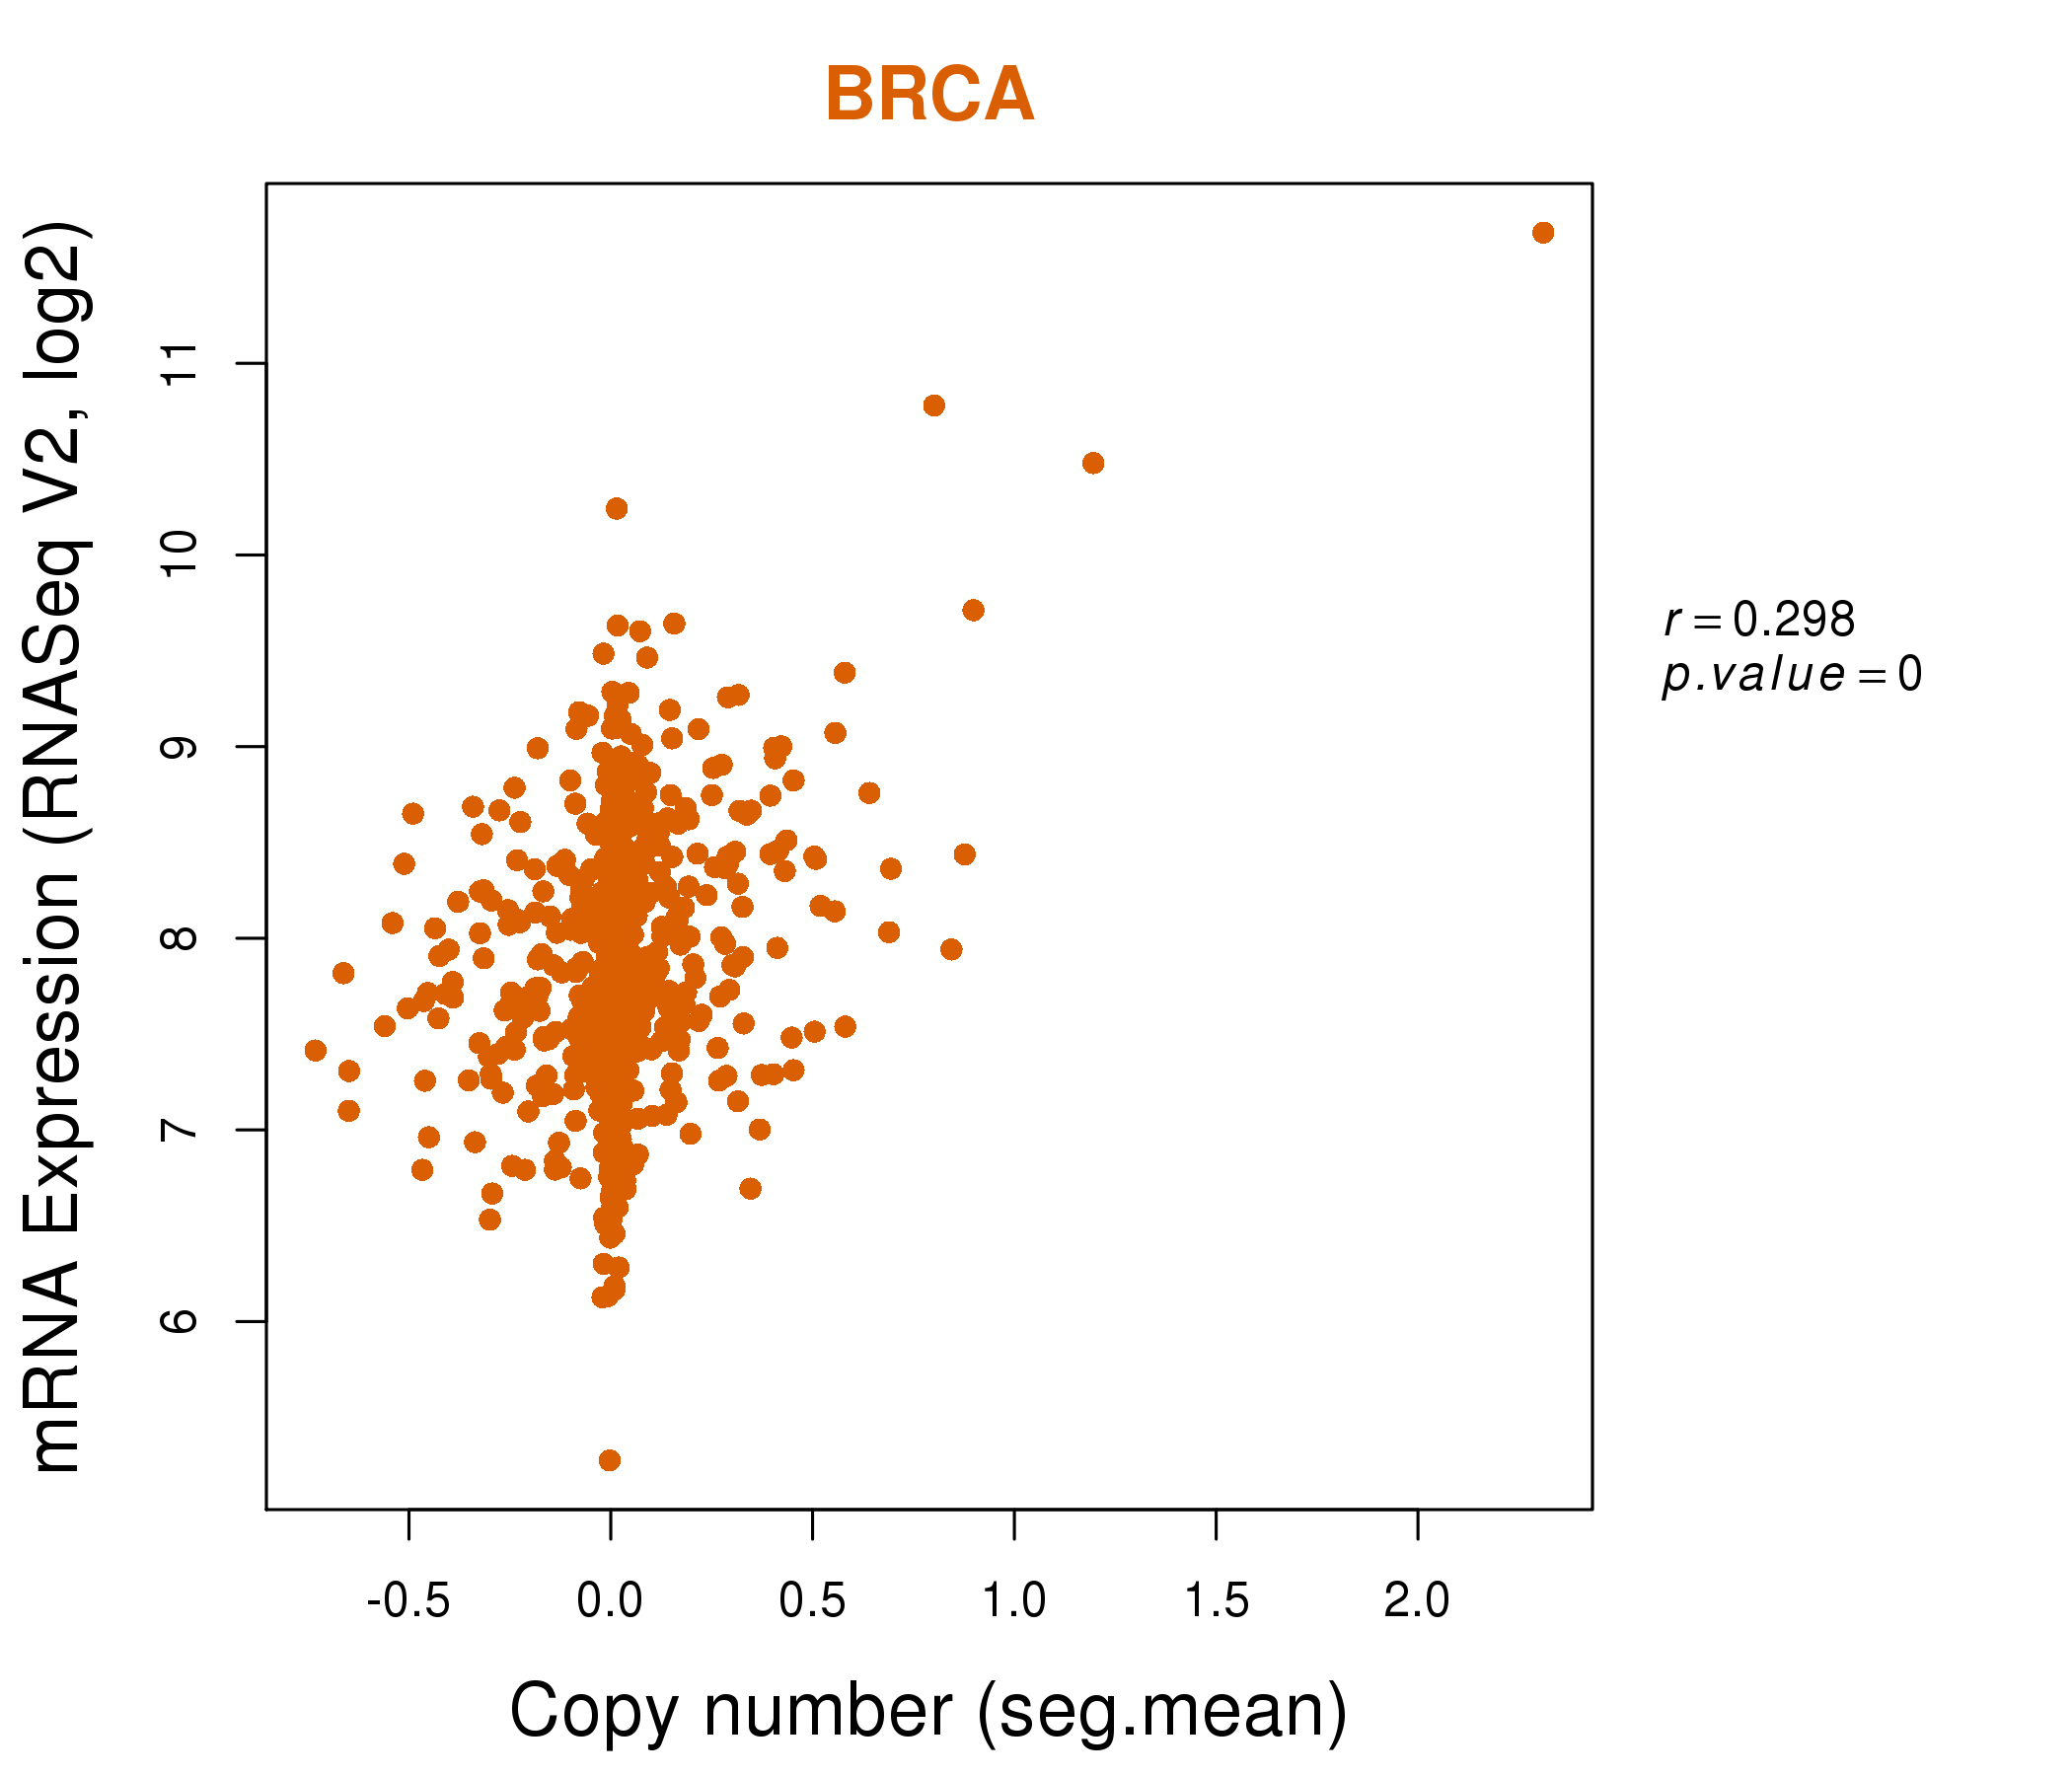
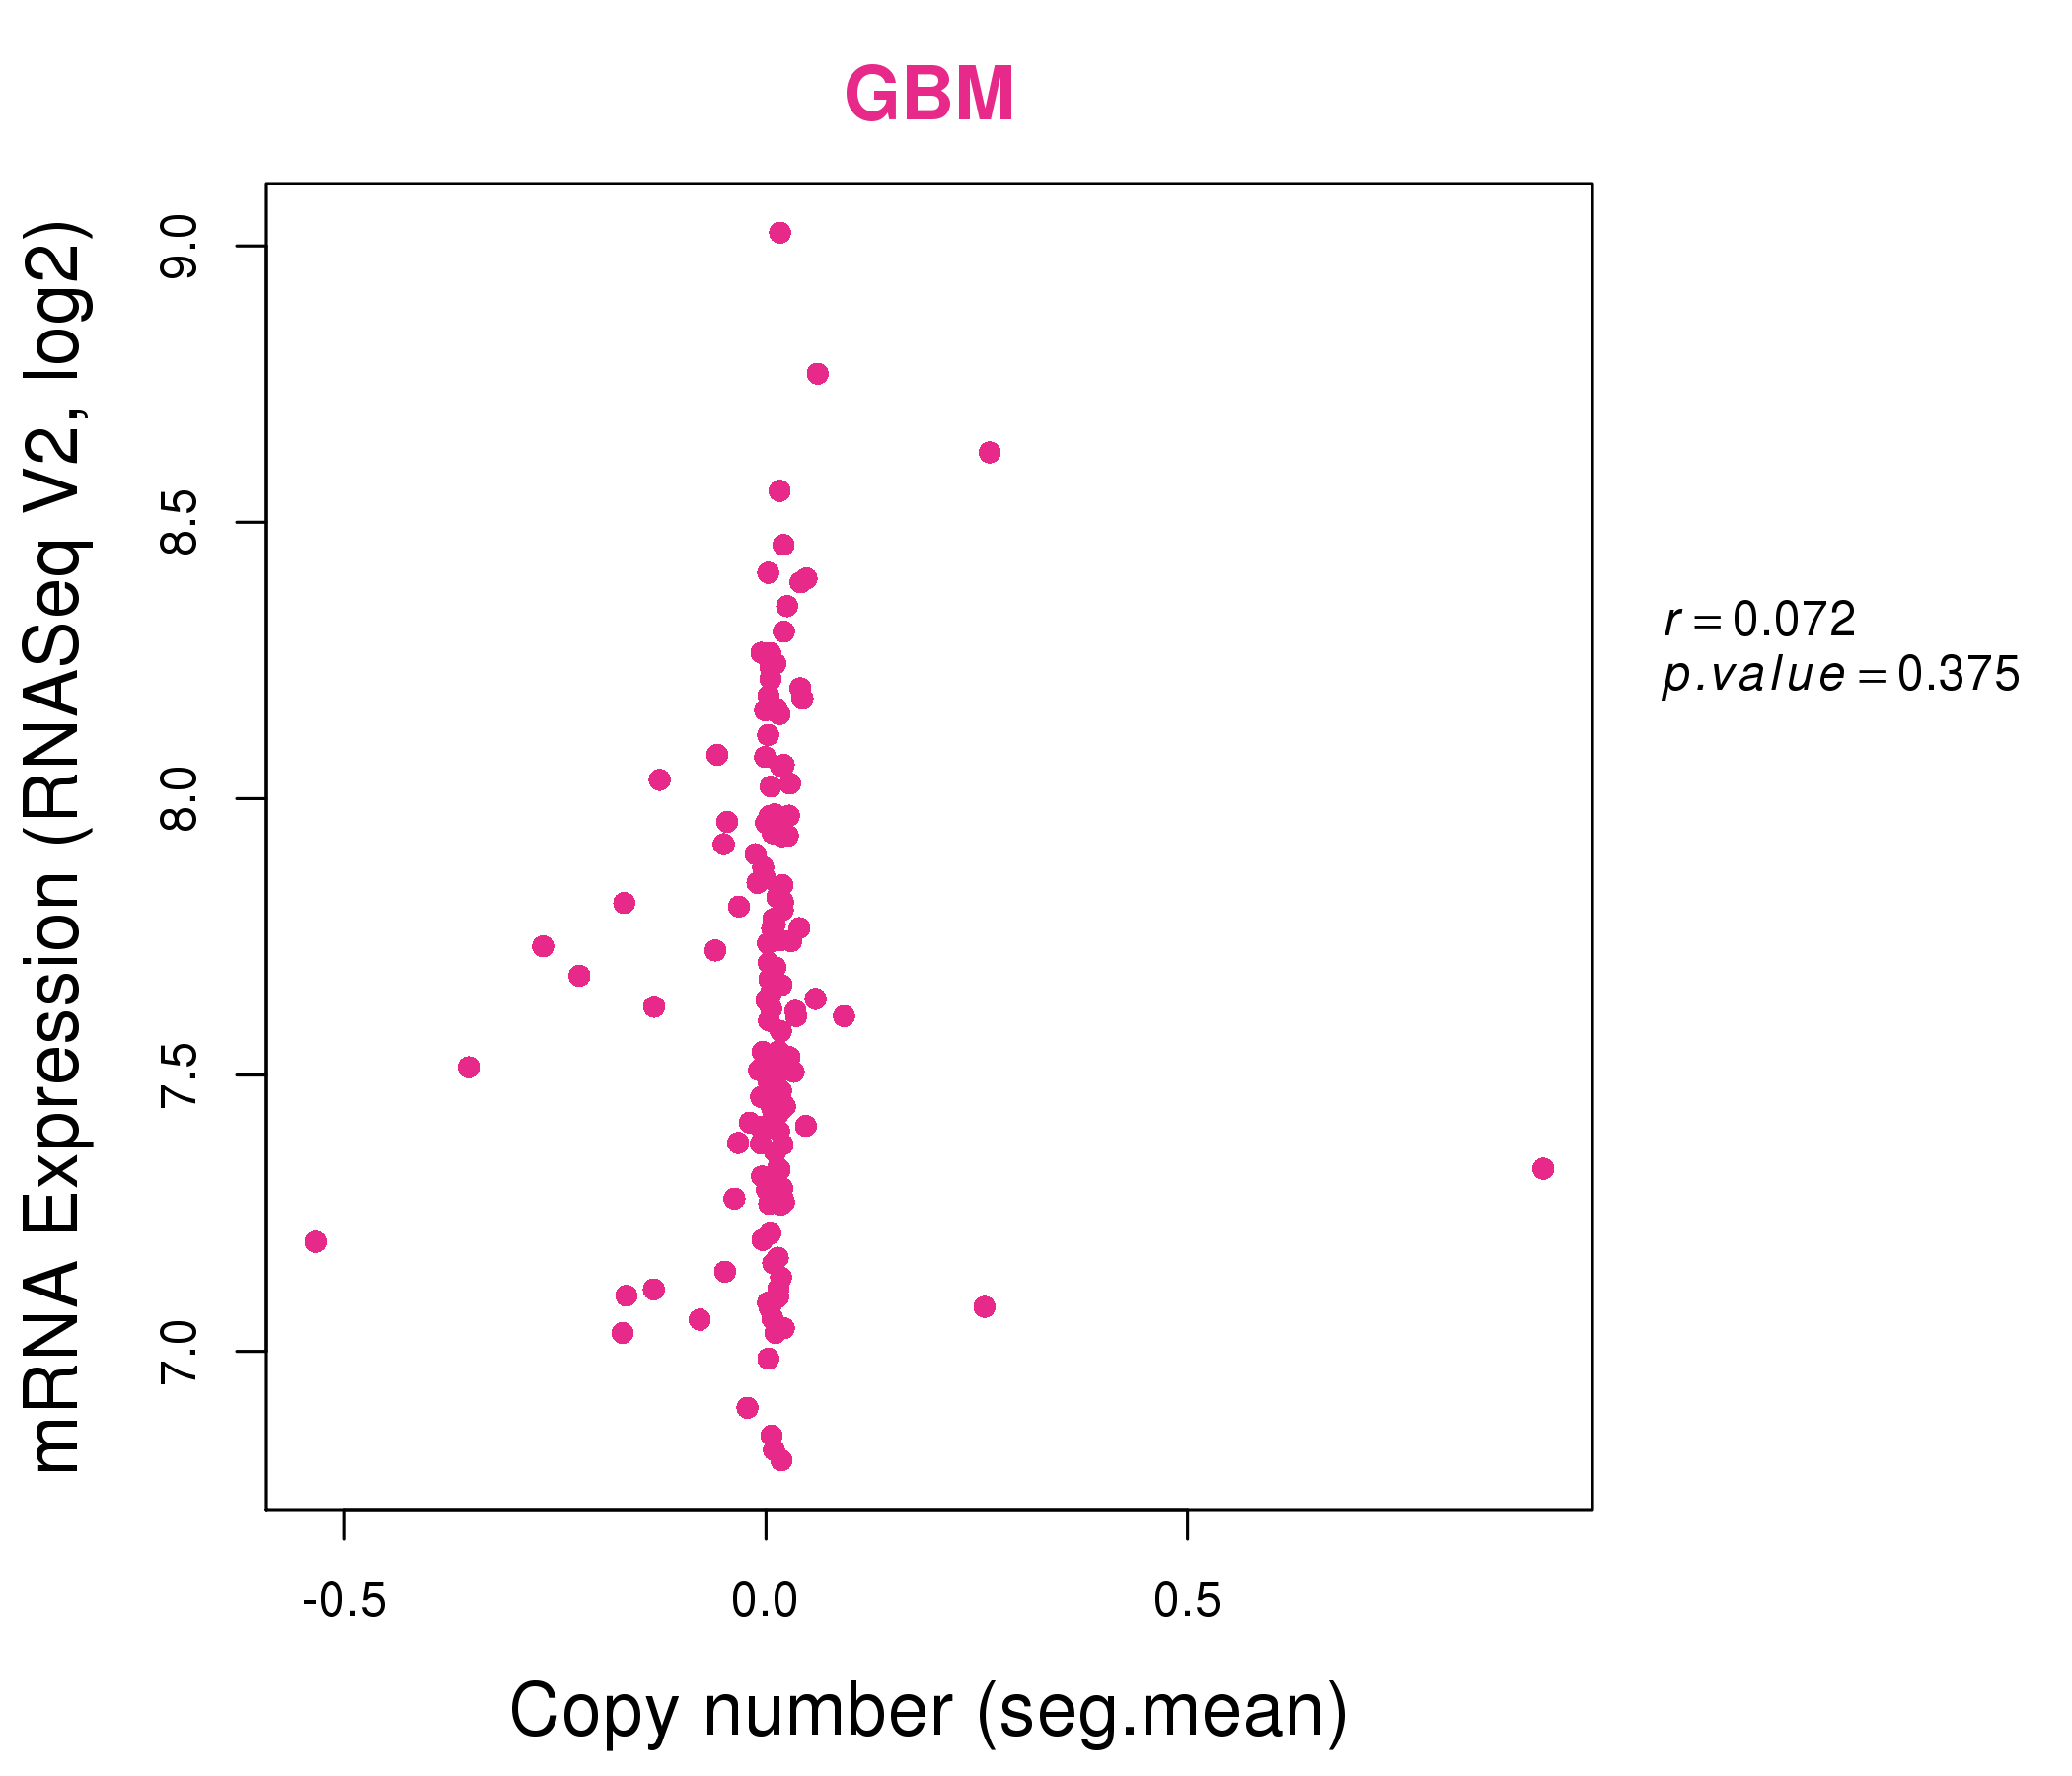
| * Normalized gene expression data of RNASeqV2 was extracted from TCGA using R package TCGA-Assembler. The URLs of all public data files on TCGA DCC data server were gathered at Jan-05-2015. Only eight cancer types have enough normal control samples for differential expression analysis. (t test, adjusted p<0.05 (using Benjamini-Hochberg FDR)) |
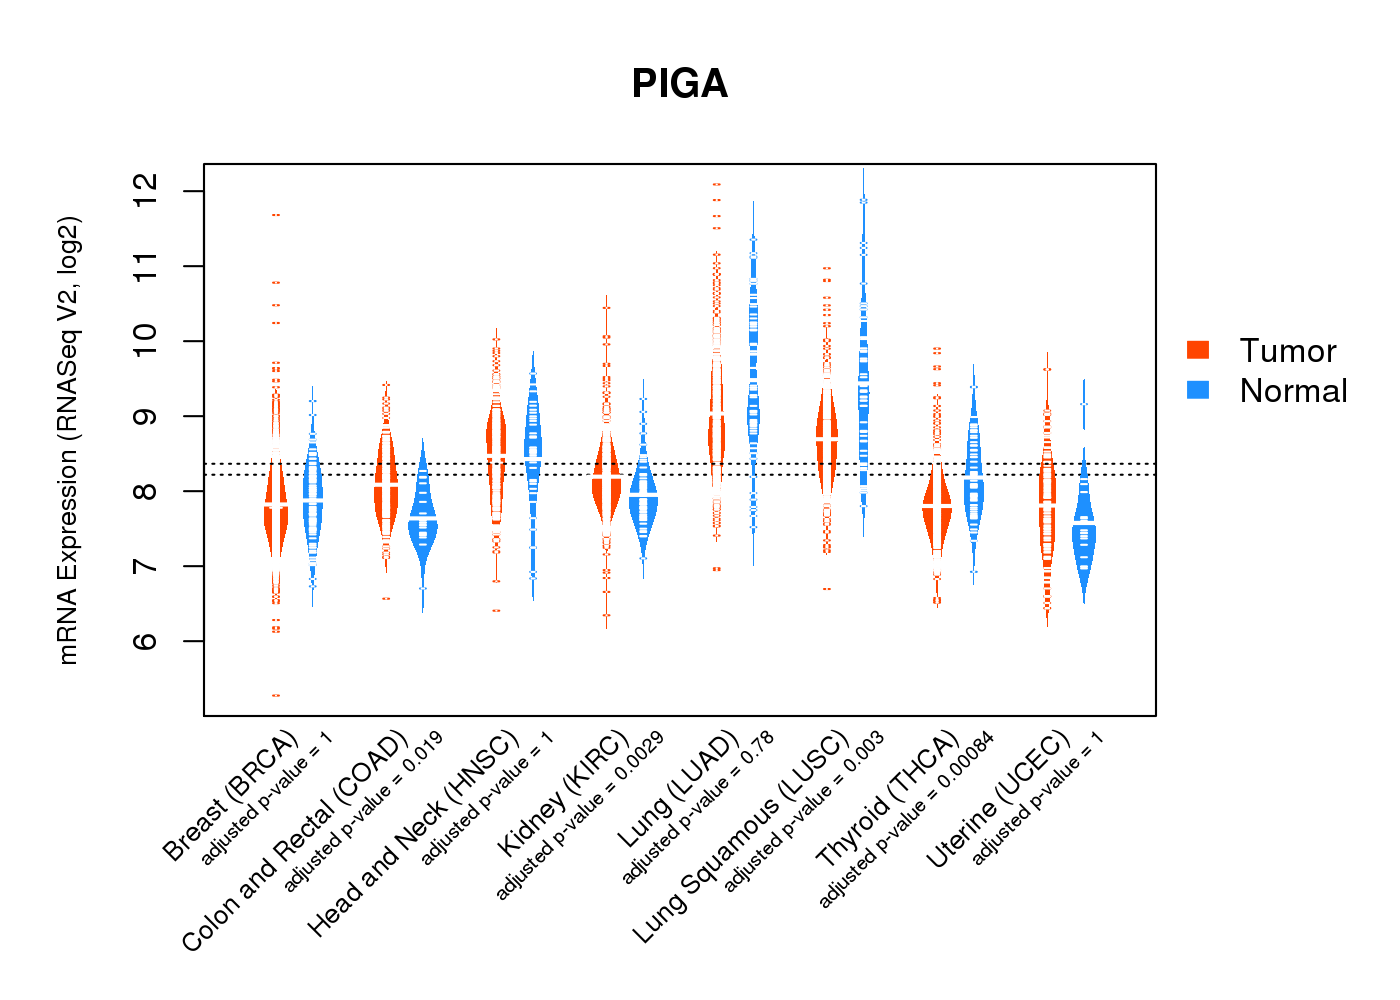 |
| Top |
| * This plots show the correlation between CNV and gene expression. |
: Open all plots for all cancer types
 |
|
 |
|
| Top |
| Gene-Gene Network Information |
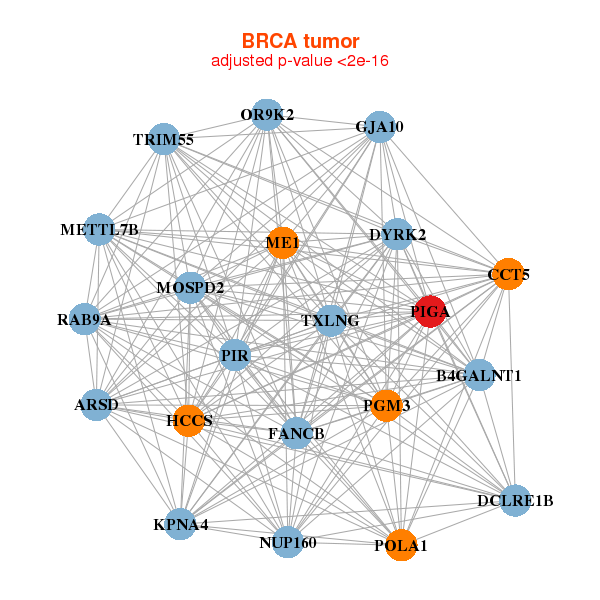
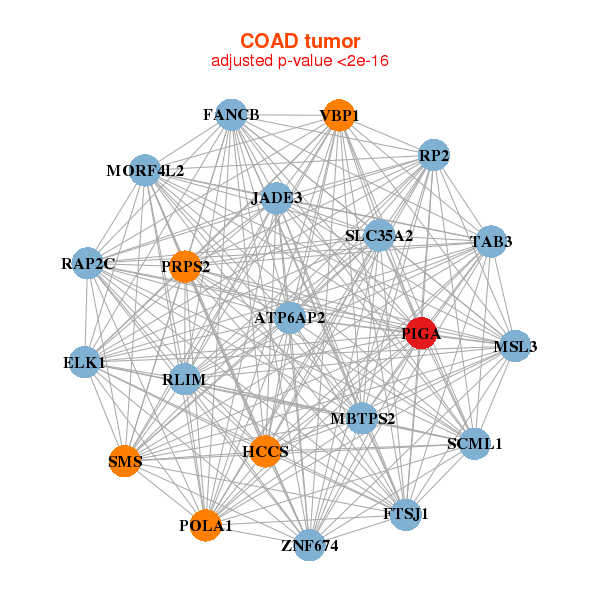
| * Co-Expression network figures were drawn using R package igraph. Only the top 20 genes with the highest correlations were shown. Red circle: input gene, orange circle: cell metabolism gene, sky circle: other gene |
: Open all plots for all cancer types
 |
| ||||
| ARSD,B4GALNT1,CCT5,DCLRE1B,DYRK2,FANCB,GJA10, HCCS,KPNA4,ME1,METTL7B,MOSPD2,NUP160,OR9K2, PGM3,PIGA,PIR,POLA1,RAB9A,TRIM55,TXLNG | ABHD13,AEBP2,B3GNT2,BIRC2,DENND6A,MARCH7,MYNN, PGGT1B,PIGA,RBM12,RBMXL1,RYBP,SRSF10,STXBP3, SYNCRIP,TMEM161B,TWISTNB,WEE1,ZNF267,ZBTB21,ZNF800 | ||||
 |
| ||||
| ATP6AP2,ELK1,FANCB,FTSJ1,HCCS,MBTPS2,MORF4L2, MSL3,JADE3,PIGA,POLA1,PRPS2,RAP2C,RLIM, RP2,SCML1,SLC35A2,SMS,TAB3,VBP1,ZNF674 | ALG6,ARPC5L,BZW1,CHUK,DHX15,FAM91A1,MAP2K4, NFE2L2,PDE12,PGGT1B,PIGA,PPP1R15B,PRPF40A,PSME3, SCYL2,SGPP1,SPTY2D1,TDG,TMEM167A,YWHAZ,ZNF207 |
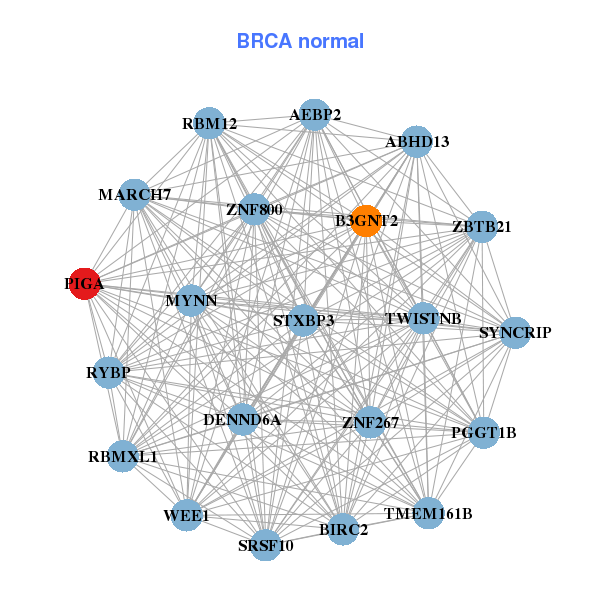
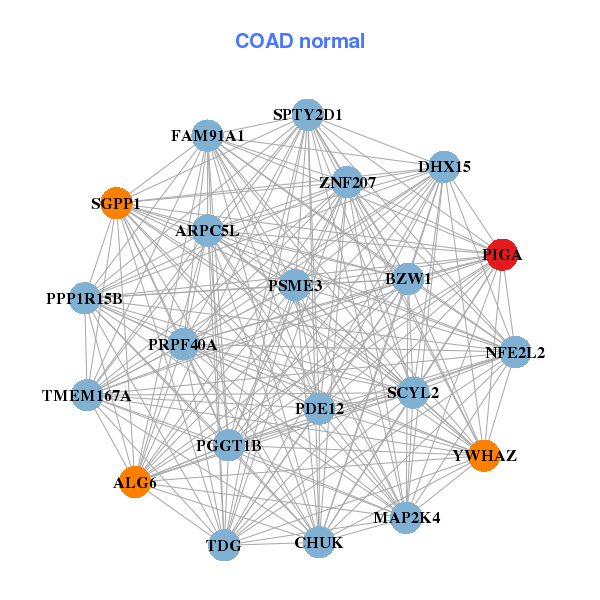
| * Co-Expression network figures were drawn using R package igraph. Only the top 20 genes with the highest correlations were shown. Red circle: input gene, orange circle: cell metabolism gene, sky circle: other gene |
: Open all plots for all cancer types
| Top |
: Open all interacting genes' information including KEGG pathway for all interacting genes from DAVID
| Top |
| Pharmacological Information for PIGA |
| DB Category | DB Name | DB's ID and Url link |
| * Gene Centered Interaction Network. |
 |
| * Drug Centered Interaction Network. |
| DrugBank ID | Target Name | Drug Groups | Generic Name | Drug Centered Network | Drug Structure |
| DB03014 | phosphatidylinositol glycan anchor biosynthesis, class A | experimental | Heme | 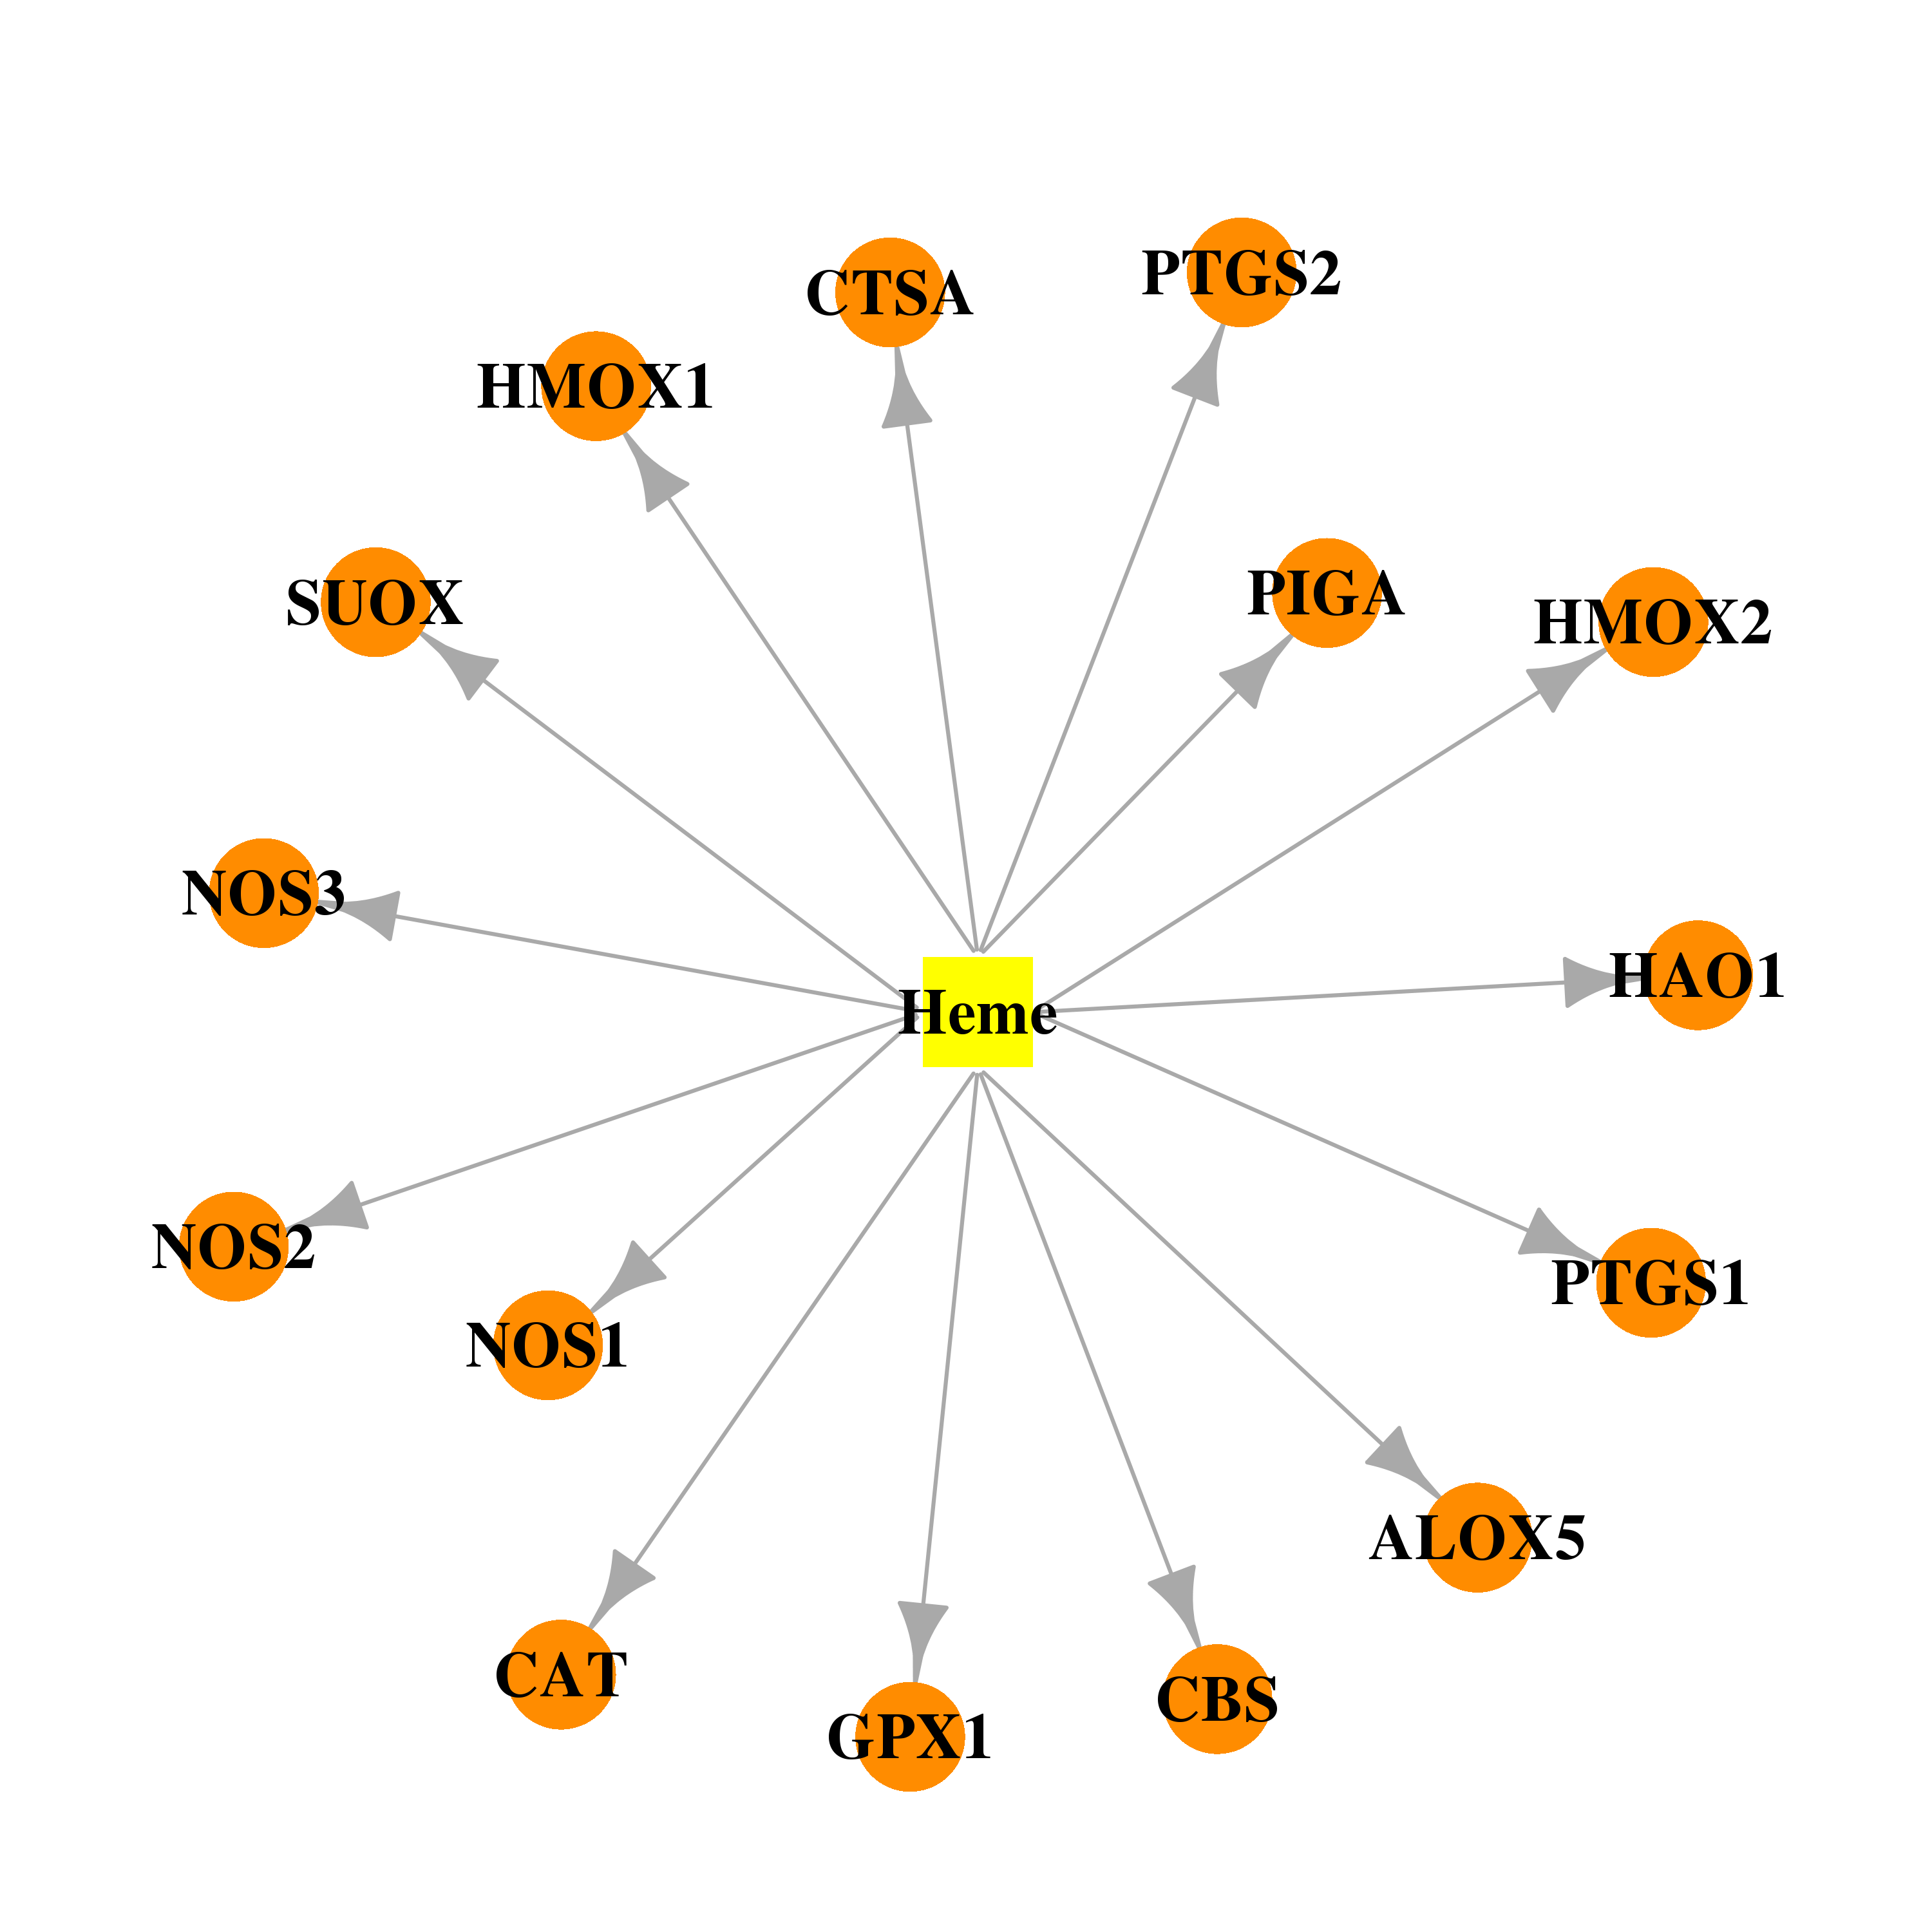 |  |
| Top |
| Cross referenced IDs for PIGA |
| * We obtained these cross-references from Uniprot database. It covers 150 different DBs, 18 categories. http://www.uniprot.org/help/cross_references_section |
: Open all cross reference information
|
Copyright © 2016-Present - The Univsersity of Texas Health Science Center at Houston @ |