|
||||||||||||||||||||||||||||||||||||||||||||||||||||||||||||||||||||||||||||||||||||||||||||||||||||||||||||||||||||||||||||||||||||||||||||||||||||||||||||||||||||||||||||||||||||||||||||||||||||||||||||||||||||||||||||||||||||||||||||||||||||||||||||||||||||||||||||||||||||||||||||||||||||||||||||||||||||||||||
| |
| Phenotypic Information (metabolism pathway, cancer, disease, phenome) |
| |
| |
| Gene-Gene Network Information: Co-Expression Network, Interacting Genes & KEGG |
| |
|


| Gene Summary for PIGC |
| Basic gene info. | Gene symbol | PIGC |
| Gene name | phosphatidylinositol glycan anchor biosynthesis, class C | |
| Synonyms | GPI2 | |
| Cytomap | UCSC genome browser: 1q23-q25 | |
| Genomic location | chr1 :172410596-172413230 | |
| Type of gene | protein-coding | |
| RefGenes | NM_002642.3, NM_153747.1, | |
| Ensembl id | ENSG00000135845 | |
| Description | PIG-Cphosphatidylinositol N-acetylglucosaminyltransferase subunit Cphosphatidylinositol-glycan biosynthesis class C proteinphosphatidylinositol-glycan biosynthesis, class C protein | |
| Modification date | 20141207 | |
| dbXrefs | MIM : 601730 | |
| HGNC : HGNC | ||
| Ensembl : ENSG00000135845 | ||
| HPRD : 03433 | ||
| Vega : OTTHUMG00000034751 | ||
| Protein | UniProt: go to UniProt's Cross Reference DB Table | |
| Expression | CleanEX: HS_PIGC | |
| BioGPS: 5279 | ||
| Gene Expression Atlas: ENSG00000135845 | ||
| The Human Protein Atlas: ENSG00000135845 | ||
| Pathway | NCI Pathway Interaction Database: PIGC | |
| KEGG: PIGC | ||
| REACTOME: PIGC | ||
| ConsensusPathDB | ||
| Pathway Commons: PIGC | ||
| Metabolism | MetaCyc: PIGC | |
| HUMANCyc: PIGC | ||
| Regulation | Ensembl's Regulation: ENSG00000135845 | |
| miRBase: chr1 :172,410,596-172,413,230 | ||
| TargetScan: NM_002642 | ||
| cisRED: ENSG00000135845 | ||
| Context | iHOP: PIGC | |
| cancer metabolism search in PubMed: PIGC | ||
| UCL Cancer Institute: PIGC | ||
| Assigned class in ccmGDB | C | |
| Top |
| Phenotypic Information for PIGC(metabolism pathway, cancer, disease, phenome) |
| Cancer | CGAP: PIGC |
| Familial Cancer Database: PIGC | |
| * This gene is included in those cancer gene databases. |
|
|
|
|
|
| . | ||||||||||||||||||||||||||||||||||||||||||||||||||||||||||||||||||||||||||||||||||||||||||||||||||||||||||||||||||||||||||||||||||||||||||||||||||||||||||||||||||||||||||||||||||||||||||||||||||||||||||||||||||||||||||||||||||||||||||||||||||||||||||||||||||||||||||||||||||||||||||||||||||||||||||||||||||||
Oncogene 1 | Significant driver gene in | |||||||||||||||||||||||||||||||||||||||||||||||||||||||||||||||||||||||||||||||||||||||||||||||||||||||||||||||||||||||||||||||||||||||||||||||||||||||||||||||||||||||||||||||||||||||||||||||||||||||||||||||||||||||||||||||||||||||||||||||||||||||||||||||||||||||||||||||||||||||||||||||||||||||||||||||||||||||||
| cf) number; DB name 1 Oncogene; http://nar.oxfordjournals.org/content/35/suppl_1/D721.long, 2 Tumor Suppressor gene; https://bioinfo.uth.edu/TSGene/, 3 Cancer Gene Census; http://www.nature.com/nrc/journal/v4/n3/abs/nrc1299.html, 4 CancerGenes; http://nar.oxfordjournals.org/content/35/suppl_1/D721.long, 5 Network of Cancer Gene; http://ncg.kcl.ac.uk/index.php, 1Therapeutic Vulnerabilities in Cancer; http://cbio.mskcc.org/cancergenomics/statius/ |
| REACTOME_METABOLISM_OF_PROTEINS | |
| OMIM | |
| Orphanet | |
| Disease | KEGG Disease: PIGC |
| MedGen: PIGC (Human Medical Genetics with Condition) | |
| ClinVar: PIGC | |
| Phenotype | MGI: PIGC (International Mouse Phenotyping Consortium) |
| PhenomicDB: PIGC | |
| Mutations for PIGC |
| * Under tables are showing count per each tissue to give us broad intuition about tissue specific mutation patterns.You can go to the detailed page for each mutation database's web site. |
| There's no structural variation information in COSMIC data for this gene. |
| * From mRNA Sanger sequences, Chitars2.0 arranged chimeric transcripts. This table shows PIGC related fusion information. |
| ID | Head Gene | Tail Gene | Accession | Gene_a | qStart_a | qEnd_a | Chromosome_a | tStart_a | tEnd_a | Gene_a | qStart_a | qEnd_a | Chromosome_a | tStart_a | tEnd_a |
| AW581578 | PIGC | 9 | 124 | 1 | 172410948 | 172411063 | MTHFD1 | 107 | 304 | 14 | 64924985 | 64926633 | |
| BI043619 | GGT7 | 27 | 285 | 20 | 33444053 | 33444310 | PIGC | 278 | 394 | 1 | 172411581 | 172411697 | |
| Top |
| Mutation type/ Tissue ID | brca | cns | cerv | endome | haematopo | kidn | Lintest | liver | lung | ns | ovary | pancre | prost | skin | stoma | thyro | urina | |||
| Total # sample | 1 | |||||||||||||||||||
| GAIN (# sample) | 1 | |||||||||||||||||||
| LOSS (# sample) |
| cf) Tissue ID; Tissue type (1; Breast, 2; Central_nervous_system, 3; Cervix, 4; Endometrium, 5; Haematopoietic_and_lymphoid_tissue, 6; Kidney, 7; Large_intestine, 8; Liver, 9; Lung, 10; NS, 11; Ovary, 12; Pancreas, 13; Prostate, 14; Skin, 15; Stomach, 16; Thyroid, 17; Urinary_tract) |
| Top |
|
 |
| Top |
| Stat. for Non-Synonymous SNVs (# total SNVs=20) | (# total SNVs=5) |
 | 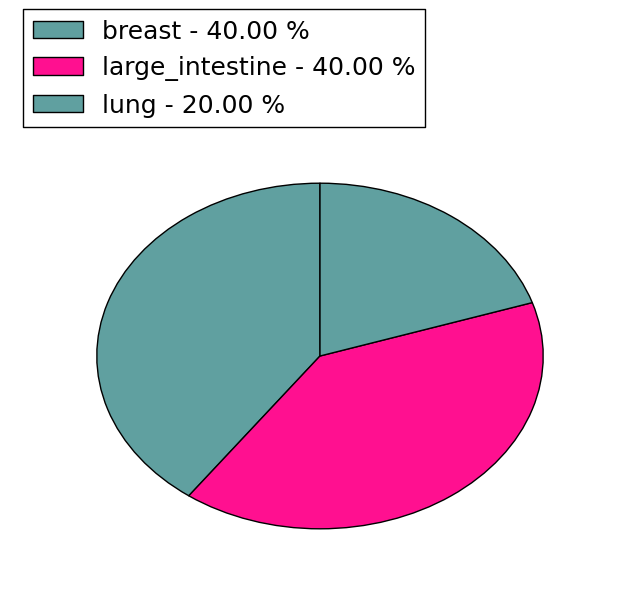 |
(# total SNVs=1) | (# total SNVs=1) |
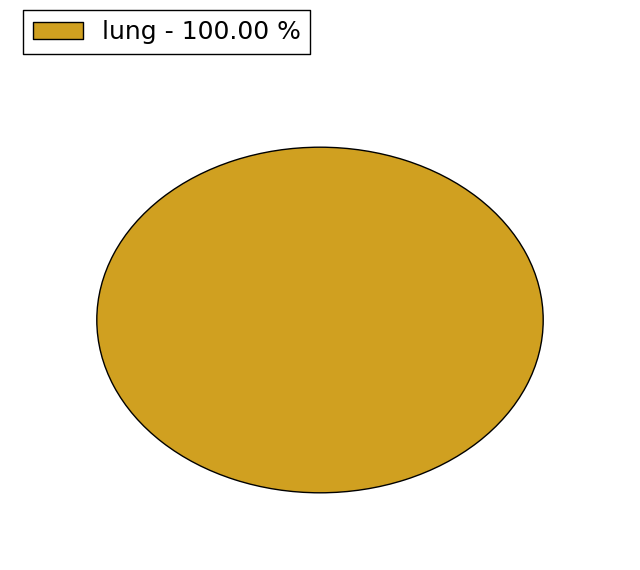 | 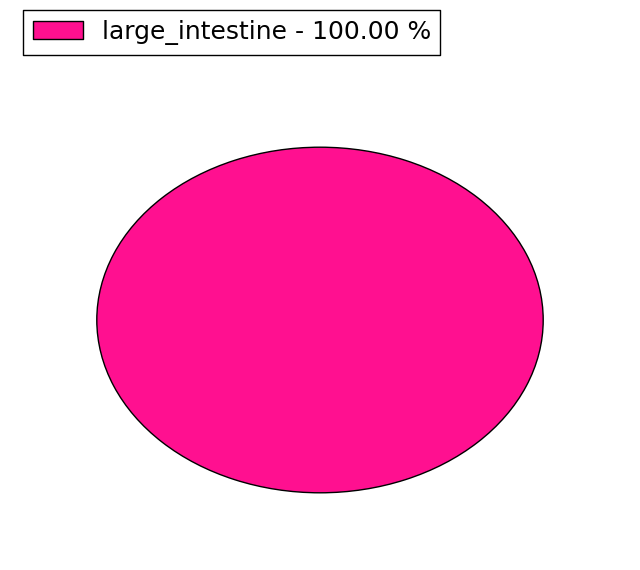 |
| Top |
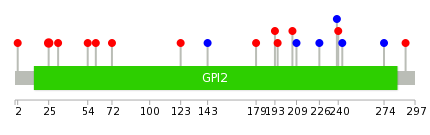
| * When you move the cursor on each content, you can see more deailed mutation information on the Tooltip. Those are primary_site,primary_histology,mutation(aa),pubmedID. |
| GRCh37 position | Mutation(aa) | Unique sampleID count |
| chr1:172410967-172410967 | p.P266S | 3 |
| chr1:172411690-172411690 | p.P25S | 3 |
| chr1:172411114-172411114 | p.Q217* | 2 |
| chr1:172410951-172410951 | p.R271H | 2 |
| chr1:172411689-172411689 | p.P25H | 2 |
| chr1:172410885-172410885 | p.S293C | 1 |
| chr1:172411046-172411046 | p.A239A | 1 |
| chr1:172411325-172411325 | p.T146T | 1 |
| chr1:172410892-172410892 | p.D291N | 1 |
| chr1:172411085-172411085 | p.R226R | 1 |
| Top |
|
 |
| Point Mutation/ Tissue ID | 1 | 2 | 3 | 4 | 5 | 6 | 7 | 8 | 9 | 10 | 11 | 12 | 13 | 14 | 15 | 16 | 17 | 18 | 19 | 20 |
| # sample | 2 | 3 | 2 | 1 | 2 | 3 | 4 | 2 | ||||||||||||
| # mutation | 2 | 2 | 2 | 1 | 2 | 3 | 4 | 2 | ||||||||||||
| nonsynonymous SNV | 1 | 1 | 1 | 1 | 1 | 3 | 2 | 2 | ||||||||||||
| synonymous SNV | 1 | 1 | 1 | 1 | 2 |
| cf) Tissue ID; Tissue type (1; BLCA[Bladder Urothelial Carcinoma], 2; BRCA[Breast invasive carcinoma], 3; CESC[Cervical squamous cell carcinoma and endocervical adenocarcinoma], 4; COAD[Colon adenocarcinoma], 5; GBM[Glioblastoma multiforme], 6; Glioma Low Grade, 7; HNSC[Head and Neck squamous cell carcinoma], 8; KICH[Kidney Chromophobe], 9; KIRC[Kidney renal clear cell carcinoma], 10; KIRP[Kidney renal papillary cell carcinoma], 11; LAML[Acute Myeloid Leukemia], 12; LUAD[Lung adenocarcinoma], 13; LUSC[Lung squamous cell carcinoma], 14; OV[Ovarian serous cystadenocarcinoma ], 15; PAAD[Pancreatic adenocarcinoma], 16; PRAD[Prostate adenocarcinoma], 17; SKCM[Skin Cutaneous Melanoma], 18:STAD[Stomach adenocarcinoma], 19:THCA[Thyroid carcinoma], 20:UCEC[Uterine Corpus Endometrial Carcinoma]) |
| Top |
| * We represented just top 10 SNVs. When you move the cursor on each content, you can see more deailed mutation information on the Tooltip. Those are primary_site, primary_histology, mutation(aa), pubmedID. |
| Genomic Position | Mutation(aa) | Unique sampleID count |
| chr1:172411689 | p.P25H,PIGC | 2 |
| chr1:172410895 | p.E290K,PIGC | 1 |
| chr1:172411334 | p.R32Q,PIGC | 1 |
| chr1:172410941 | p.L274L,PIGC | 1 |
| chr1:172411395 | p.L243L,PIGC | 1 |
| chr1:172411036 | p.Y2H,PIGC | 1 |
| chr1:172411549 | p.V240L,PIGC | 1 |
| chr1:172411045 | p.A239A,PIGC | 1 |
| chr1:172411585 | p.R226R,PIGC | 1 |
| chr1:172411046 | p.I209I,PIGC | 1 |
| * Copy number data were extracted from TCGA using R package TCGA-Assembler. The URLs of all public data files on TCGA DCC data server were gathered on Jan-05-2015. Function ProcessCNAData in TCGA-Assembler package was used to obtain gene-level copy number value which is calculated as the average copy number of the genomic region of a gene. |
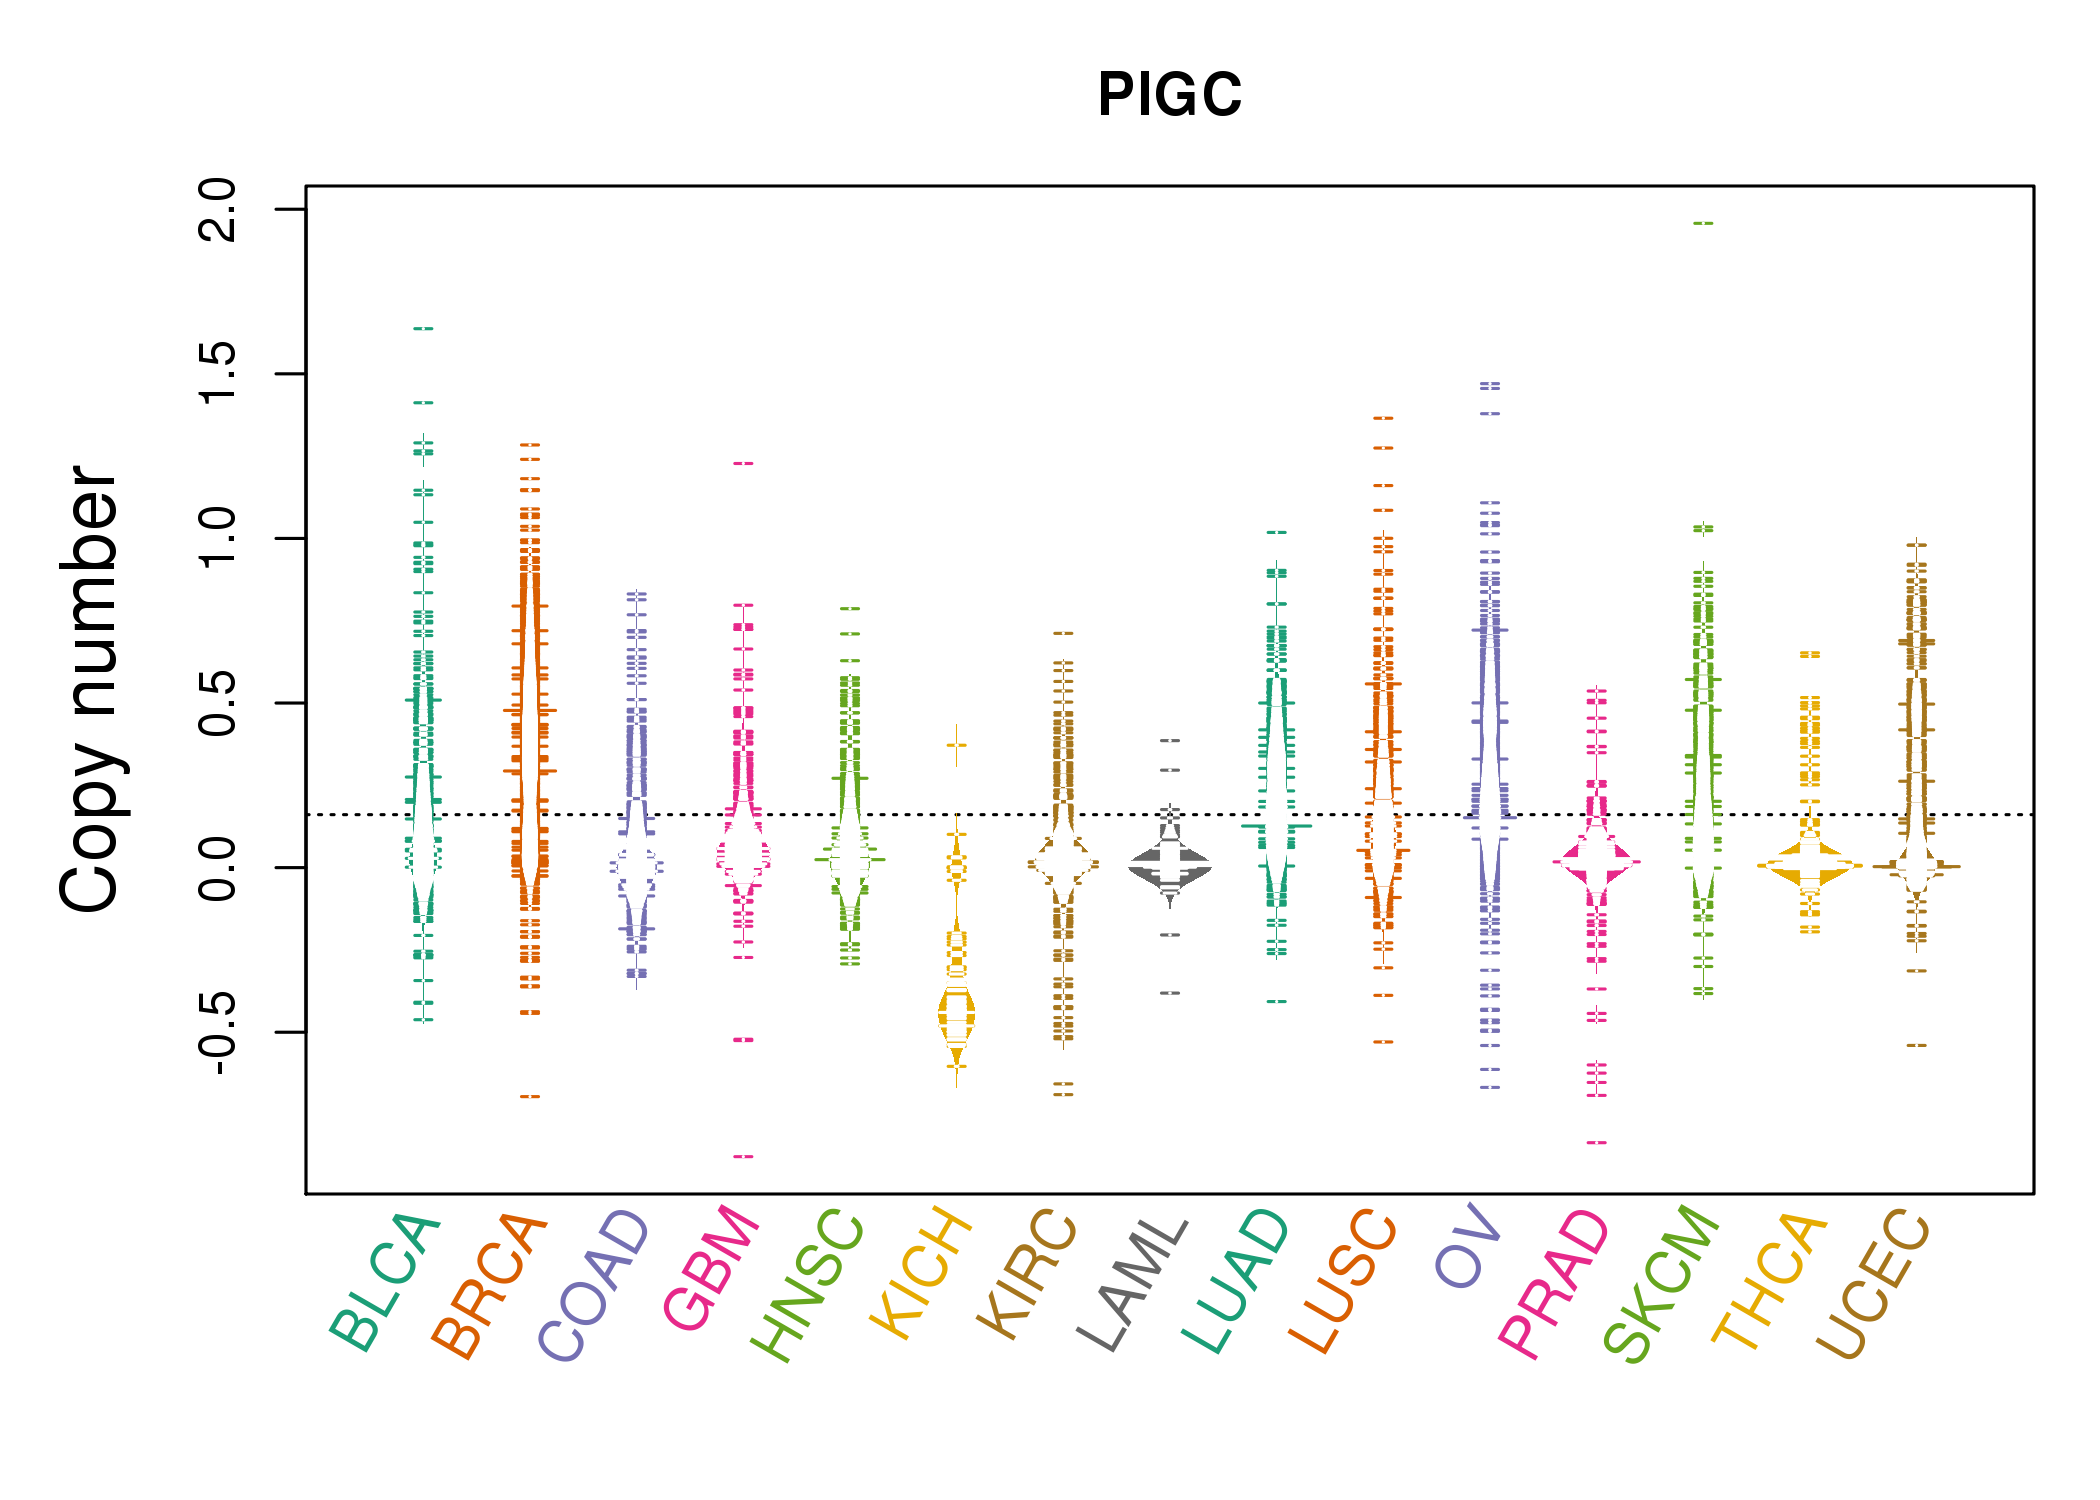 |
| cf) Tissue ID[Tissue type]: BLCA[Bladder Urothelial Carcinoma], BRCA[Breast invasive carcinoma], CESC[Cervical squamous cell carcinoma and endocervical adenocarcinoma], COAD[Colon adenocarcinoma], GBM[Glioblastoma multiforme], Glioma Low Grade, HNSC[Head and Neck squamous cell carcinoma], KICH[Kidney Chromophobe], KIRC[Kidney renal clear cell carcinoma], KIRP[Kidney renal papillary cell carcinoma], LAML[Acute Myeloid Leukemia], LUAD[Lung adenocarcinoma], LUSC[Lung squamous cell carcinoma], OV[Ovarian serous cystadenocarcinoma ], PAAD[Pancreatic adenocarcinoma], PRAD[Prostate adenocarcinoma], SKCM[Skin Cutaneous Melanoma], STAD[Stomach adenocarcinoma], THCA[Thyroid carcinoma], UCEC[Uterine Corpus Endometrial Carcinoma] |
| Top |
| Gene Expression for PIGC |
| * CCLE gene expression data were extracted from CCLE_Expression_Entrez_2012-10-18.res: Gene-centric RMA-normalized mRNA expression data. |
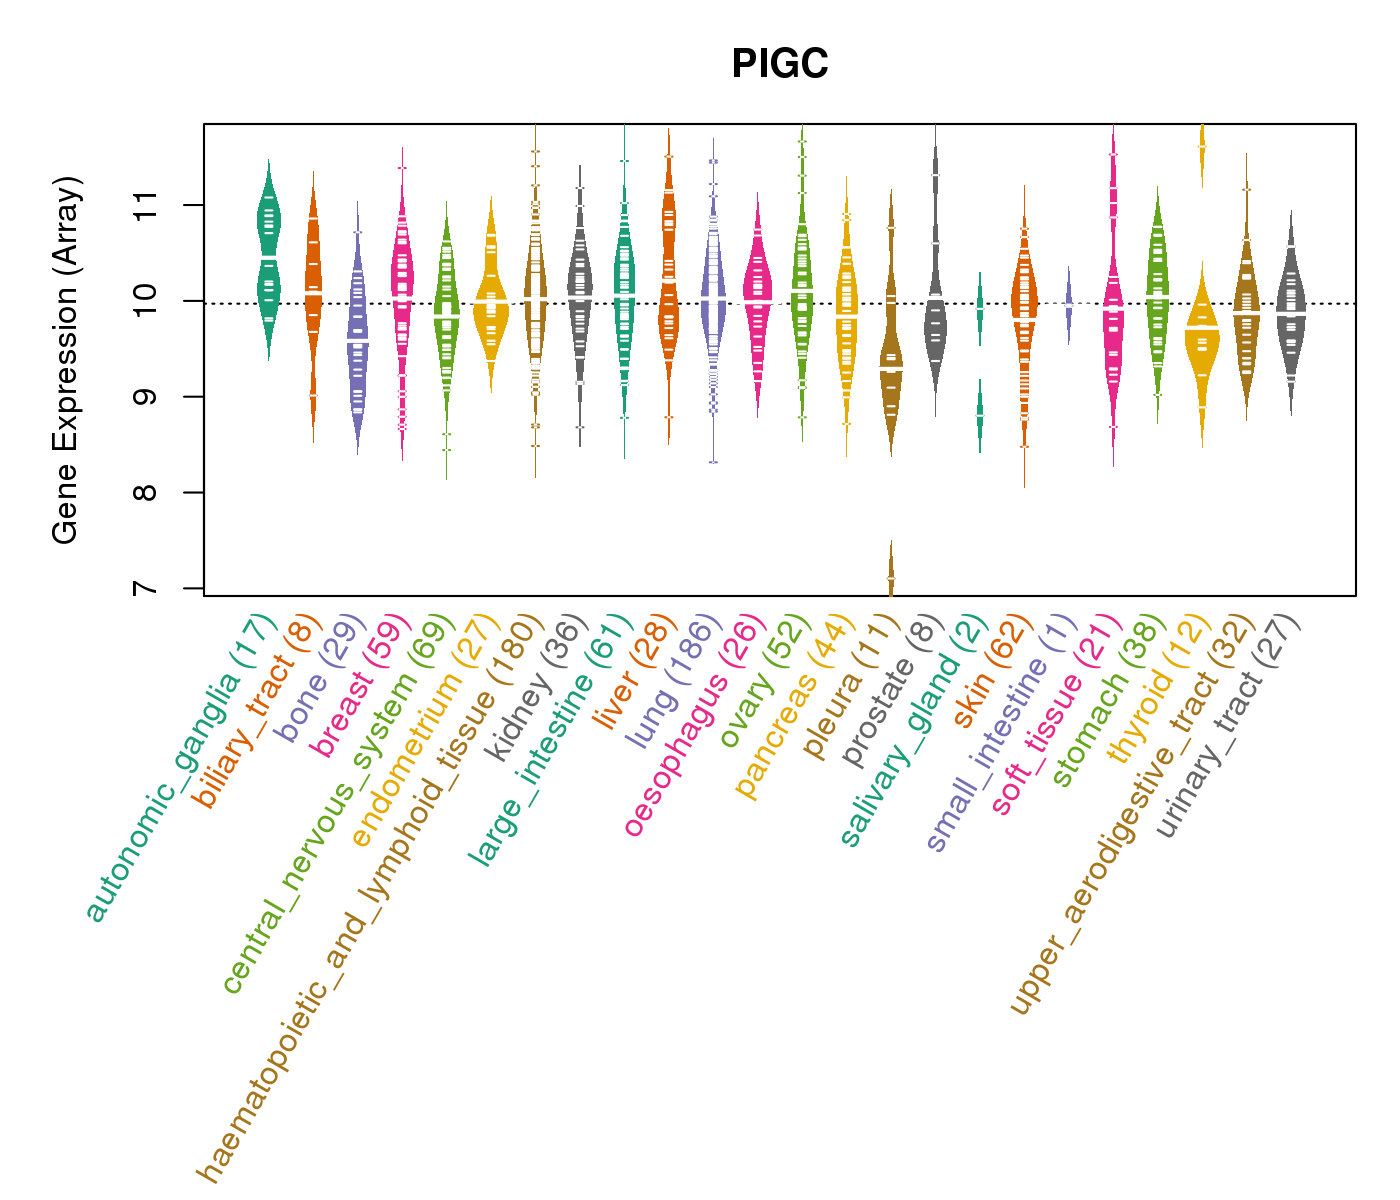 |
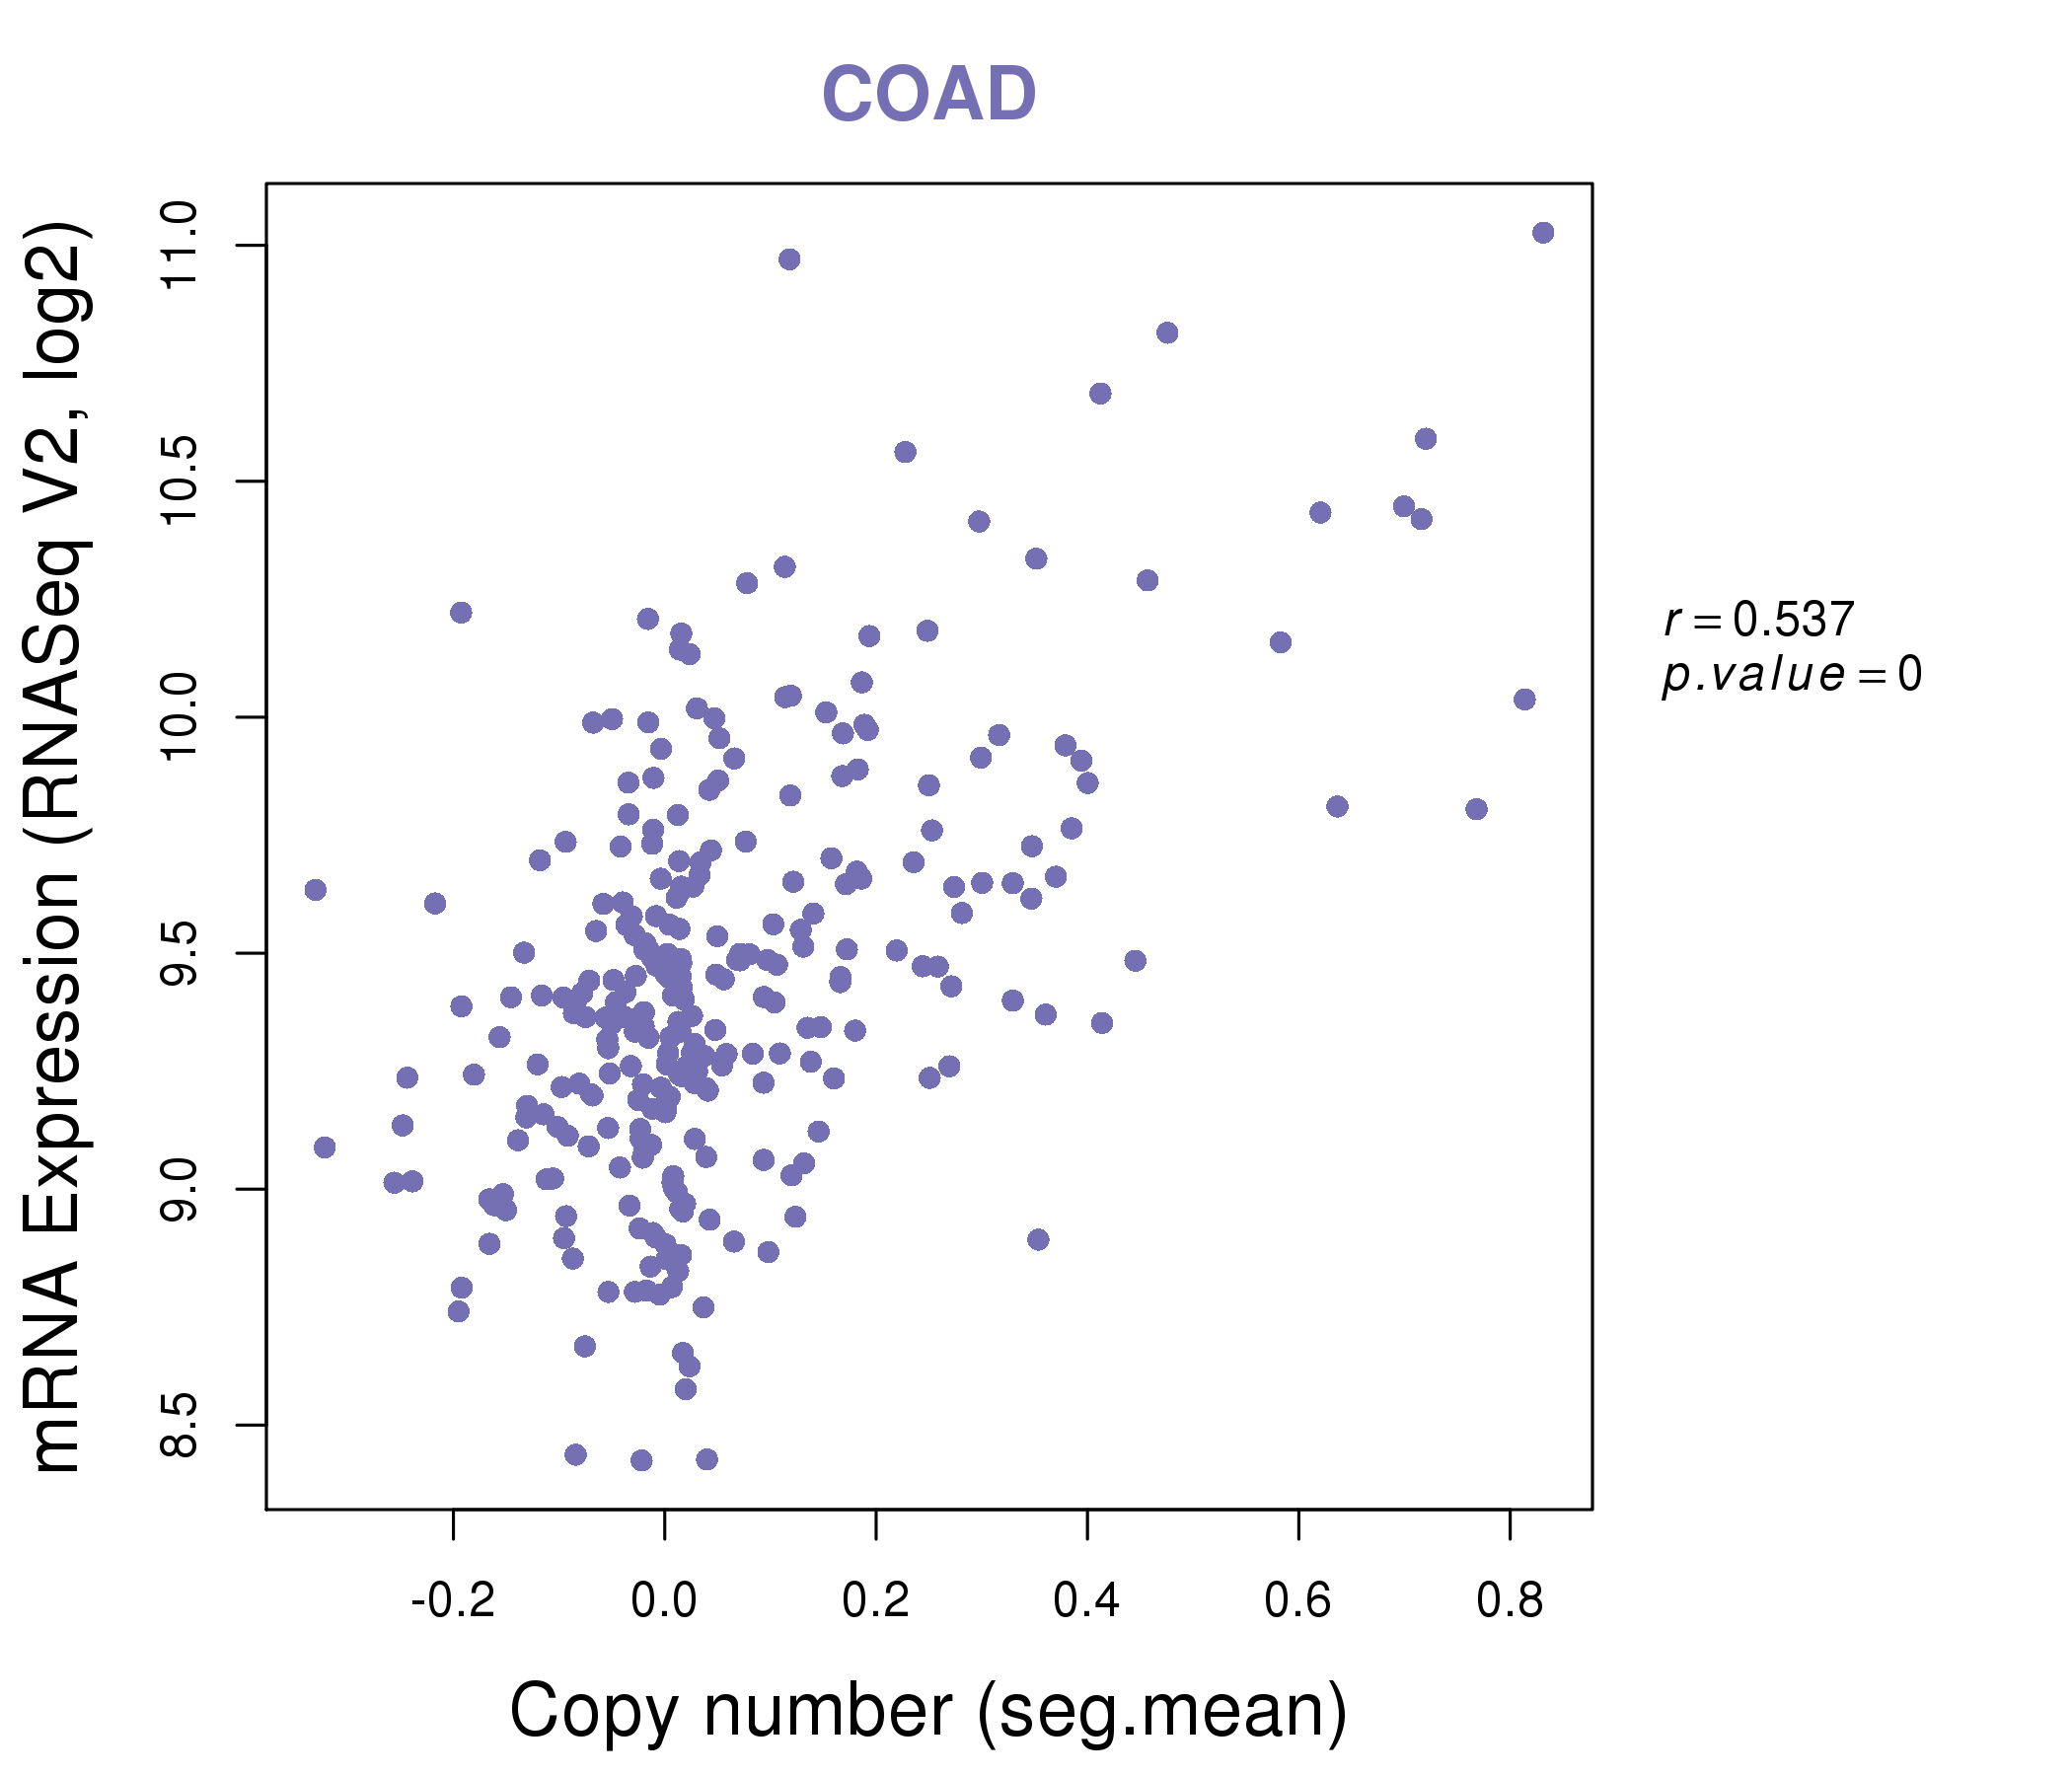
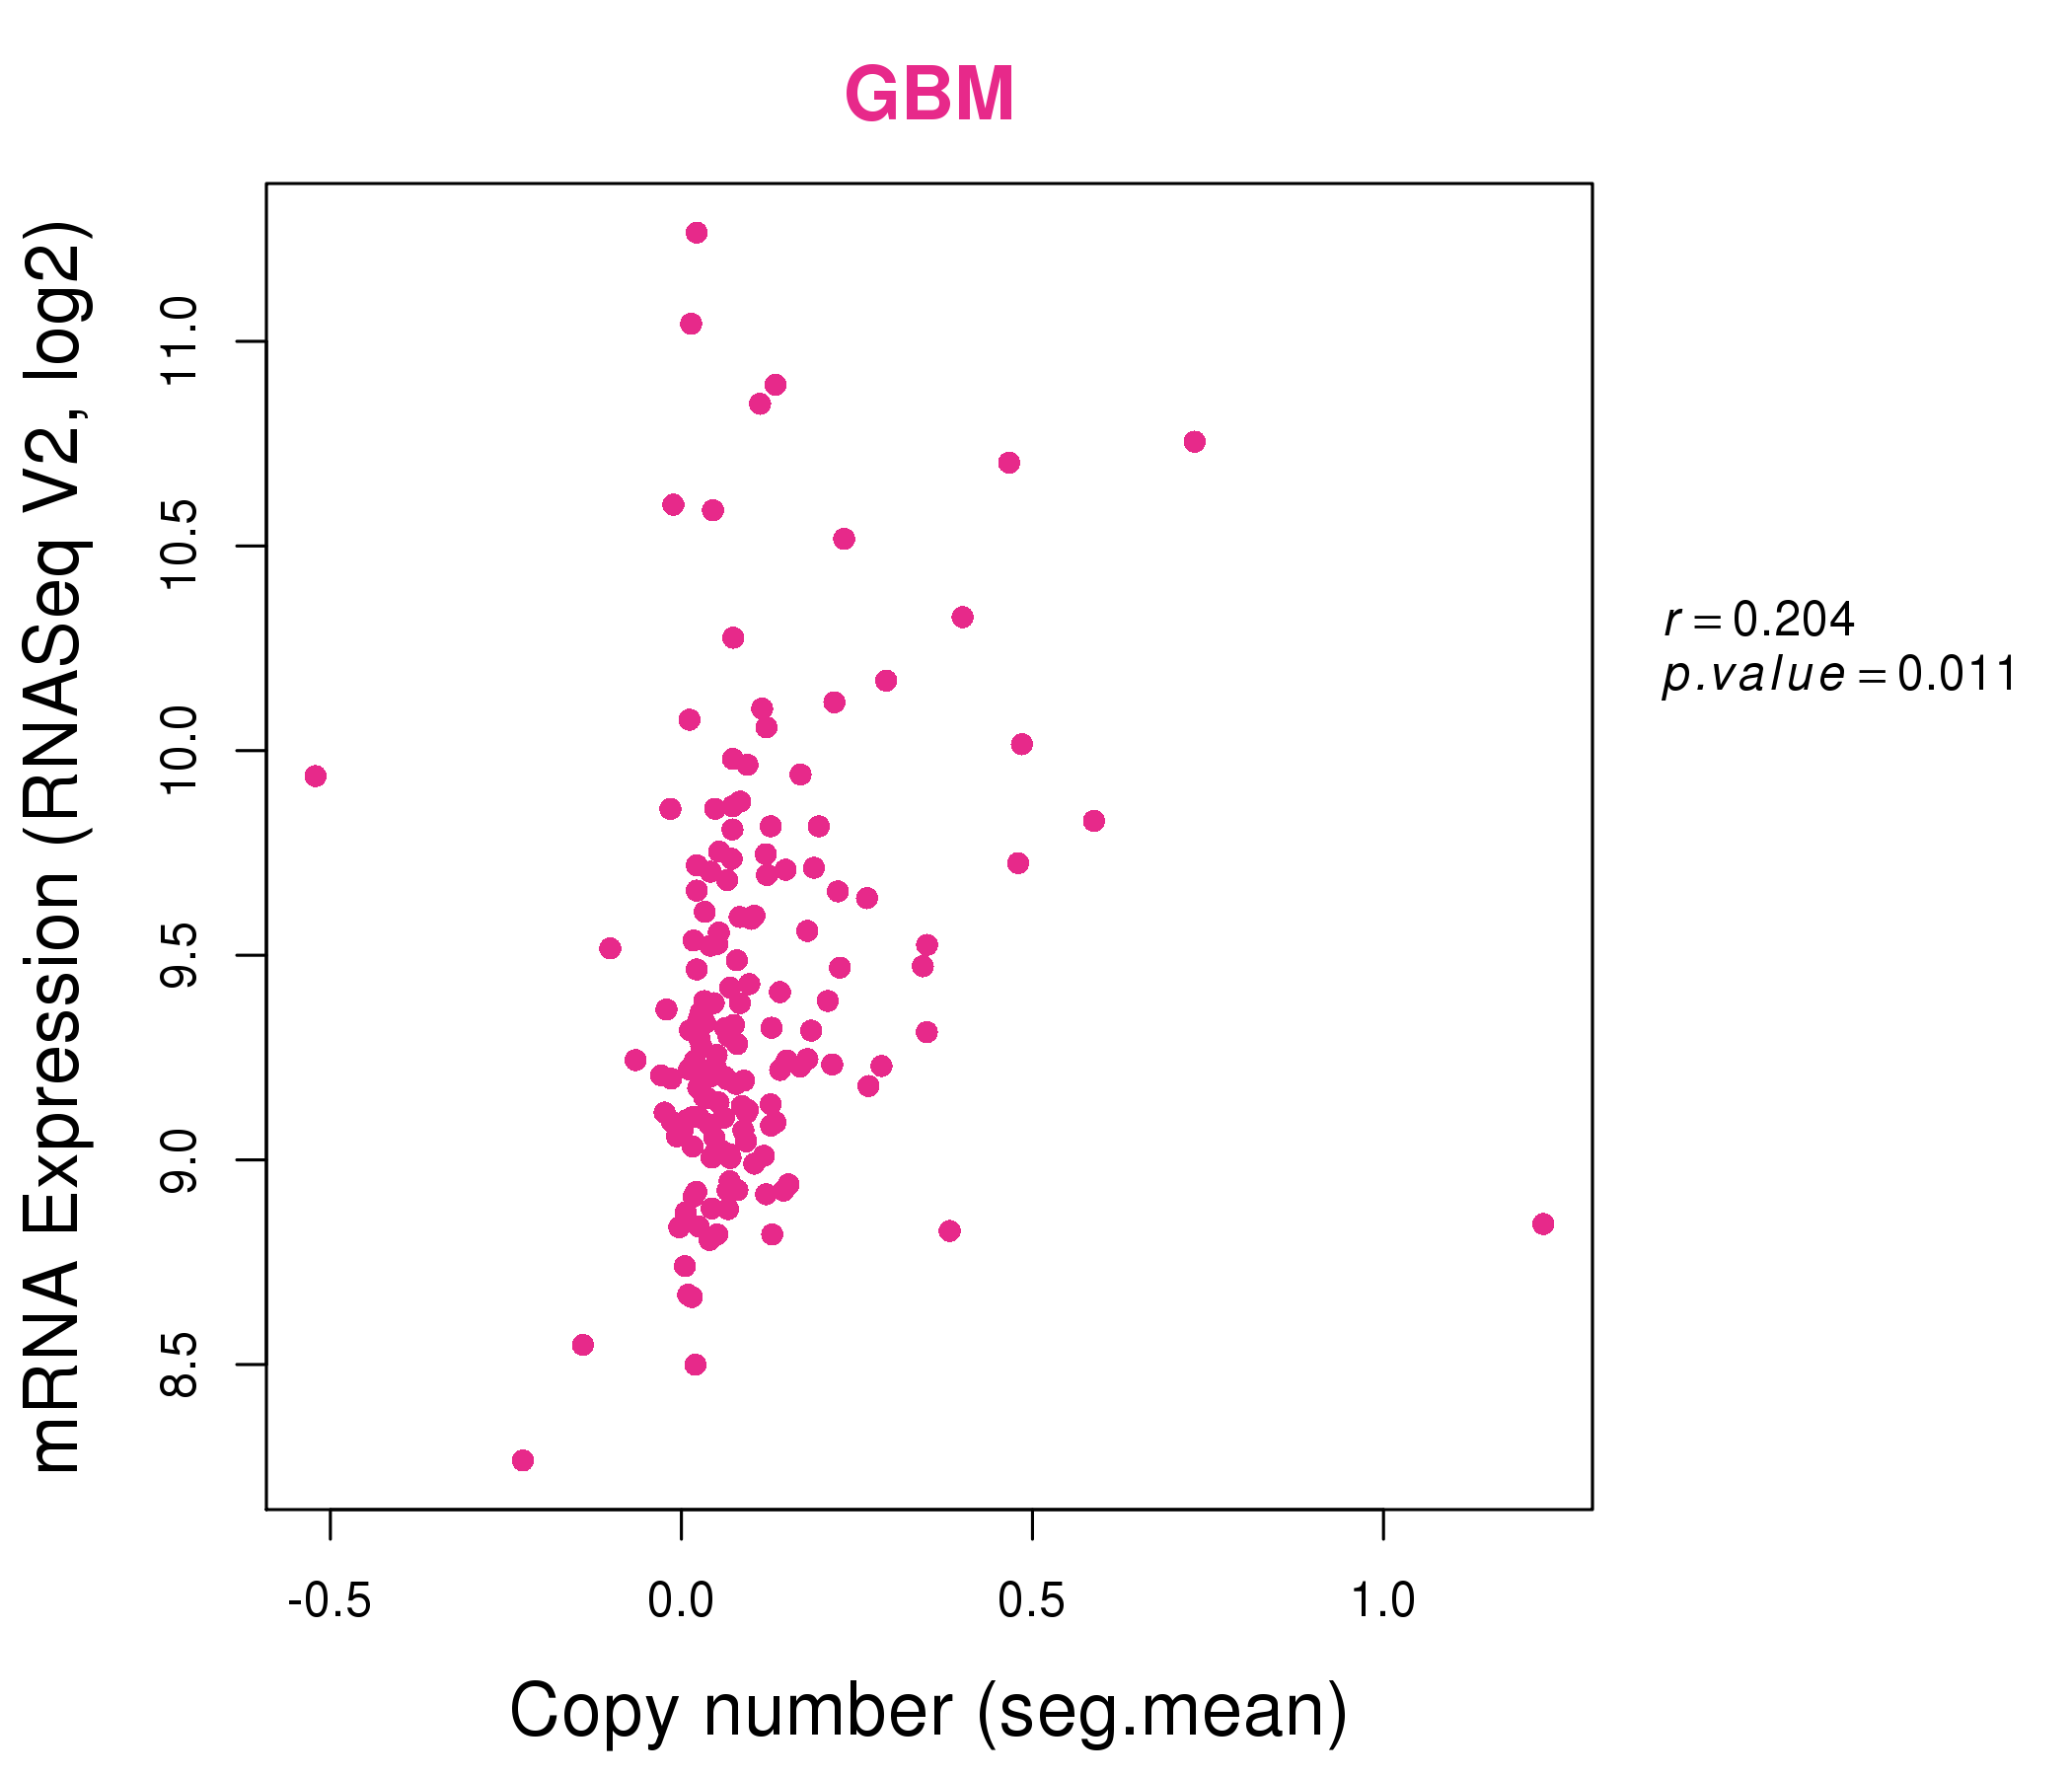
| * Normalized gene expression data of RNASeqV2 was extracted from TCGA using R package TCGA-Assembler. The URLs of all public data files on TCGA DCC data server were gathered at Jan-05-2015. Only eight cancer types have enough normal control samples for differential expression analysis. (t test, adjusted p<0.05 (using Benjamini-Hochberg FDR)) |
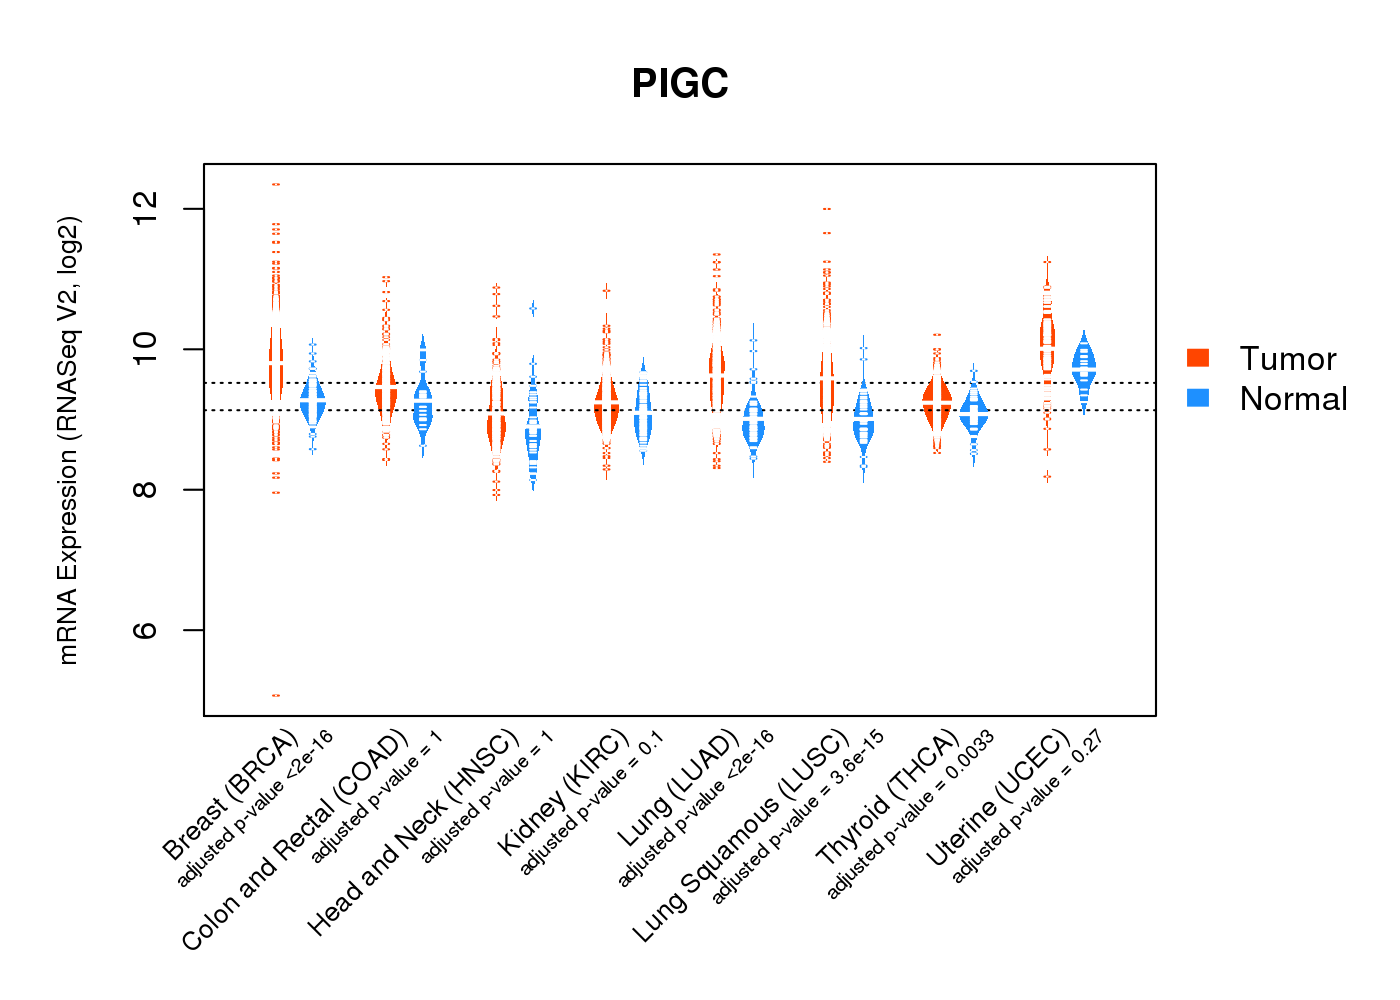 |
| Top |
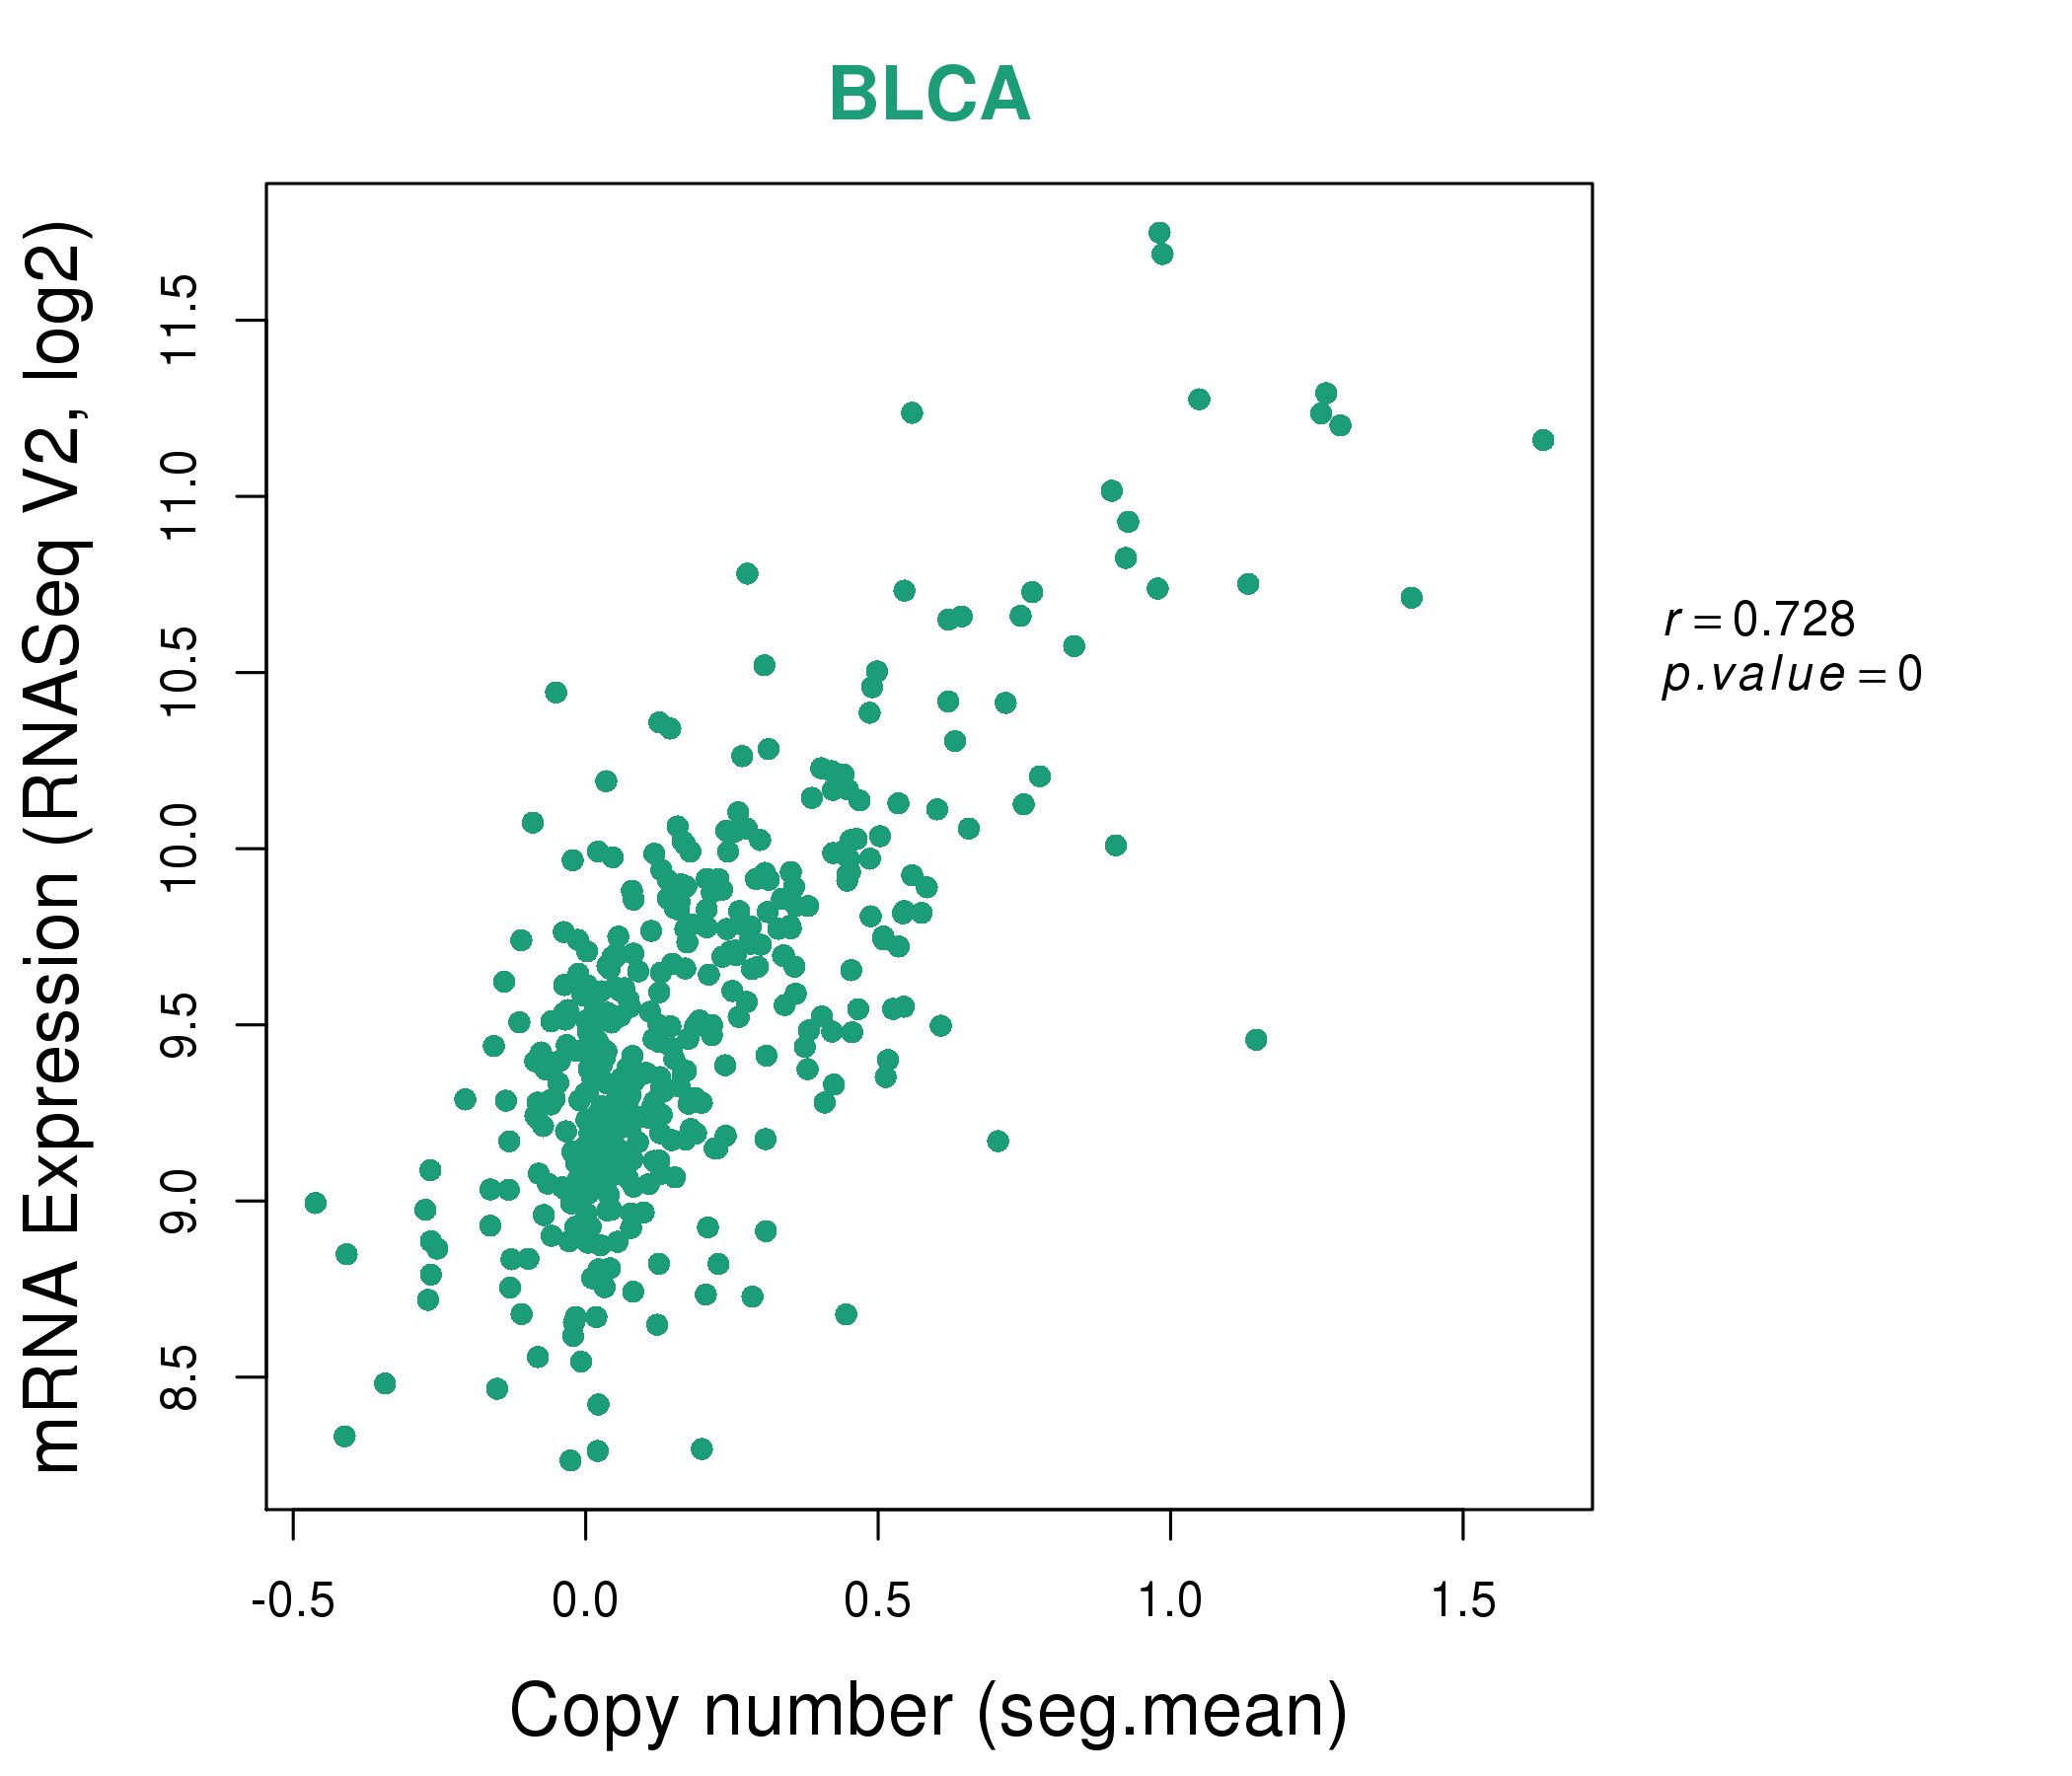
| * This plots show the correlation between CNV and gene expression. |
: Open all plots for all cancer types
 |
|
 |
|

| Top |
| Gene-Gene Network Information |
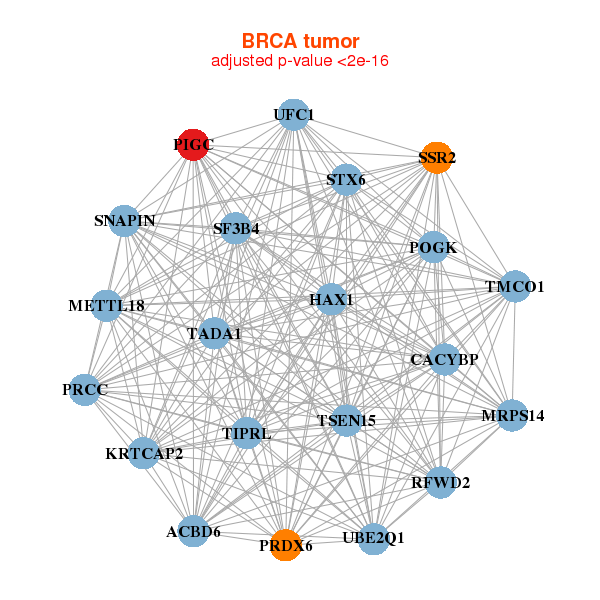
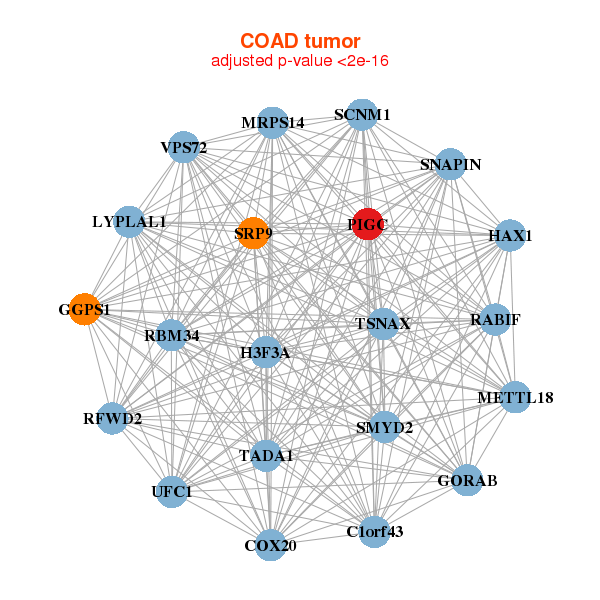
| * Co-Expression network figures were drawn using R package igraph. Only the top 20 genes with the highest correlations were shown. Red circle: input gene, orange circle: cell metabolism gene, sky circle: other gene |
: Open all plots for all cancer types
 |
|
| ACBD6,METTL18,CACYBP,HAX1,KRTCAP2,MRPS14,PIGC, POGK,PRCC,PRDX6,RFWD2,SF3B4,SNAPIN,SSR2, STX6,TADA1,TIPRL,TMCO1,TSEN15,UBE2Q1,UFC1 | BTF3,METTL23,YAE1D1,CFAP36,COPZ1,DGUOK,EIF3M, HMGN2,CERS5,PIGC,RBM22,RPL15,RPL22,RPL34, RPL35A,RPS27A,RPS3A,RPS4X,SF3B14,SLC35D2,SSR2 |
 |
|
| METTL18,C1orf43,COX20,GGPS1,GORAB,H3F3A,HAX1, LYPLAL1,MRPS14,PIGC,RABIF,RBM34,RFWD2,SCNM1, SMYD2,SNAPIN,SRP9,TADA1,TSNAX,UFC1,VPS72 | KANSL2,COA5,TIMMDC1,CGRRF1,CRIPT,DNAJC19,DPY30, FIS1,GABARAPL2,GOLGA7,MRPL43,NSMCE2,OST4,PEX2, PFDN5,PIGC,RPL41,SCNM1,SUPT4H1,TM2D1,TMEM14C |
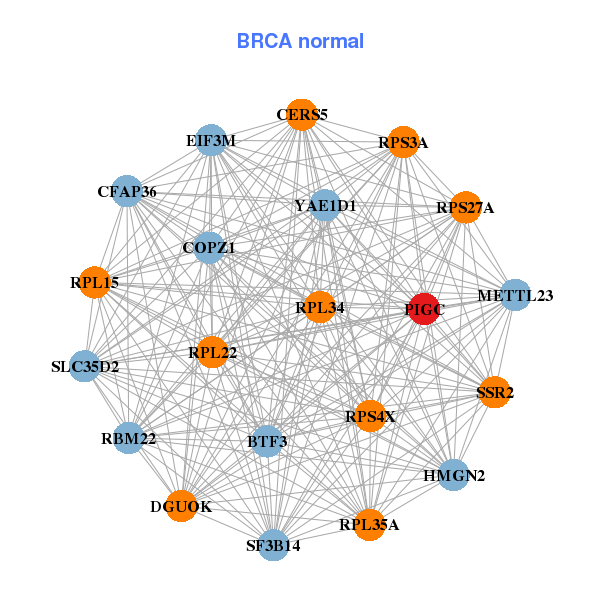
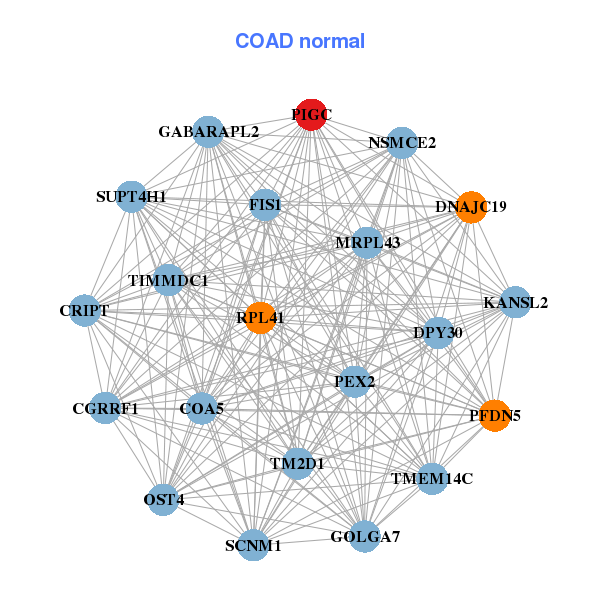
| * Co-Expression network figures were drawn using R package igraph. Only the top 20 genes with the highest correlations were shown. Red circle: input gene, orange circle: cell metabolism gene, sky circle: other gene |
: Open all plots for all cancer types
| Top |
: Open all interacting genes' information including KEGG pathway for all interacting genes from DAVID
| Top |
| Pharmacological Information for PIGC |
| There's no related Drug. |
| Top |
| Cross referenced IDs for PIGC |
| * We obtained these cross-references from Uniprot database. It covers 150 different DBs, 18 categories. http://www.uniprot.org/help/cross_references_section |
: Open all cross reference information
|
Copyright © 2016-Present - The Univsersity of Texas Health Science Center at Houston @ |