|
||||||||||||||||||||||||||||||||||||||||||||||||||||||||||||||||||||||||||||||||||||||||||||||||||||||||||||||||||||||||||||||||||||||||||||||||||||||||||||||||||||||||||||||||||||||||||||||||||||||||||||||||||||||||||||||||||||||||||||||||||||||||||||||||||||||||||||||||||||||||||||||||||||||||||||||||||||||||||
| |
| Phenotypic Information (metabolism pathway, cancer, disease, phenome) |
| |
| |
| Gene-Gene Network Information: Co-Expression Network, Interacting Genes & KEGG |
| |
|


| Gene Summary for PIK3C2G |
| Basic gene info. | Gene symbol | PIK3C2G |
| Gene name | phosphatidylinositol-4-phosphate 3-kinase, catalytic subunit type 2 gamma | |
| Synonyms | PI3K-C2-gamma|PI3K-C2GAMMA | |
| Cytomap | UCSC genome browser: 12p12 | |
| Genomic location | chr12 :18414473-18801352 | |
| Type of gene | protein-coding | |
| RefGenes | NM_001288772.1, NM_001288774.1,NM_004570.5, | |
| Ensembl id | ENSG00000139144 | |
| Description | PTDINS-3-kinase C2 gammaphosphatidylinositol 4-phosphate 3-kinase C2 domain-containing subunit gammaphosphatidylinositol-4-phosphate 3-kinase C2 domain-containing gamma polypeptidephosphatidylinositol-4-phosphate 3-kinase C2 domain-containing subunit g | |
| Modification date | 20141207 | |
| dbXrefs | MIM : 609001 | |
| HGNC : HGNC | ||
| Ensembl : ENSG00000139144 | ||
| HPRD : 16416 | ||
| Vega : OTTHUMG00000168841 | ||
| Protein | UniProt: O75747 go to UniProt's Cross Reference DB Table | |
| Expression | CleanEX: HS_PIK3C2G | |
| BioGPS: 5288 | ||
| Gene Expression Atlas: ENSG00000139144 | ||
| The Human Protein Atlas: ENSG00000139144 | ||
| Pathway | NCI Pathway Interaction Database: PIK3C2G | |
| KEGG: PIK3C2G | ||
| REACTOME: PIK3C2G | ||
| ConsensusPathDB | ||
| Pathway Commons: PIK3C2G | ||
| Metabolism | MetaCyc: PIK3C2G | |
| HUMANCyc: PIK3C2G | ||
| Regulation | Ensembl's Regulation: ENSG00000139144 | |
| miRBase: chr12 :18,414,473-18,801,352 | ||
| TargetScan: NM_001288772 | ||
| cisRED: ENSG00000139144 | ||
| Context | iHOP: PIK3C2G | |
| cancer metabolism search in PubMed: PIK3C2G | ||
| UCL Cancer Institute: PIK3C2G | ||
| Assigned class in ccmGDB | B - This gene belongs to cancer gene. | |
| Top |
| Phenotypic Information for PIK3C2G(metabolism pathway, cancer, disease, phenome) |
| Cancer | CGAP: PIK3C2G |
| Familial Cancer Database: PIK3C2G | |
| * This gene is included in those cancer gene databases. |
|
|
|
|
|
|
| ||||||||||||||||||||||||||||||||||||||||||||||||||||||||||||||||||||||||||||||||||||||||||||||||||||||||||||||||||||||||||||||||||||||||||||||||||||||||||||||||||||||||||||||||||||||||||||||||||||||||||||||||||||||||||||||||||||||||||||||||||||||||||||||||||||||||||||||||||||||||||||||||||||||||||||||||||||
Oncogene 1 | Significant driver gene in | |||||||||||||||||||||||||||||||||||||||||||||||||||||||||||||||||||||||||||||||||||||||||||||||||||||||||||||||||||||||||||||||||||||||||||||||||||||||||||||||||||||||||||||||||||||||||||||||||||||||||||||||||||||||||||||||||||||||||||||||||||||||||||||||||||||||||||||||||||||||||||||||||||||||||||||||||||||||||
| cf) number; DB name 1 Oncogene; http://nar.oxfordjournals.org/content/35/suppl_1/D721.long, 2 Tumor Suppressor gene; https://bioinfo.uth.edu/TSGene/, 3 Cancer Gene Census; http://www.nature.com/nrc/journal/v4/n3/abs/nrc1299.html, 4 CancerGenes; http://nar.oxfordjournals.org/content/35/suppl_1/D721.long, 5 Network of Cancer Gene; http://ncg.kcl.ac.uk/index.php, 1Therapeutic Vulnerabilities in Cancer; http://cbio.mskcc.org/cancergenomics/statius/ |
| KEGG_INOSITOL_PHOSPHATE_METABOLISM REACTOME_PHOSPHOLIPID_METABOLISM REACTOME_PI_METABOLISM REACTOME_METABOLISM_OF_LIPIDS_AND_LIPOPROTEINS | |
| OMIM | 609001; gene. |
| Orphanet | |
| Disease | KEGG Disease: PIK3C2G |
| MedGen: PIK3C2G (Human Medical Genetics with Condition) | |
| ClinVar: PIK3C2G | |
| Phenotype | MGI: PIK3C2G (International Mouse Phenotyping Consortium) |
| PhenomicDB: PIK3C2G | |
| Mutations for PIK3C2G |
| * Under tables are showing count per each tissue to give us broad intuition about tissue specific mutation patterns.You can go to the detailed page for each mutation database's web site. |
| - Statistics for Tissue and Mutation type | Top |
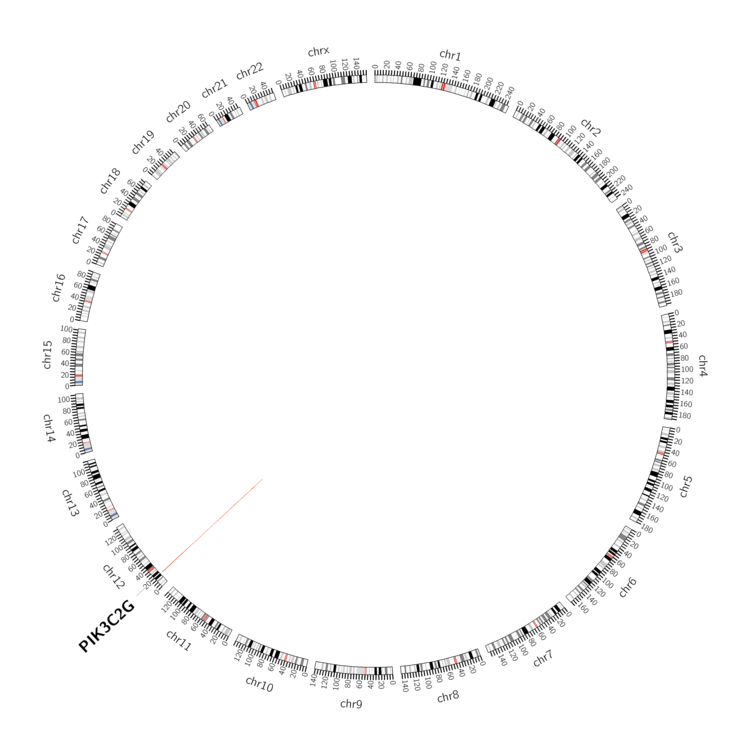 |
| - For Inter-chromosomal Variations |
| There's no inter-chromosomal structural variation. |
| - For Intra-chromosomal Variations |
| * Intra-chromosomal variantions includes 'intrachromosomal amplicon to amplicon', 'intrachromosomal amplicon to non-amplified dna', 'intrachromosomal deletion', 'intrachromosomal fold-back inversion', 'intrachromosomal inversion', 'intrachromosomal tandem duplication', 'Intrachromosomal unknown type', 'intrachromosomal with inverted orientation', 'intrachromosomal with non-inverted orientation'. |
 |
| Sample | Symbol_a | Chr_a | Start_a | End_a | Symbol_b | Chr_b | Start_b | End_b |
| liver | PIK3C2G | chr12 | 18441632 | 18441632 | chr12 | 18833543 | 18833543 | |
| ovary | PIK3C2G | chr12 | 18612165 | 18612185 | PIK3C2G | chr12 | 18602401 | 18602421 |
| ovary | PIK3C2G | chr12 | 18783619 | 18783639 | PIK3C2G | chr12 | 18783874 | 18783894 |
| pancreas | PIK3C2G | chr12 | 18438115 | 18438135 | PIK3C2G | chr12 | 18438208 | 18438228 |
| pancreas | PIK3C2G | chr12 | 18456192 | 18456212 | PIK3C2G | chr12 | 18423447 | 18423467 |
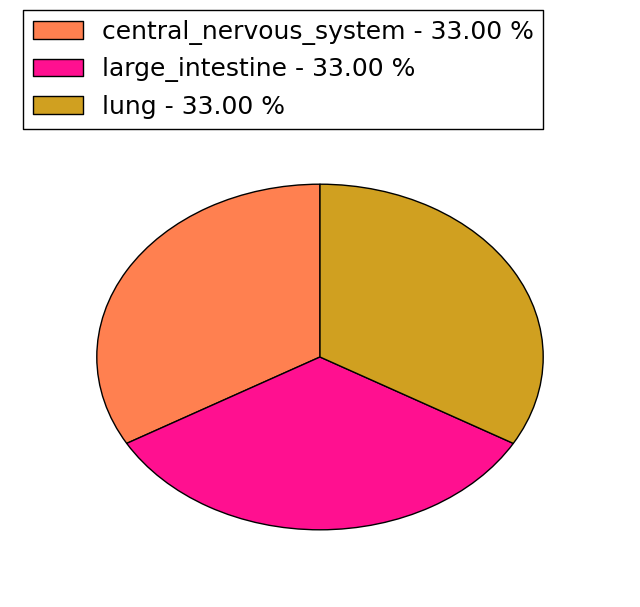
| cf) Tissue number; Tissue name (1;Breast, 2;Central_nervous_system, 3;Haematopoietic_and_lymphoid_tissue, 4;Large_intestine, 5;Liver, 6;Lung, 7;Ovary, 8;Pancreas, 9;Prostate, 10;Skin, 11;Soft_tissue, 12;Upper_aerodigestive_tract) |
| * From mRNA Sanger sequences, Chitars2.0 arranged chimeric transcripts. This table shows PIK3C2G related fusion information. |
| ID | Head Gene | Tail Gene | Accession | Gene_a | qStart_a | qEnd_a | Chromosome_a | tStart_a | tEnd_a | Gene_a | qStart_a | qEnd_a | Chromosome_a | tStart_a | tEnd_a |
| Top |
| Mutation type/ Tissue ID | brca | cns | cerv | endome | haematopo | kidn | Lintest | liver | lung | ns | ovary | pancre | prost | skin | stoma | thyro | urina | |||
| Total # sample | 6 | 2 | 3 | 1 | 2 | 1 | 4 | 1 | ||||||||||||
| GAIN (# sample) | 6 | 2 | 2 | 1 | 2 | 1 | 4 | 1 | ||||||||||||
| LOSS (# sample) | 1 |
| cf) Tissue ID; Tissue type (1; Breast, 2; Central_nervous_system, 3; Cervix, 4; Endometrium, 5; Haematopoietic_and_lymphoid_tissue, 6; Kidney, 7; Large_intestine, 8; Liver, 9; Lung, 10; NS, 11; Ovary, 12; Pancreas, 13; Prostate, 14; Skin, 15; Stomach, 16; Thyroid, 17; Urinary_tract) |
| Top |
|
 |
| Top |
| Stat. for Non-Synonymous SNVs (# total SNVs=145) | (# total SNVs=38) |
 |  |
(# total SNVs=3) | (# total SNVs=1) |
 |  |
| Top |
| * When you move the cursor on each content, you can see more deailed mutation information on the Tooltip. Those are primary_site,primary_histology,mutation(aa),pubmedID. |
| GRCh37 position | Mutation(aa) | Unique sampleID count |
| chr12:18552663-18552663 | p.P692S | 4 |
| chr12:18443909-18443909 | p.I294I | 3 |
| chr12:18573884-18573884 | p.D734D | 3 |
| chr12:18446881-18446881 | p.C322W | 3 |
| chr12:18573894-18573894 | p.R738C | 3 |
| chr12:18716344-18716344 | p.E1231K | 3 |
| chr12:18435178-18435178 | p.E55* | 3 |
| chr12:18691166-18691166 | p.Q1093* | 2 |
| chr12:18435201-18435202 | p.V65fs*16 | 2 |
| chr12:18435597-18435597 | p.R194R | 2 |
| Top |
|
 |
| Point Mutation/ Tissue ID | 1 | 2 | 3 | 4 | 5 | 6 | 7 | 8 | 9 | 10 | 11 | 12 | 13 | 14 | 15 | 16 | 17 | 18 | 19 | 20 |
| # sample | 2 | 4 | 1 | 21 | 15 | 7 | 6 | 1 | 15 | 9 | 5 | 39 | 8 | 1 | 13 | |||||
| # mutation | 2 | 4 | 1 | 19 | 17 | 7 | 6 | 1 | 15 | 9 | 5 | 47 | 8 | 1 | 17 | |||||
| nonsynonymous SNV | 2 | 3 | 1 | 12 | 13 | 5 | 2 | 1 | 14 | 7 | 2 | 37 | 7 | 1 | 14 | |||||
| synonymous SNV | 1 | 8 | 4 | 2 | 4 | 1 | 2 | 3 | 10 | 1 | 3 |
| cf) Tissue ID; Tissue type (1; BLCA[Bladder Urothelial Carcinoma], 2; BRCA[Breast invasive carcinoma], 3; CESC[Cervical squamous cell carcinoma and endocervical adenocarcinoma], 4; COAD[Colon adenocarcinoma], 5; GBM[Glioblastoma multiforme], 6; Glioma Low Grade, 7; HNSC[Head and Neck squamous cell carcinoma], 8; KICH[Kidney Chromophobe], 9; KIRC[Kidney renal clear cell carcinoma], 10; KIRP[Kidney renal papillary cell carcinoma], 11; LAML[Acute Myeloid Leukemia], 12; LUAD[Lung adenocarcinoma], 13; LUSC[Lung squamous cell carcinoma], 14; OV[Ovarian serous cystadenocarcinoma ], 15; PAAD[Pancreatic adenocarcinoma], 16; PRAD[Prostate adenocarcinoma], 17; SKCM[Skin Cutaneous Melanoma], 18:STAD[Stomach adenocarcinoma], 19:THCA[Thyroid carcinoma], 20:UCEC[Uterine Corpus Endometrial Carcinoma]) |
| Top |
| * We represented just top 10 SNVs. When you move the cursor on each content, you can see more deailed mutation information on the Tooltip. Those are primary_site, primary_histology, mutation(aa), pubmedID. |
| Genomic Position | Mutation(aa) | Unique sampleID count |
| chr12:18658236 | p.N1014S,PIK3C2G | 3 |
| chr12:18573884 | p.D734D,PIK3C2G | 3 |
| chr12:18443909 | p.I294I,PIK3C2G | 3 |
| chr12:18762521 | p.A789V,PIK3C2G | 2 |
| chr12:18800840 | p.I835M,PIK3C2G | 2 |
| chr12:18435178 | p.R1069Q,PIK3C2G | 2 |
| chr12:18576958 | p.G1086G,PIK3C2G | 2 |
| chr12:18641506 | p.E1339E,PIK3C2G | 2 |
| chr12:18691095 | p.E55K,PIK3C2G | 2 |
| chr12:18800921 | p.E1231K,PIK3C2G | 2 |
| * Copy number data were extracted from TCGA using R package TCGA-Assembler. The URLs of all public data files on TCGA DCC data server were gathered on Jan-05-2015. Function ProcessCNAData in TCGA-Assembler package was used to obtain gene-level copy number value which is calculated as the average copy number of the genomic region of a gene. |
 |
| cf) Tissue ID[Tissue type]: BLCA[Bladder Urothelial Carcinoma], BRCA[Breast invasive carcinoma], CESC[Cervical squamous cell carcinoma and endocervical adenocarcinoma], COAD[Colon adenocarcinoma], GBM[Glioblastoma multiforme], Glioma Low Grade, HNSC[Head and Neck squamous cell carcinoma], KICH[Kidney Chromophobe], KIRC[Kidney renal clear cell carcinoma], KIRP[Kidney renal papillary cell carcinoma], LAML[Acute Myeloid Leukemia], LUAD[Lung adenocarcinoma], LUSC[Lung squamous cell carcinoma], OV[Ovarian serous cystadenocarcinoma ], PAAD[Pancreatic adenocarcinoma], PRAD[Prostate adenocarcinoma], SKCM[Skin Cutaneous Melanoma], STAD[Stomach adenocarcinoma], THCA[Thyroid carcinoma], UCEC[Uterine Corpus Endometrial Carcinoma] |
| Top |
| Gene Expression for PIK3C2G |
| * CCLE gene expression data were extracted from CCLE_Expression_Entrez_2012-10-18.res: Gene-centric RMA-normalized mRNA expression data. |
 |
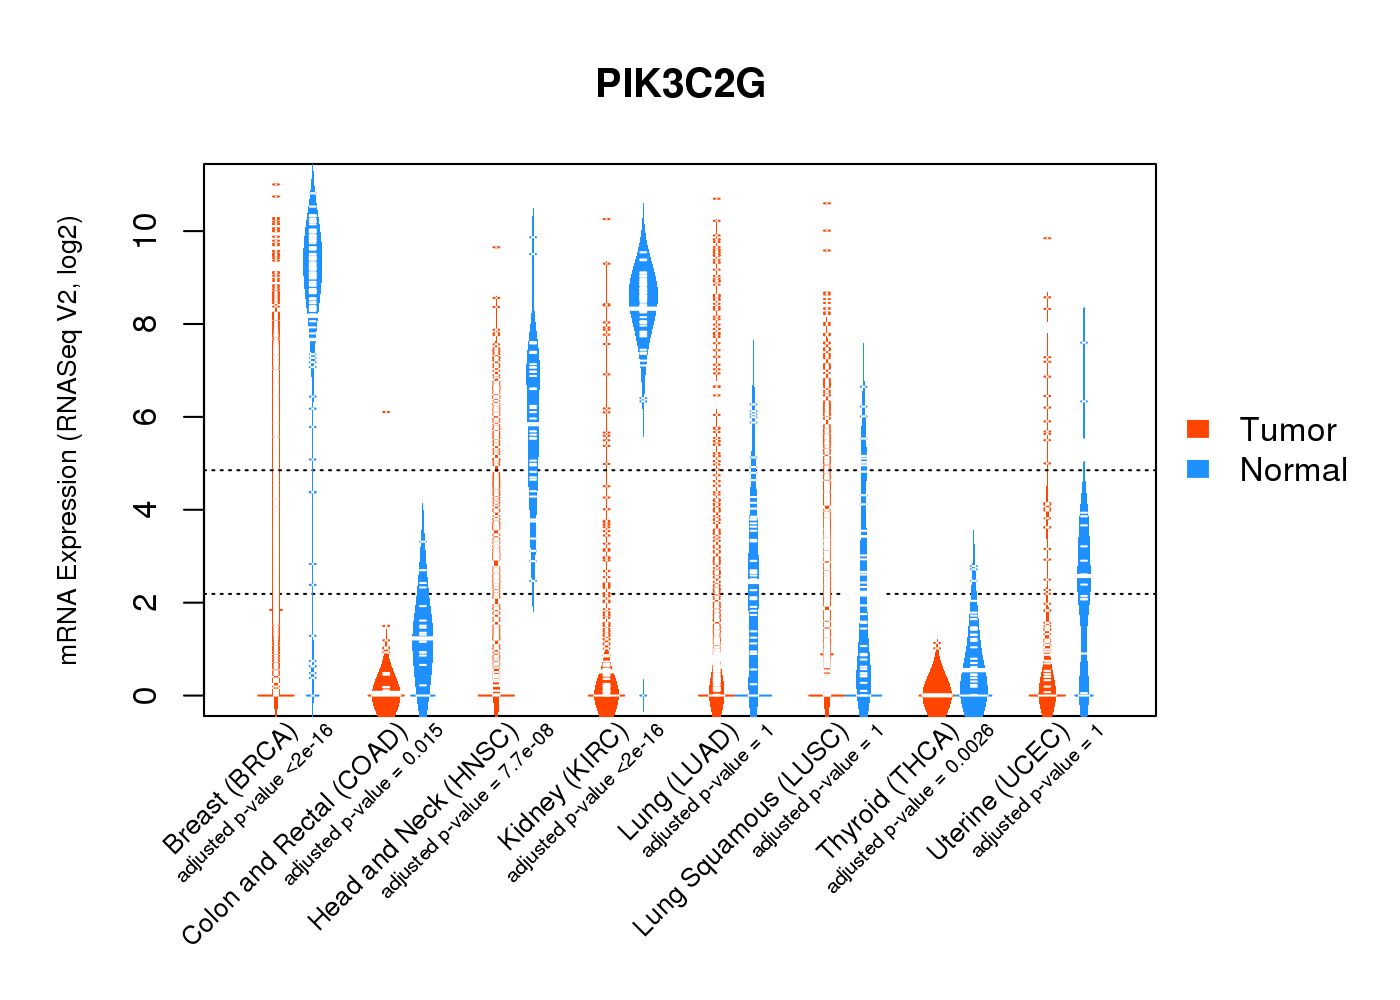
| * Normalized gene expression data of RNASeqV2 was extracted from TCGA using R package TCGA-Assembler. The URLs of all public data files on TCGA DCC data server were gathered at Jan-05-2015. Only eight cancer types have enough normal control samples for differential expression analysis. (t test, adjusted p<0.05 (using Benjamini-Hochberg FDR)) |
 |
| Top |
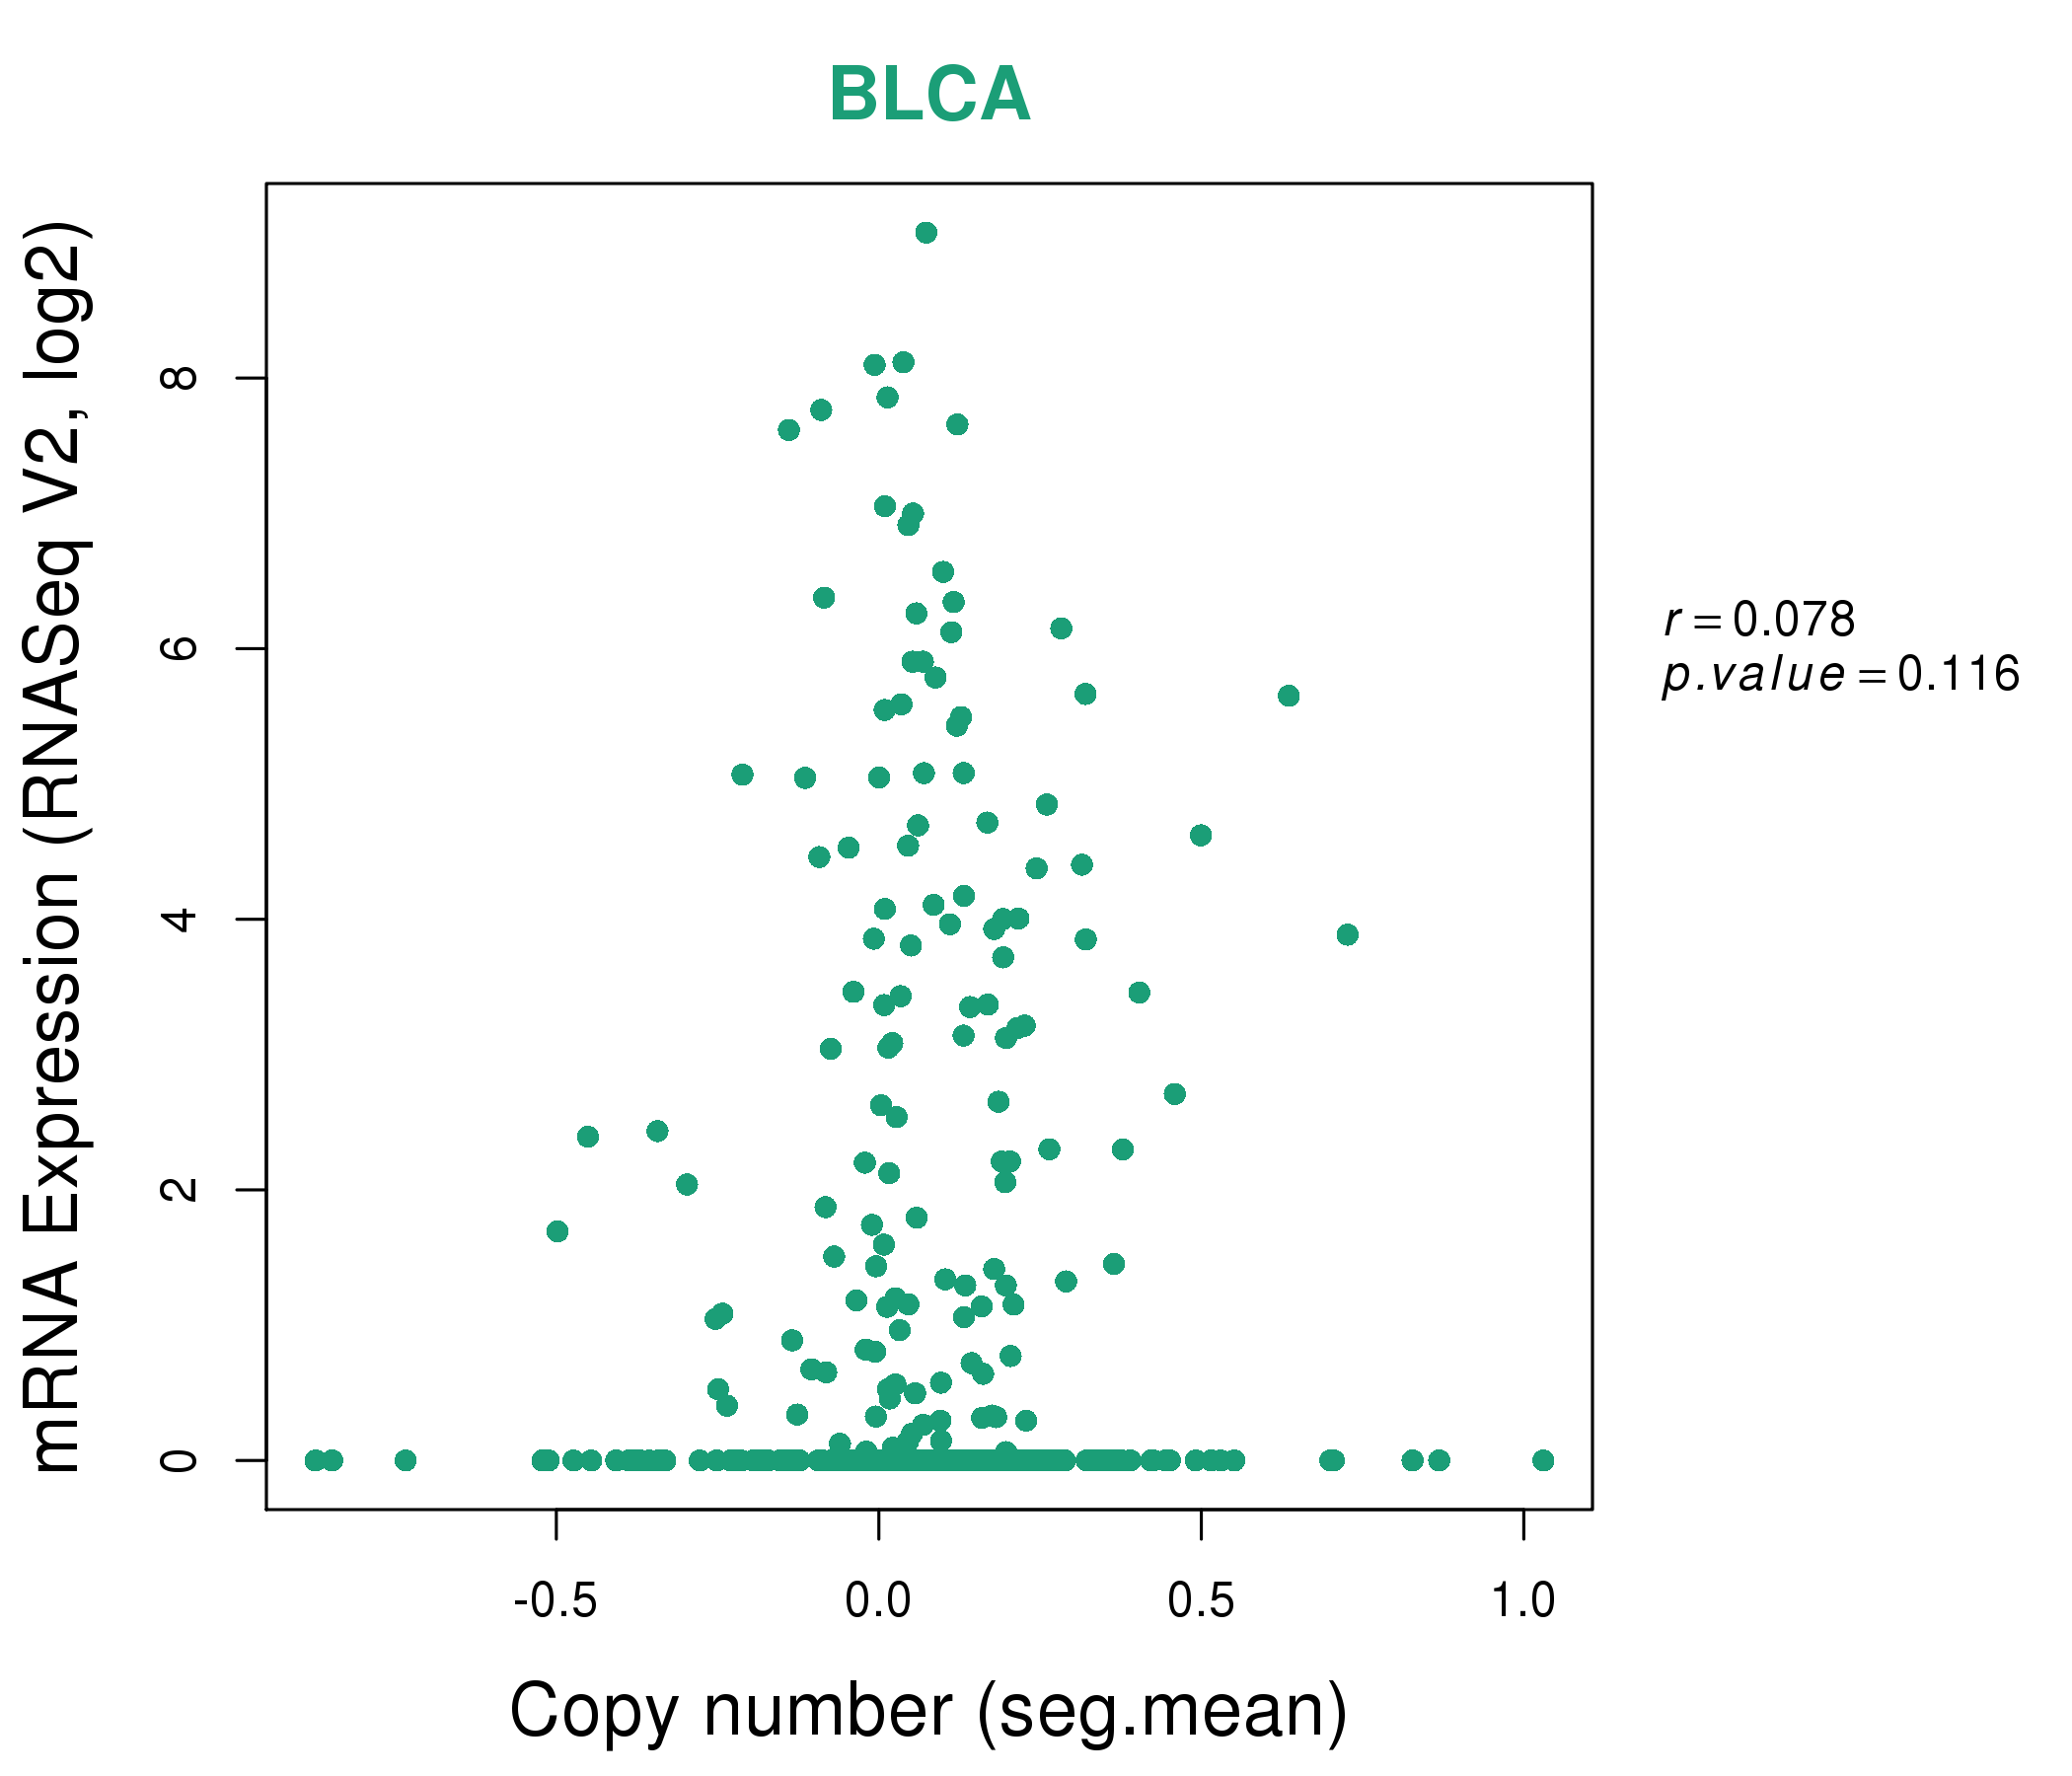
| * This plots show the correlation between CNV and gene expression. |
: Open all plots for all cancer types
 |
|
 |
|


| Top |
| Gene-Gene Network Information |
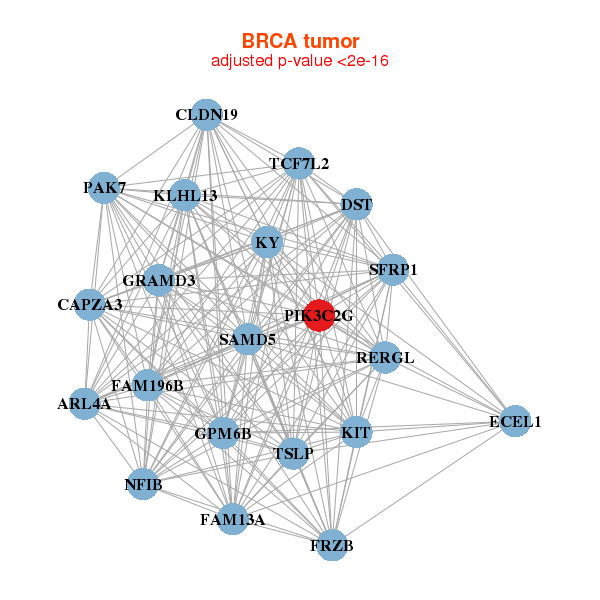
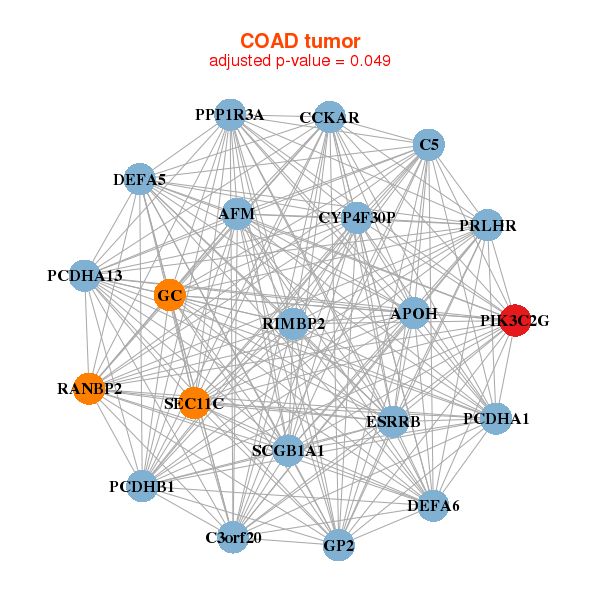
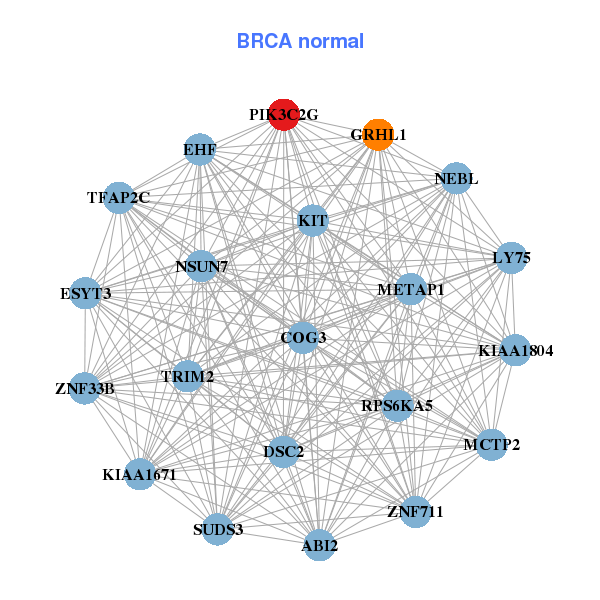
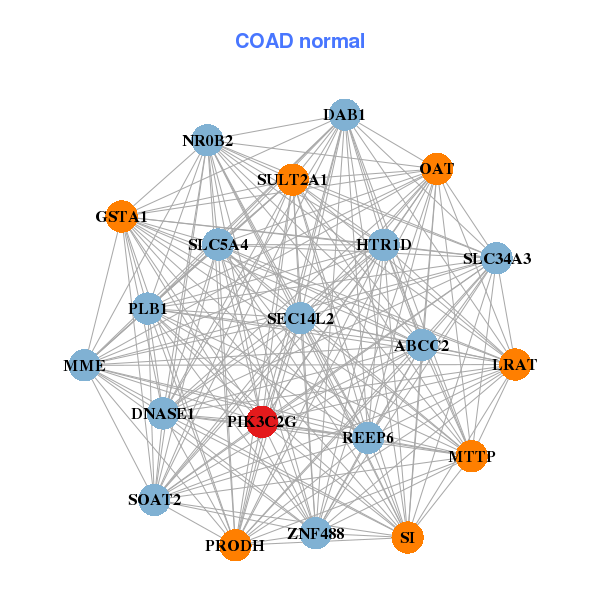
| * Co-Expression network figures were drawn using R package igraph. Only the top 20 genes with the highest correlations were shown. Red circle: input gene, orange circle: cell metabolism gene, sky circle: other gene |
: Open all plots for all cancer types
 |
|
| ARL4A,CAPZA3,CLDN19,DST,ECEL1,FAM13A,FAM196B, FRZB,GPM6B,GRAMD3,KIT,KLHL13,KY,NFIB, PAK7,PIK3C2G,RERGL,SAMD5,SFRP1,TCF7L2,TSLP | ABI2,COG3,DSC2,EHF,ESYT3,GRHL1,KIAA1671, KIAA1804,KIT,LY75,MCTP2,METAP1,NEBL,NSUN7, PIK3C2G,RPS6KA5,SUDS3,TFAP2C,TRIM2,ZNF33B,ZNF711 |
 |
|
| AFM,APOH,CYP4F30P,C3orf20,C5,CCKAR,DEFA5, DEFA6,ESRRB,GC,GP2,PCDHA13,PCDHA1,PCDHB1, PIK3C2G,PPP1R3A,PRLHR,RANBP2,RIMBP2,SCGB1A1,SEC11C | ABCC2,DAB1,DNASE1,GSTA1,HTR1D,LRAT,MME, MTTP,NR0B2,OAT,PIK3C2G,PLB1,PRODH,REEP6, SEC14L2,SI,SLC34A3,SLC5A4,SOAT2,SULT2A1,ZNF488 |
| * Co-Expression network figures were drawn using R package igraph. Only the top 20 genes with the highest correlations were shown. Red circle: input gene, orange circle: cell metabolism gene, sky circle: other gene |
: Open all plots for all cancer types
| Top |
: Open all interacting genes' information including KEGG pathway for all interacting genes from DAVID
| Top |
| Pharmacological Information for PIK3C2G |
| There's no related Drug. |
| Top |
| Cross referenced IDs for PIK3C2G |
| * We obtained these cross-references from Uniprot database. It covers 150 different DBs, 18 categories. http://www.uniprot.org/help/cross_references_section |
: Open all cross reference information
|
Copyright © 2016-Present - The Univsersity of Texas Health Science Center at Houston @ |