|
||||||||||||||||||||||||||||||||||||||||||||||||||||||||||||||||||||||||||||||||||||||||||||||||||||||||||||||||||||||||||||||||||||||||||||||||||||||||||||||||||||||||||||||||||||||||||||||||||||||||||||||||||||||||||||||||||||||||||||||||||||||||||||||||||||||||||||||||||||||||||||||||||||||||||||||||||||||||||
| |
| Phenotypic Information (metabolism pathway, cancer, disease, phenome) |
| |
| |
| Gene-Gene Network Information: Co-Expression Network, Interacting Genes & KEGG |
| |
|


| Gene Summary for PIK3CB |
| Basic gene info. | Gene symbol | PIK3CB |
| Gene name | phosphatidylinositol-4,5-bisphosphate 3-kinase, catalytic subunit beta | |
| Synonyms | P110BETA|PI3K|PI3KBETA|PIK3C1 | |
| Cytomap | UCSC genome browser: 3q22.3 | |
| Genomic location | chr3 :138371539-138478201 | |
| Type of gene | protein-coding | |
| RefGenes | NM_001256045.1, NM_006219.2, | |
| Ensembl id | ENSG00000051382 | |
| Description | PI3-kinase p110 subunit betaPI3-kinase subunit betaPI3K-betaPtdIns-3-kinase p110phosphatidylinositol 4,5-bisphosphate 3-kinase 110 kDa catalytic subunit betaphosphatidylinositol 4,5-bisphosphate 3-kinase catalytic subunit beta isoformphosphatidylino | |
| Modification date | 20141207 | |
| dbXrefs | MIM : 602925 | |
| HGNC : HGNC | ||
| Ensembl : ENSG00000051382 | ||
| HPRD : 04234 | ||
| Protein | UniProt: P42338 go to UniProt's Cross Reference DB Table | |
| Expression | CleanEX: HS_PIK3CB | |
| BioGPS: 5291 | ||
| Gene Expression Atlas: ENSG00000051382 | ||
| The Human Protein Atlas: ENSG00000051382 | ||
| Pathway | NCI Pathway Interaction Database: PIK3CB | |
| KEGG: PIK3CB | ||
| REACTOME: PIK3CB | ||
| ConsensusPathDB | ||
| Pathway Commons: PIK3CB | ||
| Metabolism | MetaCyc: PIK3CB | |
| HUMANCyc: PIK3CB | ||
| Regulation | Ensembl's Regulation: ENSG00000051382 | |
| miRBase: chr3 :138,371,539-138,478,201 | ||
| TargetScan: NM_001256045 | ||
| cisRED: ENSG00000051382 | ||
| Context | iHOP: PIK3CB | |
| cancer metabolism search in PubMed: PIK3CB | ||
| UCL Cancer Institute: PIK3CB | ||
| Assigned class in ccmGDB | A - This gene has a literature evidence and it belongs to cancer gene. | |
| References showing role of PIK3CB in cancer cell metabolism | 1. Ciraolo E, Iezzi M, Marone R, Marengo S, Curcio C, et al. (2008) Phosphoinositide 3-kinase p110β activity: key role in metabolism and mammary gland cancer but not development. Science signaling 1: ra3. go to article | |
| Top |
| Phenotypic Information for PIK3CB(metabolism pathway, cancer, disease, phenome) |
| Cancer | CGAP: PIK3CB |
| Familial Cancer Database: PIK3CB | |
| * This gene is included in those cancer gene databases. |
|
|
|
|
|
|
| ||||||||||||||||||||||||||||||||||||||||||||||||||||||||||||||||||||||||||||||||||||||||||||||||||||||||||||||||||||||||||||||||||||||||||||||||||||||||||||||||||||||||||||||||||||||||||||||||||||||||||||||||||||||||||||||||||||||||||||||||||||||||||||||||||||||||||||||||||||||||||||||||||||||||||||||||||||
Oncogene 1 | Significant driver gene in | |||||||||||||||||||||||||||||||||||||||||||||||||||||||||||||||||||||||||||||||||||||||||||||||||||||||||||||||||||||||||||||||||||||||||||||||||||||||||||||||||||||||||||||||||||||||||||||||||||||||||||||||||||||||||||||||||||||||||||||||||||||||||||||||||||||||||||||||||||||||||||||||||||||||||||||||||||||||||
| cf) number; DB name 1 Oncogene; http://nar.oxfordjournals.org/content/35/suppl_1/D721.long, 2 Tumor Suppressor gene; https://bioinfo.uth.edu/TSGene/, 3 Cancer Gene Census; http://www.nature.com/nrc/journal/v4/n3/abs/nrc1299.html, 4 CancerGenes; http://nar.oxfordjournals.org/content/35/suppl_1/D721.long, 5 Network of Cancer Gene; http://ncg.kcl.ac.uk/index.php, 1Therapeutic Vulnerabilities in Cancer; http://cbio.mskcc.org/cancergenomics/statius/ |
| KEGG_INOSITOL_PHOSPHATE_METABOLISM KEGG_FC_GAMMA_R_MEDIATED_PHAGOCYTOSIS REACTOME_PHOSPHOLIPID_METABOLISM REACTOME_PI_METABOLISM REACTOME_METABOLISM_OF_LIPIDS_AND_LIPOPROTEINS | |
| OMIM | 602925; gene. |
| Orphanet | |
| Disease | KEGG Disease: PIK3CB |
| MedGen: PIK3CB (Human Medical Genetics with Condition) | |
| ClinVar: PIK3CB | |
| Phenotype | MGI: PIK3CB (International Mouse Phenotyping Consortium) |
| PhenomicDB: PIK3CB | |
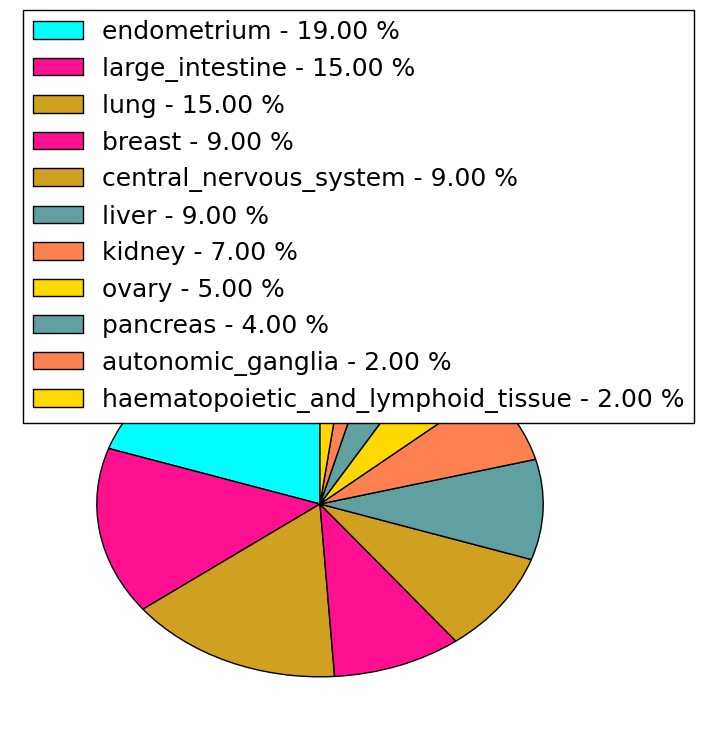
| Mutations for PIK3CB |
| * Under tables are showing count per each tissue to give us broad intuition about tissue specific mutation patterns.You can go to the detailed page for each mutation database's web site. |
| - Statistics for Tissue and Mutation type | Top |
 |
| - For Inter-chromosomal Variations |
| * Inter-chromosomal variantions includes 'interchromosomal amplicon to amplicon', 'interchromosomal amplicon to non-amplified dna', 'interchromosomal insertion', 'Interchromosomal unknown type'. |
 |
| - For Intra-chromosomal Variations |
| * Intra-chromosomal variantions includes 'intrachromosomal amplicon to amplicon', 'intrachromosomal amplicon to non-amplified dna', 'intrachromosomal deletion', 'intrachromosomal fold-back inversion', 'intrachromosomal inversion', 'intrachromosomal tandem duplication', 'Intrachromosomal unknown type', 'intrachromosomal with inverted orientation', 'intrachromosomal with non-inverted orientation'. |
 |
| Sample | Symbol_a | Chr_a | Start_a | End_a | Symbol_b | Chr_b | Start_b | End_b |
| pancreas | PIK3CB | chr3 | 138450037 | 138450057 | SELT | chr3 | 150328141 | 150328161 |
| pancreas | PIK3CB | chr3 | 138450573 | 138450593 | CDKN2B-AS1 | chr9 | 22003473 | 22003493 |
| cf) Tissue number; Tissue name (1;Breast, 2;Central_nervous_system, 3;Haematopoietic_and_lymphoid_tissue, 4;Large_intestine, 5;Liver, 6;Lung, 7;Ovary, 8;Pancreas, 9;Prostate, 10;Skin, 11;Soft_tissue, 12;Upper_aerodigestive_tract) |
| * From mRNA Sanger sequences, Chitars2.0 arranged chimeric transcripts. This table shows PIK3CB related fusion information. |
| ID | Head Gene | Tail Gene | Accession | Gene_a | qStart_a | qEnd_a | Chromosome_a | tStart_a | tEnd_a | Gene_a | qStart_a | qEnd_a | Chromosome_a | tStart_a | tEnd_a |
| Top |
| Mutation type/ Tissue ID | brca | cns | cerv | endome | haematopo | kidn | Lintest | liver | lung | ns | ovary | pancre | prost | skin | stoma | thyro | urina | |||
| Total # sample | 1 | |||||||||||||||||||
| GAIN (# sample) | 1 | |||||||||||||||||||
| LOSS (# sample) |
| cf) Tissue ID; Tissue type (1; Breast, 2; Central_nervous_system, 3; Cervix, 4; Endometrium, 5; Haematopoietic_and_lymphoid_tissue, 6; Kidney, 7; Large_intestine, 8; Liver, 9; Lung, 10; NS, 11; Ovary, 12; Pancreas, 13; Prostate, 14; Skin, 15; Stomach, 16; Thyroid, 17; Urinary_tract) |
| Top |
|
 |
| Top |
| Stat. for Non-Synonymous SNVs (# total SNVs=93) | (# total SNVs=16) |
 |  |
(# total SNVs=1) | (# total SNVs=2) |
 |  |
| Top |
| * When you move the cursor on each content, you can see more deailed mutation information on the Tooltip. Those are primary_site,primary_histology,mutation(aa),pubmedID. |
| GRCh37 position | Mutation(aa) | Unique sampleID count |
| chr3:138400818-138400818 | p.L832W | 5 |
| chr3:138453486-138453486 | p.R321Q | 4 |
| chr3:138374244-138374244 | p.D1067A | 4 |
| chr3:138374293-138374293 | p.E1051K | 4 |
| chr3:138384011-138384011 | p.R847C | 3 |
| chr3:138382764-138382764 | p.V927A | 3 |
| chr3:138409921-138409921 | p.D653Y | 2 |
| chr3:138478038-138478038 | p.A50P | 2 |
| chr3:138456589-138456589 | p.V254E | 2 |
| chr3:138409964-138409964 | p.Y638Y | 2 |
| Top |
|
 |
| Point Mutation/ Tissue ID | 1 | 2 | 3 | 4 | 5 | 6 | 7 | 8 | 9 | 10 | 11 | 12 | 13 | 14 | 15 | 16 | 17 | 18 | 19 | 20 |
| # sample | 2 | 5 | 8 | 3 | 6 | 3 | 2 | 1 | 9 | 3 | 4 | 9 | 6 | 1 | 11 | |||||
| # mutation | 5 | 5 | 8 | 4 | 6 | 3 | 2 | 1 | 9 | 3 | 4 | 10 | 9 | 1 | 13 | |||||
| nonsynonymous SNV | 4 | 5 | 5 | 4 | 5 | 3 | 1 | 1 | 8 | 2 | 4 | 7 | 7 | 1 | 13 | |||||
| synonymous SNV | 1 | 3 | 1 | 1 | 1 | 1 | 3 | 2 |
| cf) Tissue ID; Tissue type (1; BLCA[Bladder Urothelial Carcinoma], 2; BRCA[Breast invasive carcinoma], 3; CESC[Cervical squamous cell carcinoma and endocervical adenocarcinoma], 4; COAD[Colon adenocarcinoma], 5; GBM[Glioblastoma multiforme], 6; Glioma Low Grade, 7; HNSC[Head and Neck squamous cell carcinoma], 8; KICH[Kidney Chromophobe], 9; KIRC[Kidney renal clear cell carcinoma], 10; KIRP[Kidney renal papillary cell carcinoma], 11; LAML[Acute Myeloid Leukemia], 12; LUAD[Lung adenocarcinoma], 13; LUSC[Lung squamous cell carcinoma], 14; OV[Ovarian serous cystadenocarcinoma ], 15; PAAD[Pancreatic adenocarcinoma], 16; PRAD[Prostate adenocarcinoma], 17; SKCM[Skin Cutaneous Melanoma], 18:STAD[Stomach adenocarcinoma], 19:THCA[Thyroid carcinoma], 20:UCEC[Uterine Corpus Endometrial Carcinoma]) |
| Top |
| * We represented just top 10 SNVs. When you move the cursor on each content, you can see more deailed mutation information on the Tooltip. Those are primary_site, primary_histology, mutation(aa), pubmedID. |
| Genomic Position | Mutation(aa) | Unique sampleID count |
| chr3:138374244 | p.D579A,PIK3CB | 3 |
| chr3:138453486 | p.E470K | 2 |
| chr3:138384011 | p.G28S | 2 |
| chr3:138453578 | p.R321Q | 2 |
| chr3:138426123 | p.R359C,PIK3CB | 2 |
| chr3:138478104 | p.K290N | 2 |
| chr3:138456596 | p.E563K,PIK3CB | 2 |
| chr3:138374293 | p.G252W | 2 |
| chr3:138383967 | p.L280F,PIK3CB | 1 |
| chr3:138409870 | p.A17T,PIK3CB | 1 |
| * Copy number data were extracted from TCGA using R package TCGA-Assembler. The URLs of all public data files on TCGA DCC data server were gathered on Jan-05-2015. Function ProcessCNAData in TCGA-Assembler package was used to obtain gene-level copy number value which is calculated as the average copy number of the genomic region of a gene. |
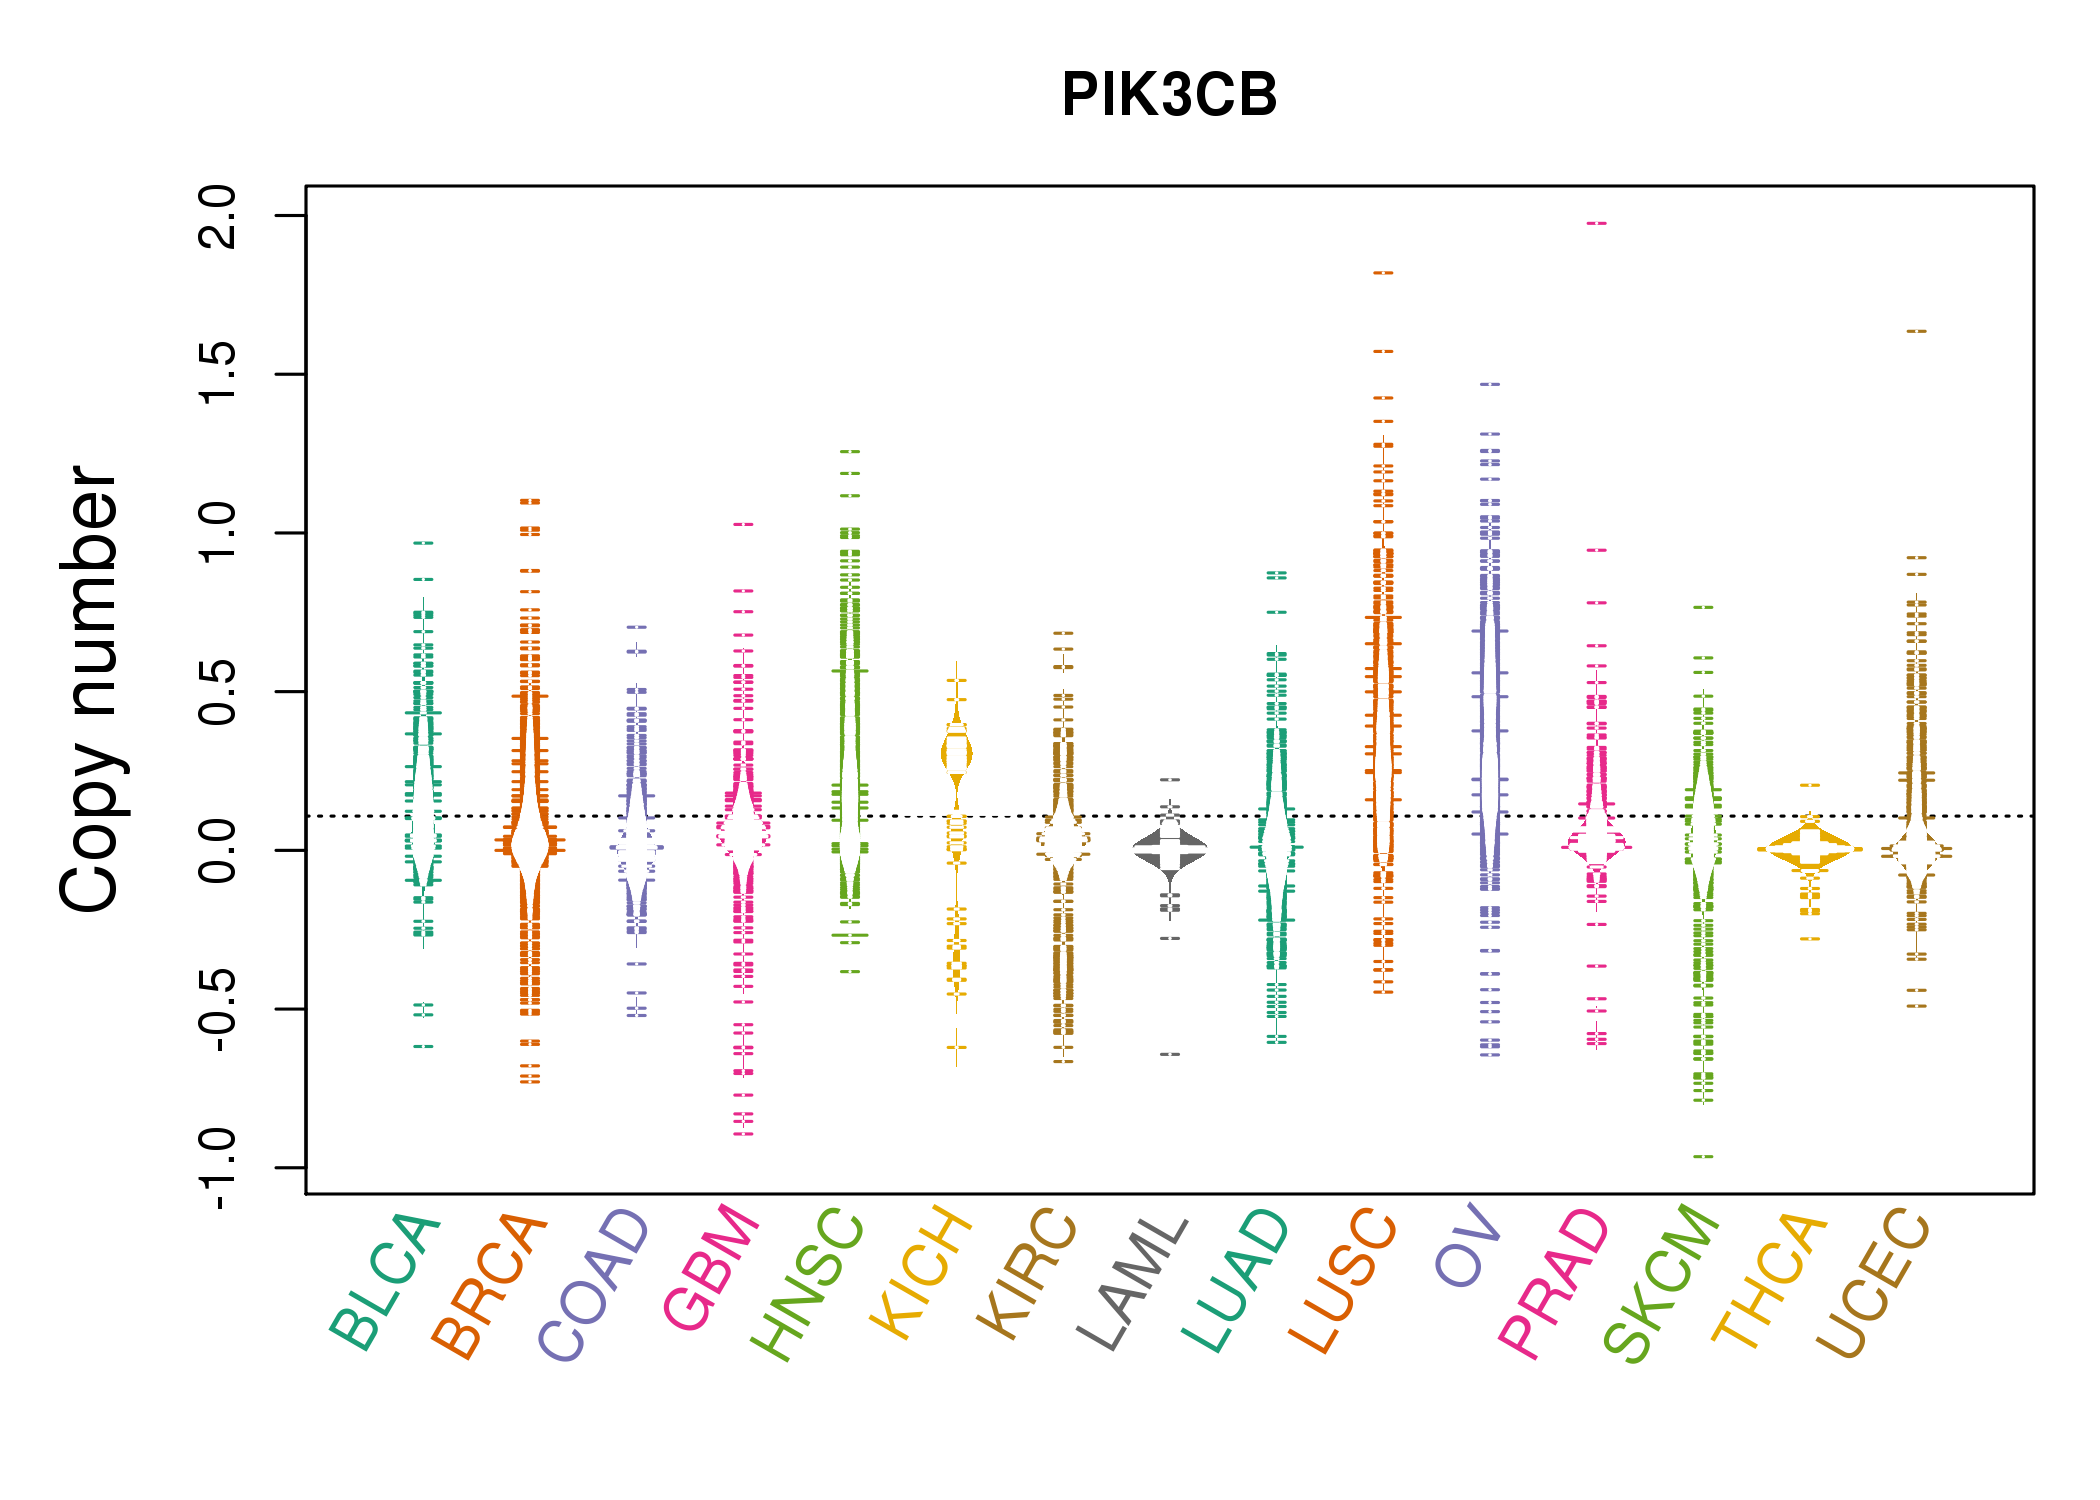 |
| cf) Tissue ID[Tissue type]: BLCA[Bladder Urothelial Carcinoma], BRCA[Breast invasive carcinoma], CESC[Cervical squamous cell carcinoma and endocervical adenocarcinoma], COAD[Colon adenocarcinoma], GBM[Glioblastoma multiforme], Glioma Low Grade, HNSC[Head and Neck squamous cell carcinoma], KICH[Kidney Chromophobe], KIRC[Kidney renal clear cell carcinoma], KIRP[Kidney renal papillary cell carcinoma], LAML[Acute Myeloid Leukemia], LUAD[Lung adenocarcinoma], LUSC[Lung squamous cell carcinoma], OV[Ovarian serous cystadenocarcinoma ], PAAD[Pancreatic adenocarcinoma], PRAD[Prostate adenocarcinoma], SKCM[Skin Cutaneous Melanoma], STAD[Stomach adenocarcinoma], THCA[Thyroid carcinoma], UCEC[Uterine Corpus Endometrial Carcinoma] |
| Top |
| Gene Expression for PIK3CB |
| * CCLE gene expression data were extracted from CCLE_Expression_Entrez_2012-10-18.res: Gene-centric RMA-normalized mRNA expression data. |
 |
| * Normalized gene expression data of RNASeqV2 was extracted from TCGA using R package TCGA-Assembler. The URLs of all public data files on TCGA DCC data server were gathered at Jan-05-2015. Only eight cancer types have enough normal control samples for differential expression analysis. (t test, adjusted p<0.05 (using Benjamini-Hochberg FDR)) |
 |
| Top |
| * This plots show the correlation between CNV and gene expression. |
: Open all plots for all cancer types
 |
|
 |
|


| Top |
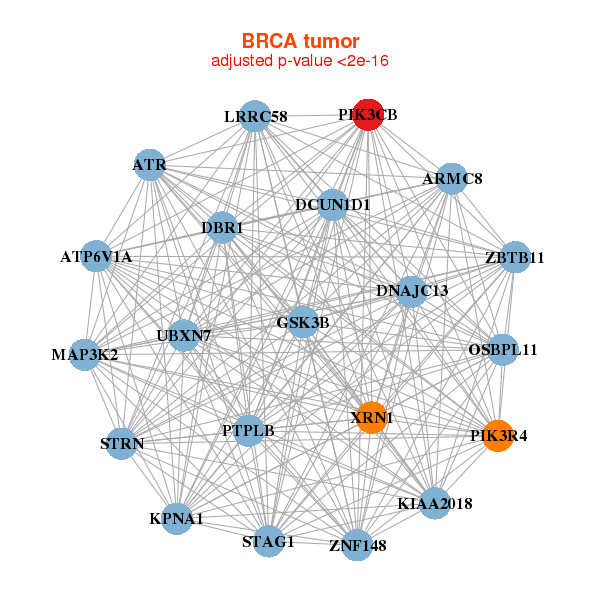
| Gene-Gene Network Information |
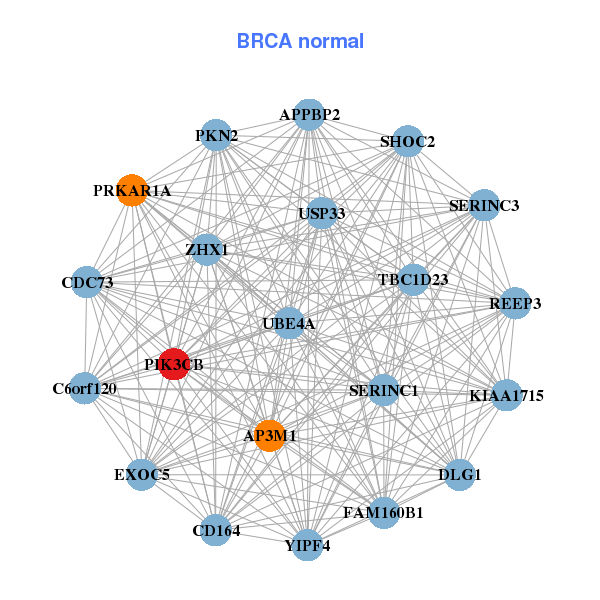
| * Co-Expression network figures were drawn using R package igraph. Only the top 20 genes with the highest correlations were shown. Red circle: input gene, orange circle: cell metabolism gene, sky circle: other gene |
: Open all plots for all cancer types
 |
|
| ARMC8,ATP6V1A,ATR,DBR1,DCUN1D1,DNAJC13,GSK3B, KIAA2018,KPNA1,LRRC58,MAP3K2,OSBPL11,PIK3CB,PIK3R4, PTPLB,STAG1,STRN,UBXN7,XRN1,ZBTB11,ZNF148 | AP3M1,APPBP2,C6orf120,CD164,CDC73,DLG1,EXOC5, FAM160B1,KIAA1715,PIK3CB,PKN2,PRKAR1A,REEP3,SERINC1, SERINC3,SHOC2,TBC1D23,UBE4A,USP33,YIPF4,ZHX1 |
 |
|
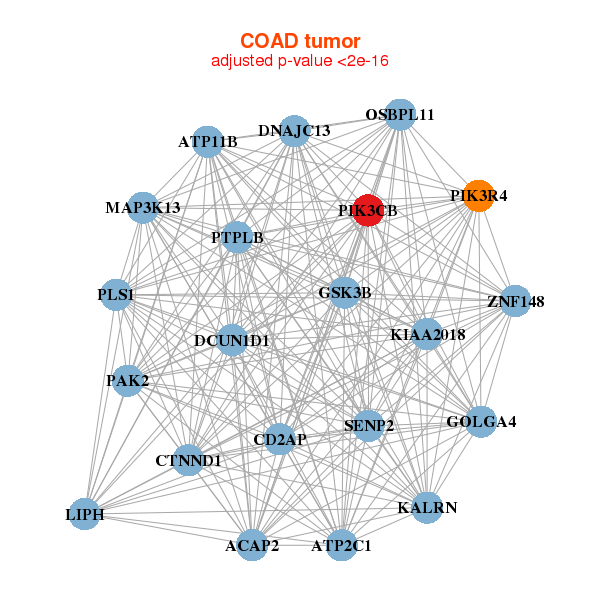
| ACAP2,ATP11B,ATP2C1,CD2AP,CTNND1,DCUN1D1,DNAJC13, GOLGA4,GSK3B,KALRN,KIAA2018,LIPH,MAP3K13,OSBPL11, PAK2,PIK3CB,PIK3R4,PLS1,PTPLB,SENP2,ZNF148 | CD2AP,CDCP1,CDH1,CORO2A,CTNND1,TMEM236,GCC2, ITFG1,KIF3B,LASP1,LIMA1,MGAT4A,MOB3B,MYO6, NCSTN,NR3C2,NUMB,PDCD6IP,PIK3CB,PLS1,TAOK3 |

| * Co-Expression network figures were drawn using R package igraph. Only the top 20 genes with the highest correlations were shown. Red circle: input gene, orange circle: cell metabolism gene, sky circle: other gene |
: Open all plots for all cancer types
| Top |
: Open all interacting genes' information including KEGG pathway for all interacting genes from DAVID
| Top |
| Pharmacological Information for PIK3CB |
| There's no related Drug. |
| Top |
| Cross referenced IDs for PIK3CB |
| * We obtained these cross-references from Uniprot database. It covers 150 different DBs, 18 categories. http://www.uniprot.org/help/cross_references_section |
: Open all cross reference information
|
Copyright © 2016-Present - The Univsersity of Texas Health Science Center at Houston @ |