|
|||||||||||||||||||||||||||||||||||||||||||||||||||||||||||||||||||||||||||||||||||||||||||||||||||||||||||||||||||||||||||||||||||||||||||||||||||||||||||||||||||||||||||||||||||||||||||||||||||||||||||||||||||||||||||||||||||||||||||||||||||||||||||||||||||||||||||||||||||||||||||||||||||||||||||||||||||||||||||||||||||||||||||||
| |
| Phenotypic Information (metabolism pathway, cancer, disease, phenome) |
| |
| |
| Gene-Gene Network Information: Co-Expression Network, Interacting Genes & KEGG |
| |
|


| Gene Summary for PIK3CD |
| Basic gene info. | Gene symbol | PIK3CD |
| Gene name | phosphatidylinositol-4,5-bisphosphate 3-kinase, catalytic subunit delta | |
| Synonyms | APDS|IMD14|P110DELTA|PI3K|p110D | |
| Cytomap | UCSC genome browser: 1p36.2 | |
| Genomic location | chr1 :9711789-9789172 | |
| Type of gene | protein-coding | |
| RefGenes | NM_005026.3, | |
| Ensembl id | ENSG00000171608 | |
| Description | PI3-kinase p110 subunit deltaPI3Kdeltaphosphatidylinositol 4,5-bisphosphate 3-kinase catalytic subunit delta isoformphosphatidylinositol-4,5-bisphosphate 3-kinase 110 kDa catalytic subunit deltaphosphatidylinositol-4,5-bisphosphate 3-kinase catalytic | |
| Modification date | 20141207 | |
| dbXrefs | MIM : 602839 | |
| HGNC : HGNC | ||
| Ensembl : ENSG00000171608 | ||
| Vega : OTTHUMG00000001450 | ||
| Protein | UniProt: go to UniProt's Cross Reference DB Table | |
| Expression | CleanEX: HS_PIK3CD | |
| BioGPS: 5293 | ||
| Gene Expression Atlas: ENSG00000171608 | ||
| The Human Protein Atlas: ENSG00000171608 | ||
| Pathway | NCI Pathway Interaction Database: PIK3CD | |
| KEGG: PIK3CD | ||
| REACTOME: PIK3CD | ||
| ConsensusPathDB | ||
| Pathway Commons: PIK3CD | ||
| Metabolism | MetaCyc: PIK3CD | |
| HUMANCyc: PIK3CD | ||
| Regulation | Ensembl's Regulation: ENSG00000171608 | |
| miRBase: chr1 :9,711,789-9,789,172 | ||
| TargetScan: NM_005026 | ||
| cisRED: ENSG00000171608 | ||
| Context | iHOP: PIK3CD | |
| cancer metabolism search in PubMed: PIK3CD | ||
| UCL Cancer Institute: PIK3CD | ||
| Assigned class in ccmGDB | C | |
| Top |
| Phenotypic Information for PIK3CD(metabolism pathway, cancer, disease, phenome) |
| Cancer | CGAP: PIK3CD |
| Familial Cancer Database: PIK3CD | |
| * This gene is included in those cancer gene databases. |
|
|
|
|
|
|
| |||||||||||||||||||||||||||||||||||||||||||||||||||||||||||||||||||||||||||||||||||||||||||||||||||||||||||||||||||||||||||||||||||||||||||||||||||||||||||||||||||||||||||||||||||||||||||||||||||||||||||||||||||||||||||||||||||||||||||||||||||||||||||||||||||||||||||||||||||||||||||||||||||||||||||||||||||||||||||||||||||||||
Oncogene 1 | Significant driver gene in | ||||||||||||||||||||||||||||||||||||||||||||||||||||||||||||||||||||||||||||||||||||||||||||||||||||||||||||||||||||||||||||||||||||||||||||||||||||||||||||||||||||||||||||||||||||||||||||||||||||||||||||||||||||||||||||||||||||||||||||||||||||||||||||||||||||||||||||||||||||||||||||||||||||||||||||||||||||||||||||||||||||||||||||
| cf) number; DB name 1 Oncogene; http://nar.oxfordjournals.org/content/35/suppl_1/D721.long, 2 Tumor Suppressor gene; https://bioinfo.uth.edu/TSGene/, 3 Cancer Gene Census; http://www.nature.com/nrc/journal/v4/n3/abs/nrc1299.html, 4 CancerGenes; http://nar.oxfordjournals.org/content/35/suppl_1/D721.long, 5 Network of Cancer Gene; http://ncg.kcl.ac.uk/index.php, 1Therapeutic Vulnerabilities in Cancer; http://cbio.mskcc.org/cancergenomics/statius/ |
| KEGG_INOSITOL_PHOSPHATE_METABOLISM KEGG_FC_GAMMA_R_MEDIATED_PHAGOCYTOSIS REACTOME_PHOSPHOLIPID_METABOLISM REACTOME_PI_METABOLISM REACTOME_METABOLISM_OF_LIPIDS_AND_LIPOPROTEINS | |
| OMIM | |
| Orphanet | |
| Disease | KEGG Disease: PIK3CD |
| MedGen: PIK3CD (Human Medical Genetics with Condition) | |
| ClinVar: PIK3CD | |
| Phenotype | MGI: PIK3CD (International Mouse Phenotyping Consortium) |
| PhenomicDB: PIK3CD | |
| Mutations for PIK3CD |
| * Under tables are showing count per each tissue to give us broad intuition about tissue specific mutation patterns.You can go to the detailed page for each mutation database's web site. |
| - Statistics for Tissue and Mutation type | Top |
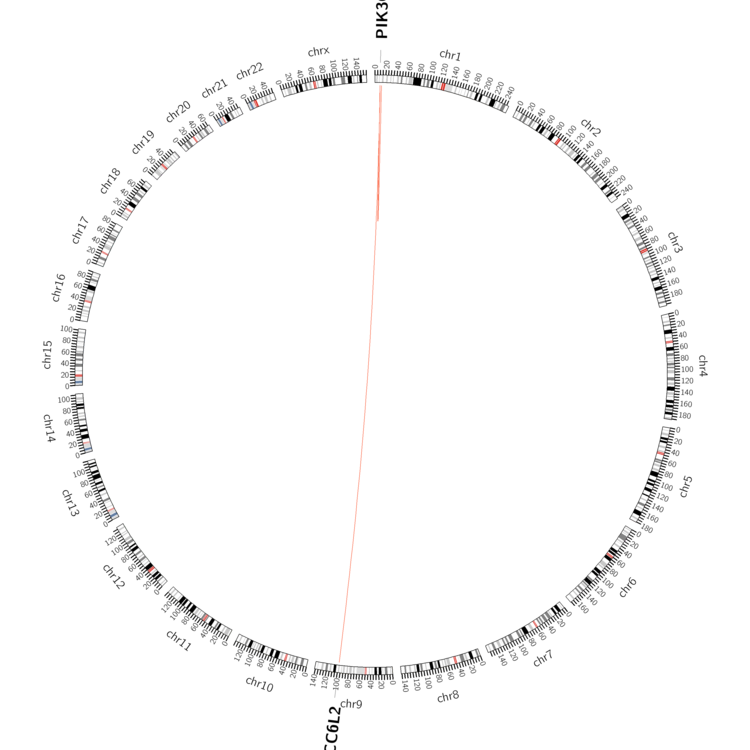 |
| - For Inter-chromosomal Variations |
| * Inter-chromosomal variantions includes 'interchromosomal amplicon to amplicon', 'interchromosomal amplicon to non-amplified dna', 'interchromosomal insertion', 'Interchromosomal unknown type'. |
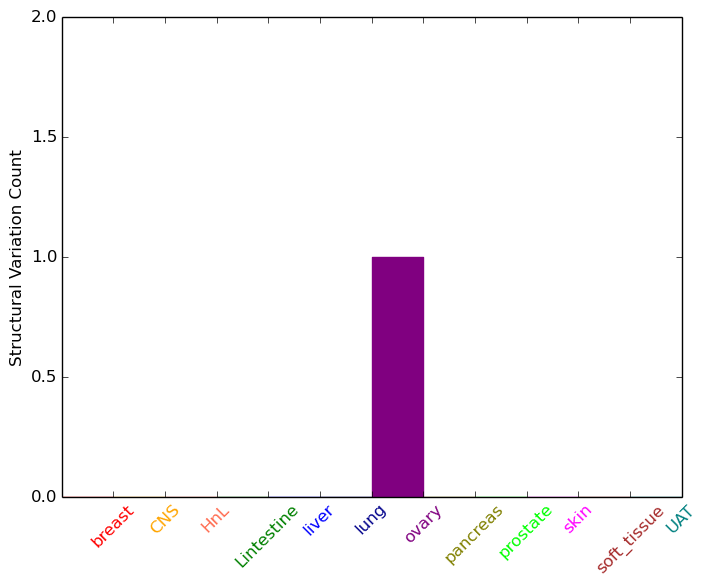 |
| - For Intra-chromosomal Variations |
| * Intra-chromosomal variantions includes 'intrachromosomal amplicon to amplicon', 'intrachromosomal amplicon to non-amplified dna', 'intrachromosomal deletion', 'intrachromosomal fold-back inversion', 'intrachromosomal inversion', 'intrachromosomal tandem duplication', 'Intrachromosomal unknown type', 'intrachromosomal with inverted orientation', 'intrachromosomal with non-inverted orientation'. |
 |
| Sample | Symbol_a | Chr_a | Start_a | End_a | Symbol_b | Chr_b | Start_b | End_b |
| breast | PIK3CD | chr1 | 9717719 | 9717719 | chr1 | 12280310 | 12280310 | |
| ovary | PIK3CD | chr1 | 9735445 | 9735465 | ERCC6L2 | chr9 | 98696736 | 98696756 |
| ovary | PIK3CD | chr1 | 9762206 | 9762406 | PIK3CD | chr1 | 9762713 | 9762913 |
| cf) Tissue number; Tissue name (1;Breast, 2;Central_nervous_system, 3;Haematopoietic_and_lymphoid_tissue, 4;Large_intestine, 5;Liver, 6;Lung, 7;Ovary, 8;Pancreas, 9;Prostate, 10;Skin, 11;Soft_tissue, 12;Upper_aerodigestive_tract) |
| * From mRNA Sanger sequences, Chitars2.0 arranged chimeric transcripts. This table shows PIK3CD related fusion information. |
| ID | Head Gene | Tail Gene | Accession | Gene_a | qStart_a | qEnd_a | Chromosome_a | tStart_a | tEnd_a | Gene_a | qStart_a | qEnd_a | Chromosome_a | tStart_a | tEnd_a |
| BF926362 | ZNF814 | 29 | 92 | 19 | 58383004 | 58383067 | PIK3CD | 83 | 395 | 1 | 9772011 | 9772324 | |
| BI020398 | PIK3CD | 118 | 141 | 1 | 9784241 | 9784264 | CDS2 | 125 | 423 | 20 | 5173732 | 5174032 | |
| AV739808 | PIK3CD | 43 | 435 | 1 | 9788270 | 9788663 | PIK3CD | 429 | 613 | 1 | 9788156 | 9788348 | |
| BE181134 | SLC35E4 | 6 | 314 | 22 | 31032998 | 31033308 | PIK3CD | 295 | 314 | 1 | 9738491 | 9738510 | |
| Top |
| Mutation type/ Tissue ID | brca | cns | cerv | endome | haematopo | kidn | Lintest | liver | lung | ns | ovary | pancre | prost | skin | stoma | thyro | urina | |||
| Total # sample | 1 | |||||||||||||||||||
| GAIN (# sample) | ||||||||||||||||||||
| LOSS (# sample) | 1 |
| cf) Tissue ID; Tissue type (1; Breast, 2; Central_nervous_system, 3; Cervix, 4; Endometrium, 5; Haematopoietic_and_lymphoid_tissue, 6; Kidney, 7; Large_intestine, 8; Liver, 9; Lung, 10; NS, 11; Ovary, 12; Pancreas, 13; Prostate, 14; Skin, 15; Stomach, 16; Thyroid, 17; Urinary_tract) |
| Top |
|
 |
| Top |
| Stat. for Non-Synonymous SNVs (# total SNVs=74) | (# total SNVs=28) |
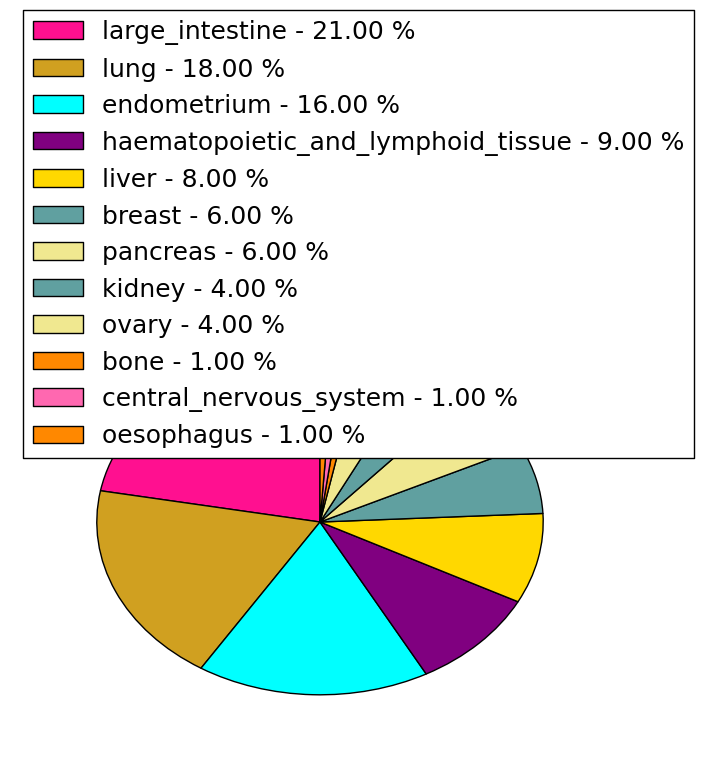 | 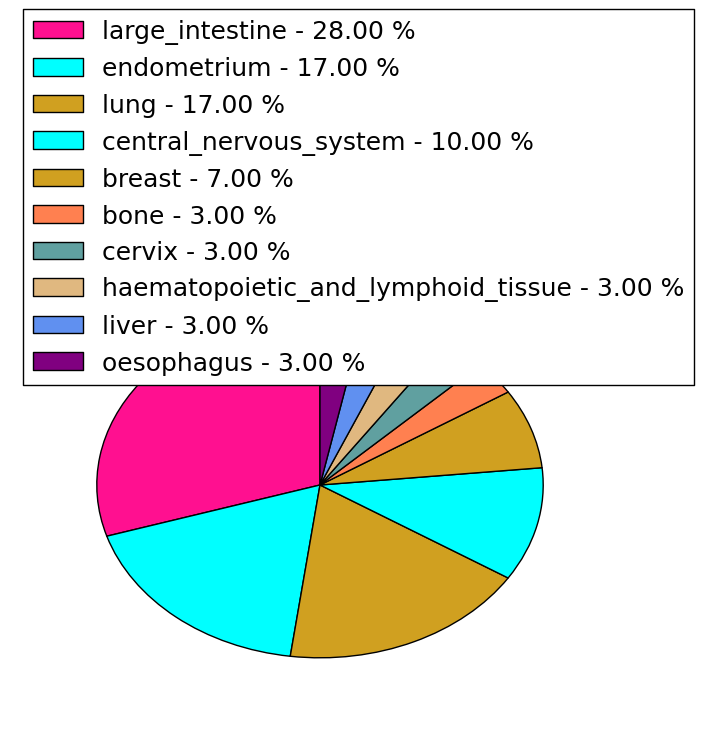 |
(# total SNVs=0) | (# total SNVs=1) |
 |
| Top |
| * When you move the cursor on each content, you can see more deailed mutation information on the Tooltip. Those are primary_site,primary_histology,mutation(aa),pubmedID. |
| GRCh37 position | Mutation(aa) | Unique sampleID count |
| chr1:9770629-9770629 | p.N39S | 3 |
| chr1:9780711-9780711 | p.E505K | 3 |
| chr1:9787030-9787030 | p.E1021K | 3 |
| chr1:9781596-9781596 | p.R636W | 3 |
| chr1:9770571-9770571 | p.V20I | 3 |
| chr1:9783242-9783242 | p.L829P | 2 |
| chr1:9783245-9783245 | p.R830H | 2 |
| chr1:9780836-9780836 | p.S520A | 2 |
| chr1:9783259-9783259 | p.A835T | 2 |
| chr1:9775698-9775698 | p.E81K | 2 |
| Top |
|
 |
| Point Mutation/ Tissue ID | 1 | 2 | 3 | 4 | 5 | 6 | 7 | 8 | 9 | 10 | 11 | 12 | 13 | 14 | 15 | 16 | 17 | 18 | 19 | 20 |
| # sample | 3 | 4 | 2 | 17 | 5 | 4 | 2 | 1 | 3 | 4 | 2 | 7 | 14 | 1 | 14 | |||||
| # mutation | 3 | 4 | 2 | 16 | 5 | 5 | 2 | 1 | 3 | 5 | 2 | 7 | 13 | 1 | 17 | |||||
| nonsynonymous SNV | 3 | 3 | 1 | 11 | 2 | 2 | 2 | 1 | 2 | 4 | 2 | 6 | 11 | 12 | ||||||
| synonymous SNV | 1 | 1 | 5 | 3 | 3 | 1 | 1 | 1 | 2 | 1 | 5 |
| cf) Tissue ID; Tissue type (1; BLCA[Bladder Urothelial Carcinoma], 2; BRCA[Breast invasive carcinoma], 3; CESC[Cervical squamous cell carcinoma and endocervical adenocarcinoma], 4; COAD[Colon adenocarcinoma], 5; GBM[Glioblastoma multiforme], 6; Glioma Low Grade, 7; HNSC[Head and Neck squamous cell carcinoma], 8; KICH[Kidney Chromophobe], 9; KIRC[Kidney renal clear cell carcinoma], 10; KIRP[Kidney renal papillary cell carcinoma], 11; LAML[Acute Myeloid Leukemia], 12; LUAD[Lung adenocarcinoma], 13; LUSC[Lung squamous cell carcinoma], 14; OV[Ovarian serous cystadenocarcinoma ], 15; PAAD[Pancreatic adenocarcinoma], 16; PRAD[Prostate adenocarcinoma], 17; SKCM[Skin Cutaneous Melanoma], 18:STAD[Stomach adenocarcinoma], 19:THCA[Thyroid carcinoma], 20:UCEC[Uterine Corpus Endometrial Carcinoma]) |
| Top |
| * We represented just top 10 SNVs. When you move the cursor on each content, you can see more deailed mutation information on the Tooltip. Those are primary_site, primary_histology, mutation(aa), pubmedID. |
| Genomic Position | Mutation(aa) | Unique sampleID count |
| chr1:9770519 | p.V20I | 2 |
| chr1:9778917 | p.P2P | 2 |
| chr1:9783259 | p.A396T | 2 |
| chr1:9770571 | p.A835T | 2 |
| chr1:9776083 | p.Y251C | 1 |
| chr1:9780920 | p.A404V | 1 |
| chr1:9784471 | p.L615L | 1 |
| chr1:9777639 | p.N836Y | 1 |
| chr1:9782144 | p.L1012L | 1 |
| chr1:9775612 | p.I262M | 1 |
| * Copy number data were extracted from TCGA using R package TCGA-Assembler. The URLs of all public data files on TCGA DCC data server were gathered on Jan-05-2015. Function ProcessCNAData in TCGA-Assembler package was used to obtain gene-level copy number value which is calculated as the average copy number of the genomic region of a gene. |
 |
| cf) Tissue ID[Tissue type]: BLCA[Bladder Urothelial Carcinoma], BRCA[Breast invasive carcinoma], CESC[Cervical squamous cell carcinoma and endocervical adenocarcinoma], COAD[Colon adenocarcinoma], GBM[Glioblastoma multiforme], Glioma Low Grade, HNSC[Head and Neck squamous cell carcinoma], KICH[Kidney Chromophobe], KIRC[Kidney renal clear cell carcinoma], KIRP[Kidney renal papillary cell carcinoma], LAML[Acute Myeloid Leukemia], LUAD[Lung adenocarcinoma], LUSC[Lung squamous cell carcinoma], OV[Ovarian serous cystadenocarcinoma ], PAAD[Pancreatic adenocarcinoma], PRAD[Prostate adenocarcinoma], SKCM[Skin Cutaneous Melanoma], STAD[Stomach adenocarcinoma], THCA[Thyroid carcinoma], UCEC[Uterine Corpus Endometrial Carcinoma] |
| Top |
| Gene Expression for PIK3CD |
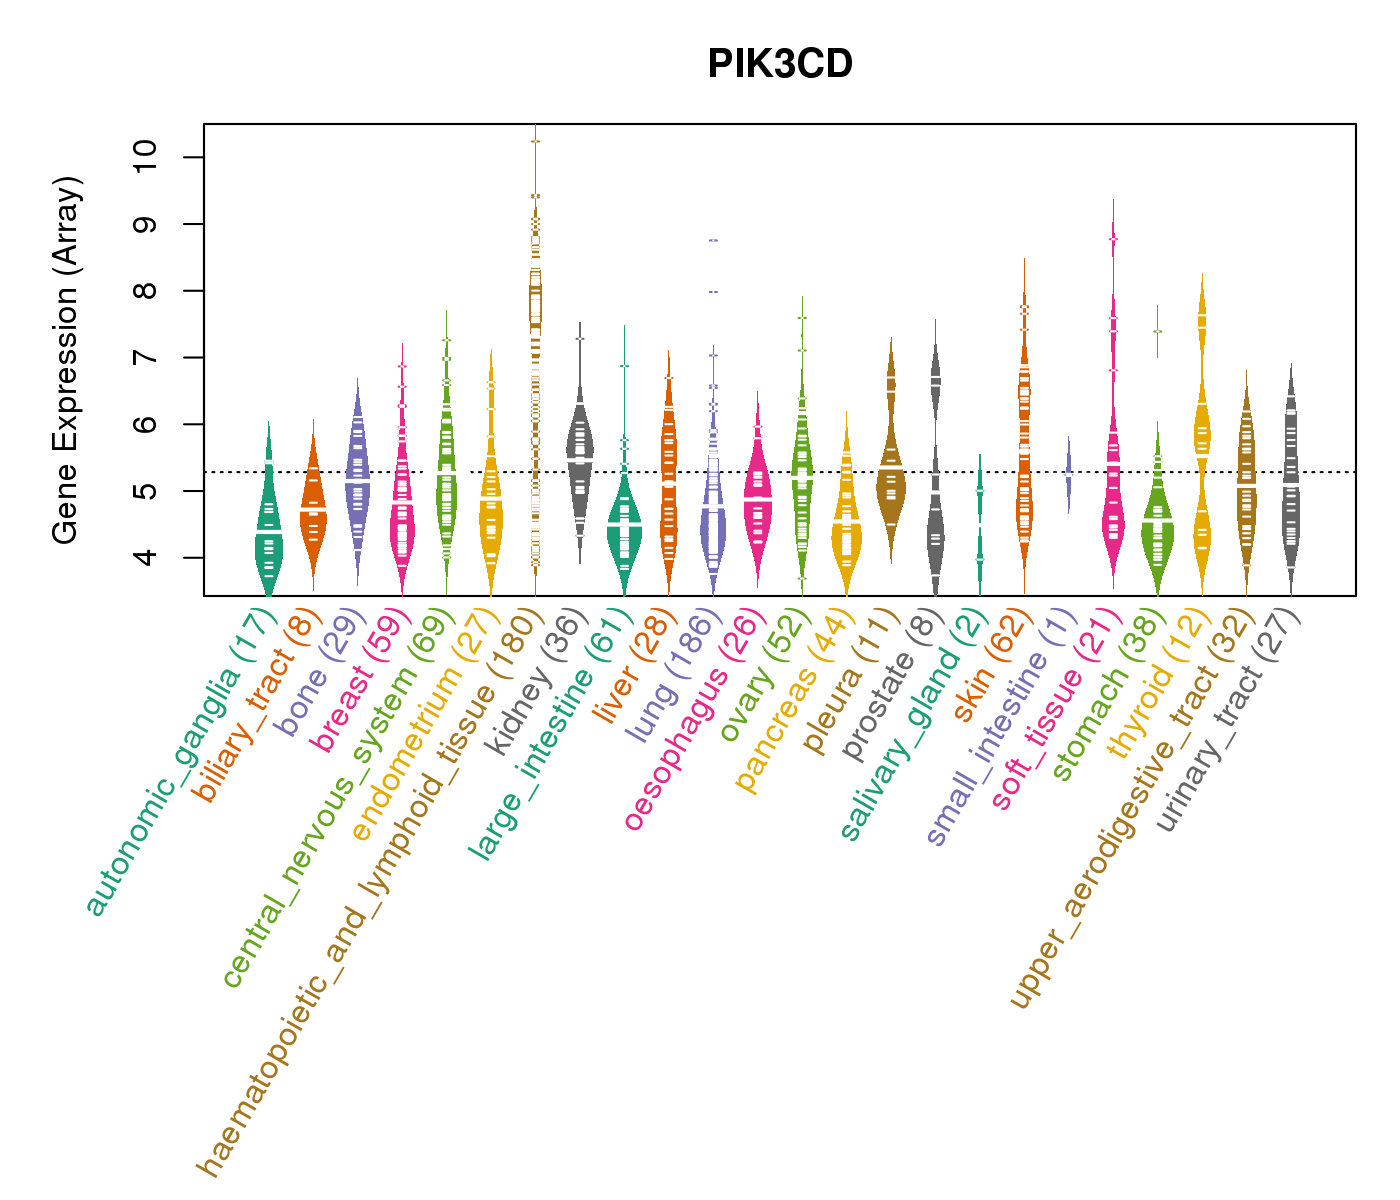
| * CCLE gene expression data were extracted from CCLE_Expression_Entrez_2012-10-18.res: Gene-centric RMA-normalized mRNA expression data. |
 |
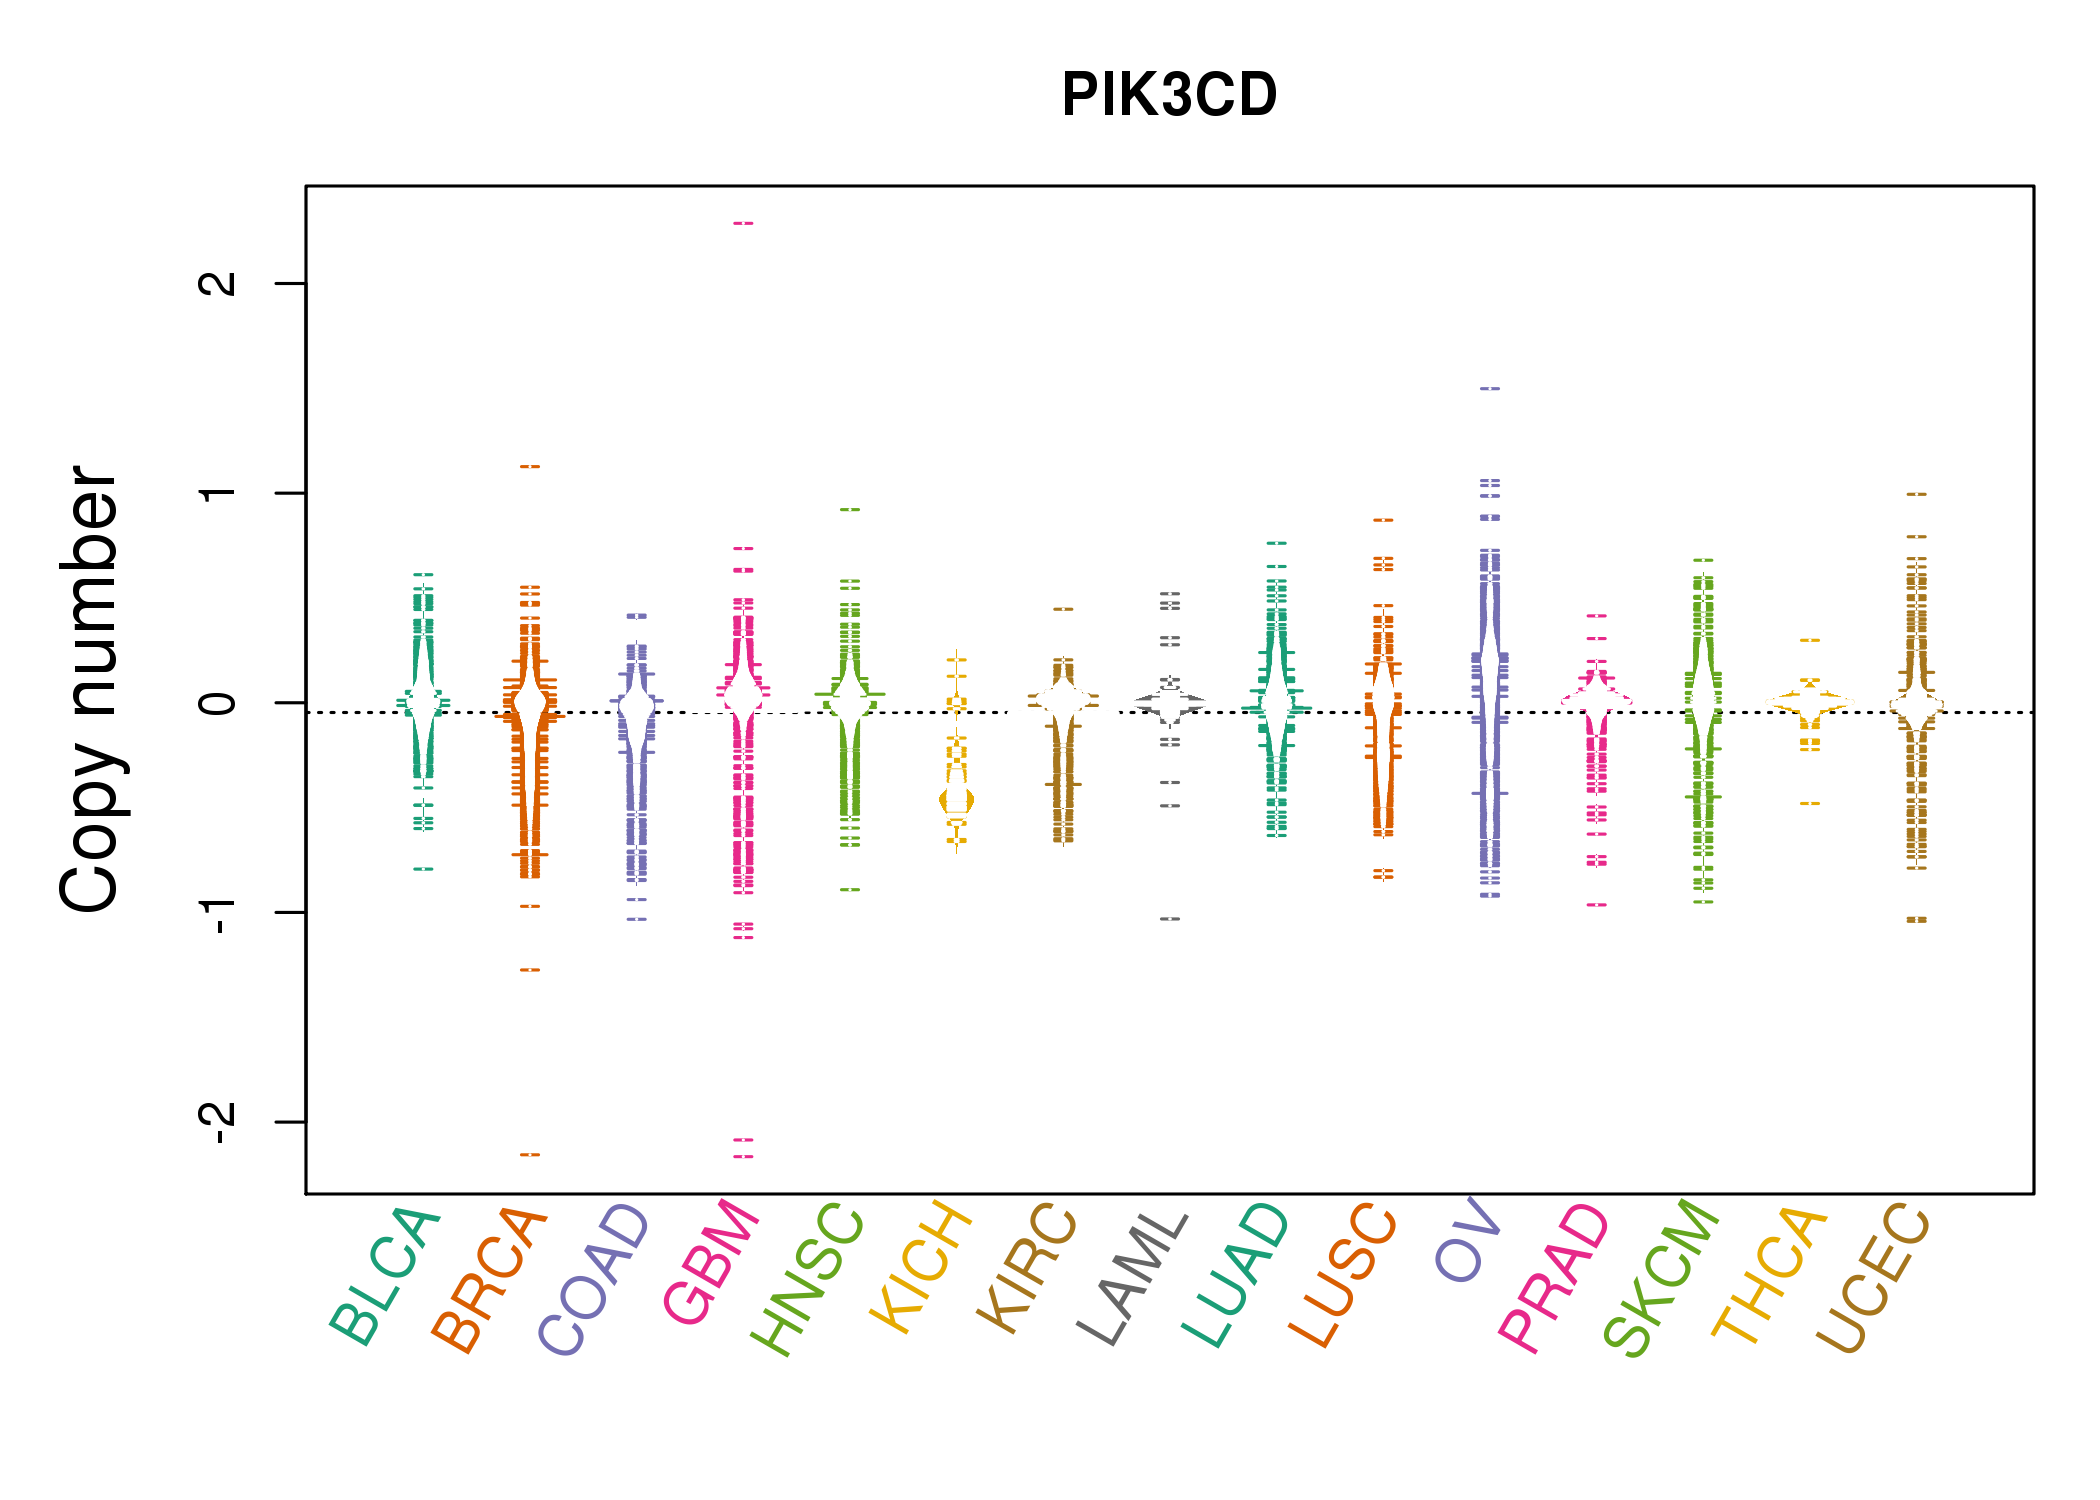
| * Normalized gene expression data of RNASeqV2 was extracted from TCGA using R package TCGA-Assembler. The URLs of all public data files on TCGA DCC data server were gathered at Jan-05-2015. Only eight cancer types have enough normal control samples for differential expression analysis. (t test, adjusted p<0.05 (using Benjamini-Hochberg FDR)) |
 |
| Top |
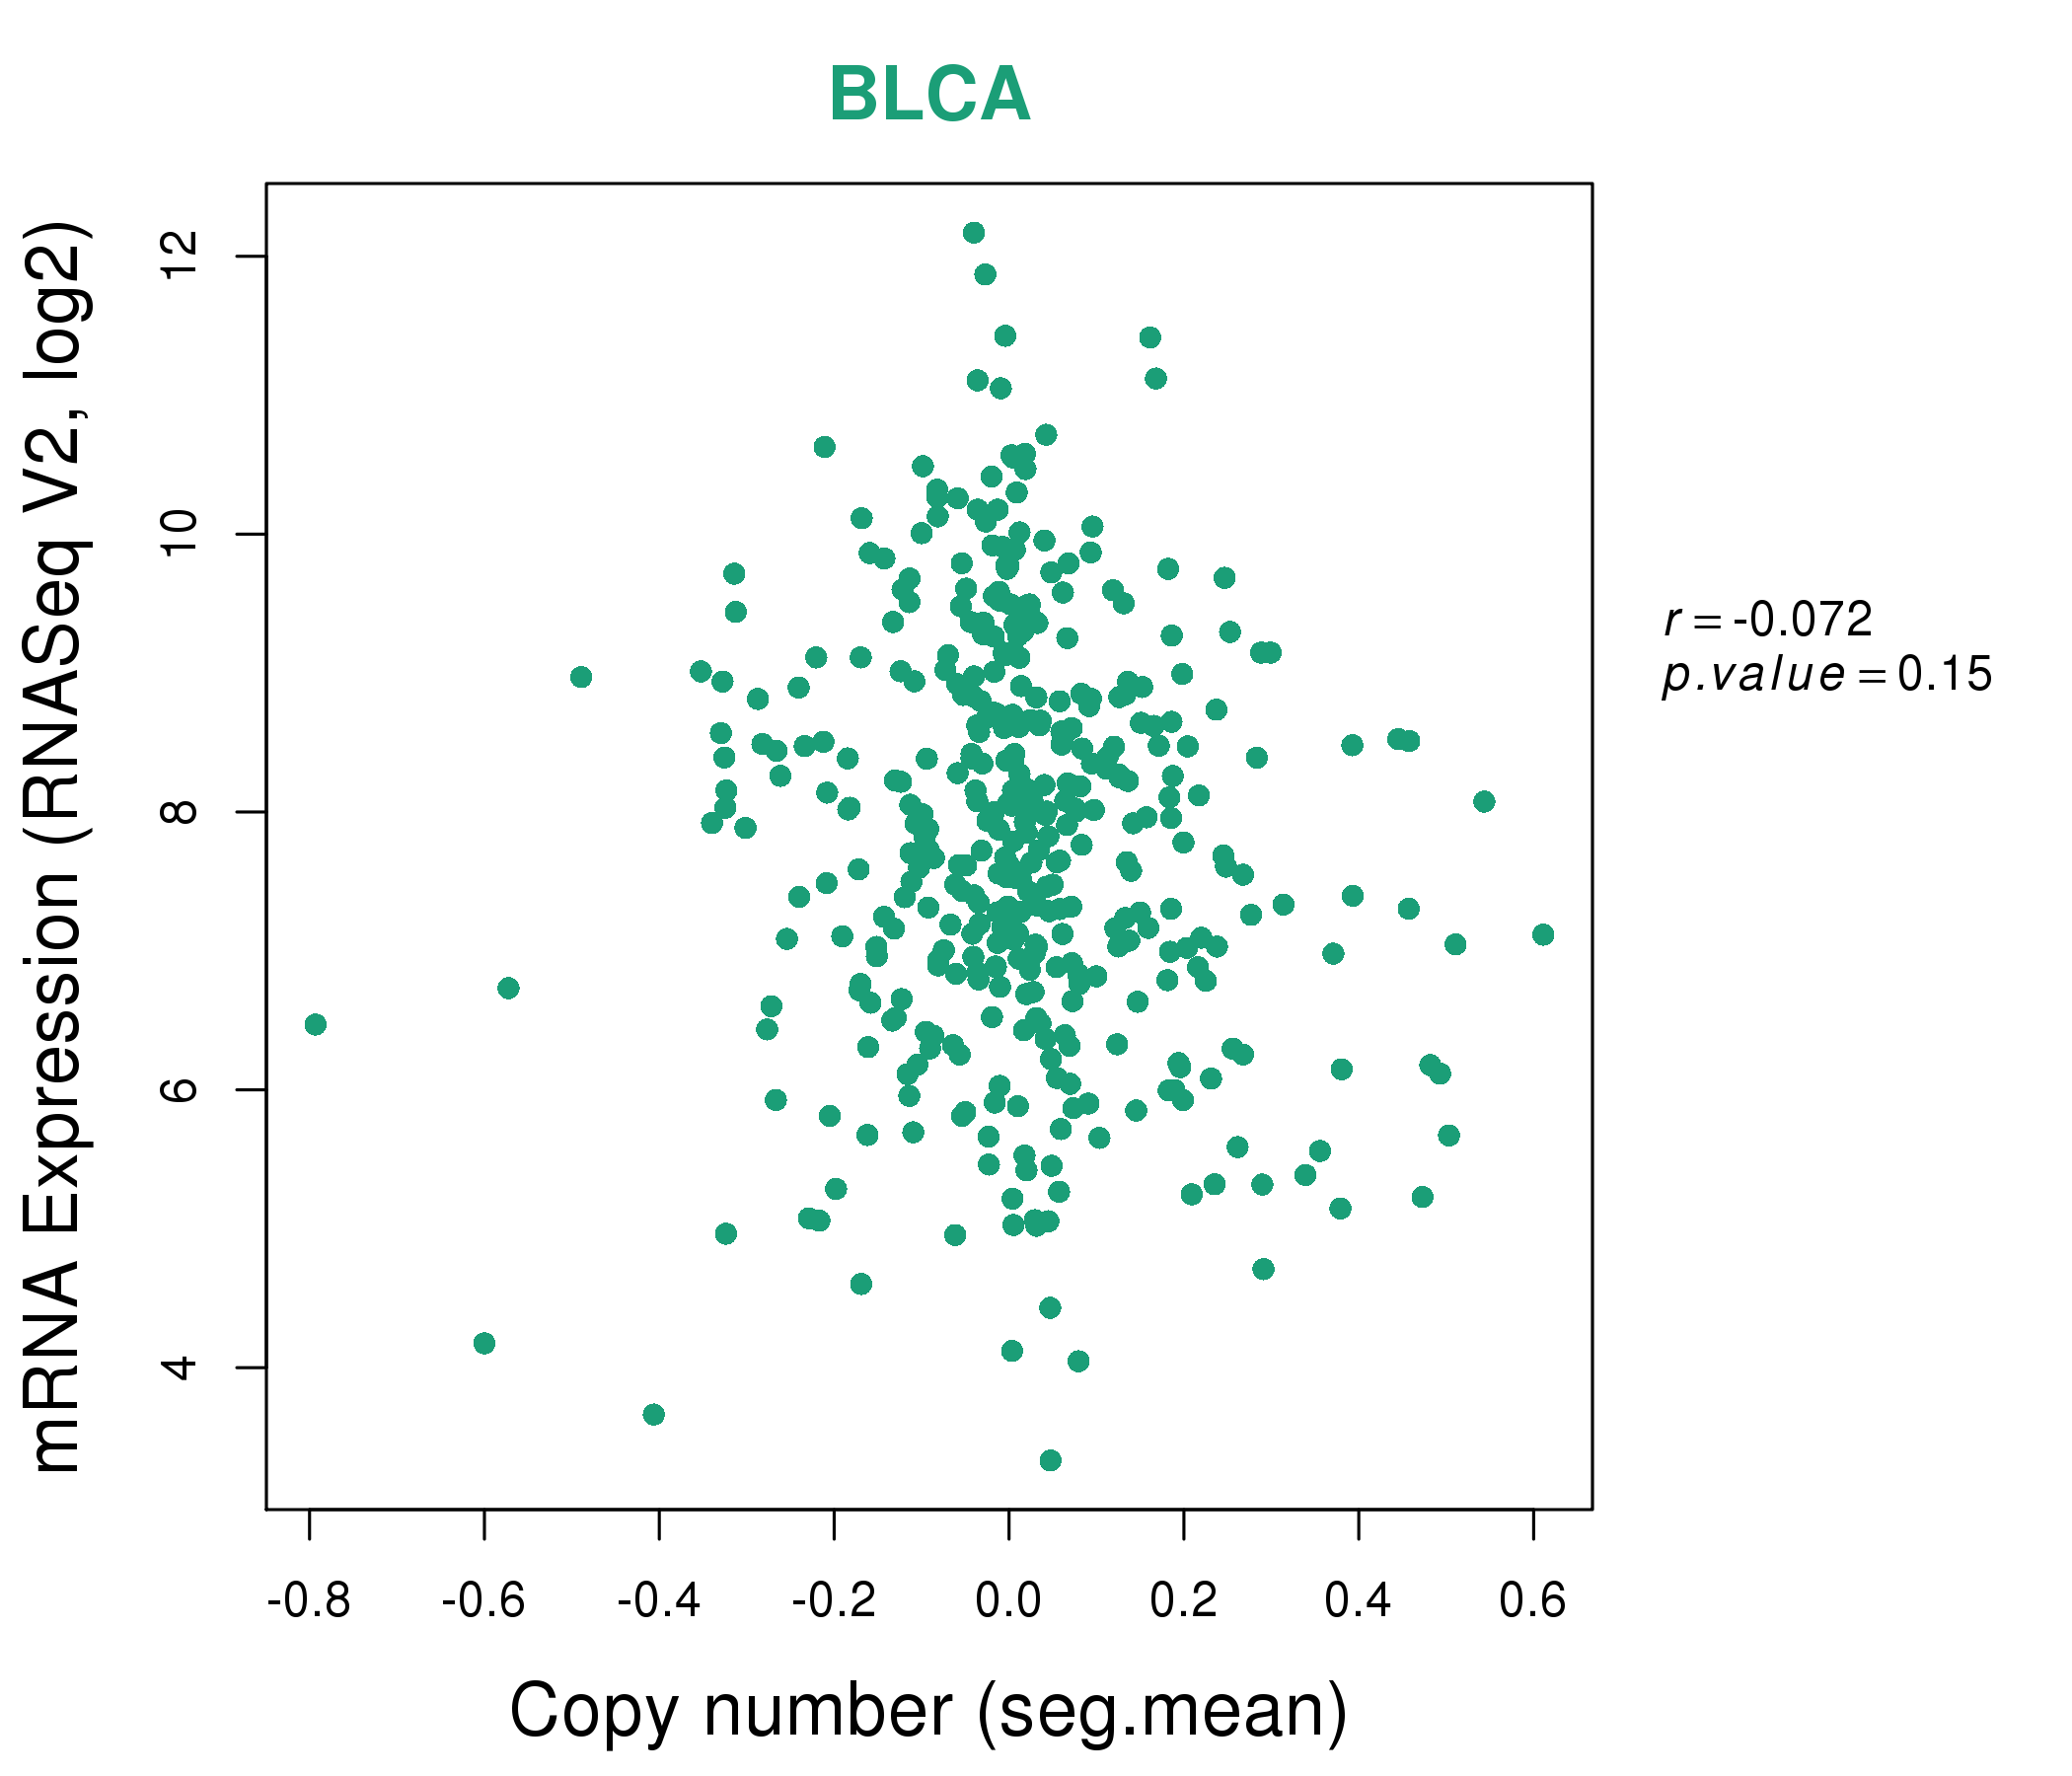
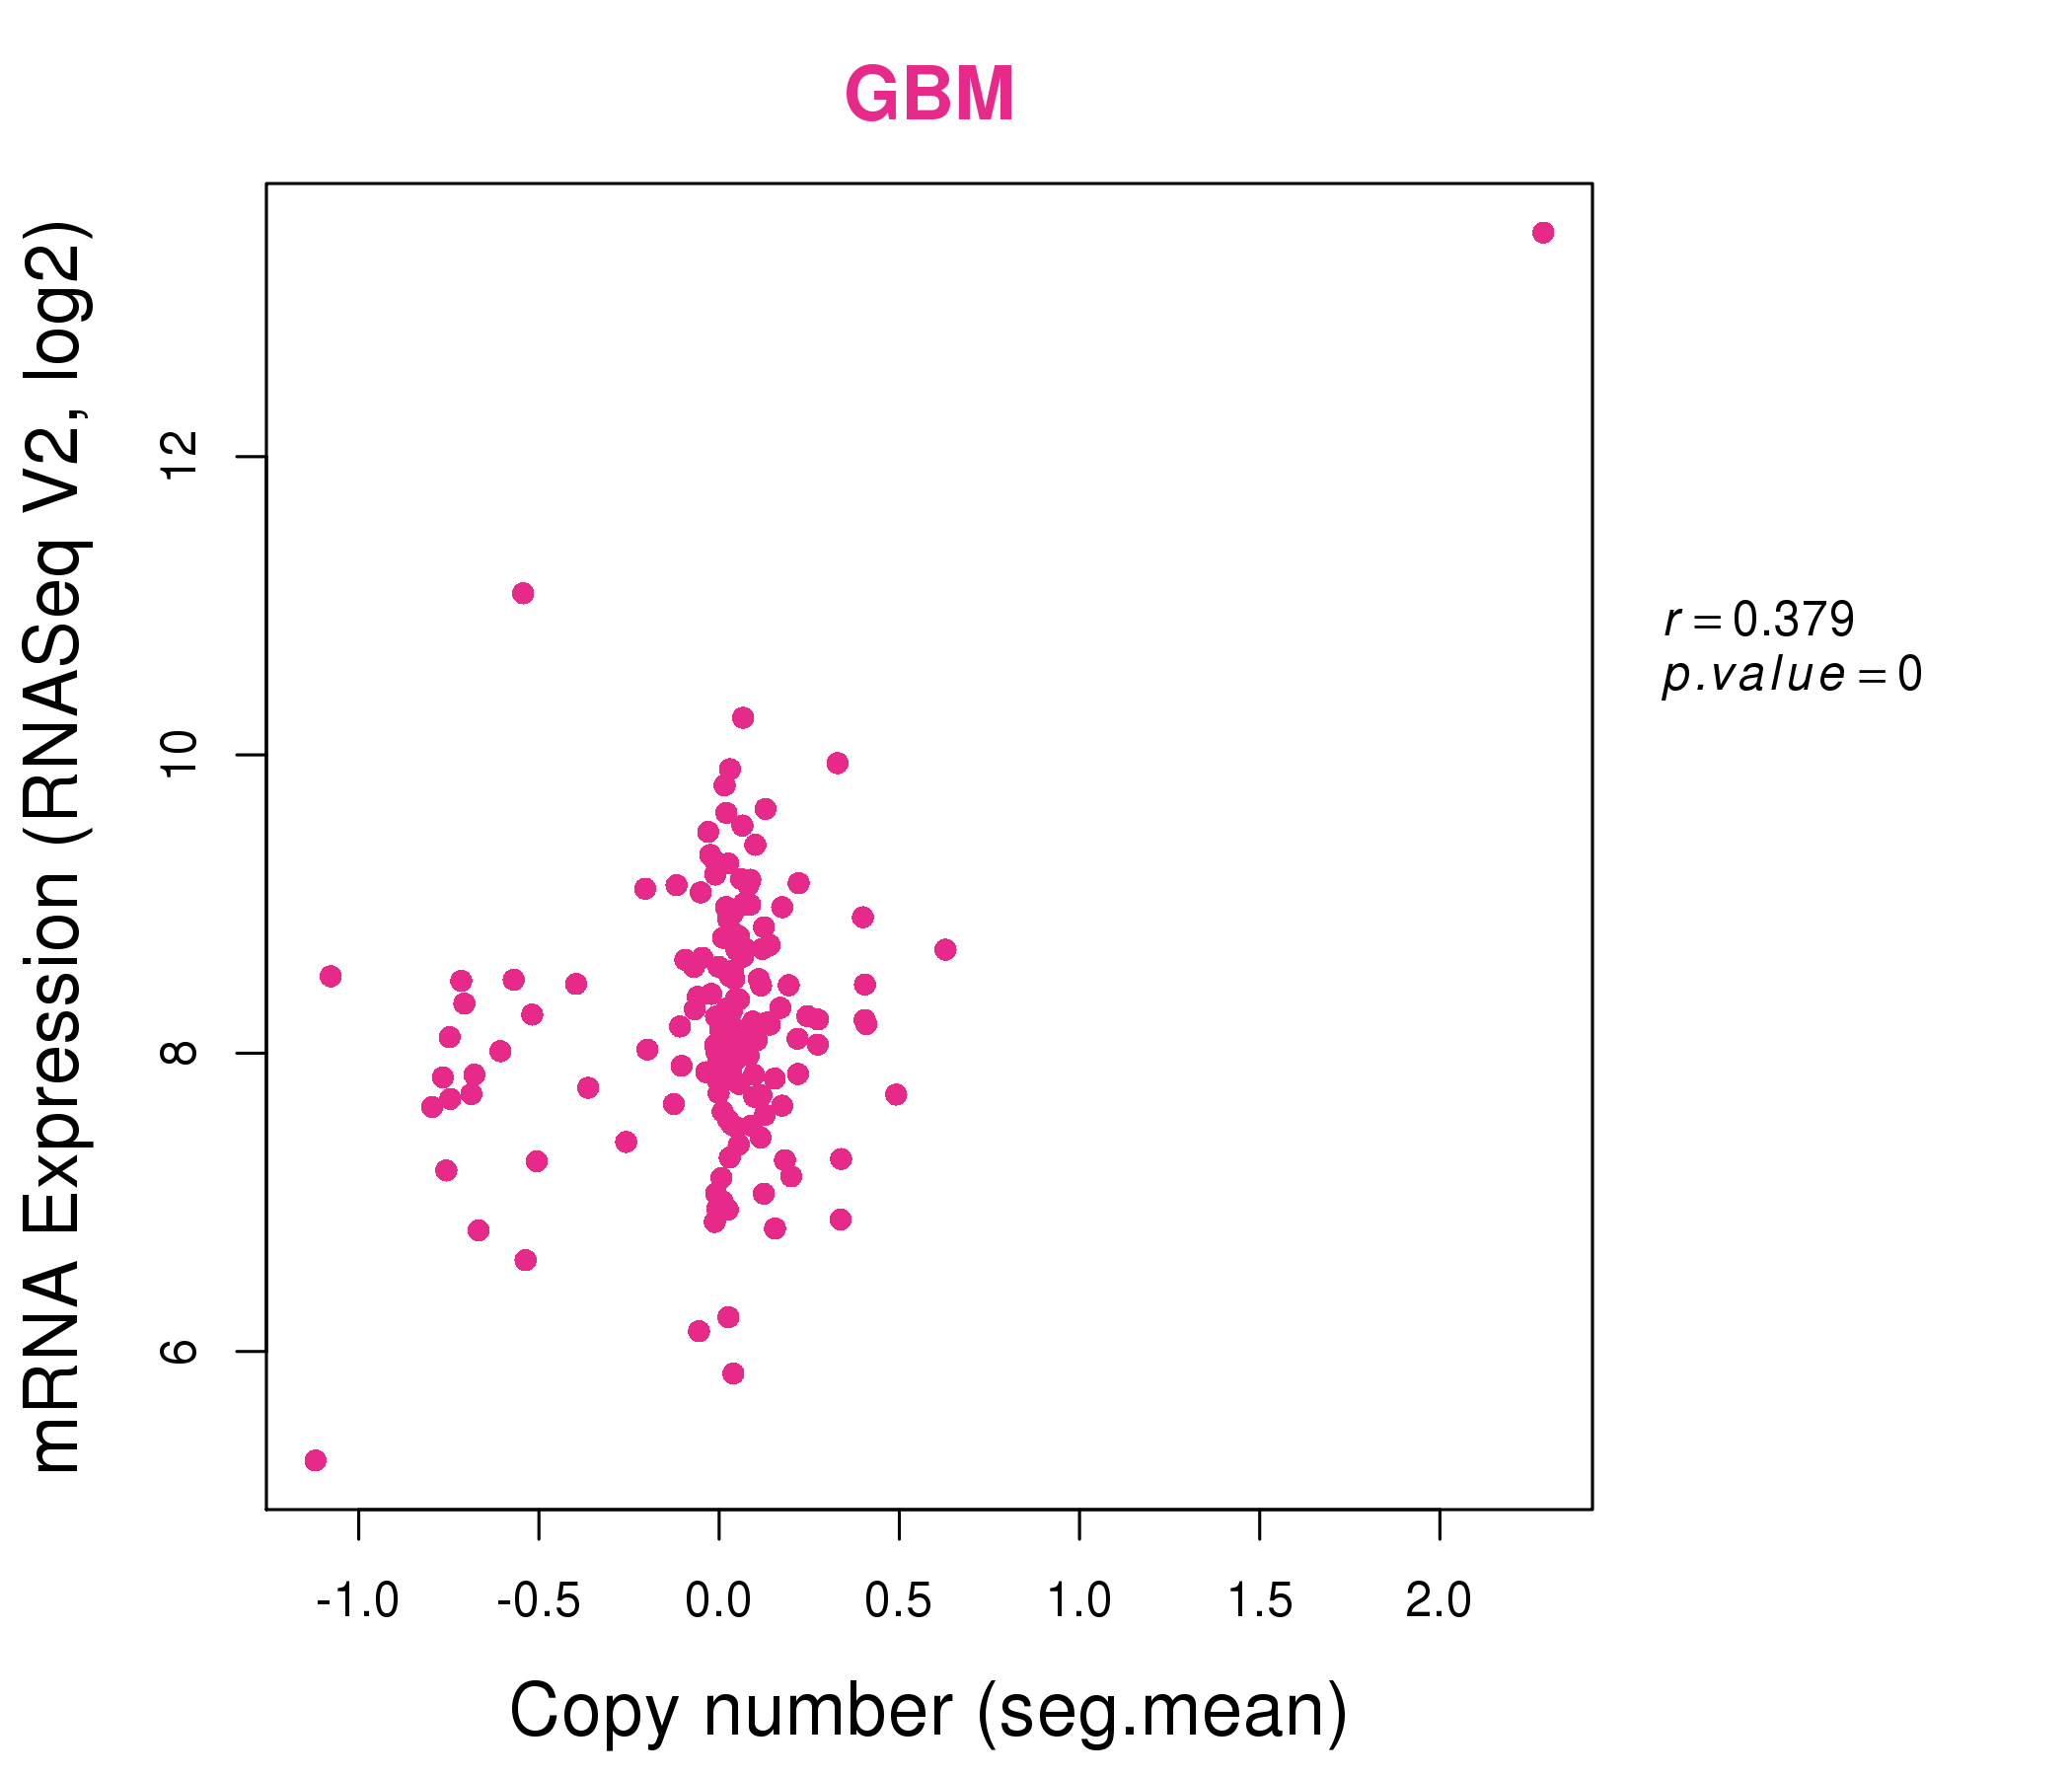
| * This plots show the correlation between CNV and gene expression. |
: Open all plots for all cancer types
 |
|
 |
|

| Top |
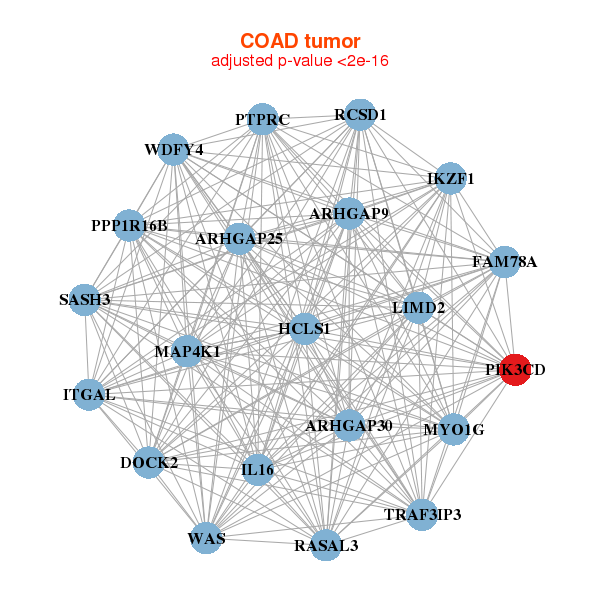
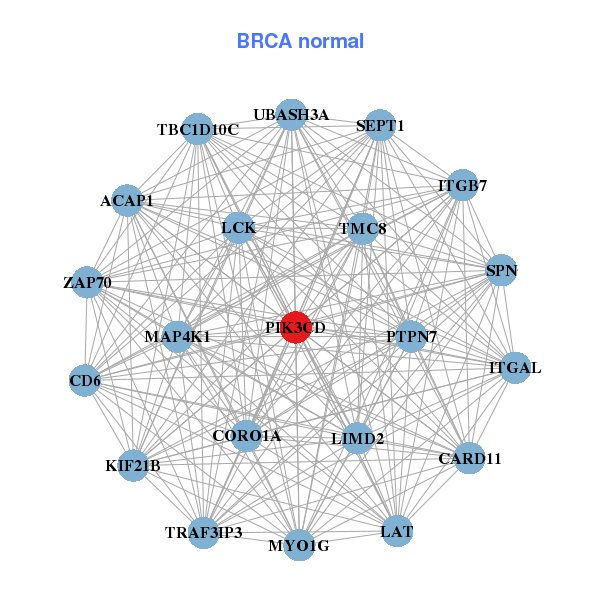
| Gene-Gene Network Information |
| * Co-Expression network figures were drawn using R package igraph. Only the top 20 genes with the highest correlations were shown. Red circle: input gene, orange circle: cell metabolism gene, sky circle: other gene |
: Open all plots for all cancer types
 |
| ||||
| AKNA,ARHGAP25,ARHGAP30,ARHGAP9,CARD11,CD6,FAM78A, FMNL1,IKZF1,IL10RA,JAK3,LCK,MAP4K1,PIK3CD, PTPN7,SASH3,SNX20,TMC8,TRAF1,UBASH3A,WAS | ACAP1,CARD11,CD6,CORO1A,ITGAL,ITGB7,KIF21B, LAT,LCK,LIMD2,MAP4K1,MYO1G,PIK3CD,PTPN7, SEPT1,SPN,TBC1D10C,TMC8,TRAF3IP3,UBASH3A,ZAP70 | ||||
 |
| ||||
| ARHGAP25,ARHGAP30,ARHGAP9,DOCK2,FAM78A,HCLS1,IKZF1, IL16,ITGAL,LIMD2,MAP4K1,MYO1G,PIK3CD,PPP1R16B, PTPRC,RASAL3,RCSD1,SASH3,TRAF3IP3,WAS,WDFY4 | AGAP2,APBB1IP,ARHGAP25,ARHGAP30,CORO1A,DOCK2,FAM78A, GPR18,HVCN1,IKZF1,IL21R,INPP5D,JAK3,LIMD2, ORAI2,PIK3CD,PPP1R16B,RLTPR,TRAF1,WAS,ZNF831 |

| * Co-Expression network figures were drawn using R package igraph. Only the top 20 genes with the highest correlations were shown. Red circle: input gene, orange circle: cell metabolism gene, sky circle: other gene |
: Open all plots for all cancer types
| Top |
: Open all interacting genes' information including KEGG pathway for all interacting genes from DAVID
| Top |
| Pharmacological Information for PIK3CD |
| DB Category | DB Name | DB's ID and Url link |
| * Gene Centered Interaction Network. |
 |
| * Drug Centered Interaction Network. |
| DrugBank ID | Target Name | Drug Groups | Generic Name | Drug Centered Network | Drug Structure |
| DB06831 | phosphatidylinositol-4,5-bisphosphate 3-kinase, catalytic subunit delta | experimental | 2-((9H-PURIN-6-YLTHIO)METHYL)-5-CHLORO-3-(2-METHOXYPHENYL)QUINAZOLIN-4(3H)-ONE | 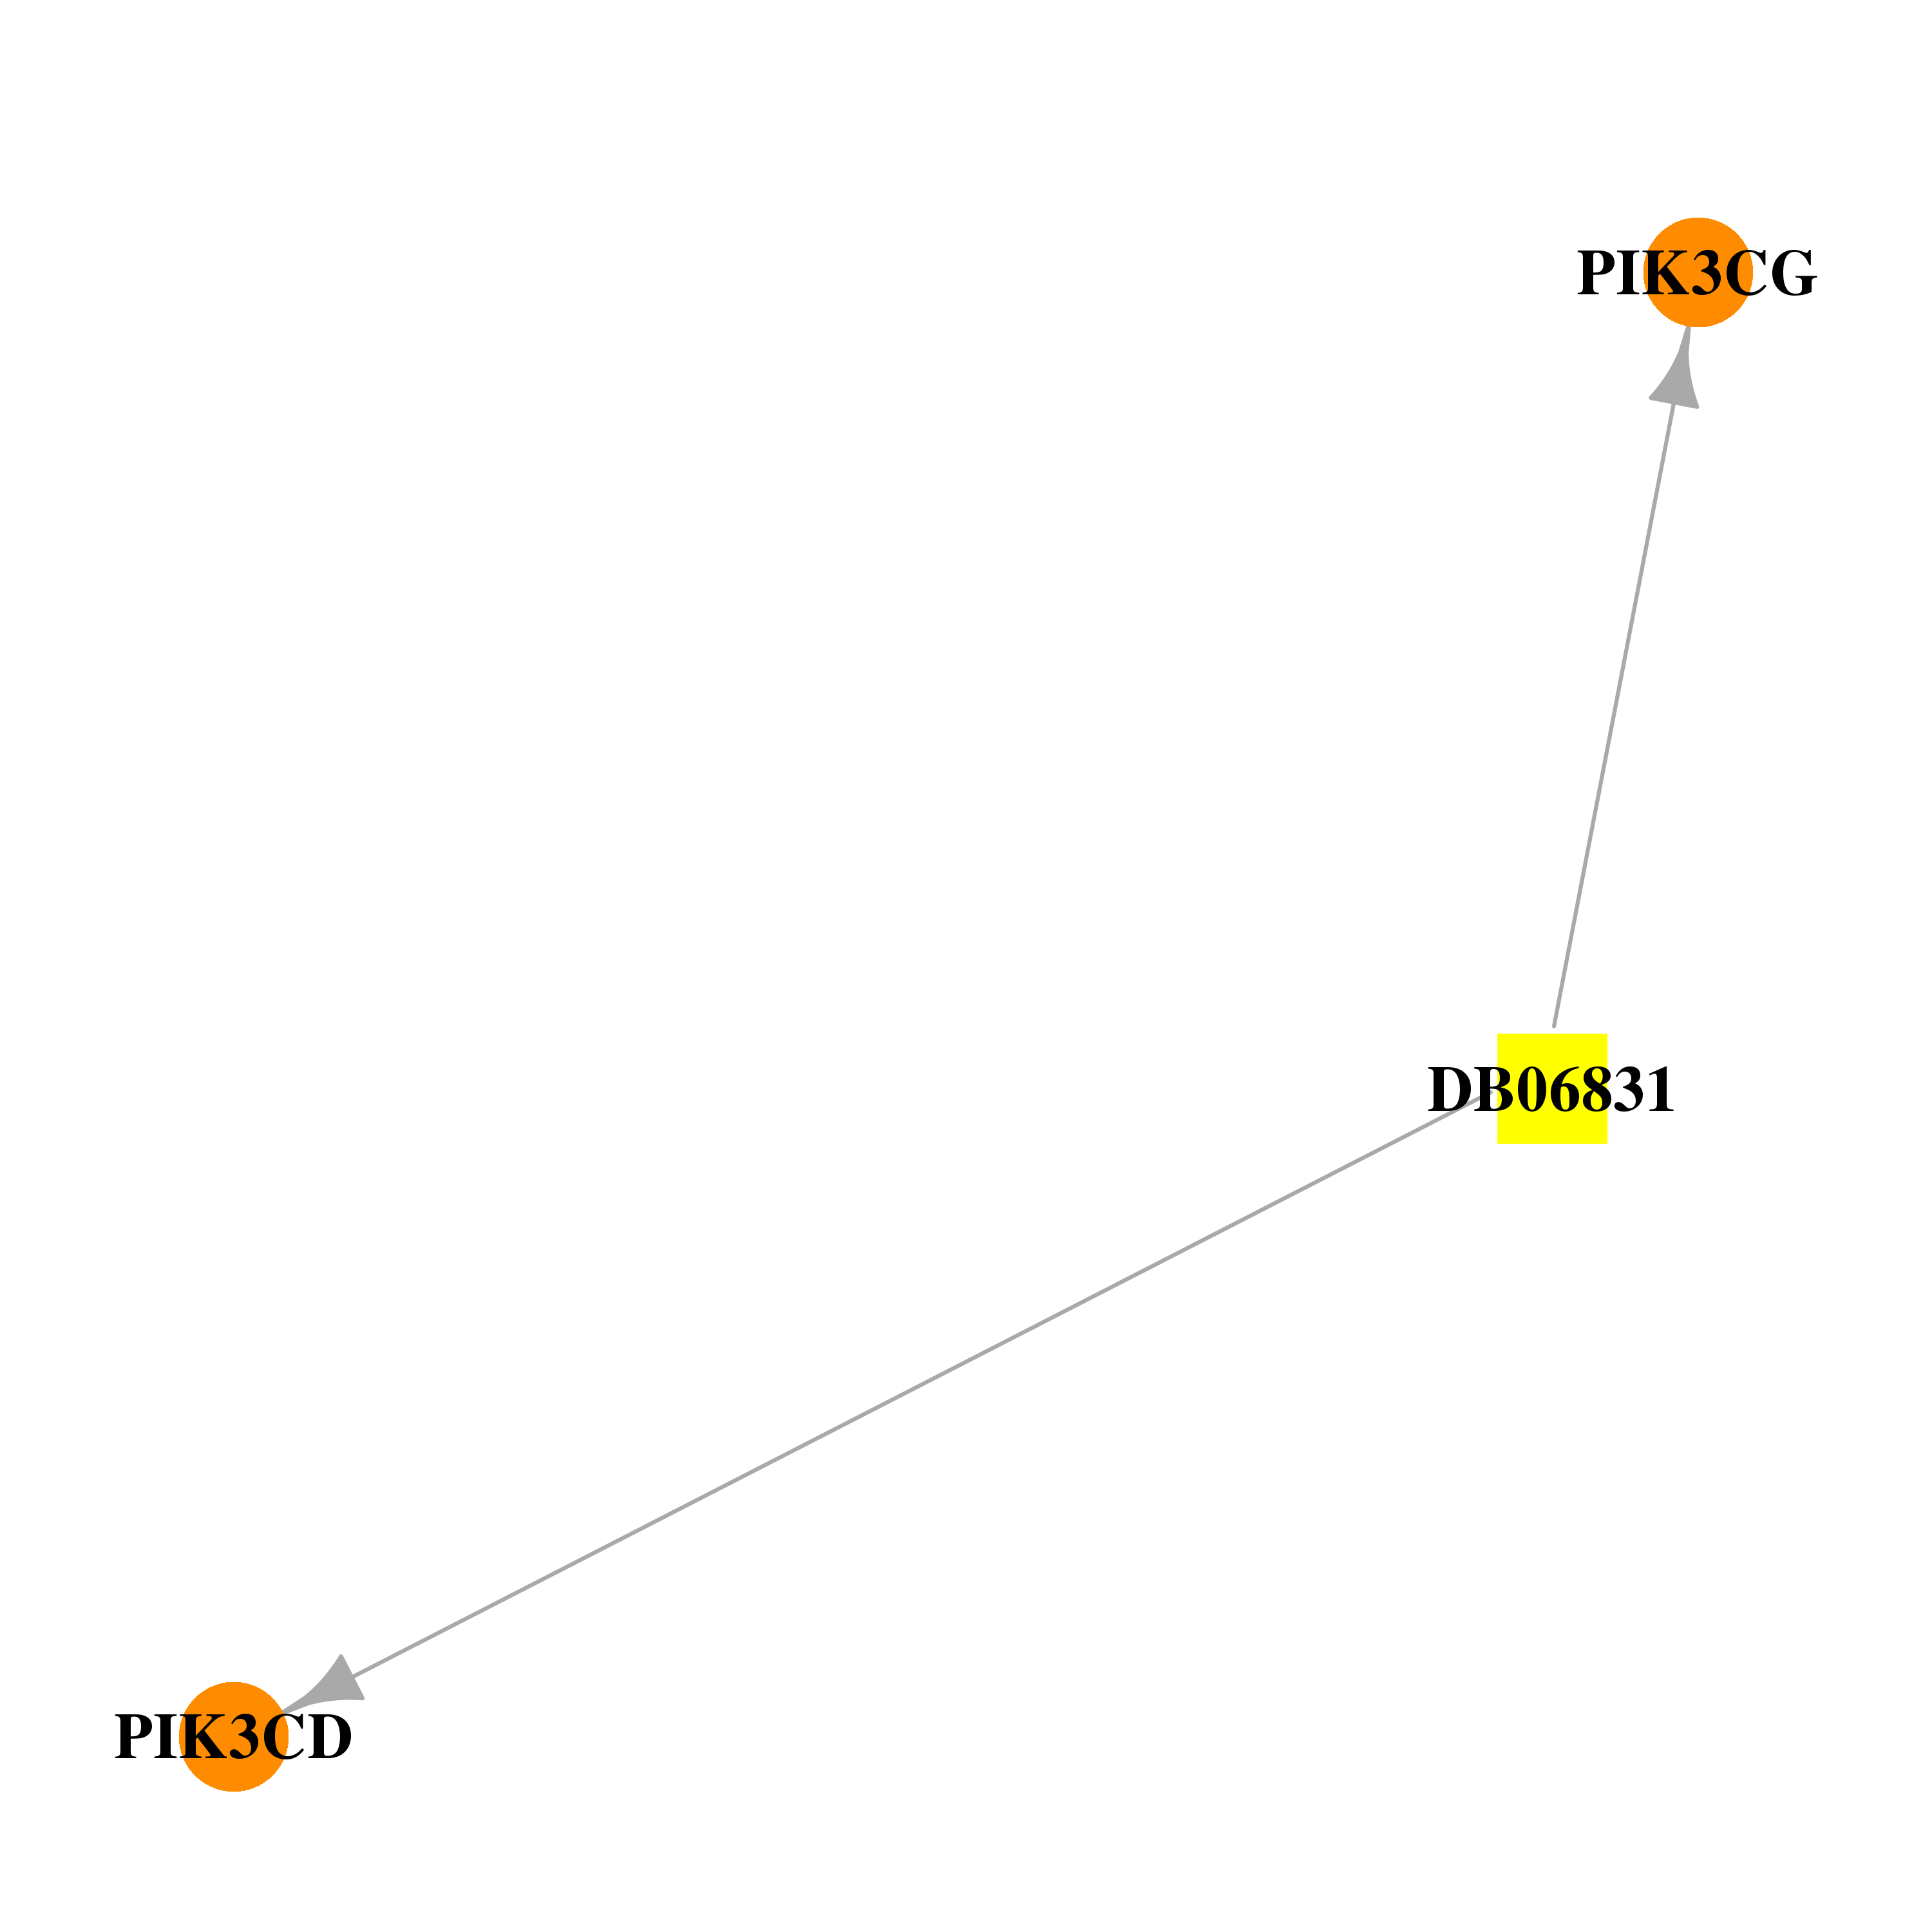 | 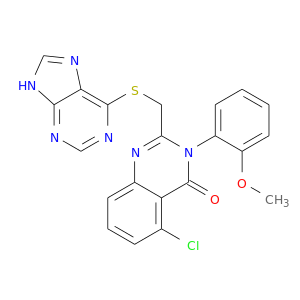 |
| Top |
| Cross referenced IDs for PIK3CD |
| * We obtained these cross-references from Uniprot database. It covers 150 different DBs, 18 categories. http://www.uniprot.org/help/cross_references_section |
: Open all cross reference information
|
Copyright © 2016-Present - The Univsersity of Texas Health Science Center at Houston @ |