|
|||||||||||||||||||||||||||||||||||||||||||||||||||||||||||||||||||||||||||||||||||||||||||||||||||||||||||||||||||||||||||||||||||||||||||||||||||||||||||||||||||||||||||||||||||||||||||||||||||||||||||||||||||||||||||||||||||||||||||||||||||||||||||||||||||||||||||||||||||||||||||||||||||||||||||||||||||||||||||||||||||||||||||||||||||
| |
| Phenotypic Information (metabolism pathway, cancer, disease, phenome) |
| |
| |
| Gene-Gene Network Information: Co-Expression Network, Interacting Genes & KEGG |
| |
|


| Gene Summary for PIK3R2 |
| Basic gene info. | Gene symbol | PIK3R2 |
| Gene name | phosphoinositide-3-kinase, regulatory subunit 2 (beta) | |
| Synonyms | MPPH|MPPH1|P85B|p85|p85-BETA | |
| Cytomap | UCSC genome browser: 19q13.2-q13.4 | |
| Genomic location | chr19 :18264015-18281343 | |
| Type of gene | protein-coding | |
| RefGenes | NM_005027.3, NR_073517.1, | |
| Ensembl id | ENSG00000105647 | |
| Description | PI3-kinase subunit p85-betaPI3K regulatory subunit betaphosphatidylinositol 3-kinase 85 kDa regulatory subunit betaphosphatidylinositol 3-kinase regulatory subunit betaphosphatidylinositol 3-kinase, regulatory subunit, polypeptide 2 (p85 beta)ptdIns- | |
| Modification date | 20141207 | |
| dbXrefs | MIM : 603157 | |
| HGNC : HGNC | ||
| Ensembl : ENSG00000105647 | ||
| HPRD : 04404 | ||
| Vega : OTTHUMG00000183383 | ||
| Protein | UniProt: O00459 go to UniProt's Cross Reference DB Table | |
| Expression | CleanEX: HS_PIK3R2 | |
| BioGPS: 5296 | ||
| Gene Expression Atlas: ENSG00000105647 | ||
| The Human Protein Atlas: ENSG00000105647 | ||
| Pathway | NCI Pathway Interaction Database: PIK3R2 | |
| KEGG: PIK3R2 | ||
| REACTOME: PIK3R2 | ||
| ConsensusPathDB | ||
| Pathway Commons: PIK3R2 | ||
| Metabolism | MetaCyc: PIK3R2 | |
| HUMANCyc: PIK3R2 | ||
| Regulation | Ensembl's Regulation: ENSG00000105647 | |
| miRBase: chr19 :18,264,015-18,281,343 | ||
| TargetScan: NM_005027 | ||
| cisRED: ENSG00000105647 | ||
| Context | iHOP: PIK3R2 | |
| cancer metabolism search in PubMed: PIK3R2 | ||
| UCL Cancer Institute: PIK3R2 | ||
| Assigned class in ccmGDB | B - This gene belongs to cancer gene. | |
| Top |
| Phenotypic Information for PIK3R2(metabolism pathway, cancer, disease, phenome) |
| Cancer | CGAP: PIK3R2 |
| Familial Cancer Database: PIK3R2 | |
| * This gene is included in those cancer gene databases. |
|
|
|
|
|
| . | |||||||||||||||||||||||||||||||||||||||||||||||||||||||||||||||||||||||||||||||||||||||||||||||||||||||||||||||||||||||||||||||||||||||||||||||||||||||||||||||||||||||||||||||||||||||||||||||||||||||||||||||||||||||||||||||||||||||||||||||||||||||||||||||||||||||||||||||||||||||||||||||||||||||||||||||||||||||||||||||||||||||||||||
Oncogene 1 | Significant driver gene in | ||||||||||||||||||||||||||||||||||||||||||||||||||||||||||||||||||||||||||||||||||||||||||||||||||||||||||||||||||||||||||||||||||||||||||||||||||||||||||||||||||||||||||||||||||||||||||||||||||||||||||||||||||||||||||||||||||||||||||||||||||||||||||||||||||||||||||||||||||||||||||||||||||||||||||||||||||||||||||||||||||||||||||||||||||
| cf) number; DB name 1 Oncogene; http://nar.oxfordjournals.org/content/35/suppl_1/D721.long, 2 Tumor Suppressor gene; https://bioinfo.uth.edu/TSGene/, 3 Cancer Gene Census; http://www.nature.com/nrc/journal/v4/n3/abs/nrc1299.html, 4 CancerGenes; http://nar.oxfordjournals.org/content/35/suppl_1/D721.long, 5 Network of Cancer Gene; http://ncg.kcl.ac.uk/index.php, 1Therapeutic Vulnerabilities in Cancer; http://cbio.mskcc.org/cancergenomics/statius/ |
| KEGG_FC_GAMMA_R_MEDIATED_PHAGOCYTOSIS REACTOME_PHOSPHOLIPID_METABOLISM REACTOME_PI_METABOLISM REACTOME_METABOLISM_OF_LIPIDS_AND_LIPOPROTEINS | |
| OMIM | 603157; gene. 603387; phenotype. |
| Orphanet | 83473; Megalencephaly - polymicrogyria - postaxial polydactyly - hydrocephalus. |
| Disease | KEGG Disease: PIK3R2 |
| MedGen: PIK3R2 (Human Medical Genetics with Condition) | |
| ClinVar: PIK3R2 | |
| Phenotype | MGI: PIK3R2 (International Mouse Phenotyping Consortium) |
| PhenomicDB: PIK3R2 | |
| Mutations for PIK3R2 |
| * Under tables are showing count per each tissue to give us broad intuition about tissue specific mutation patterns.You can go to the detailed page for each mutation database's web site. |
| There's no structural variation information in COSMIC data for this gene. |
| * From mRNA Sanger sequences, Chitars2.0 arranged chimeric transcripts. This table shows PIK3R2 related fusion information. |
| ID | Head Gene | Tail Gene | Accession | Gene_a | qStart_a | qEnd_a | Chromosome_a | tStart_a | tEnd_a | Gene_a | qStart_a | qEnd_a | Chromosome_a | tStart_a | tEnd_a |
| AA496625 | PIK3R2 | 10 | 90 | 19 | 18288845 | 18288925 | SETX | 84 | 320 | 9 | 135150689 | 135153481 | |
| BG314628 | PIK3R2 | 1 | 208 | 19 | 18286174 | 18288526 | PIK3R2 | 206 | 435 | 19 | 18284631 | 18285931 | |
| BG545738 | PIK3R2 | 3 | 156 | 19 | 18279228 | 18279560 | ARIH1 | 144 | 745 | 15 | 72877991 | 72878594 | |
| BP385893 | PIK3R2 | 1 | 220 | 19 | 18284637 | 18285922 | CRYBA2 | 220 | 496 | 2 | 219854912 | 219855640 | |
| BF897883 | PIK3R2 | 9 | 301 | 19 | 18284680 | 18287982 | PIK3R2 | 299 | 452 | 19 | 18288001 | 18288572 | |
| Top |
| Mutation type/ Tissue ID | brca | cns | cerv | endome | haematopo | kidn | Lintest | liver | lung | ns | ovary | pancre | prost | skin | stoma | thyro | urina | |||
| Total # sample | 1 | |||||||||||||||||||
| GAIN (# sample) | 1 | |||||||||||||||||||
| LOSS (# sample) |
| cf) Tissue ID; Tissue type (1; Breast, 2; Central_nervous_system, 3; Cervix, 4; Endometrium, 5; Haematopoietic_and_lymphoid_tissue, 6; Kidney, 7; Large_intestine, 8; Liver, 9; Lung, 10; NS, 11; Ovary, 12; Pancreas, 13; Prostate, 14; Skin, 15; Stomach, 16; Thyroid, 17; Urinary_tract) |
| Top |
|
 |
| Top |
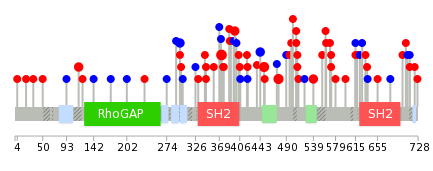
| Stat. for Non-Synonymous SNVs (# total SNVs=43) | (# total SNVs=19) |
 |  |
(# total SNVs=3) | (# total SNVs=2) |
 |  |
| Top |
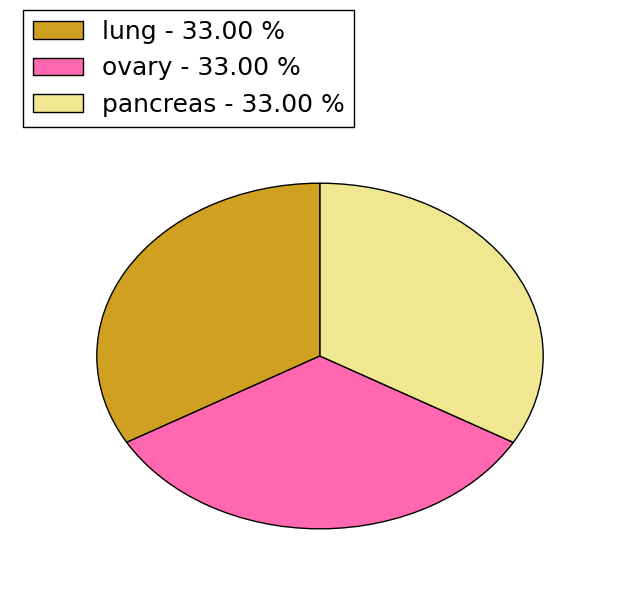
| * When you move the cursor on each content, you can see more deailed mutation information on the Tooltip. Those are primary_site,primary_histology,mutation(aa),pubmedID. |
| GRCh37 position | Mutation(aa) | Unique sampleID count |
| chr19:18273784-18273784 | p.G373R | 4 |
| chr19:18274130-18274130 | p.H450Y | 3 |
| chr19:18276981-18276981 | p.M476I | 3 |
| chr19:18277996-18277996 | p.R539H | 2 |
| chr19:18271301-18271301 | p.P115S | 2 |
| chr19:18272854-18272854 | p.A298A | 2 |
| chr19:18274111-18274111 | p.G443G | 2 |
| chr19:18273857-18273857 | p.S397F | 2 |
| chr19:18266787-18266787 | p.V33A | 1 |
| chr19:18273786-18273786 | p.N374fs*4 | 1 |
| Top |
|
 |
| Point Mutation/ Tissue ID | 1 | 2 | 3 | 4 | 5 | 6 | 7 | 8 | 9 | 10 | 11 | 12 | 13 | 14 | 15 | 16 | 17 | 18 | 19 | 20 |
| # sample | 2 | 3 | 2 | 3 | 2 | 2 | 5 | 6 | 2 | 1 | 6 | 9 | 11 | |||||||
| # mutation | 2 | 2 | 2 | 3 | 2 | 2 | 5 | 6 | 2 | 1 | 7 | 10 | 11 | |||||||
| nonsynonymous SNV | 1 | 1 | 2 | 3 | 2 | 1 | 2 | 4 | 1 | 1 | 4 | 8 | 6 | |||||||
| synonymous SNV | 1 | 1 | 1 | 3 | 2 | 1 | 3 | 2 | 5 |
| cf) Tissue ID; Tissue type (1; BLCA[Bladder Urothelial Carcinoma], 2; BRCA[Breast invasive carcinoma], 3; CESC[Cervical squamous cell carcinoma and endocervical adenocarcinoma], 4; COAD[Colon adenocarcinoma], 5; GBM[Glioblastoma multiforme], 6; Glioma Low Grade, 7; HNSC[Head and Neck squamous cell carcinoma], 8; KICH[Kidney Chromophobe], 9; KIRC[Kidney renal clear cell carcinoma], 10; KIRP[Kidney renal papillary cell carcinoma], 11; LAML[Acute Myeloid Leukemia], 12; LUAD[Lung adenocarcinoma], 13; LUSC[Lung squamous cell carcinoma], 14; OV[Ovarian serous cystadenocarcinoma ], 15; PAAD[Pancreatic adenocarcinoma], 16; PRAD[Prostate adenocarcinoma], 17; SKCM[Skin Cutaneous Melanoma], 18:STAD[Stomach adenocarcinoma], 19:THCA[Thyroid carcinoma], 20:UCEC[Uterine Corpus Endometrial Carcinoma]) |
| Top |
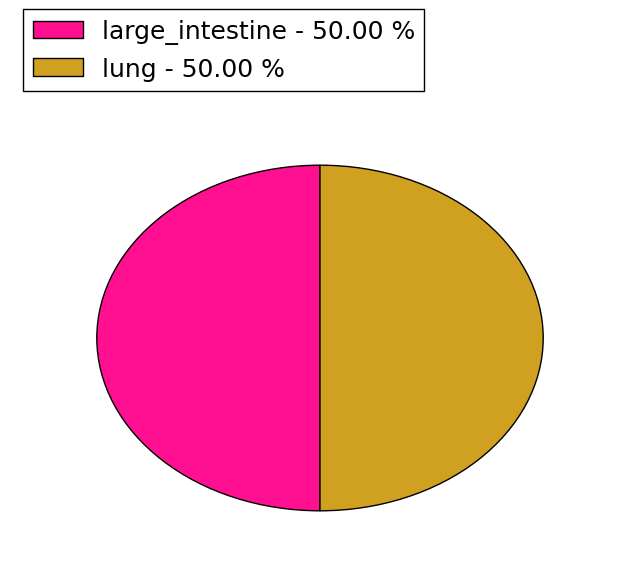
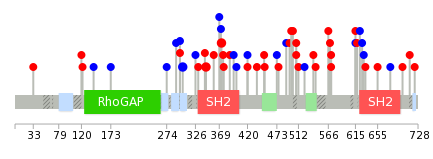
| * We represented just top 10 SNVs. When you move the cursor on each content, you can see more deailed mutation information on the Tooltip. Those are primary_site, primary_histology, mutation(aa), pubmedID. |
| Genomic Position | Mutation(aa) | Unique sampleID count |
| chr19:18273240 | p.P303P | 2 |
| chr19:18273784 | p.R345W | 2 |
| chr19:18273019 | p.G373R | 2 |
| chr19:18271322 | p.A298A | 1 |
| chr19:18277075 | p.R420R | 1 |
| chr19:18279572 | p.D566Y | 1 |
| chr19:18273927 | p.D437N | 1 |
| chr19:18271739 | p.Q569K | 1 |
| chr19:18277076 | p.Q326Q | 1 |
| chr19:18273284 | p.H450Y | 1 |
| * Copy number data were extracted from TCGA using R package TCGA-Assembler. The URLs of all public data files on TCGA DCC data server were gathered on Jan-05-2015. Function ProcessCNAData in TCGA-Assembler package was used to obtain gene-level copy number value which is calculated as the average copy number of the genomic region of a gene. |
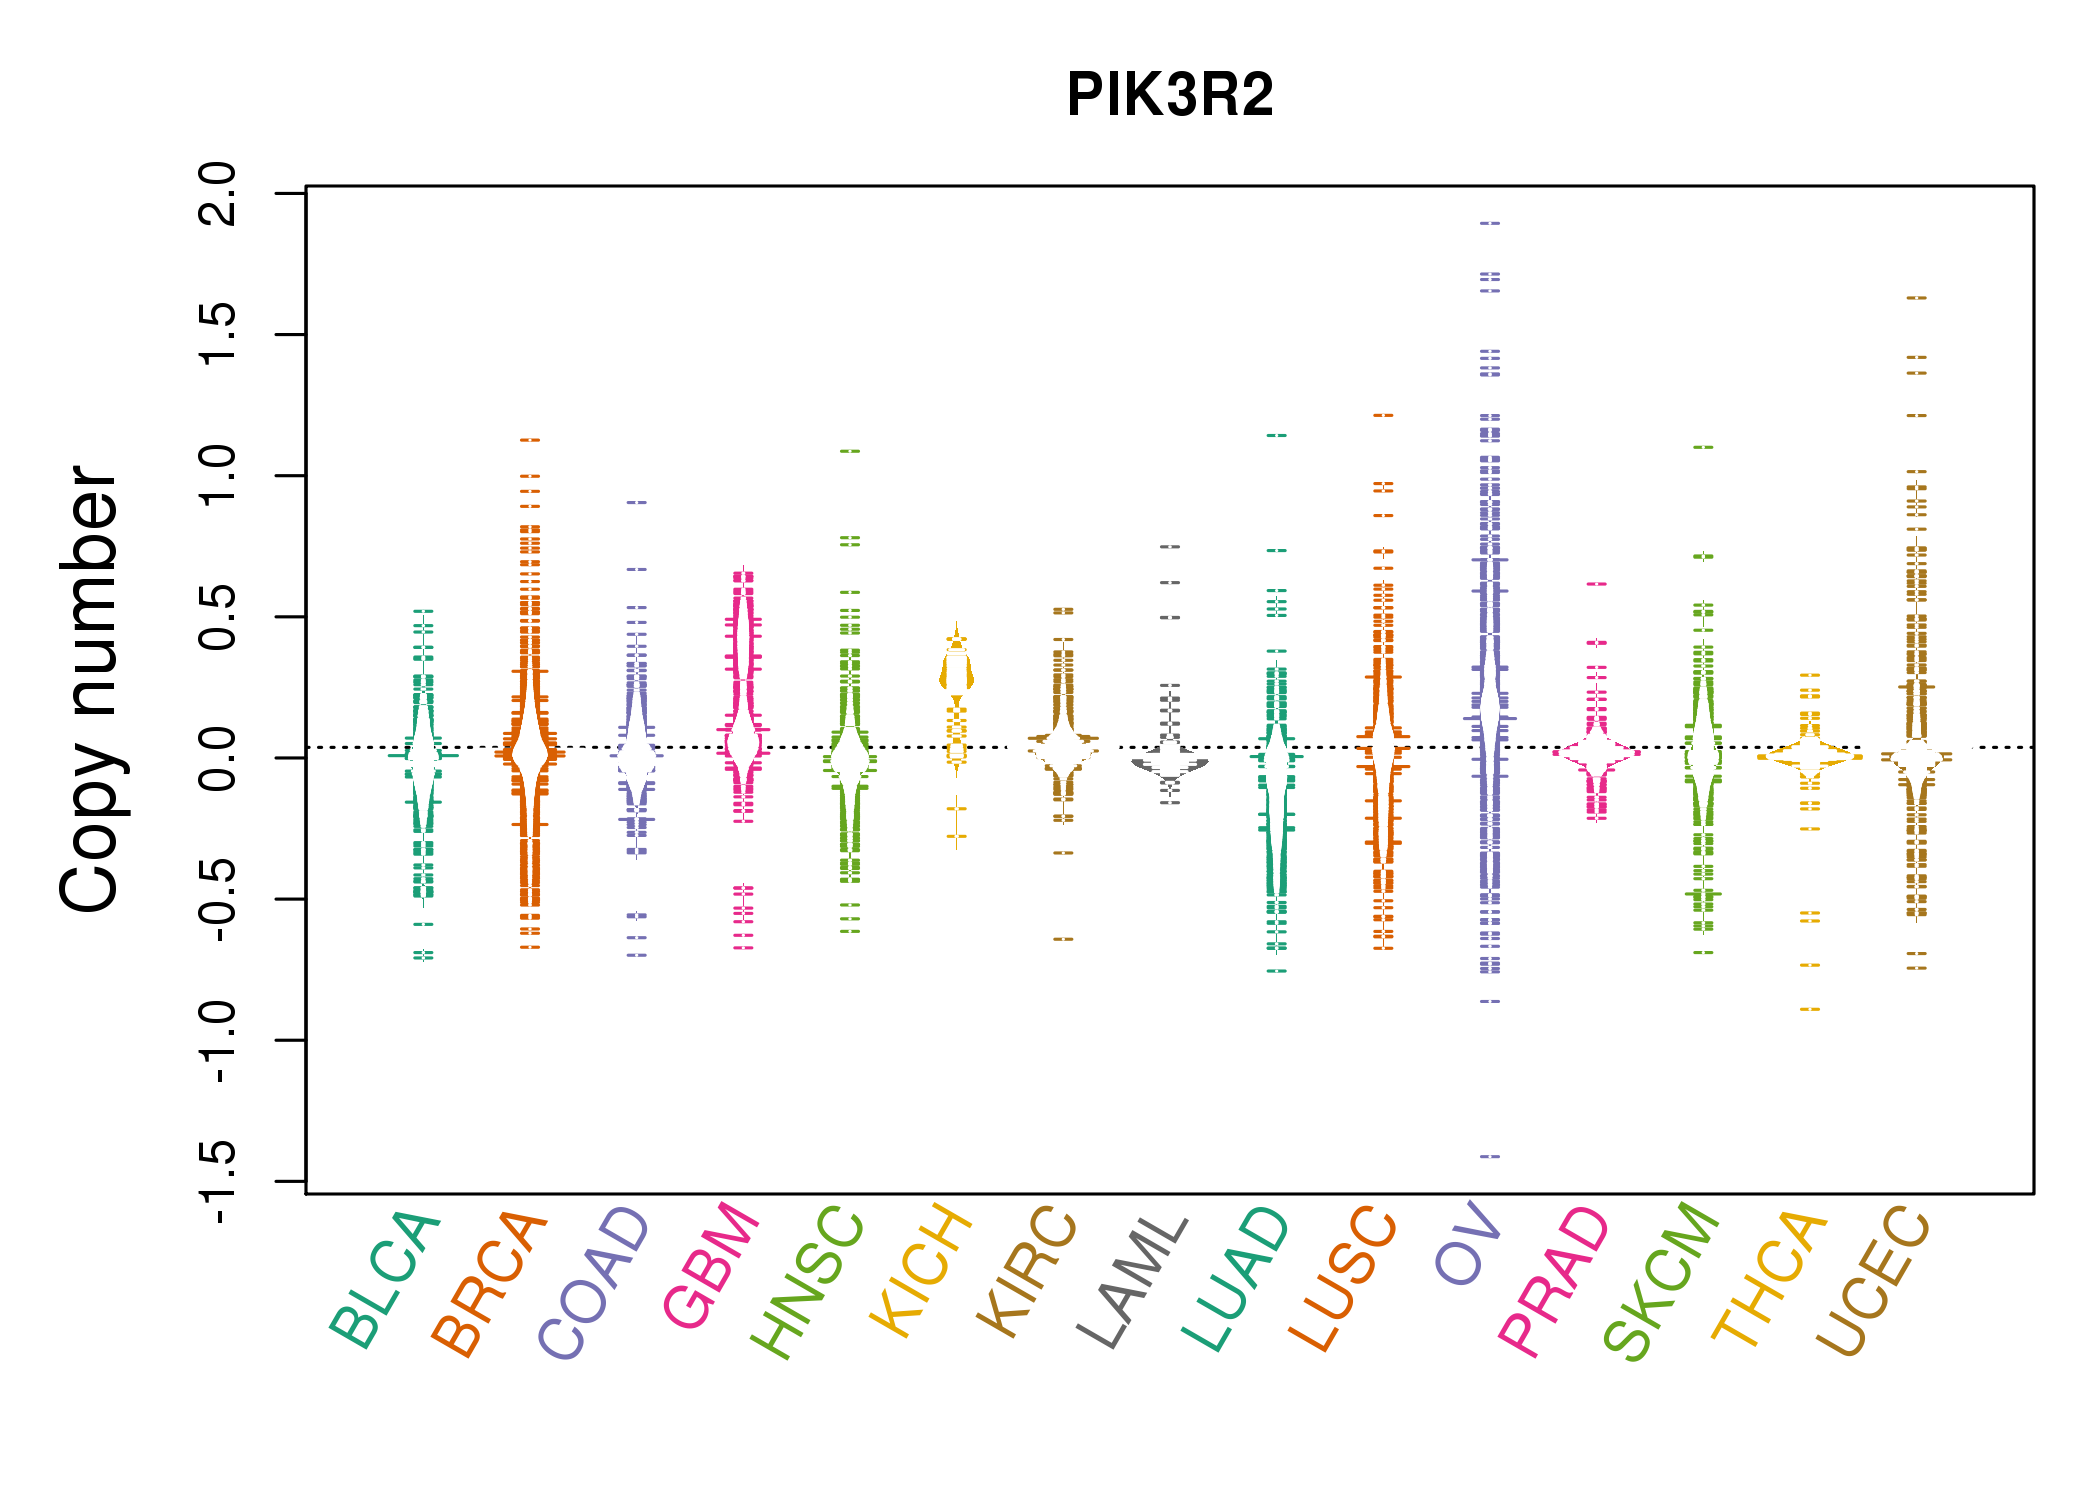 |
| cf) Tissue ID[Tissue type]: BLCA[Bladder Urothelial Carcinoma], BRCA[Breast invasive carcinoma], CESC[Cervical squamous cell carcinoma and endocervical adenocarcinoma], COAD[Colon adenocarcinoma], GBM[Glioblastoma multiforme], Glioma Low Grade, HNSC[Head and Neck squamous cell carcinoma], KICH[Kidney Chromophobe], KIRC[Kidney renal clear cell carcinoma], KIRP[Kidney renal papillary cell carcinoma], LAML[Acute Myeloid Leukemia], LUAD[Lung adenocarcinoma], LUSC[Lung squamous cell carcinoma], OV[Ovarian serous cystadenocarcinoma ], PAAD[Pancreatic adenocarcinoma], PRAD[Prostate adenocarcinoma], SKCM[Skin Cutaneous Melanoma], STAD[Stomach adenocarcinoma], THCA[Thyroid carcinoma], UCEC[Uterine Corpus Endometrial Carcinoma] |
| Top |
| Gene Expression for PIK3R2 |
| * CCLE gene expression data were extracted from CCLE_Expression_Entrez_2012-10-18.res: Gene-centric RMA-normalized mRNA expression data. |
 |
| * Normalized gene expression data of RNASeqV2 was extracted from TCGA using R package TCGA-Assembler. The URLs of all public data files on TCGA DCC data server were gathered at Jan-05-2015. Only eight cancer types have enough normal control samples for differential expression analysis. (t test, adjusted p<0.05 (using Benjamini-Hochberg FDR)) |
 |
| Top |
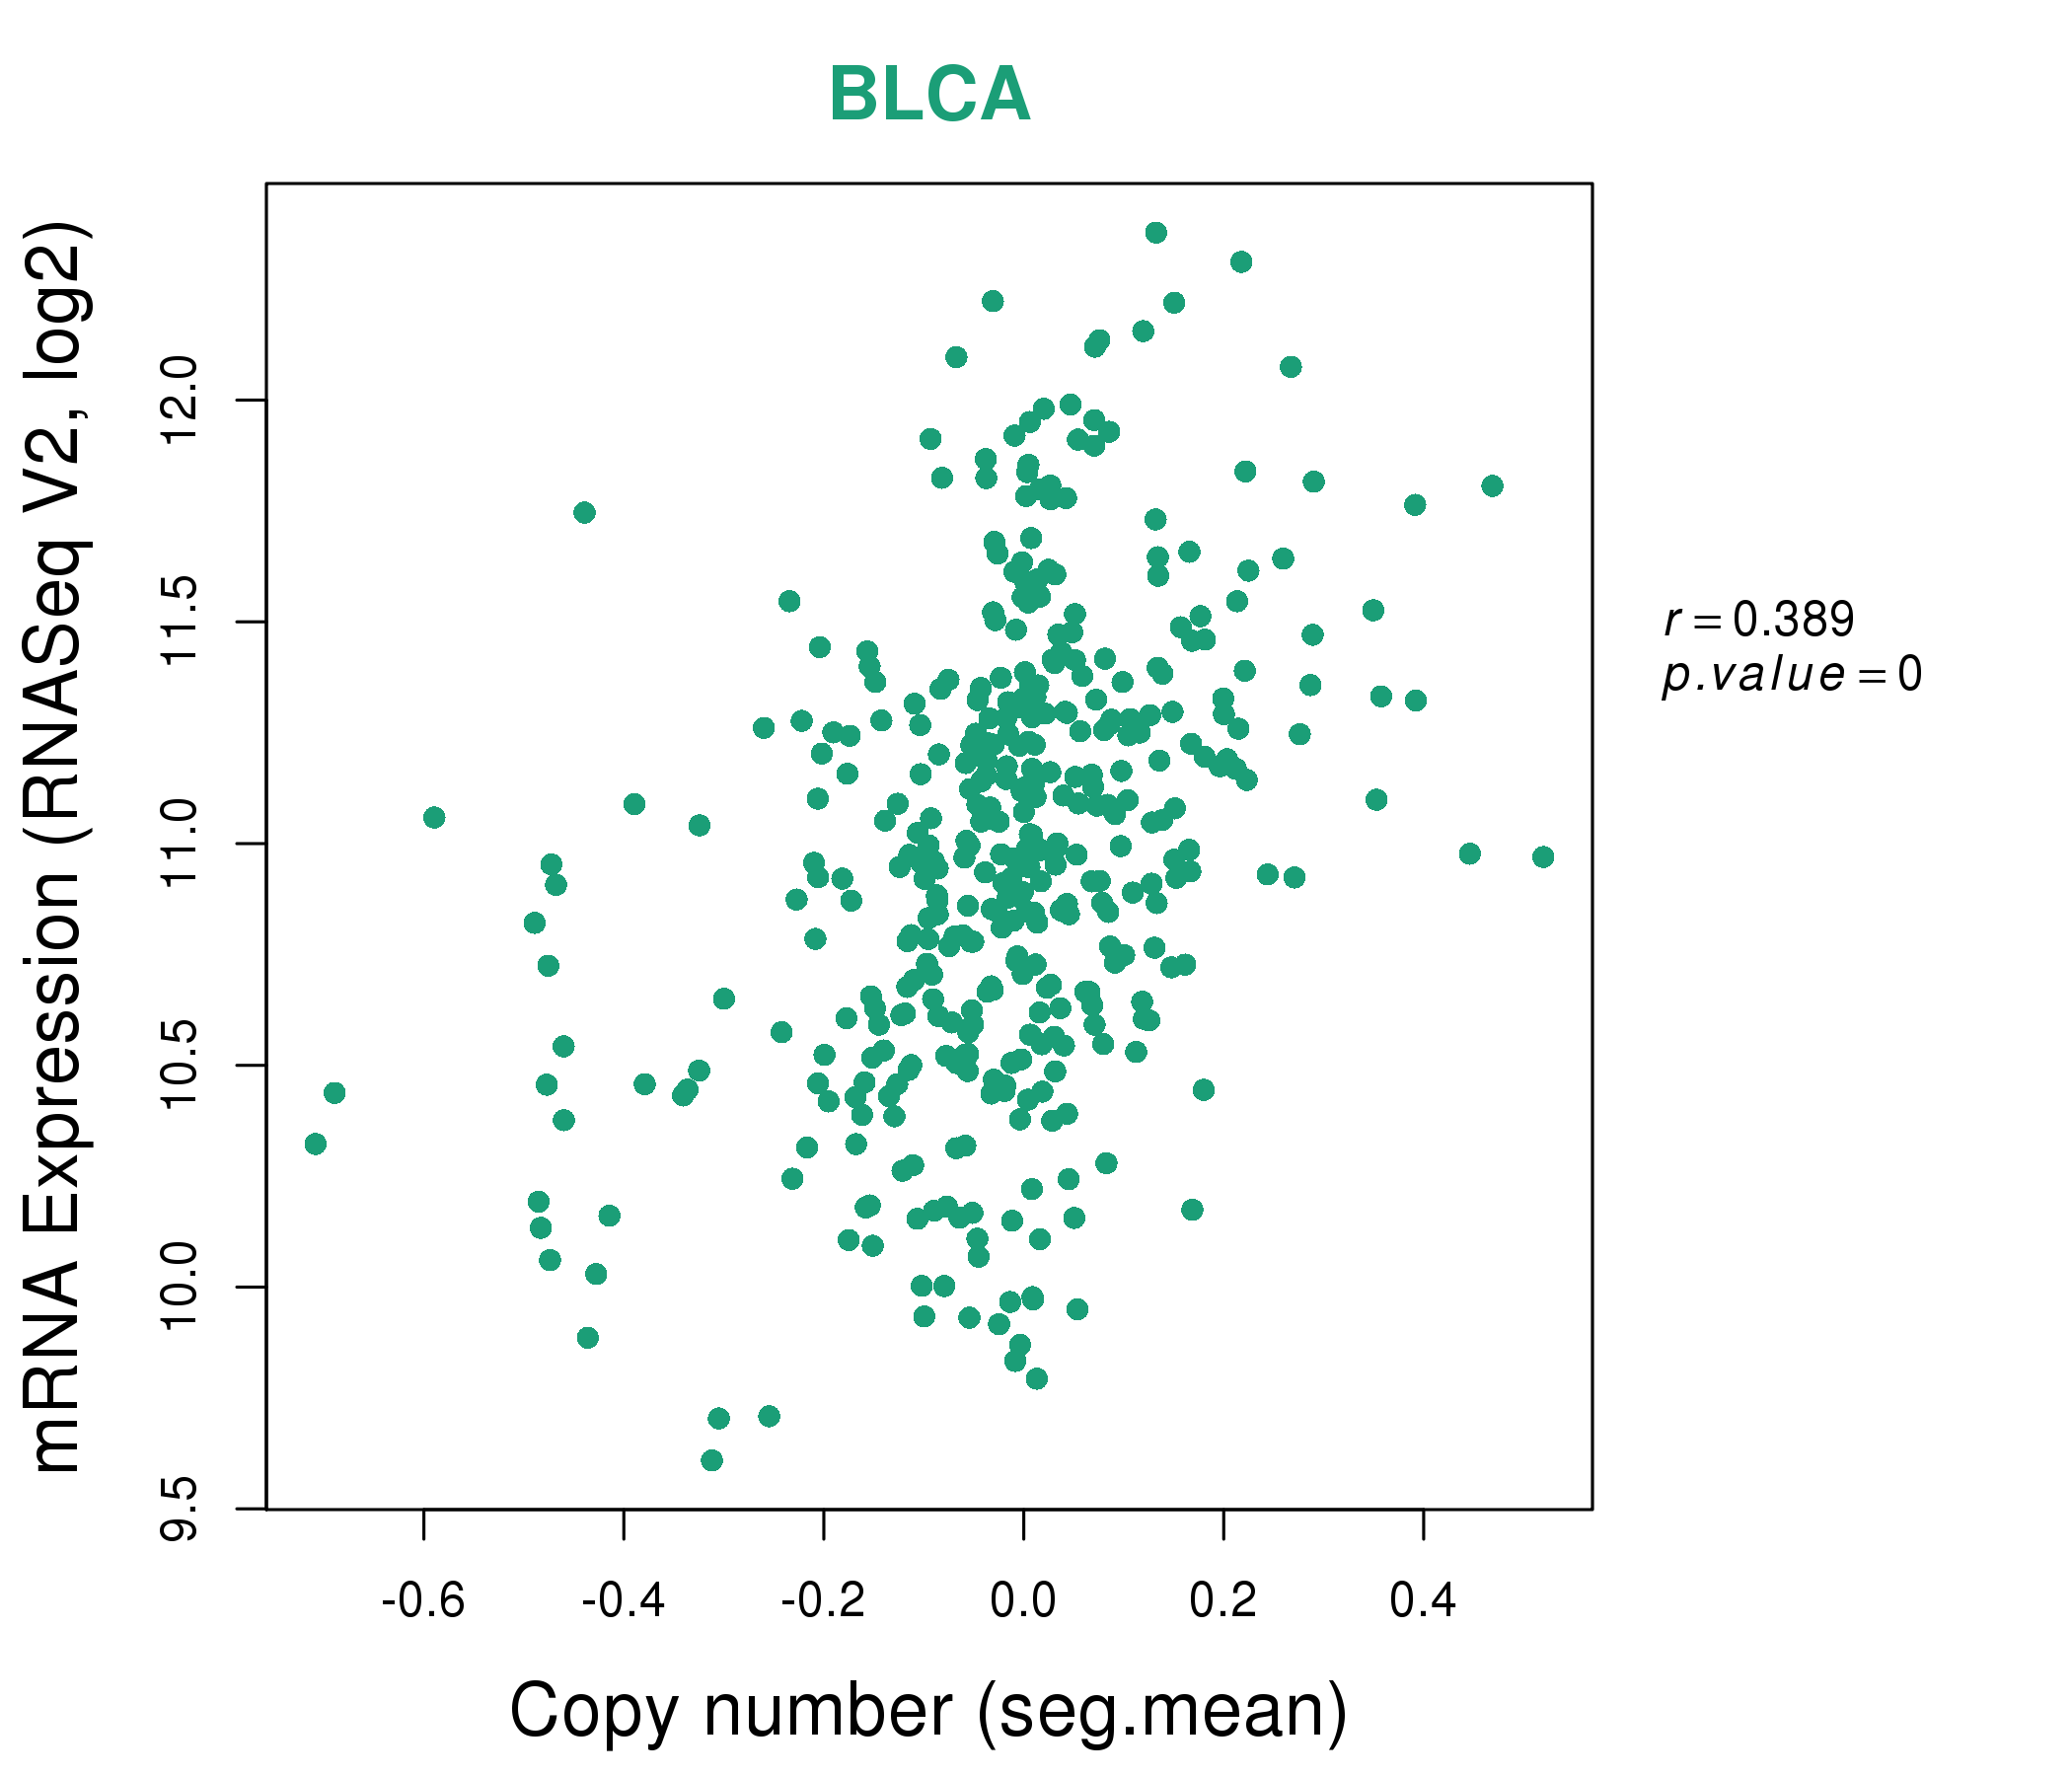
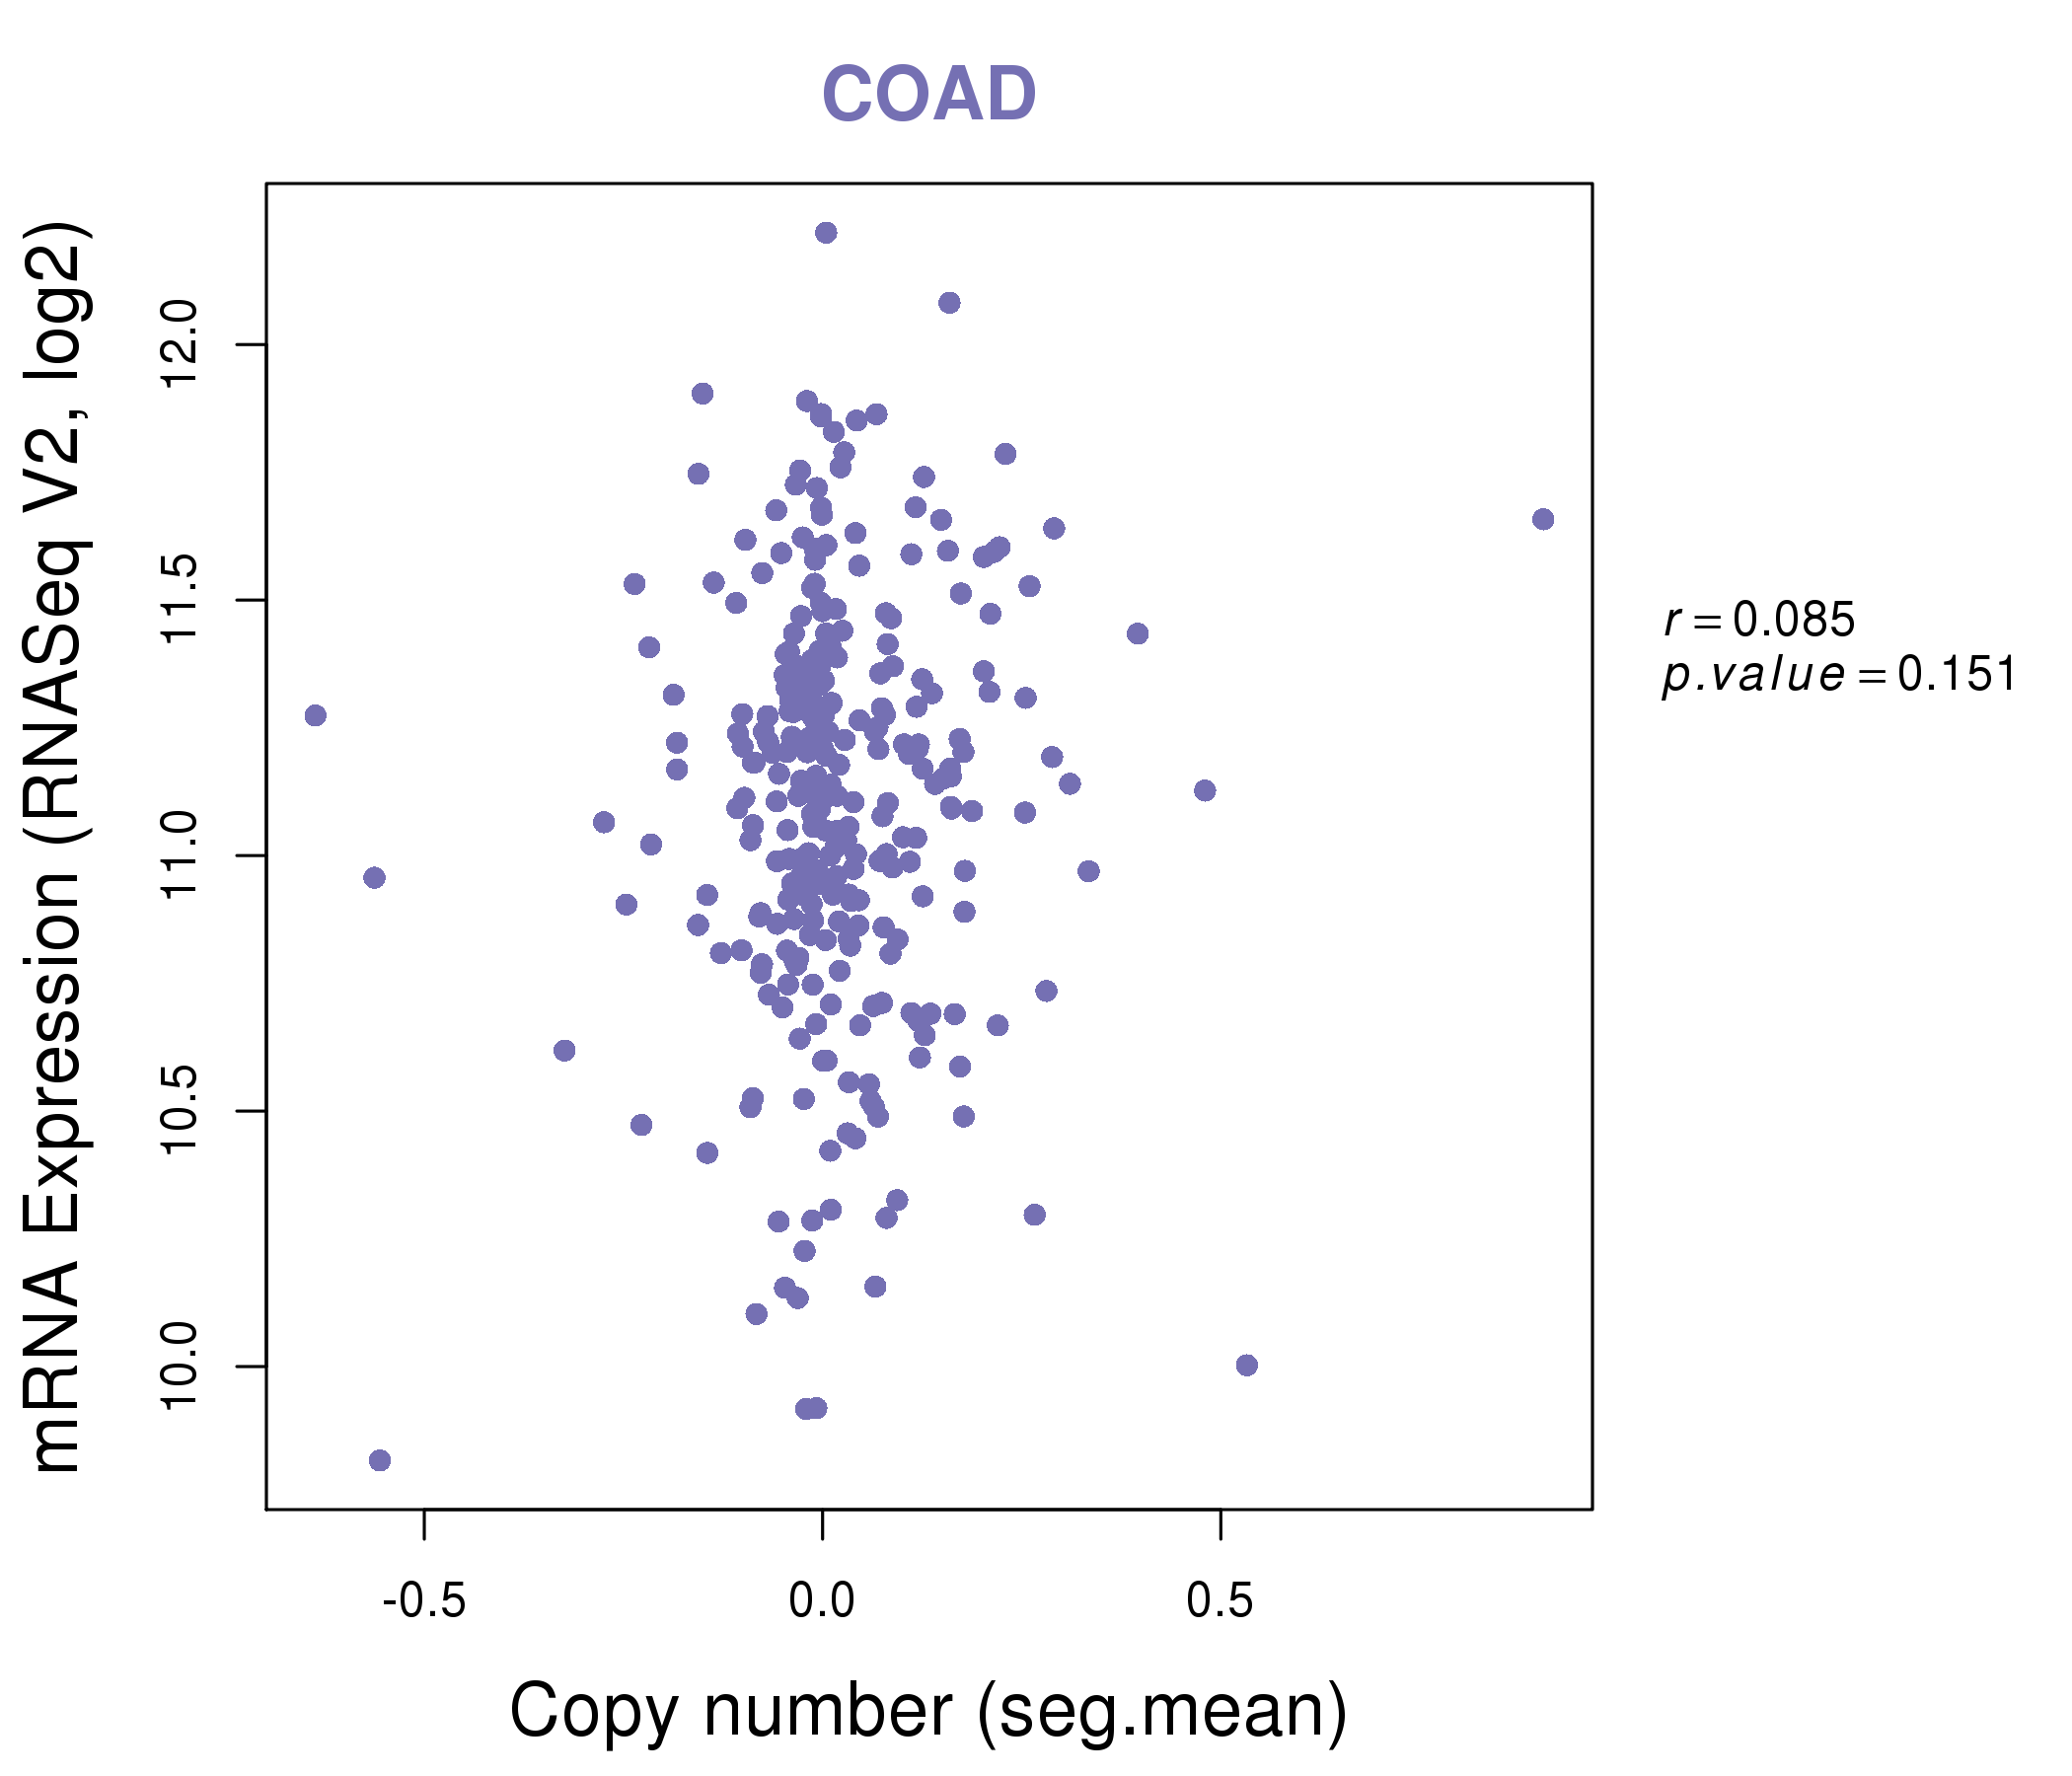
| * This plots show the correlation between CNV and gene expression. |
: Open all plots for all cancer types
 |
|
 |
|


| Top |
| Gene-Gene Network Information |
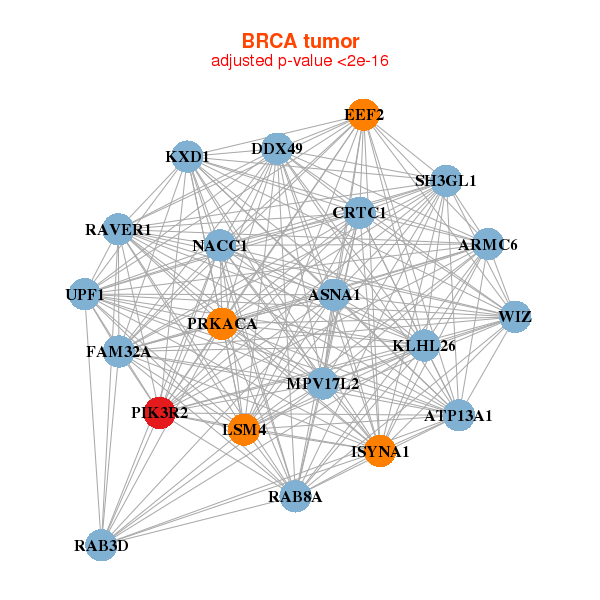
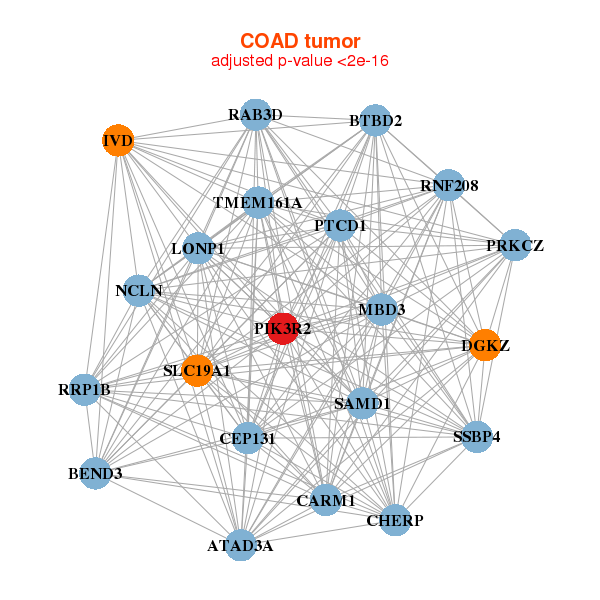
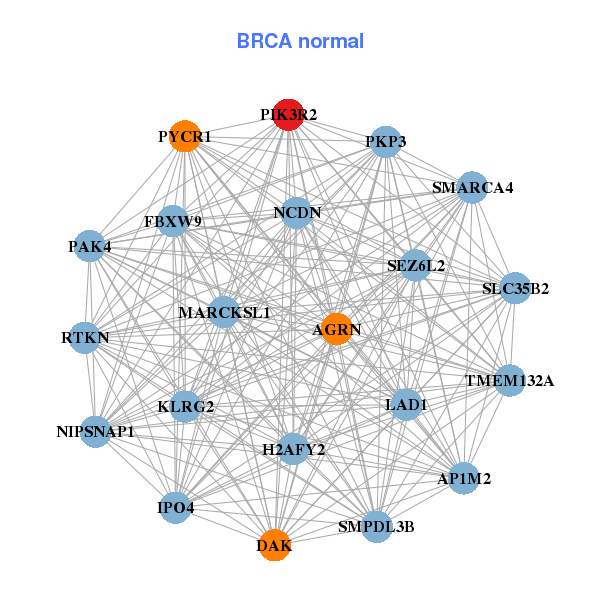
| * Co-Expression network figures were drawn using R package igraph. Only the top 20 genes with the highest correlations were shown. Red circle: input gene, orange circle: cell metabolism gene, sky circle: other gene |
: Open all plots for all cancer types
 |
| ||||
| ARMC6,ASNA1,ATP13A1,KXD1,CRTC1,DDX49,EEF2, FAM32A,ISYNA1,KLHL26,LSM4,MPV17L2,NACC1,PIK3R2, PRKACA,RAB3D,RAB8A,RAVER1,SH3GL1,UPF1,WIZ | AGRN,AP1M2,DAK,FBXW9,H2AFY2,IPO4,KLRG2, LAD1,MARCKSL1,NCDN,NIPSNAP1,PAK4,PIK3R2,PKP3, PYCR1,RTKN,SEZ6L2,SLC35B2,SMARCA4,SMPDL3B,TMEM132A | ||||
 |
| ||||
| ATAD3A,CEP131,BEND3,BTBD2,CARM1,CHERP,DGKZ, IVD,LONP1,MBD3,NCLN,PIK3R2,PRKCZ,PTCD1, RAB3D,RNF208,RRP1B,SAMD1,SLC19A1,SSBP4,TMEM161A | ABHD14B,BTBD2,FAM213B,CNNM3,COX19,FN3K,GAS6, GIT1,HOXA3,IGSF8,MEN1,NECAB3,PABPC1,PGAP2, PIK3R2,REPIN1,RNF43,RTKN,TIGD5,TP53I13,TYSND1 |
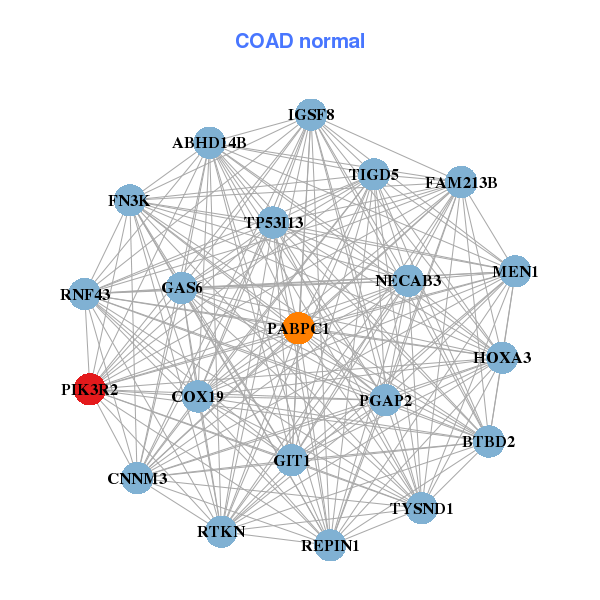
| * Co-Expression network figures were drawn using R package igraph. Only the top 20 genes with the highest correlations were shown. Red circle: input gene, orange circle: cell metabolism gene, sky circle: other gene |
: Open all plots for all cancer types
| Top |
: Open all interacting genes' information including KEGG pathway for all interacting genes from DAVID
| Top |
| Pharmacological Information for PIK3R2 |
| DB Category | DB Name | DB's ID and Url link |
| Organism-specific databases | PharmGKB | PA33313; -. |
| Organism-specific databases | CTD | 5296; -. |
| * Gene Centered Interaction Network. |
 |
| * Drug Centered Interaction Network. |
| DrugBank ID | Target Name | Drug Groups | Generic Name | Drug Centered Network | Drug Structure |
| DB01064 | phosphoinositide-3-kinase, regulatory subunit 2 (beta) | approved | Isoproterenol | 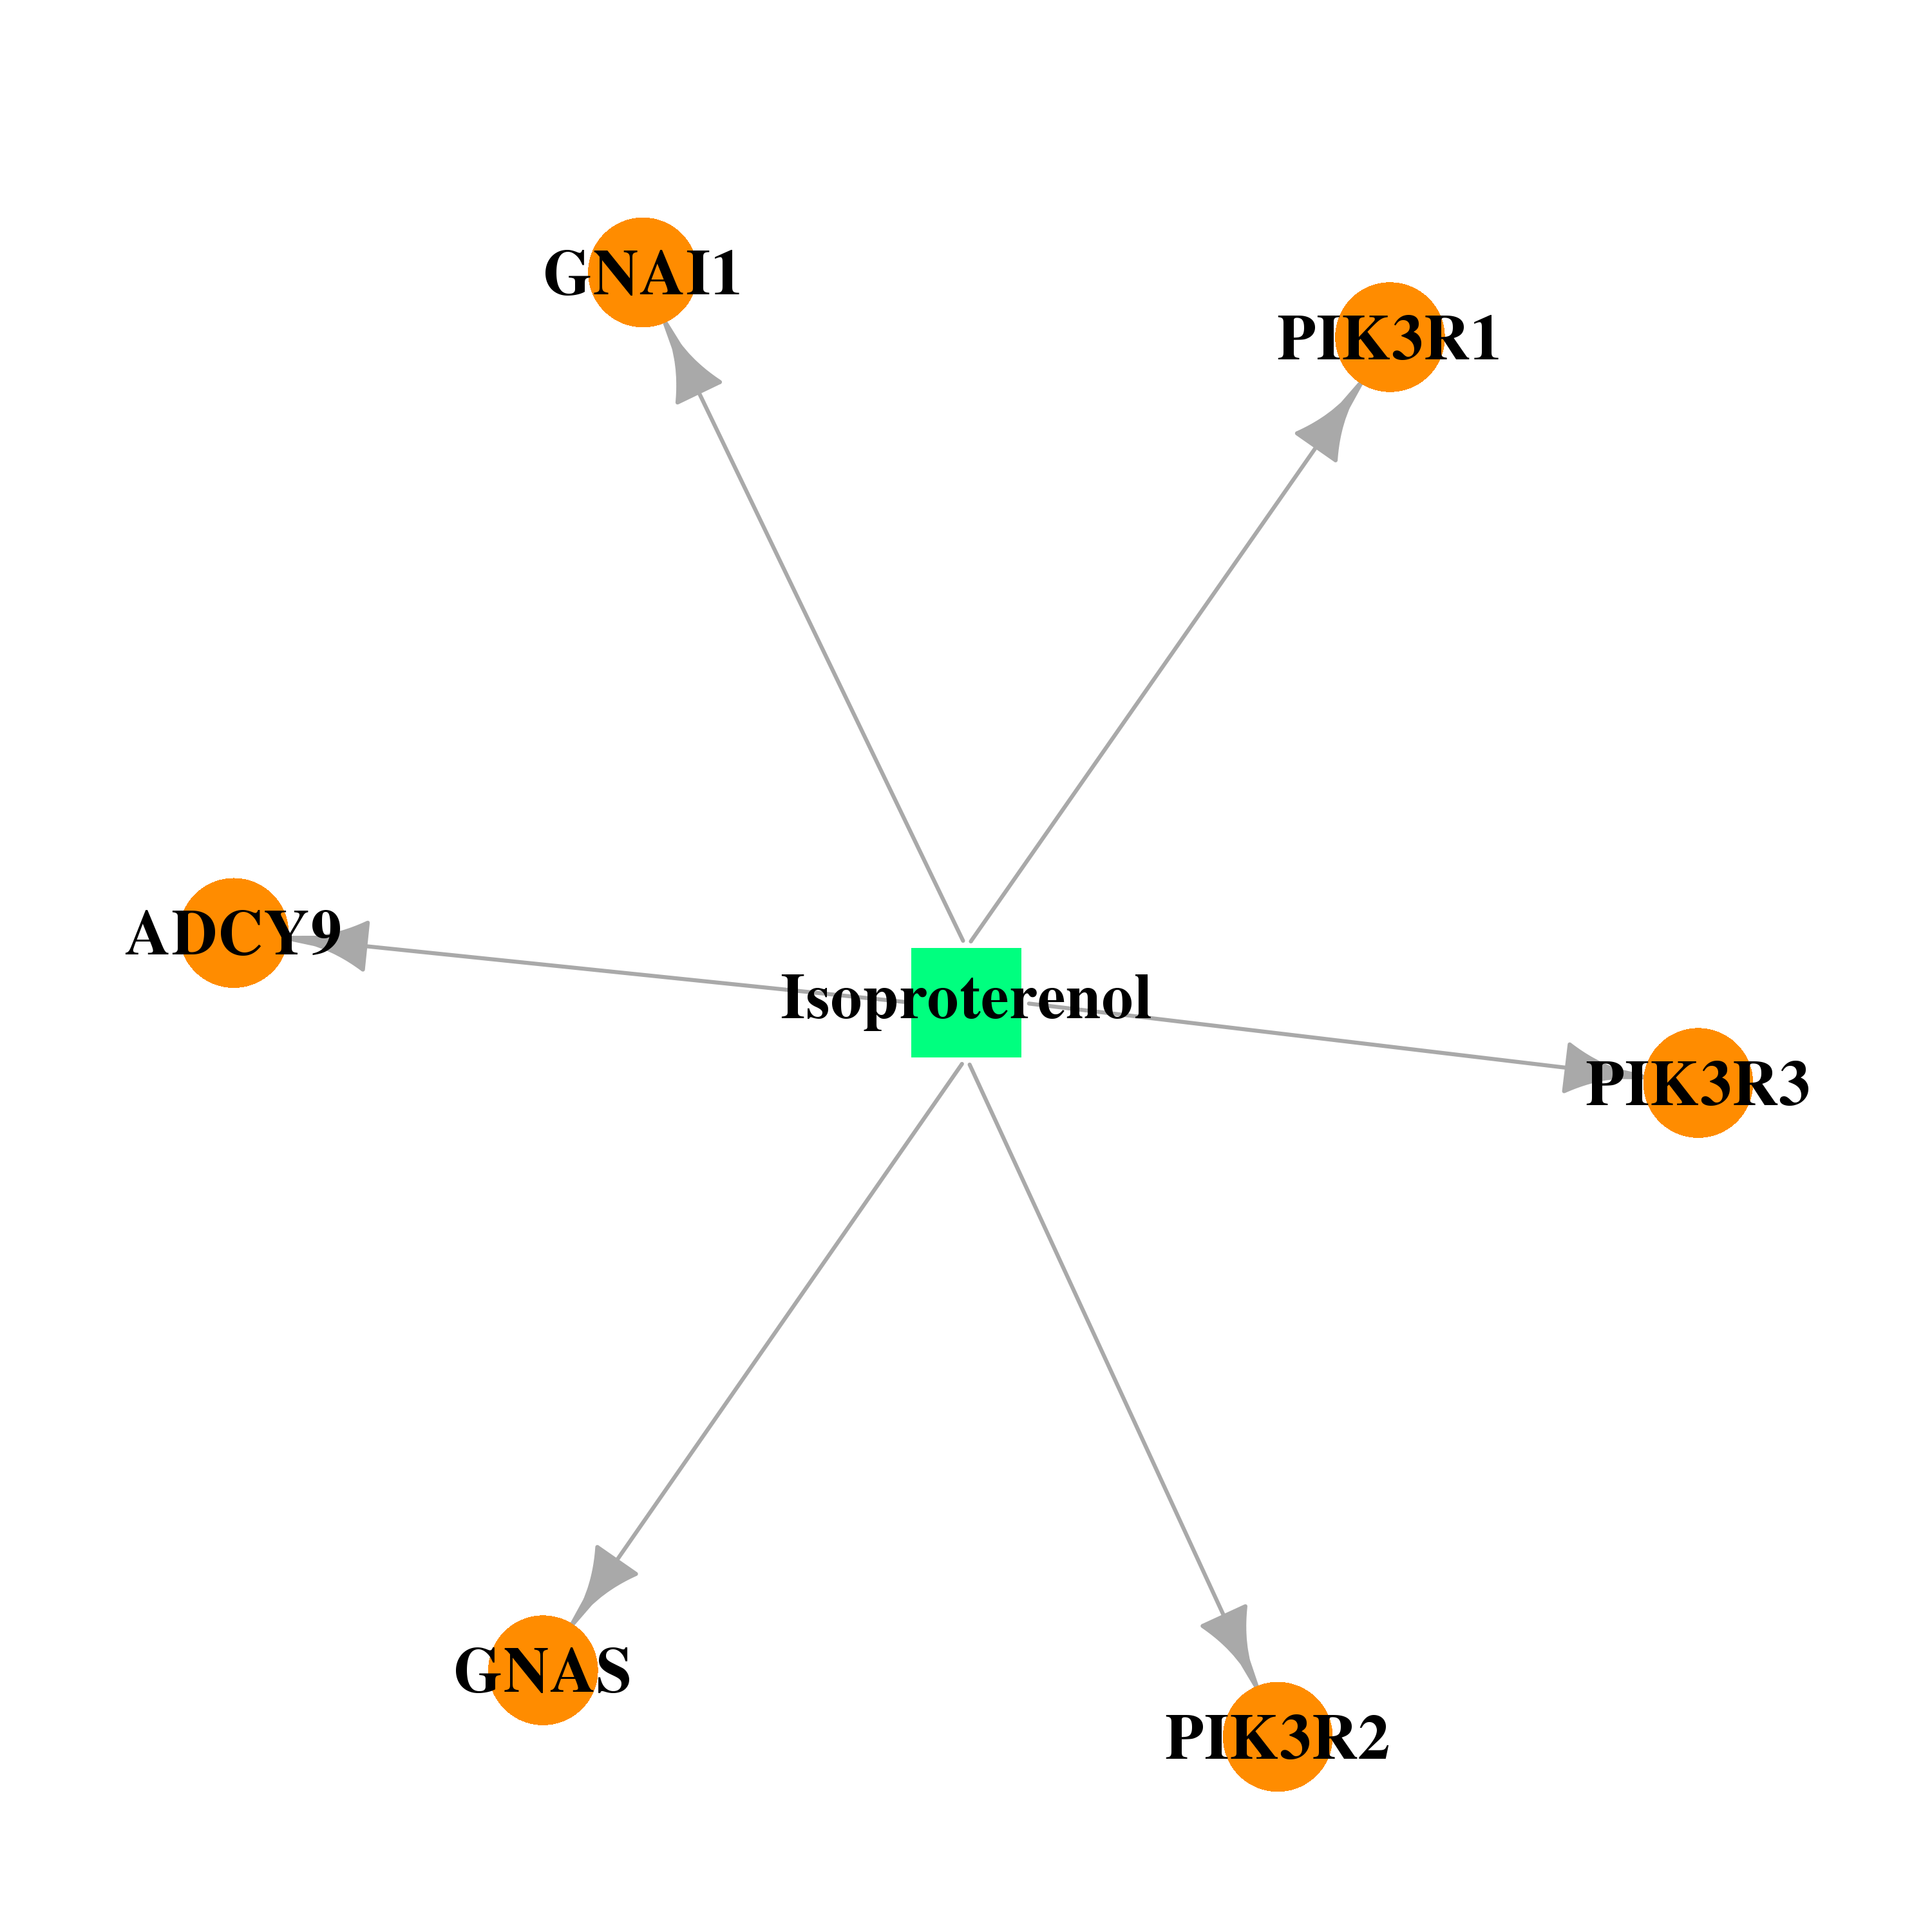 |  |
| Top |
| Cross referenced IDs for PIK3R2 |
| * We obtained these cross-references from Uniprot database. It covers 150 different DBs, 18 categories. http://www.uniprot.org/help/cross_references_section |
: Open all cross reference information
|
Copyright © 2016-Present - The Univsersity of Texas Health Science Center at Houston @ |