|
||||||||||||||||||||||||||||||||||||||||||||||||||||||||||||||||||||||||||||||||||||||||||||||||||||||||||||||||||||||||||||||||||||||||||||||||||||||||||||||||||||||||||||||||||||||||||||||||||||||||||||||||||||||||||||||||||||||||||||||||||||||||||||||||||||||||||||||||||||||||||||||||||||||||||||||||||||||||||
| |
| Phenotypic Information (metabolism pathway, cancer, disease, phenome) |
| |
| |
| Gene-Gene Network Information: Co-Expression Network, Interacting Genes & KEGG |
| |
|


| Gene Summary for PI4KA |
| Basic gene info. | Gene symbol | PI4KA |
| Gene name | phosphatidylinositol 4-kinase, catalytic, alpha | |
| Synonyms | PI4K-ALPHA|PIK4CA|pi4K230 | |
| Cytomap | UCSC genome browser: 22q11.21 | |
| Genomic location | chr22 :21061978-21088955 | |
| Type of gene | protein-coding | |
| RefGenes | NM_058004.3, NM_002650.2, | |
| Ensembl id | ENSG00000241973 | |
| Description | PI4-kinase alphaphosphatidylinositol 4-kinase 230phosphatidylinositol 4-kinase alphaphosphatidylinositol 4-kinase, type III, alphaptdIns-4-kinase alpha | |
| Modification date | 20141222 | |
| dbXrefs | MIM : 600286 | |
| HGNC : HGNC | ||
| Ensembl : ENSG00000241973 | ||
| HPRD : 08972 | ||
| Vega : OTTHUMG00000167440 | ||
| Protein | UniProt: P42356 go to UniProt's Cross Reference DB Table | |
| Expression | CleanEX: HS_PI4KA | |
| BioGPS: 5297 | ||
| Gene Expression Atlas: ENSG00000241973 | ||
| The Human Protein Atlas: ENSG00000241973 | ||
| Pathway | NCI Pathway Interaction Database: PI4KA | |
| KEGG: PI4KA | ||
| REACTOME: PI4KA | ||
| ConsensusPathDB | ||
| Pathway Commons: PI4KA | ||
| Metabolism | MetaCyc: PI4KA | |
| HUMANCyc: PI4KA | ||
| Regulation | Ensembl's Regulation: ENSG00000241973 | |
| miRBase: chr22 :21,061,978-21,088,955 | ||
| TargetScan: NM_058004 | ||
| cisRED: ENSG00000241973 | ||
| Context | iHOP: PI4KA | |
| cancer metabolism search in PubMed: PI4KA | ||
| UCL Cancer Institute: PI4KA | ||
| Assigned class in ccmGDB | B - This gene belongs to cancer gene. | |
| Top |
| Phenotypic Information for PI4KA(metabolism pathway, cancer, disease, phenome) |
| Cancer | CGAP: PI4KA |
| Familial Cancer Database: PI4KA | |
| * This gene is included in those cancer gene databases. |
|
|
|
|
|
|
| ||||||||||||||||||||||||||||||||||||||||||||||||||||||||||||||||||||||||||||||||||||||||||||||||||||||||||||||||||||||||||||||||||||||||||||||||||||||||||||||||||||||||||||||||||||||||||||||||||||||||||||||||||||||||||||||||||||||||||||||||||||||||||||||||||||||||||||||||||||||||||||||||||||||||||||||||||||
Oncogene 1 | Significant driver gene in | |||||||||||||||||||||||||||||||||||||||||||||||||||||||||||||||||||||||||||||||||||||||||||||||||||||||||||||||||||||||||||||||||||||||||||||||||||||||||||||||||||||||||||||||||||||||||||||||||||||||||||||||||||||||||||||||||||||||||||||||||||||||||||||||||||||||||||||||||||||||||||||||||||||||||||||||||||||||||
| cf) number; DB name 1 Oncogene; http://nar.oxfordjournals.org/content/35/suppl_1/D721.long, 2 Tumor Suppressor gene; https://bioinfo.uth.edu/TSGene/, 3 Cancer Gene Census; http://www.nature.com/nrc/journal/v4/n3/abs/nrc1299.html, 4 CancerGenes; http://nar.oxfordjournals.org/content/35/suppl_1/D721.long, 5 Network of Cancer Gene; http://ncg.kcl.ac.uk/index.php, 1Therapeutic Vulnerabilities in Cancer; http://cbio.mskcc.org/cancergenomics/statius/ |
| KEGG_INOSITOL_PHOSPHATE_METABOLISM REACTOME_PHOSPHOLIPID_METABOLISM REACTOME_PI_METABOLISM REACTOME_METABOLISM_OF_LIPIDS_AND_LIPOPROTEINS | |
| OMIM | |
| Orphanet | |
| Disease | KEGG Disease: PI4KA |
| MedGen: PI4KA (Human Medical Genetics with Condition) | |
| ClinVar: PI4KA | |
| Phenotype | MGI: PI4KA (International Mouse Phenotyping Consortium) |
| PhenomicDB: PI4KA | |
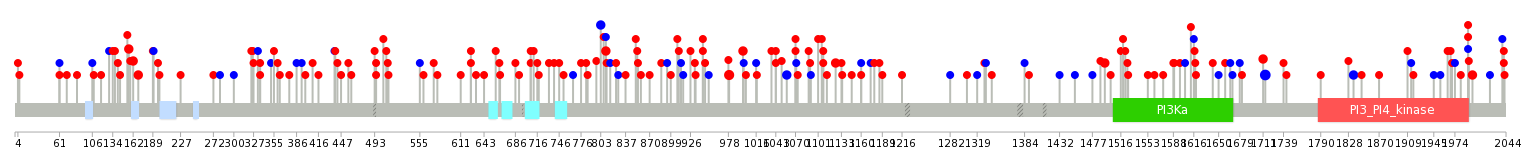
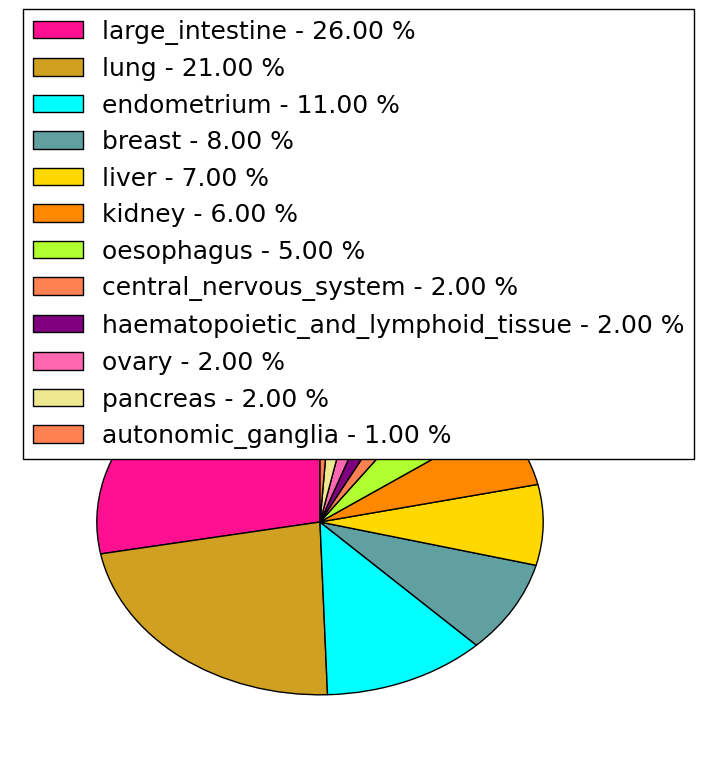
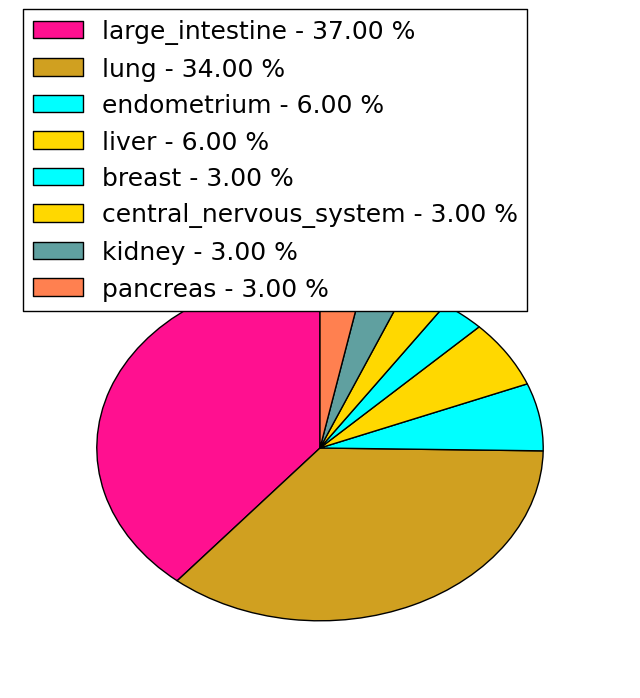
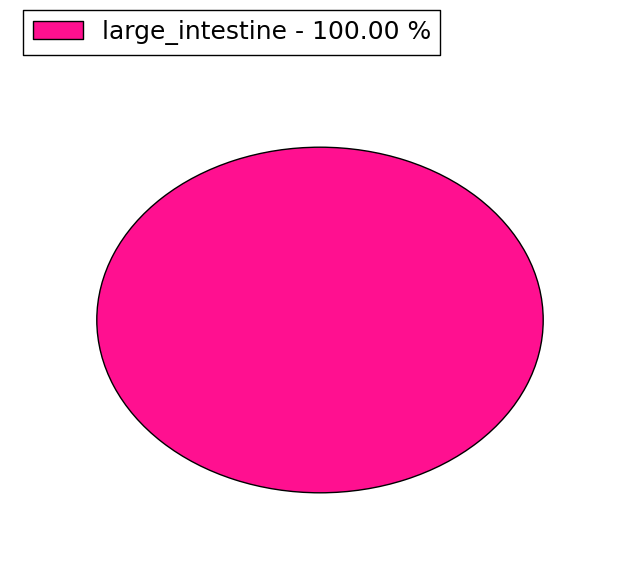
| Mutations for PI4KA |
| * Under tables are showing count per each tissue to give us broad intuition about tissue specific mutation patterns.You can go to the detailed page for each mutation database's web site. |
| There's no structural variation information in COSMIC data for this gene. |
| * From mRNA Sanger sequences, Chitars2.0 arranged chimeric transcripts. This table shows PI4KA related fusion information. |
| ID | Head Gene | Tail Gene | Accession | Gene_a | qStart_a | qEnd_a | Chromosome_a | tStart_a | tEnd_a | Gene_a | qStart_a | qEnd_a | Chromosome_a | tStart_a | tEnd_a |
| AK297634 | GNL3 | 1 | 729 | 3 | 52720048 | 52724720 | PI4KA | 728 | 1029 | 22 | 21081519 | 21081820 | |
| BE006728 | PI4KA | 8 | 101 | 22 | 21161654 | 21161747 | GBP3 | 96 | 294 | 1 | 89477432 | 89477630 | |
| BE006730 | PI4KA | 8 | 101 | 22 | 21161654 | 21161747 | GBP3 | 96 | 294 | 1 | 89477432 | 89477630 | |
| BE006741 | PI4KA | 8 | 101 | 22 | 21161654 | 21161747 | GBP3 | 96 | 294 | 1 | 89477432 | 89477630 | |
| BE006742 | PI4KA | 8 | 101 | 22 | 21161654 | 21161747 | GBP3 | 96 | 299 | 1 | 89477427 | 89477630 | |
| BE006743 | PI4KA | 8 | 101 | 22 | 21161654 | 21161747 | GBP3 | 96 | 294 | 1 | 89477432 | 89477630 | |
| BE006738 | PI4KA | 8 | 101 | 22 | 21161654 | 21161747 | GBP3 | 96 | 294 | 1 | 89477432 | 89477630 | |
| BE006729 | PI4KA | 8 | 101 | 22 | 21161654 | 21161747 | GBP3 | 96 | 299 | 1 | 89477427 | 89477630 | |
| BI059304 | PI4KA | 28 | 261 | 22 | 21172797 | 21174121 | WIPI2 | 253 | 454 | 7 | 5266433 | 5266634 | |
| BE006734 | PI4KA | 8 | 101 | 22 | 21161654 | 21161747 | GBP3 | 96 | 299 | 1 | 89477427 | 89477630 | |
| Top |
| Mutation type/ Tissue ID | brca | cns | cerv | endome | haematopo | kidn | Lintest | liver | lung | ns | ovary | pancre | prost | skin | stoma | thyro | urina | |||
| Total # sample | 1 | 1 | ||||||||||||||||||
| GAIN (# sample) | 1 | 1 | ||||||||||||||||||
| LOSS (# sample) |
| cf) Tissue ID; Tissue type (1; Breast, 2; Central_nervous_system, 3; Cervix, 4; Endometrium, 5; Haematopoietic_and_lymphoid_tissue, 6; Kidney, 7; Large_intestine, 8; Liver, 9; Lung, 10; NS, 11; Ovary, 12; Pancreas, 13; Prostate, 14; Skin, 15; Stomach, 16; Thyroid, 17; Urinary_tract) |
| Top |
|
 |
| Top |
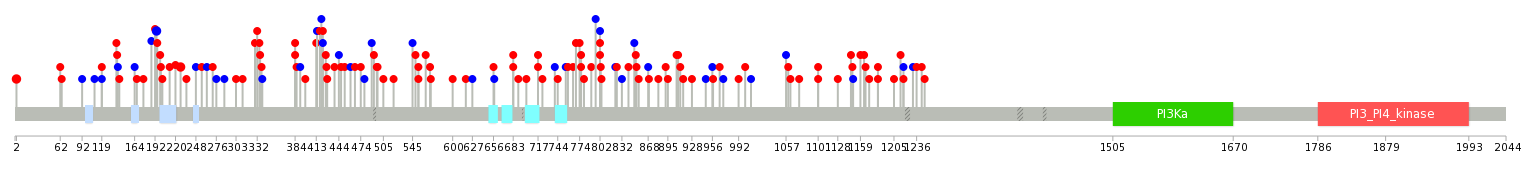
| Stat. for Non-Synonymous SNVs (# total SNVs=137) | (# total SNVs=29) |
 |  |
(# total SNVs=3) | (# total SNVs=3) |
 |  |
| Top |
| * When you move the cursor on each content, you can see more deailed mutation information on the Tooltip. Those are primary_site,primary_histology,mutation(aa),pubmedID. |
| GRCh37 position | Mutation(aa) | Unique sampleID count |
| chr22:21071997-21071997 | p.P1714P | 4 |
| chr22:21105625-21105625 | p.A979T | 3 |
| chr22:21083628-21083628 | p.P1494L | 2 |
| chr22:21174038-21174038 | p.R169Q | 2 |
| chr22:21072007-21072007 | p.K1711T | 2 |
| chr22:21174060-21174060 | p.L162V | 2 |
| chr22:21066897-21066897 | p.C1835C | 2 |
| chr22:21106029-21106029 | p.L943R | 2 |
| chr22:21174078-21174078 | p.P156S | 2 |
| chr22:21096961-21096961 | p.R1125H | 2 |
| Top |
|
 |
| Point Mutation/ Tissue ID | 1 | 2 | 3 | 4 | 5 | 6 | 7 | 8 | 9 | 10 | 11 | 12 | 13 | 14 | 15 | 16 | 17 | 18 | 19 | 20 |
| # sample | 6 | 2 | 25 | 1 | 5 | 7 | 1 | 18 | 10 | 1 | 23 | 13 | 20 | |||||||
| # mutation | 6 | 2 | 28 | 1 | 5 | 7 | 1 | 18 | 11 | 1 | 29 | 14 | 23 | |||||||
| nonsynonymous SNV | 5 | 1 | 21 | 1 | 4 | 7 | 1 | 11 | 8 | 1 | 16 | 11 | 21 | |||||||
| synonymous SNV | 1 | 1 | 7 | 1 | 7 | 3 | 13 | 3 | 2 |
| cf) Tissue ID; Tissue type (1; BLCA[Bladder Urothelial Carcinoma], 2; BRCA[Breast invasive carcinoma], 3; CESC[Cervical squamous cell carcinoma and endocervical adenocarcinoma], 4; COAD[Colon adenocarcinoma], 5; GBM[Glioblastoma multiforme], 6; Glioma Low Grade, 7; HNSC[Head and Neck squamous cell carcinoma], 8; KICH[Kidney Chromophobe], 9; KIRC[Kidney renal clear cell carcinoma], 10; KIRP[Kidney renal papillary cell carcinoma], 11; LAML[Acute Myeloid Leukemia], 12; LUAD[Lung adenocarcinoma], 13; LUSC[Lung squamous cell carcinoma], 14; OV[Ovarian serous cystadenocarcinoma ], 15; PAAD[Pancreatic adenocarcinoma], 16; PRAD[Prostate adenocarcinoma], 17; SKCM[Skin Cutaneous Melanoma], 18:STAD[Stomach adenocarcinoma], 19:THCA[Thyroid carcinoma], 20:UCEC[Uterine Corpus Endometrial Carcinoma]) |
| Top |
| * We represented just top 10 SNVs. When you move the cursor on each content, you can see more deailed mutation information on the Tooltip. Those are primary_site, primary_histology, mutation(aa), pubmedID. |
| Genomic Position | Mutation(aa) | Unique sampleID count |
| chr22:21088834 | p.R119W | 2 |
| chr22:21174038 | p.A717T | 2 |
| chr22:21150562 | p.R227Q | 2 |
| chr22:21188862 | p.V194V,PI4KA | 2 |
| chr22:21084262 | p.R2L,PI4KA | 2 |
| chr22:21067598 | p.R790W | 1 |
| chr22:21174864 | p.A553V,PI4KA | 1 |
| chr22:21107419 | p.S553P | 1 |
| chr22:21156298 | p.V338A,PI4KA | 1 |
| chr22:21159362 | p.I339I | 1 |
| * Copy number data were extracted from TCGA using R package TCGA-Assembler. The URLs of all public data files on TCGA DCC data server were gathered on Jan-05-2015. Function ProcessCNAData in TCGA-Assembler package was used to obtain gene-level copy number value which is calculated as the average copy number of the genomic region of a gene. |
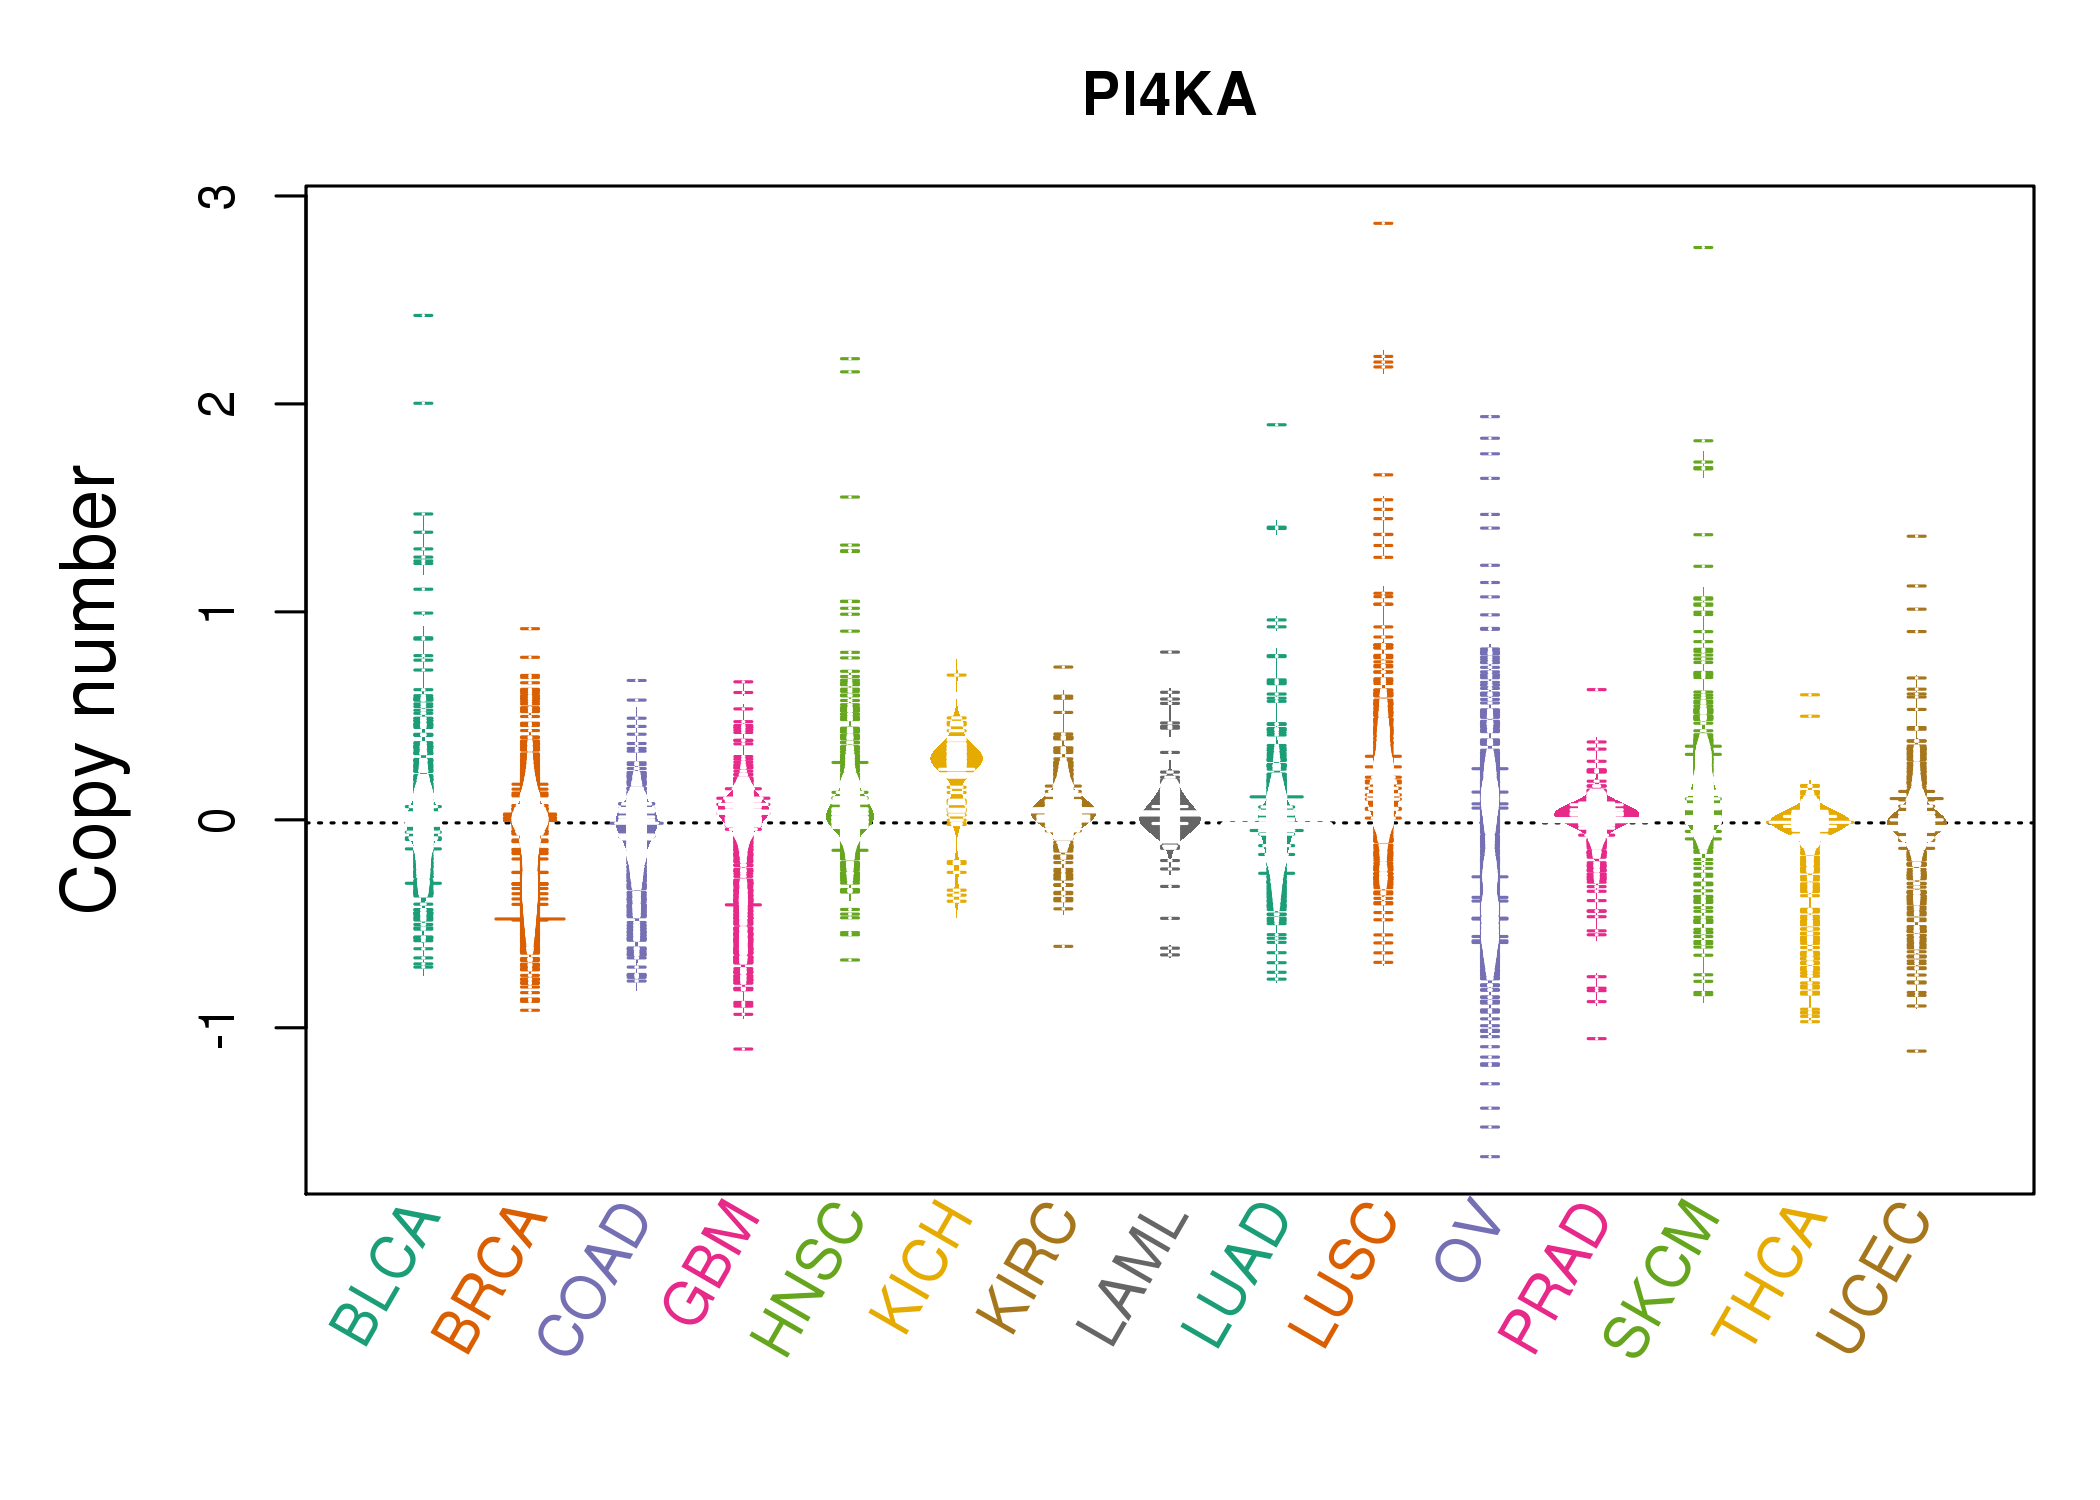 |
| cf) Tissue ID[Tissue type]: BLCA[Bladder Urothelial Carcinoma], BRCA[Breast invasive carcinoma], CESC[Cervical squamous cell carcinoma and endocervical adenocarcinoma], COAD[Colon adenocarcinoma], GBM[Glioblastoma multiforme], Glioma Low Grade, HNSC[Head and Neck squamous cell carcinoma], KICH[Kidney Chromophobe], KIRC[Kidney renal clear cell carcinoma], KIRP[Kidney renal papillary cell carcinoma], LAML[Acute Myeloid Leukemia], LUAD[Lung adenocarcinoma], LUSC[Lung squamous cell carcinoma], OV[Ovarian serous cystadenocarcinoma ], PAAD[Pancreatic adenocarcinoma], PRAD[Prostate adenocarcinoma], SKCM[Skin Cutaneous Melanoma], STAD[Stomach adenocarcinoma], THCA[Thyroid carcinoma], UCEC[Uterine Corpus Endometrial Carcinoma] |
| Top |
| Gene Expression for PI4KA |
| * CCLE gene expression data were extracted from CCLE_Expression_Entrez_2012-10-18.res: Gene-centric RMA-normalized mRNA expression data. |
 |
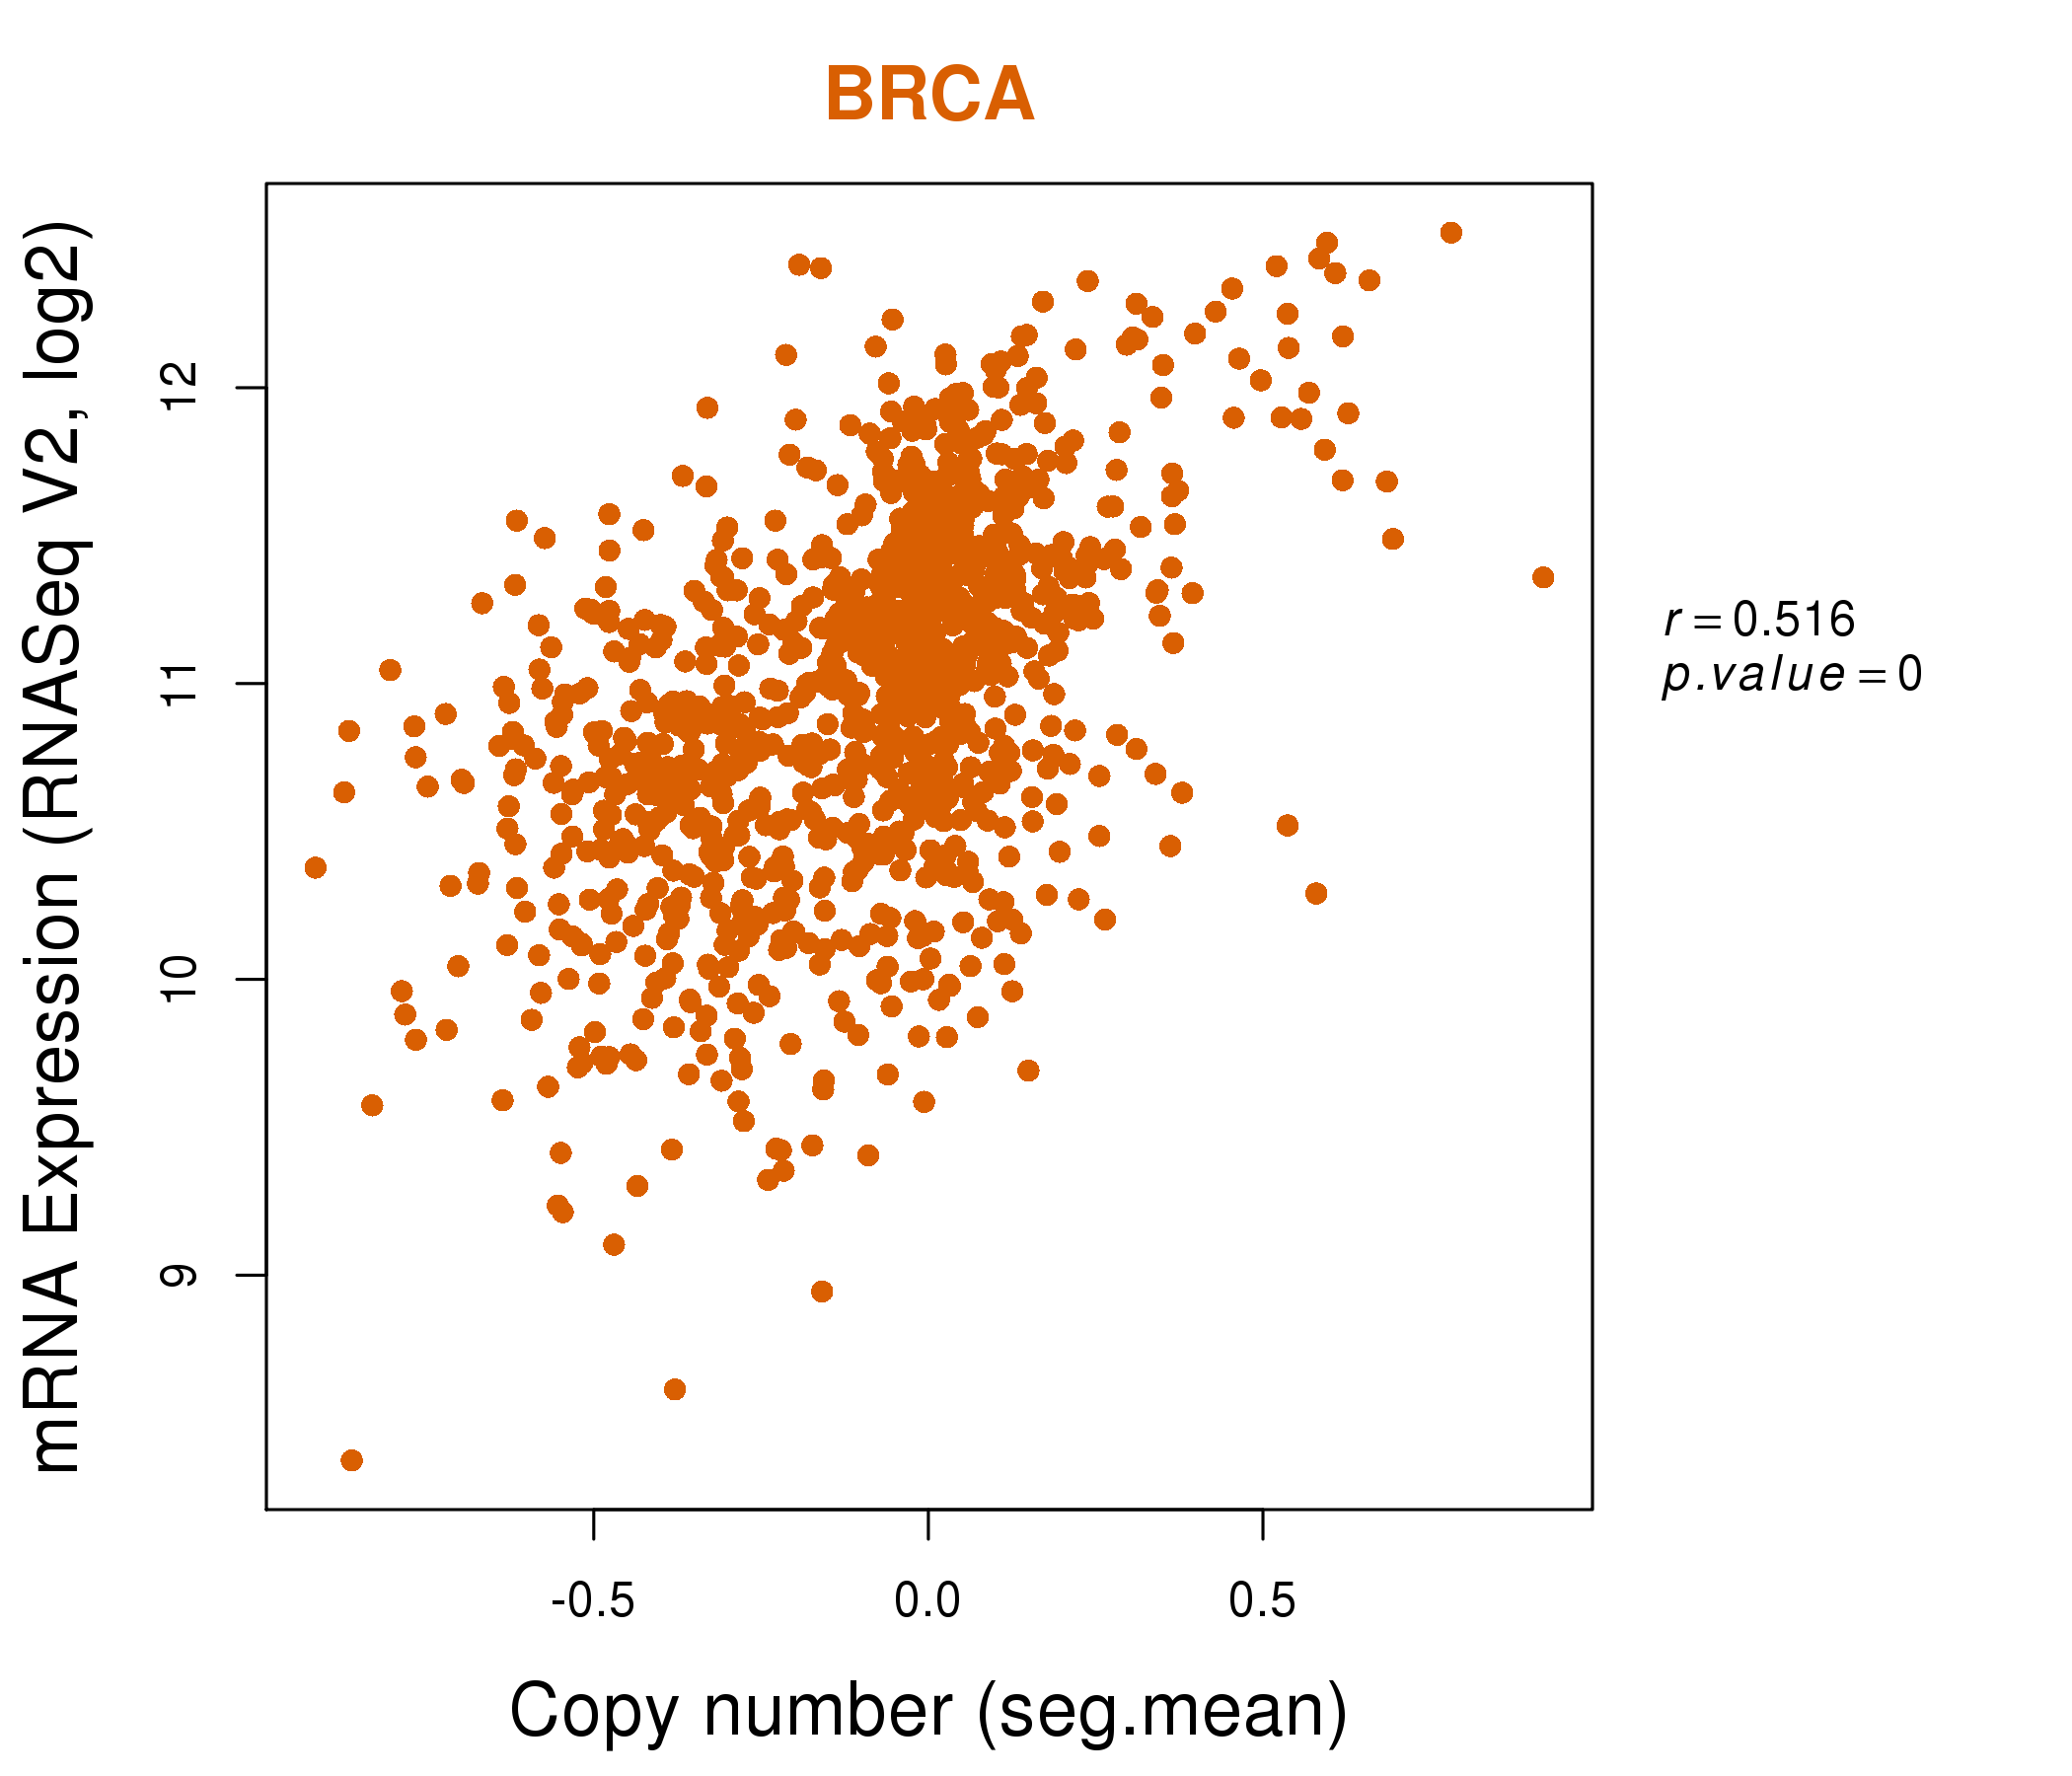
| * Normalized gene expression data of RNASeqV2 was extracted from TCGA using R package TCGA-Assembler. The URLs of all public data files on TCGA DCC data server were gathered at Jan-05-2015. Only eight cancer types have enough normal control samples for differential expression analysis. (t test, adjusted p<0.05 (using Benjamini-Hochberg FDR)) |
 |
| Top |
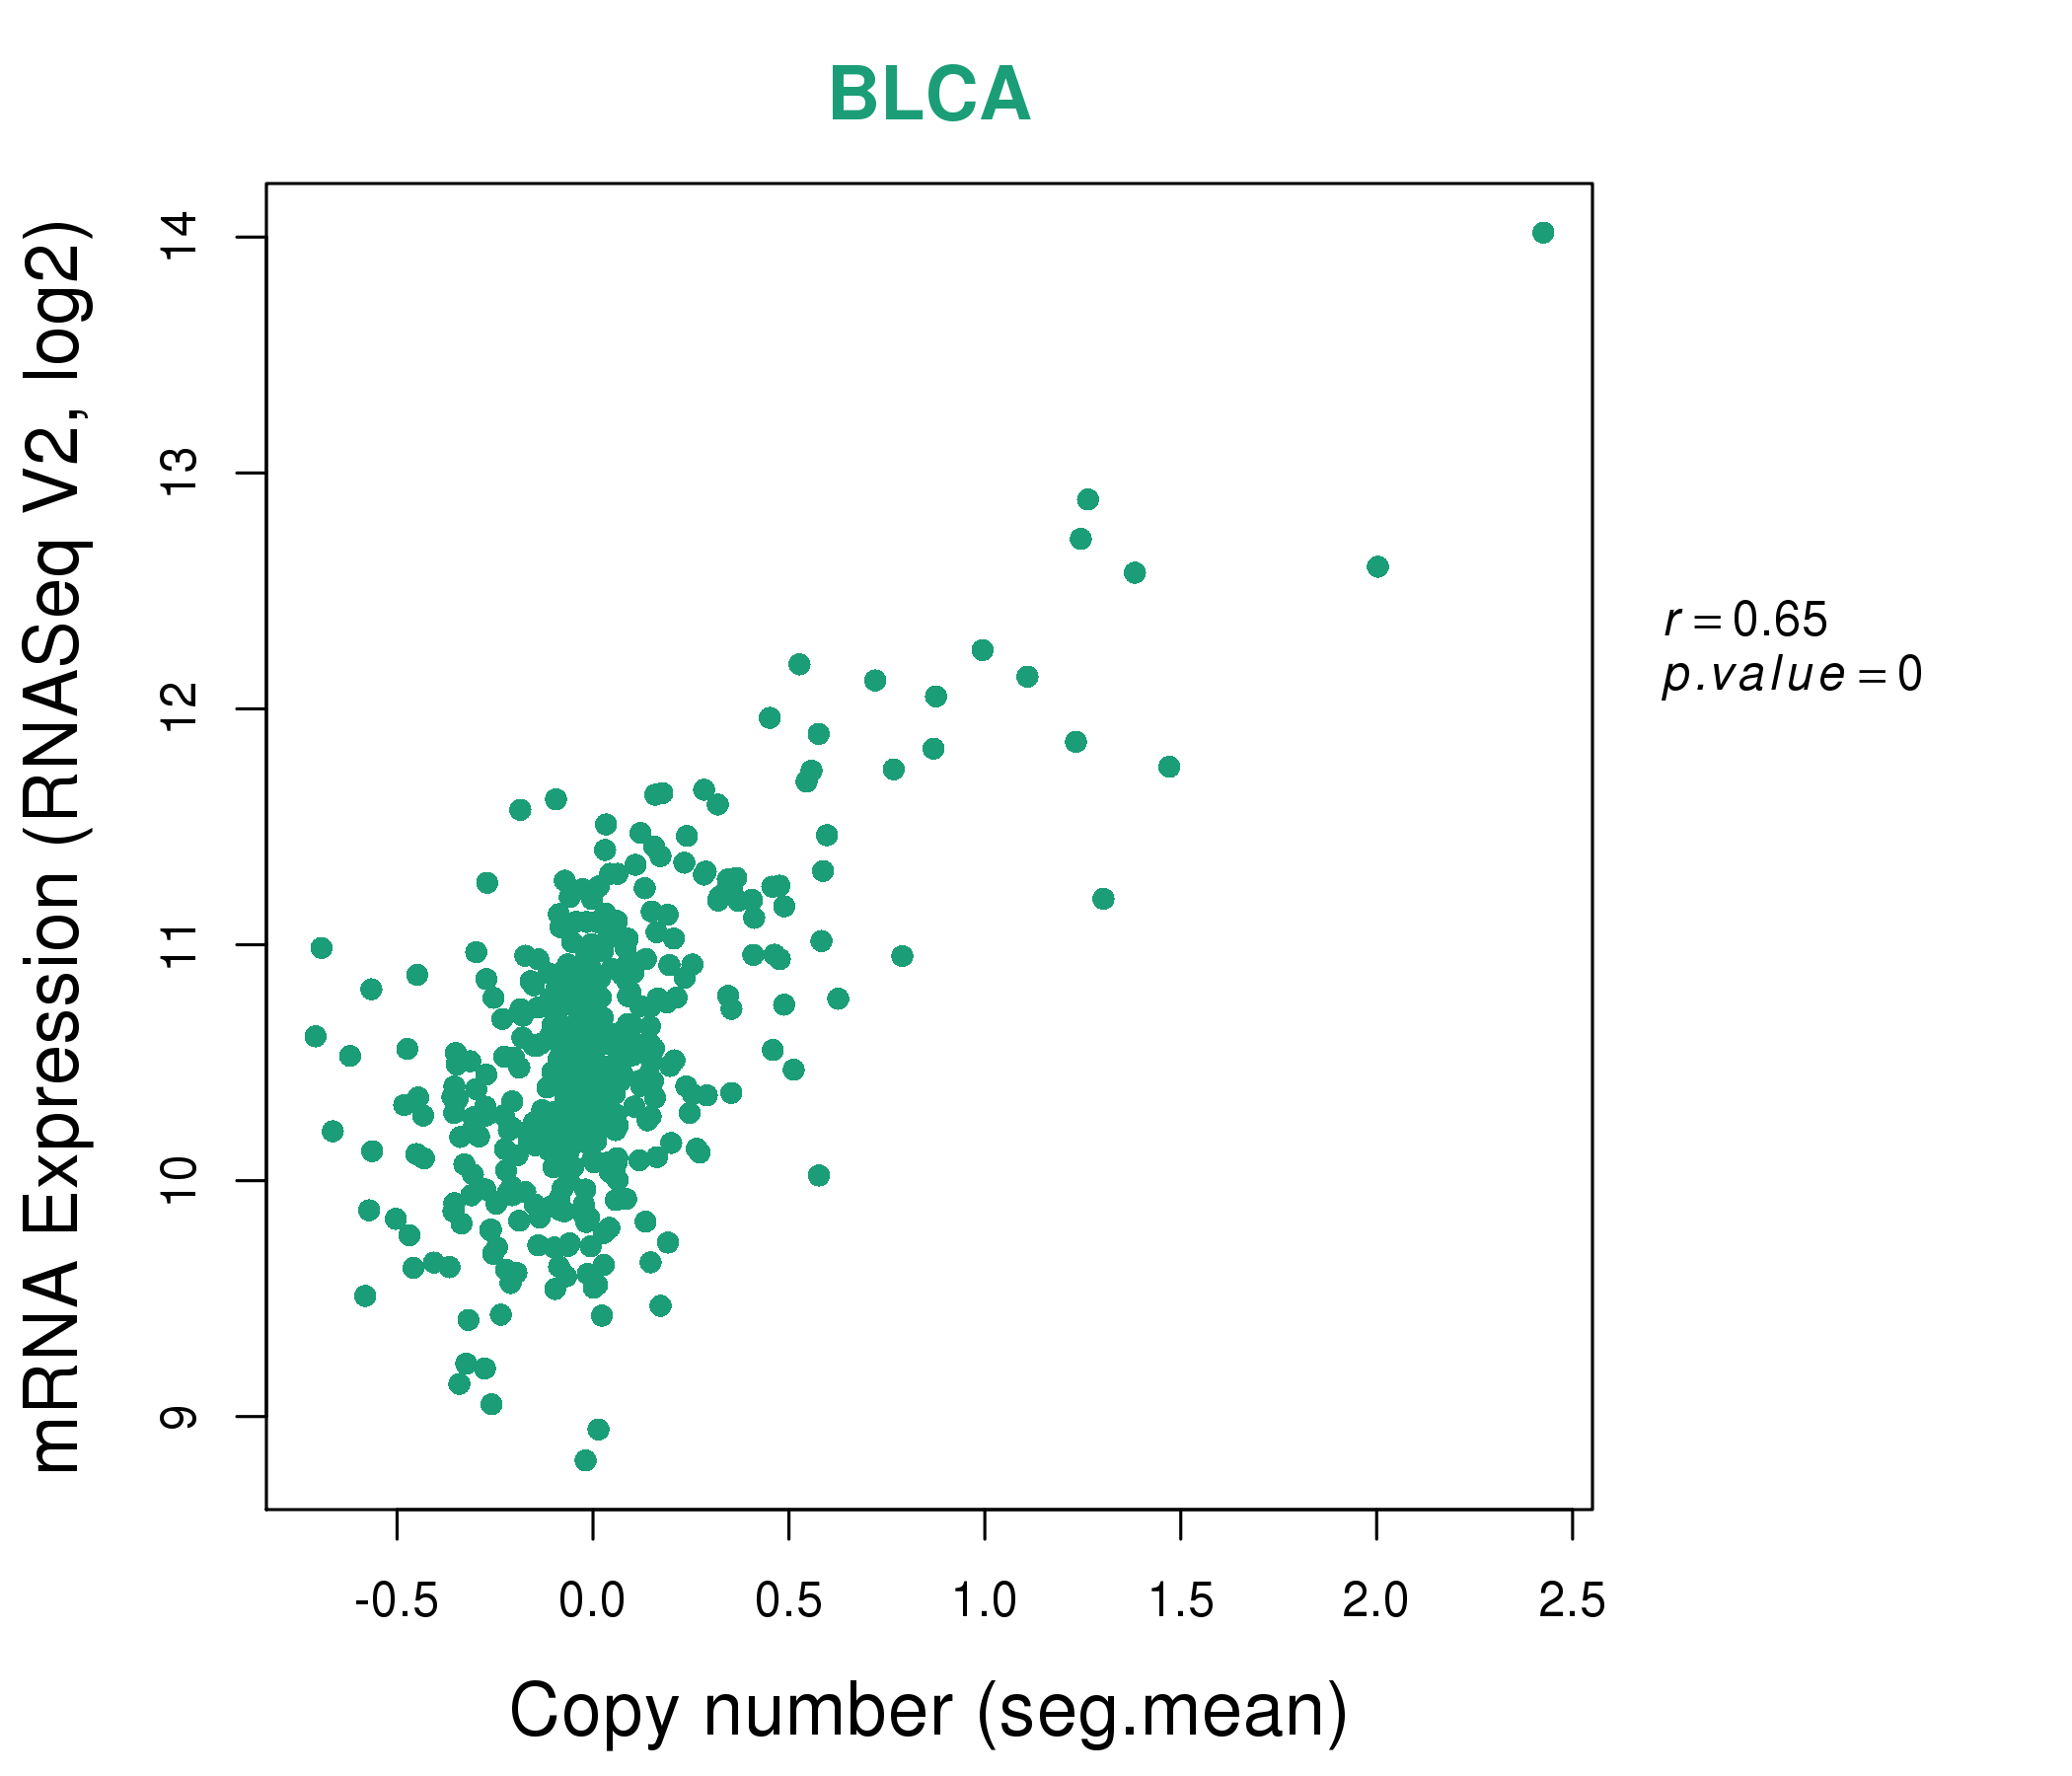
| * This plots show the correlation between CNV and gene expression. |
: Open all plots for all cancer types
 |
|
 |
|

| Top |
| Gene-Gene Network Information |
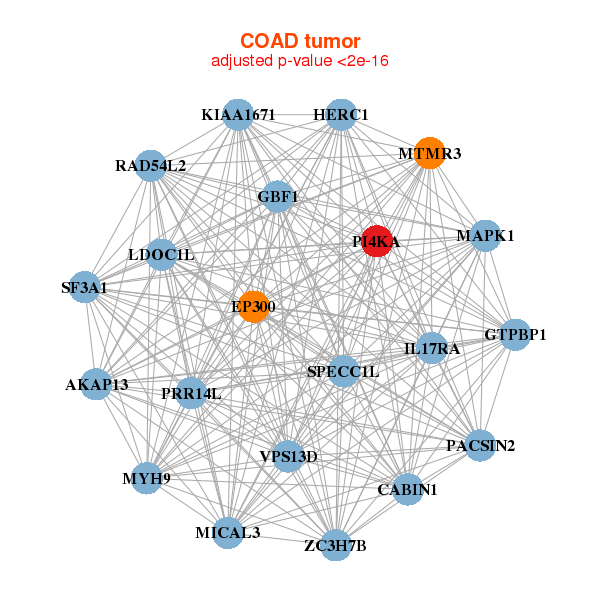
| * Co-Expression network figures were drawn using R package igraph. Only the top 20 genes with the highest correlations were shown. Red circle: input gene, orange circle: cell metabolism gene, sky circle: other gene |
: Open all plots for all cancer types
 |
|
| BAZ2A,BCL2L13,PRR14L,CABIN1,CDYL2,CRKL,SPECC1L, DEPDC5,EIF4ENIF1,EP300,HMGXB4,HPS4,LDOC1L,LRBA, MAPK1,MTMR3,PEX26,PI4KA,RASEF,SF3A1,SNAP29 | ANKRD52,ARID1A,PRRC2A,PRRC2B,SLX4,EP400,GCN1L1, HERC2,INCENP,ITPR3,KDM5C,KIAA0556,PI4KA,POLE, RSPH3,SEC16A,SEC24C,SMC1A,SNRNP200,SRCAP,TRRAP |
 |
|
| AKAP13,PRR14L,CABIN1,SPECC1L,EP300,GBF1,GTPBP1, HERC1,IL17RA,KIAA1671,LDOC1L,MAPK1,MICAL3,MTMR3, MYH9,PACSIN2,PI4KA,RAD54L2,SF3A1,VPS13D,ZC3H7B | BRD4,CREBBP,DHX38,EP300,FAM193A,FLII,GBF1, GTF3C1,HNRNPUL2,KDM2A,MED12,KAT6A,NCOR2,PI4KA, PTPN23,RAPGEF1,SMG6,SNRNP200,SUPT5H,UBR4,ZNF592 |


| * Co-Expression network figures were drawn using R package igraph. Only the top 20 genes with the highest correlations were shown. Red circle: input gene, orange circle: cell metabolism gene, sky circle: other gene |
: Open all plots for all cancer types
| Top |
: Open all interacting genes' information including KEGG pathway for all interacting genes from DAVID
| Top |
| Pharmacological Information for PI4KA |
| There's no related Drug. |
| Top |
| Cross referenced IDs for PI4KA |
| * We obtained these cross-references from Uniprot database. It covers 150 different DBs, 18 categories. http://www.uniprot.org/help/cross_references_section |
: Open all cross reference information
|
Copyright © 2016-Present - The Univsersity of Texas Health Science Center at Houston @ |