|
||||||||||||||||||||
| |
| Phenotypic Information (metabolism pathway, cancer, disease, phenome) |
| |
| |
| Gene-Gene Network Information: Co-Expression Network, Interacting Genes & KEGG |
| |
|


| Gene Summary for ACP2 |
| Top |
| Phenotypic Information for ACP2(metabolism pathway, cancer, disease, phenome) |
| Cancer | CGAP: ACP2 |
| Familial Cancer Database: ACP2 | |
| * This gene is included in those cancer gene databases. |
|
|
|
|
|
| . | ||||||||||||||
Oncogene 1 | Significant driver gene in | |||||||||||||||||||
| cf) number; DB name 1 Oncogene; http://nar.oxfordjournals.org/content/35/suppl_1/D721.long, 2 Tumor Suppressor gene; https://bioinfo.uth.edu/TSGene/, 3 Cancer Gene Census; http://www.nature.com/nrc/journal/v4/n3/abs/nrc1299.html, 4 CancerGenes; http://nar.oxfordjournals.org/content/35/suppl_1/D721.long, 5 Network of Cancer Gene; http://ncg.kcl.ac.uk/index.php, 1Therapeutic Vulnerabilities in Cancer; http://cbio.mskcc.org/cancergenomics/statius/ |
| KEGG_RIBOFLAVIN_METABOLISM | |
| OMIM | |
| Orphanet | |
| Disease | KEGG Disease: ACP2 |
| MedGen: ACP2 (Human Medical Genetics with Condition) | |
| ClinVar: ACP2 | |
| Phenotype | MGI: ACP2 (International Mouse Phenotyping Consortium) |
| PhenomicDB: ACP2 | |
| Mutations for ACP2 |
| * Under tables are showing count per each tissue to give us broad intuition about tissue specific mutation patterns.You can go to the detailed page for each mutation database's web site. |
| - Statistics for Tissue and Mutation type | Top |
 |
| - For Inter-chromosomal Variations |
| There's no inter-chromosomal structural variation. |
| - For Intra-chromosomal Variations |
| * Intra-chromosomal variantions includes 'intrachromosomal amplicon to amplicon', 'intrachromosomal amplicon to non-amplified dna', 'intrachromosomal deletion', 'intrachromosomal fold-back inversion', 'intrachromosomal inversion', 'intrachromosomal tandem duplication', 'Intrachromosomal unknown type', 'intrachromosomal with inverted orientation', 'intrachromosomal with non-inverted orientation'. |
 |
| Sample | Symbol_a | Chr_a | Start_a | End_a | Symbol_b | Chr_b | Start_b | End_b |
| pancreas | ACP2 | chr11 | 47263375 | 47263395 | DDB2 | chr11 | 47242257 | 47242277 |
| cf) Tissue number; Tissue name (1;Breast, 2;Central_nervous_system, 3;Haematopoietic_and_lymphoid_tissue, 4;Large_intestine, 5;Liver, 6;Lung, 7;Ovary, 8;Pancreas, 9;Prostate, 10;Skin, 11;Soft_tissue, 12;Upper_aerodigestive_tract) |
| * From mRNA Sanger sequences, Chitars2.0 arranged chimeric transcripts. This table shows ACP2 related fusion information. |
| ID | Head Gene | Tail Gene | Accession | Gene_a | qStart_a | qEnd_a | Chromosome_a | tStart_a | tEnd_a | Gene_a | qStart_a | qEnd_a | Chromosome_a | tStart_a | tEnd_a |
| DA582448 | ACP2 | 96 | 438 | 11 | 47267353 | 47270356 | MRVI1-AS1 | 428 | 540 | 11 | 10590053 | 10590165 | |
| AK097626 | ACP2 | 1 | 1919 | 11 | 47268438 | 47270356 | KIRREL3 | 1912 | 2067 | 11 | 126792984 | 126793353 | |
| Top |
| There's no copy number variation information in COSMIC data for this gene. |
| Top |
|
 |
| Top |
| Stat. for Non-Synonymous SNVs (# total SNVs=31) | (# total SNVs=7) |
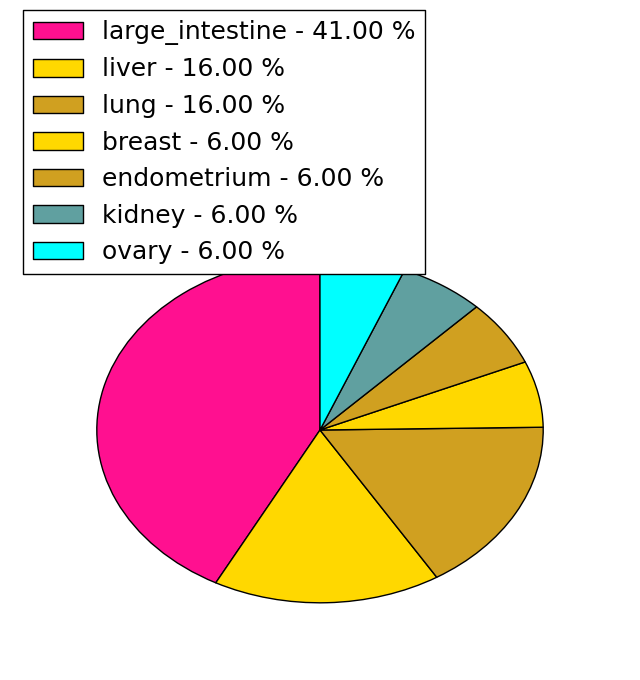 | 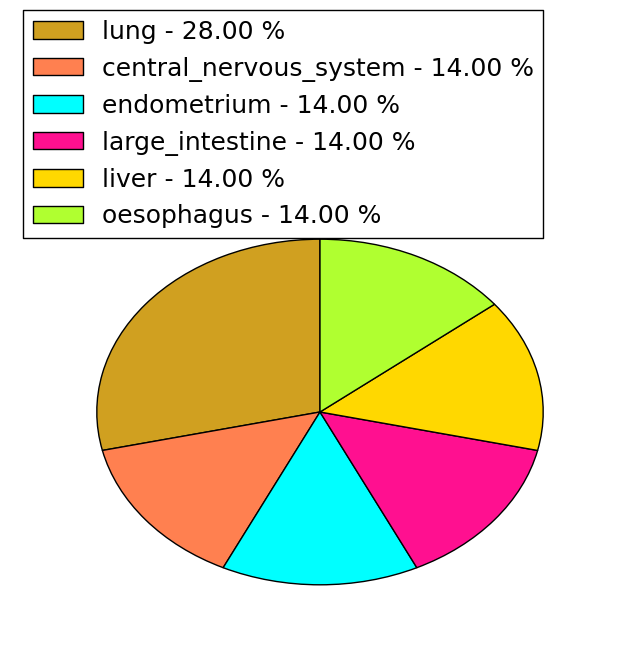 |
(# total SNVs=1) | (# total SNVs=1) |
 |  |
| Top |
| * When you move the cursor on each content, you can see more deailed mutation information on the Tooltip. Those are primary_site,primary_histology,mutation(aa),pubmedID. |
| GRCh37 position | Mutation(aa) | Unique sampleID count |
| chr11:47264443-47264443 | p.F323F | 2 |
| chr11:47269233-47269233 | p.R86C | 2 |
| chr11:47269678-47269678 | p.R41C | 2 |
| chr11:47266897-47266897 | p.L200L | 2 |
| chr11:47261788-47261788 | p.A384V | 2 |
| chr11:47267093-47267093 | p.R161C | 2 |
| chr11:47266388-47266388 | p.A224T | 1 |
| chr11:47267247-47267247 | p.I146V | 1 |
| chr11:47264624-47264624 | p.E303K | 1 |
| chr11:47269242-47269242 | p.L83V | 1 |
| Top |
|
 |
| Point Mutation/ Tissue ID | 1 | 2 | 3 | 4 | 5 | 6 | 7 | 8 | 9 | 10 | 11 | 12 | 13 | 14 | 15 | 16 | 17 | 18 | 19 | 20 |
| # sample | 1 | 8 | 1 | 1 | 2 | 1 | 1 | 4 | 4 | 3 | ||||||||||
| # mutation | 1 | 8 | 1 | 1 | 2 | 1 | 1 | 4 | 4 | 3 | ||||||||||
| nonsynonymous SNV | 7 | 1 | 1 | 2 | 1 | 1 | 1 | 2 | 2 | |||||||||||
| synonymous SNV | 1 | 1 | 3 | 2 | 1 |
| cf) Tissue ID; Tissue type (1; BLCA[Bladder Urothelial Carcinoma], 2; BRCA[Breast invasive carcinoma], 3; CESC[Cervical squamous cell carcinoma and endocervical adenocarcinoma], 4; COAD[Colon adenocarcinoma], 5; GBM[Glioblastoma multiforme], 6; Glioma Low Grade, 7; HNSC[Head and Neck squamous cell carcinoma], 8; KICH[Kidney Chromophobe], 9; KIRC[Kidney renal clear cell carcinoma], 10; KIRP[Kidney renal papillary cell carcinoma], 11; LAML[Acute Myeloid Leukemia], 12; LUAD[Lung adenocarcinoma], 13; LUSC[Lung squamous cell carcinoma], 14; OV[Ovarian serous cystadenocarcinoma ], 15; PAAD[Pancreatic adenocarcinoma], 16; PRAD[Prostate adenocarcinoma], 17; SKCM[Skin Cutaneous Melanoma], 18:STAD[Stomach adenocarcinoma], 19:THCA[Thyroid carcinoma], 20:UCEC[Uterine Corpus Endometrial Carcinoma]) |
| Top |
| * We represented just top 10 SNVs. When you move the cursor on each content, you can see more deailed mutation information on the Tooltip. Those are primary_site, primary_histology, mutation(aa), pubmedID. |
| Genomic Position | Mutation(aa) | Unique sampleID count |
| chr11:47264815 | p.W204R | 1 |
| chr11:47267287 | p.E201E | 1 |
| chr11:47264838 | p.G194V | 1 |
| chr11:47267305 | p.R181Q | 1 |
| chr11:47264856 | p.R414H | 1 |
| chr11:47267352 | p.S180F | 1 |
| chr11:47261698 | p.V402I | 1 |
| chr11:47266884 | p.R161C | 1 |
| chr11:47267355 | p.Q352Q | 1 |
| chr11:47261735 | p.I146V,ACP2 | 1 |
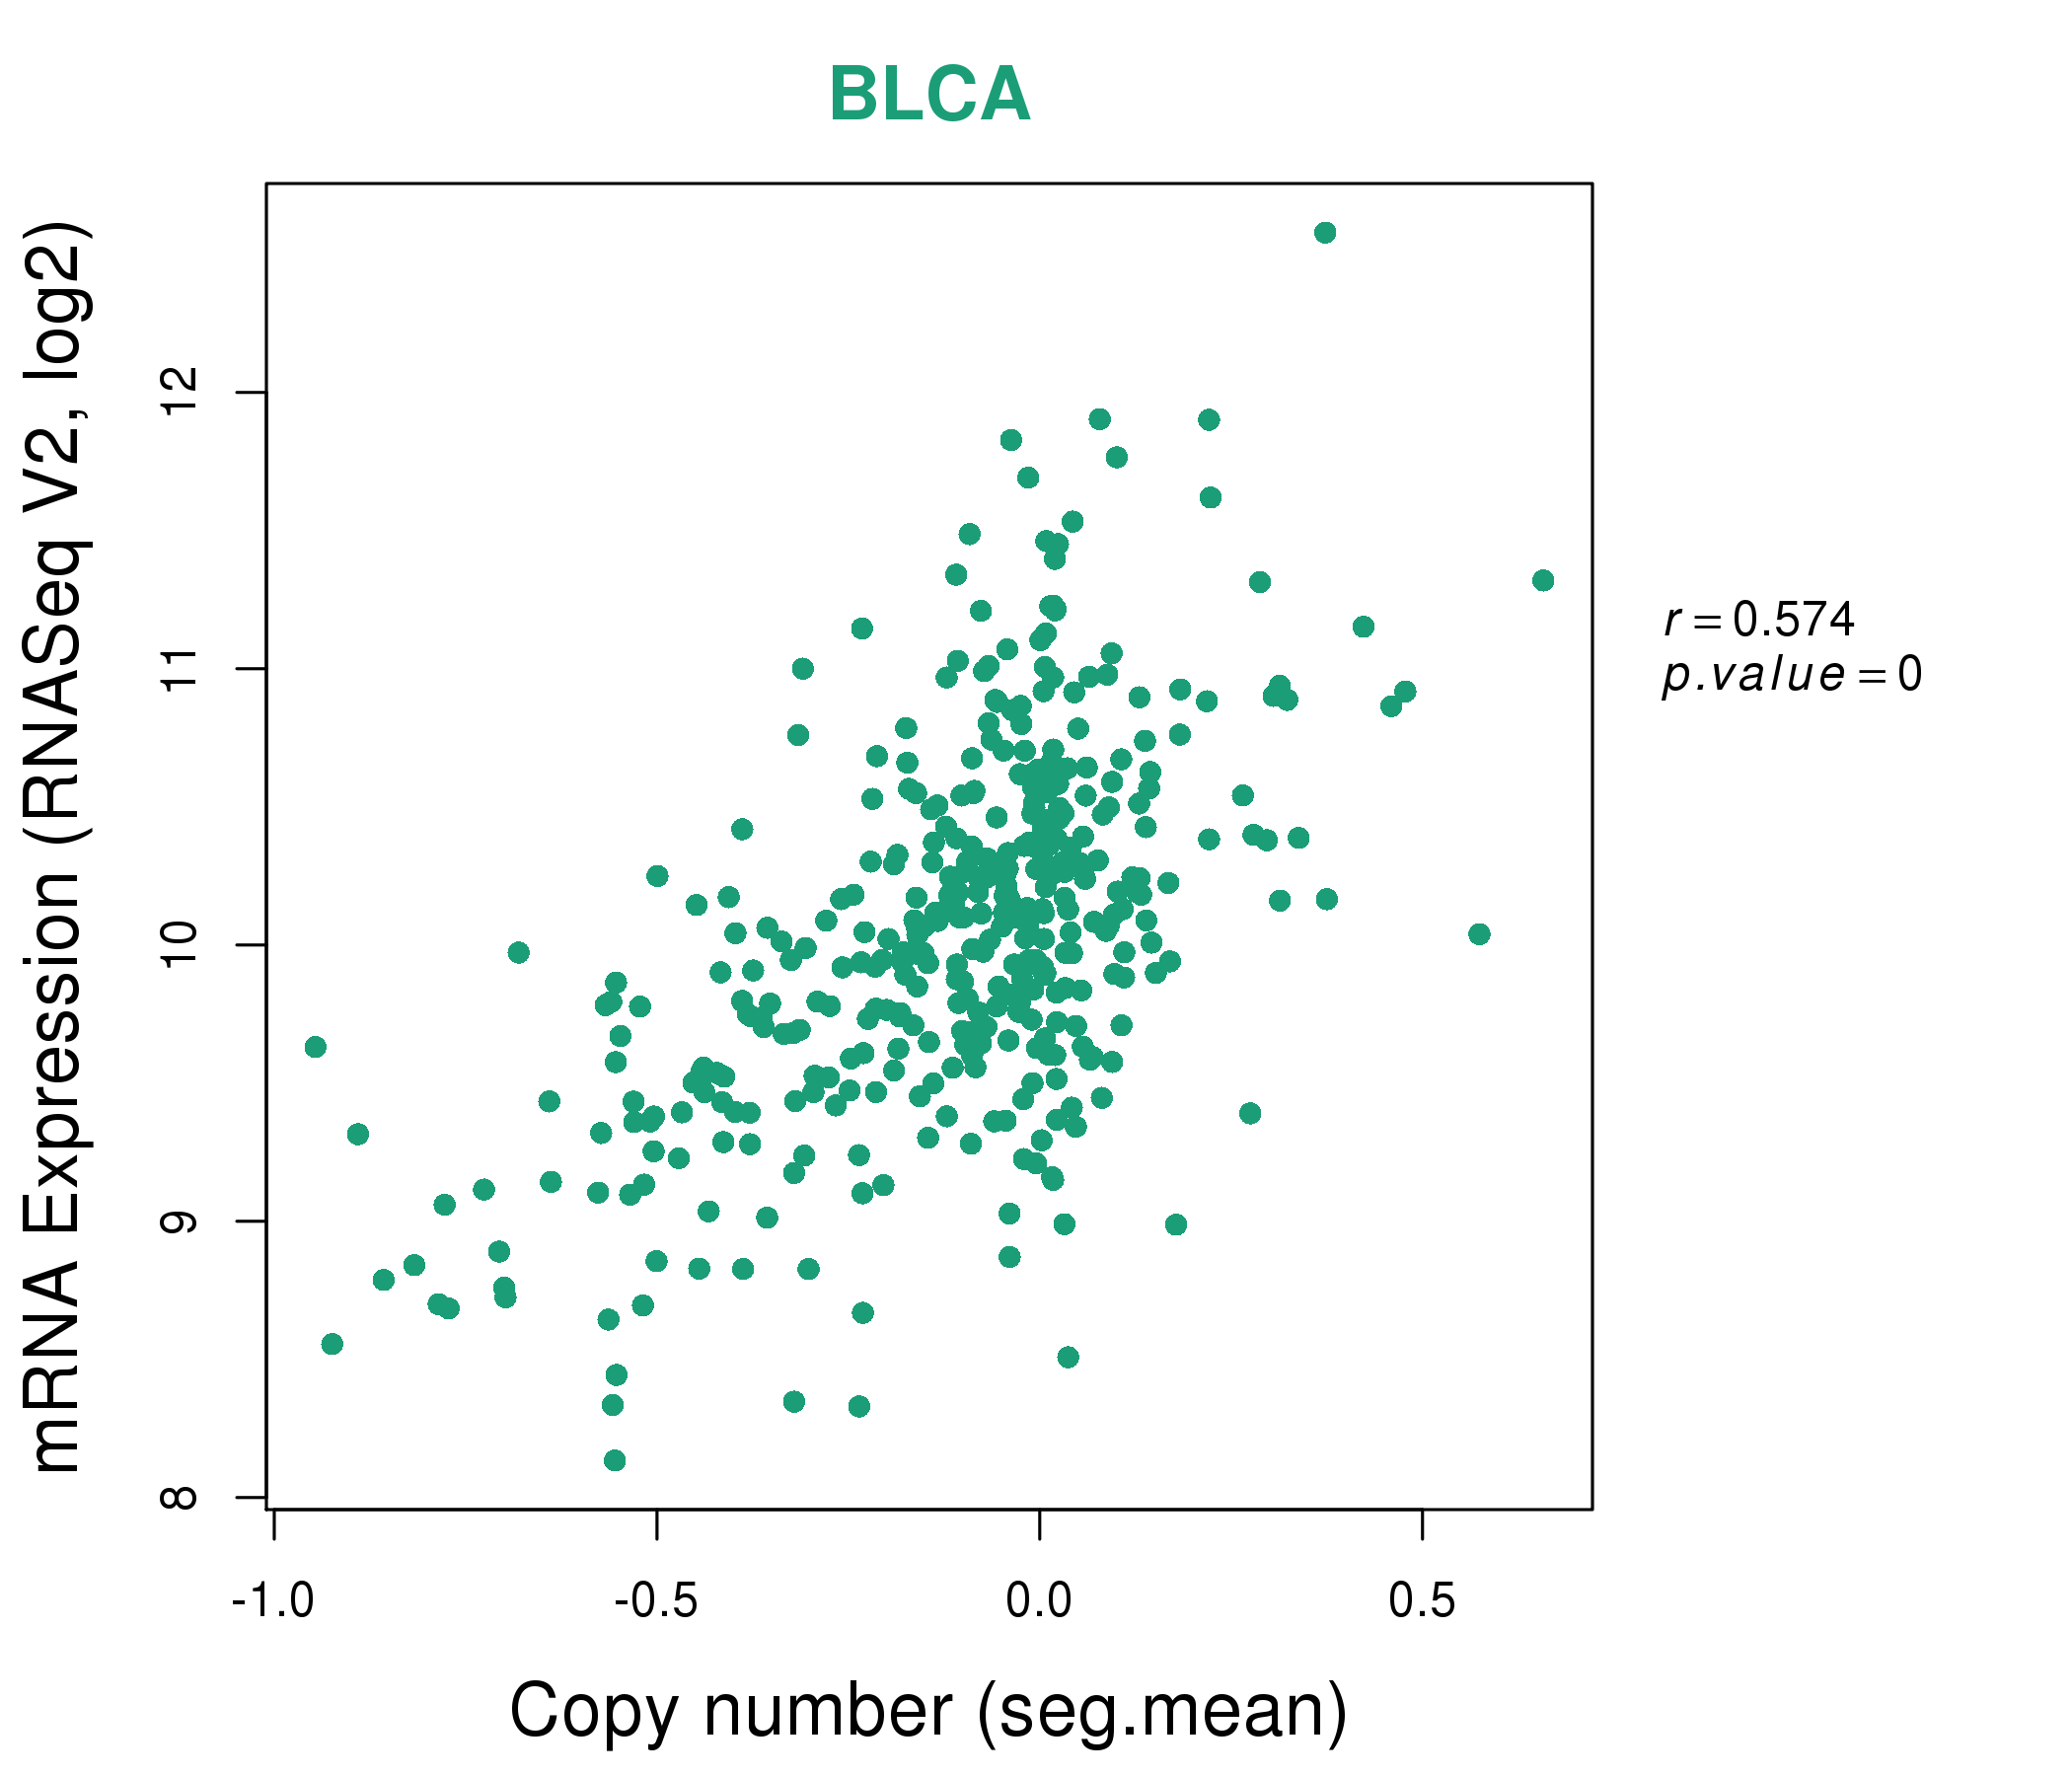
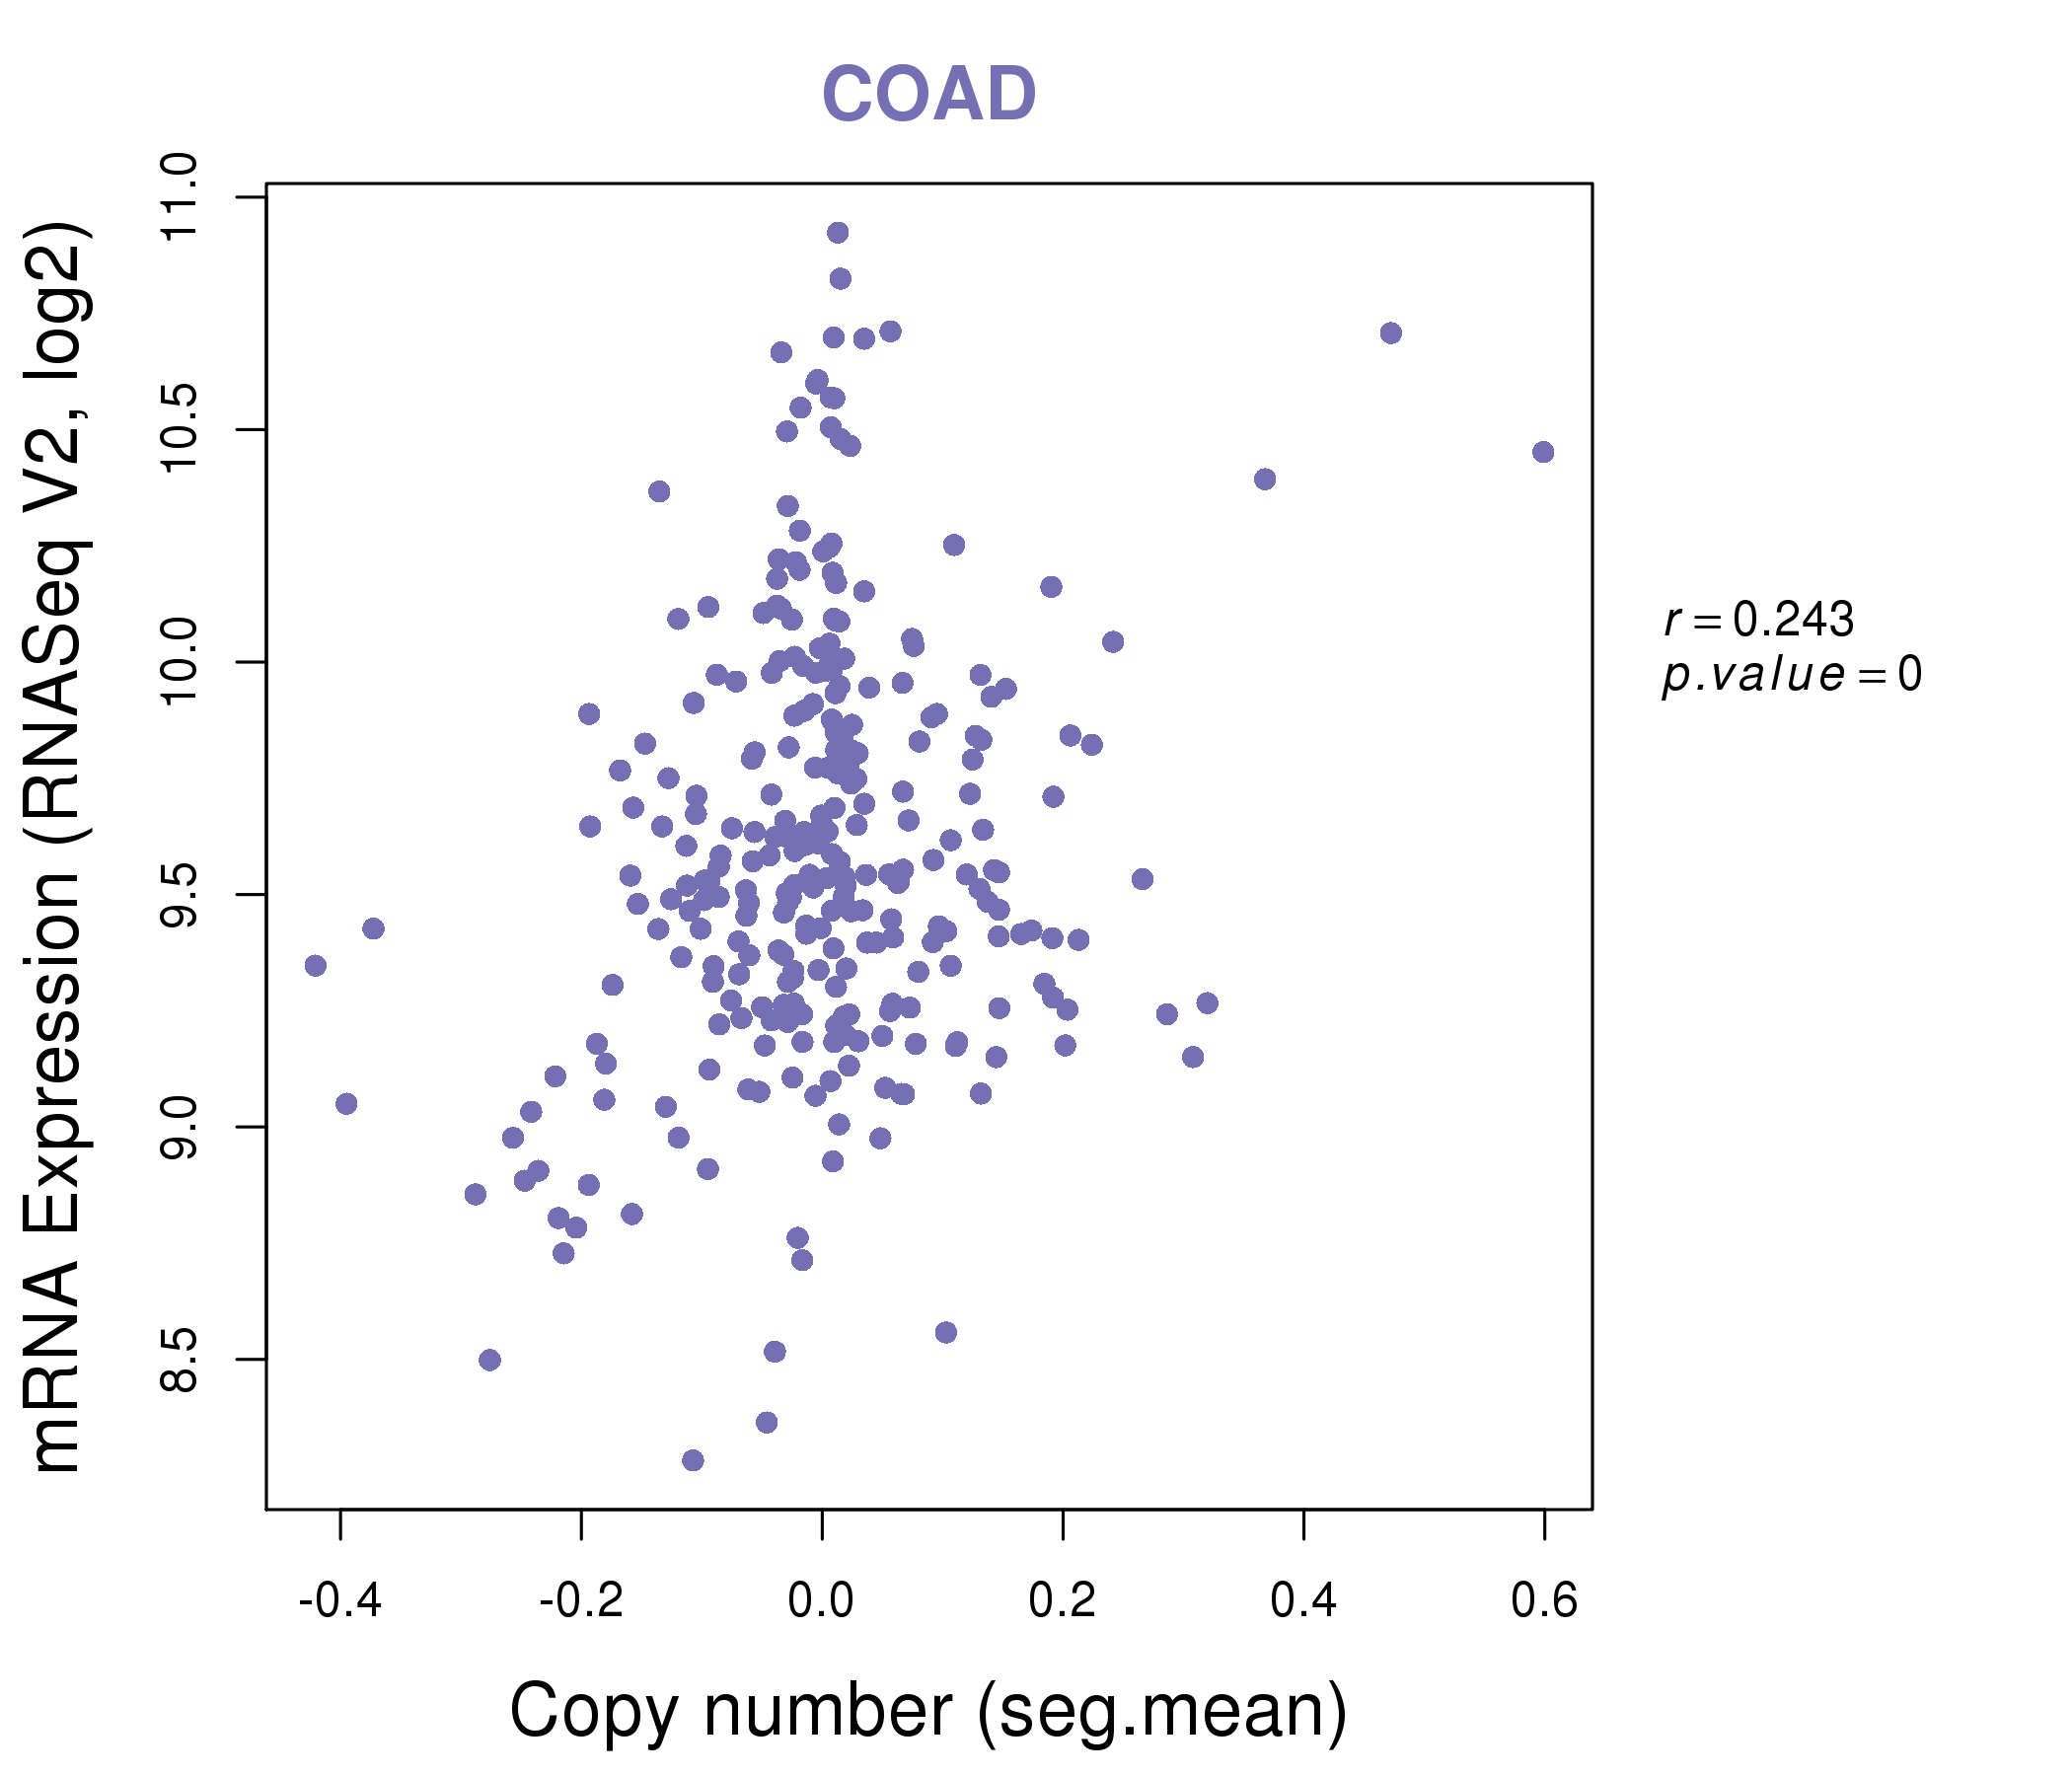
| * Copy number data were extracted from TCGA using R package TCGA-Assembler. The URLs of all public data files on TCGA DCC data server were gathered on Jan-05-2015. Function ProcessCNAData in TCGA-Assembler package was used to obtain gene-level copy number value which is calculated as the average copy number of the genomic region of a gene. |
 |
| cf) Tissue ID[Tissue type]: BLCA[Bladder Urothelial Carcinoma], BRCA[Breast invasive carcinoma], CESC[Cervical squamous cell carcinoma and endocervical adenocarcinoma], COAD[Colon adenocarcinoma], GBM[Glioblastoma multiforme], Glioma Low Grade, HNSC[Head and Neck squamous cell carcinoma], KICH[Kidney Chromophobe], KIRC[Kidney renal clear cell carcinoma], KIRP[Kidney renal papillary cell carcinoma], LAML[Acute Myeloid Leukemia], LUAD[Lung adenocarcinoma], LUSC[Lung squamous cell carcinoma], OV[Ovarian serous cystadenocarcinoma ], PAAD[Pancreatic adenocarcinoma], PRAD[Prostate adenocarcinoma], SKCM[Skin Cutaneous Melanoma], STAD[Stomach adenocarcinoma], THCA[Thyroid carcinoma], UCEC[Uterine Corpus Endometrial Carcinoma] |
| Top |
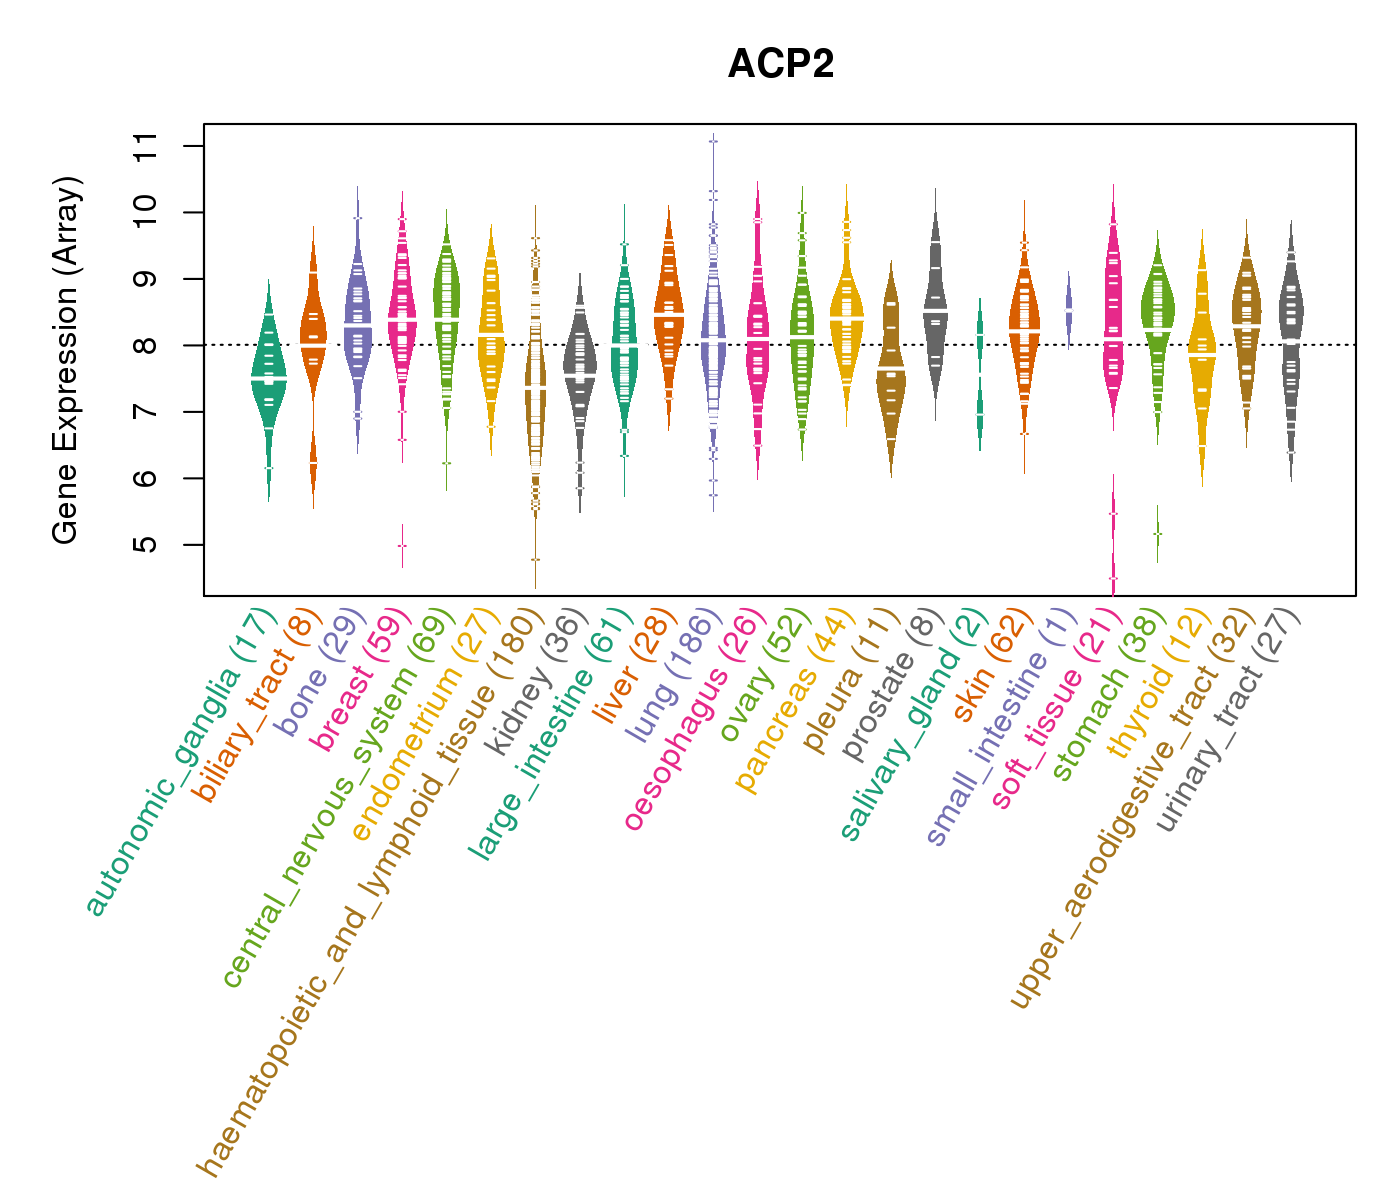
| Gene Expression for ACP2 |
| * CCLE gene expression data were extracted from CCLE_Expression_Entrez_2012-10-18.res: Gene-centric RMA-normalized mRNA expression data. |
 |
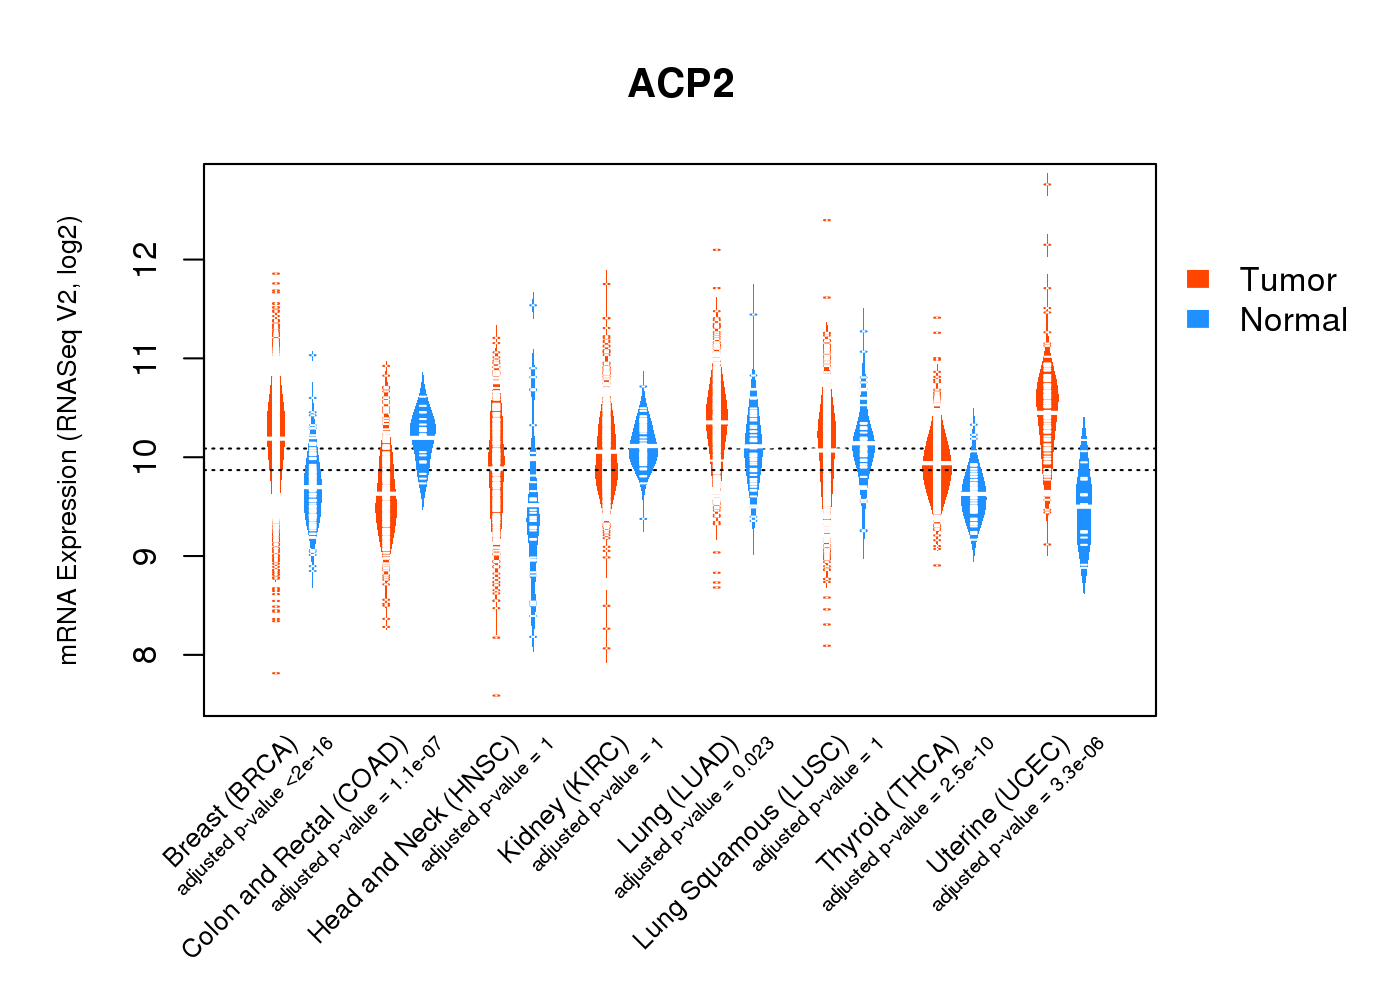
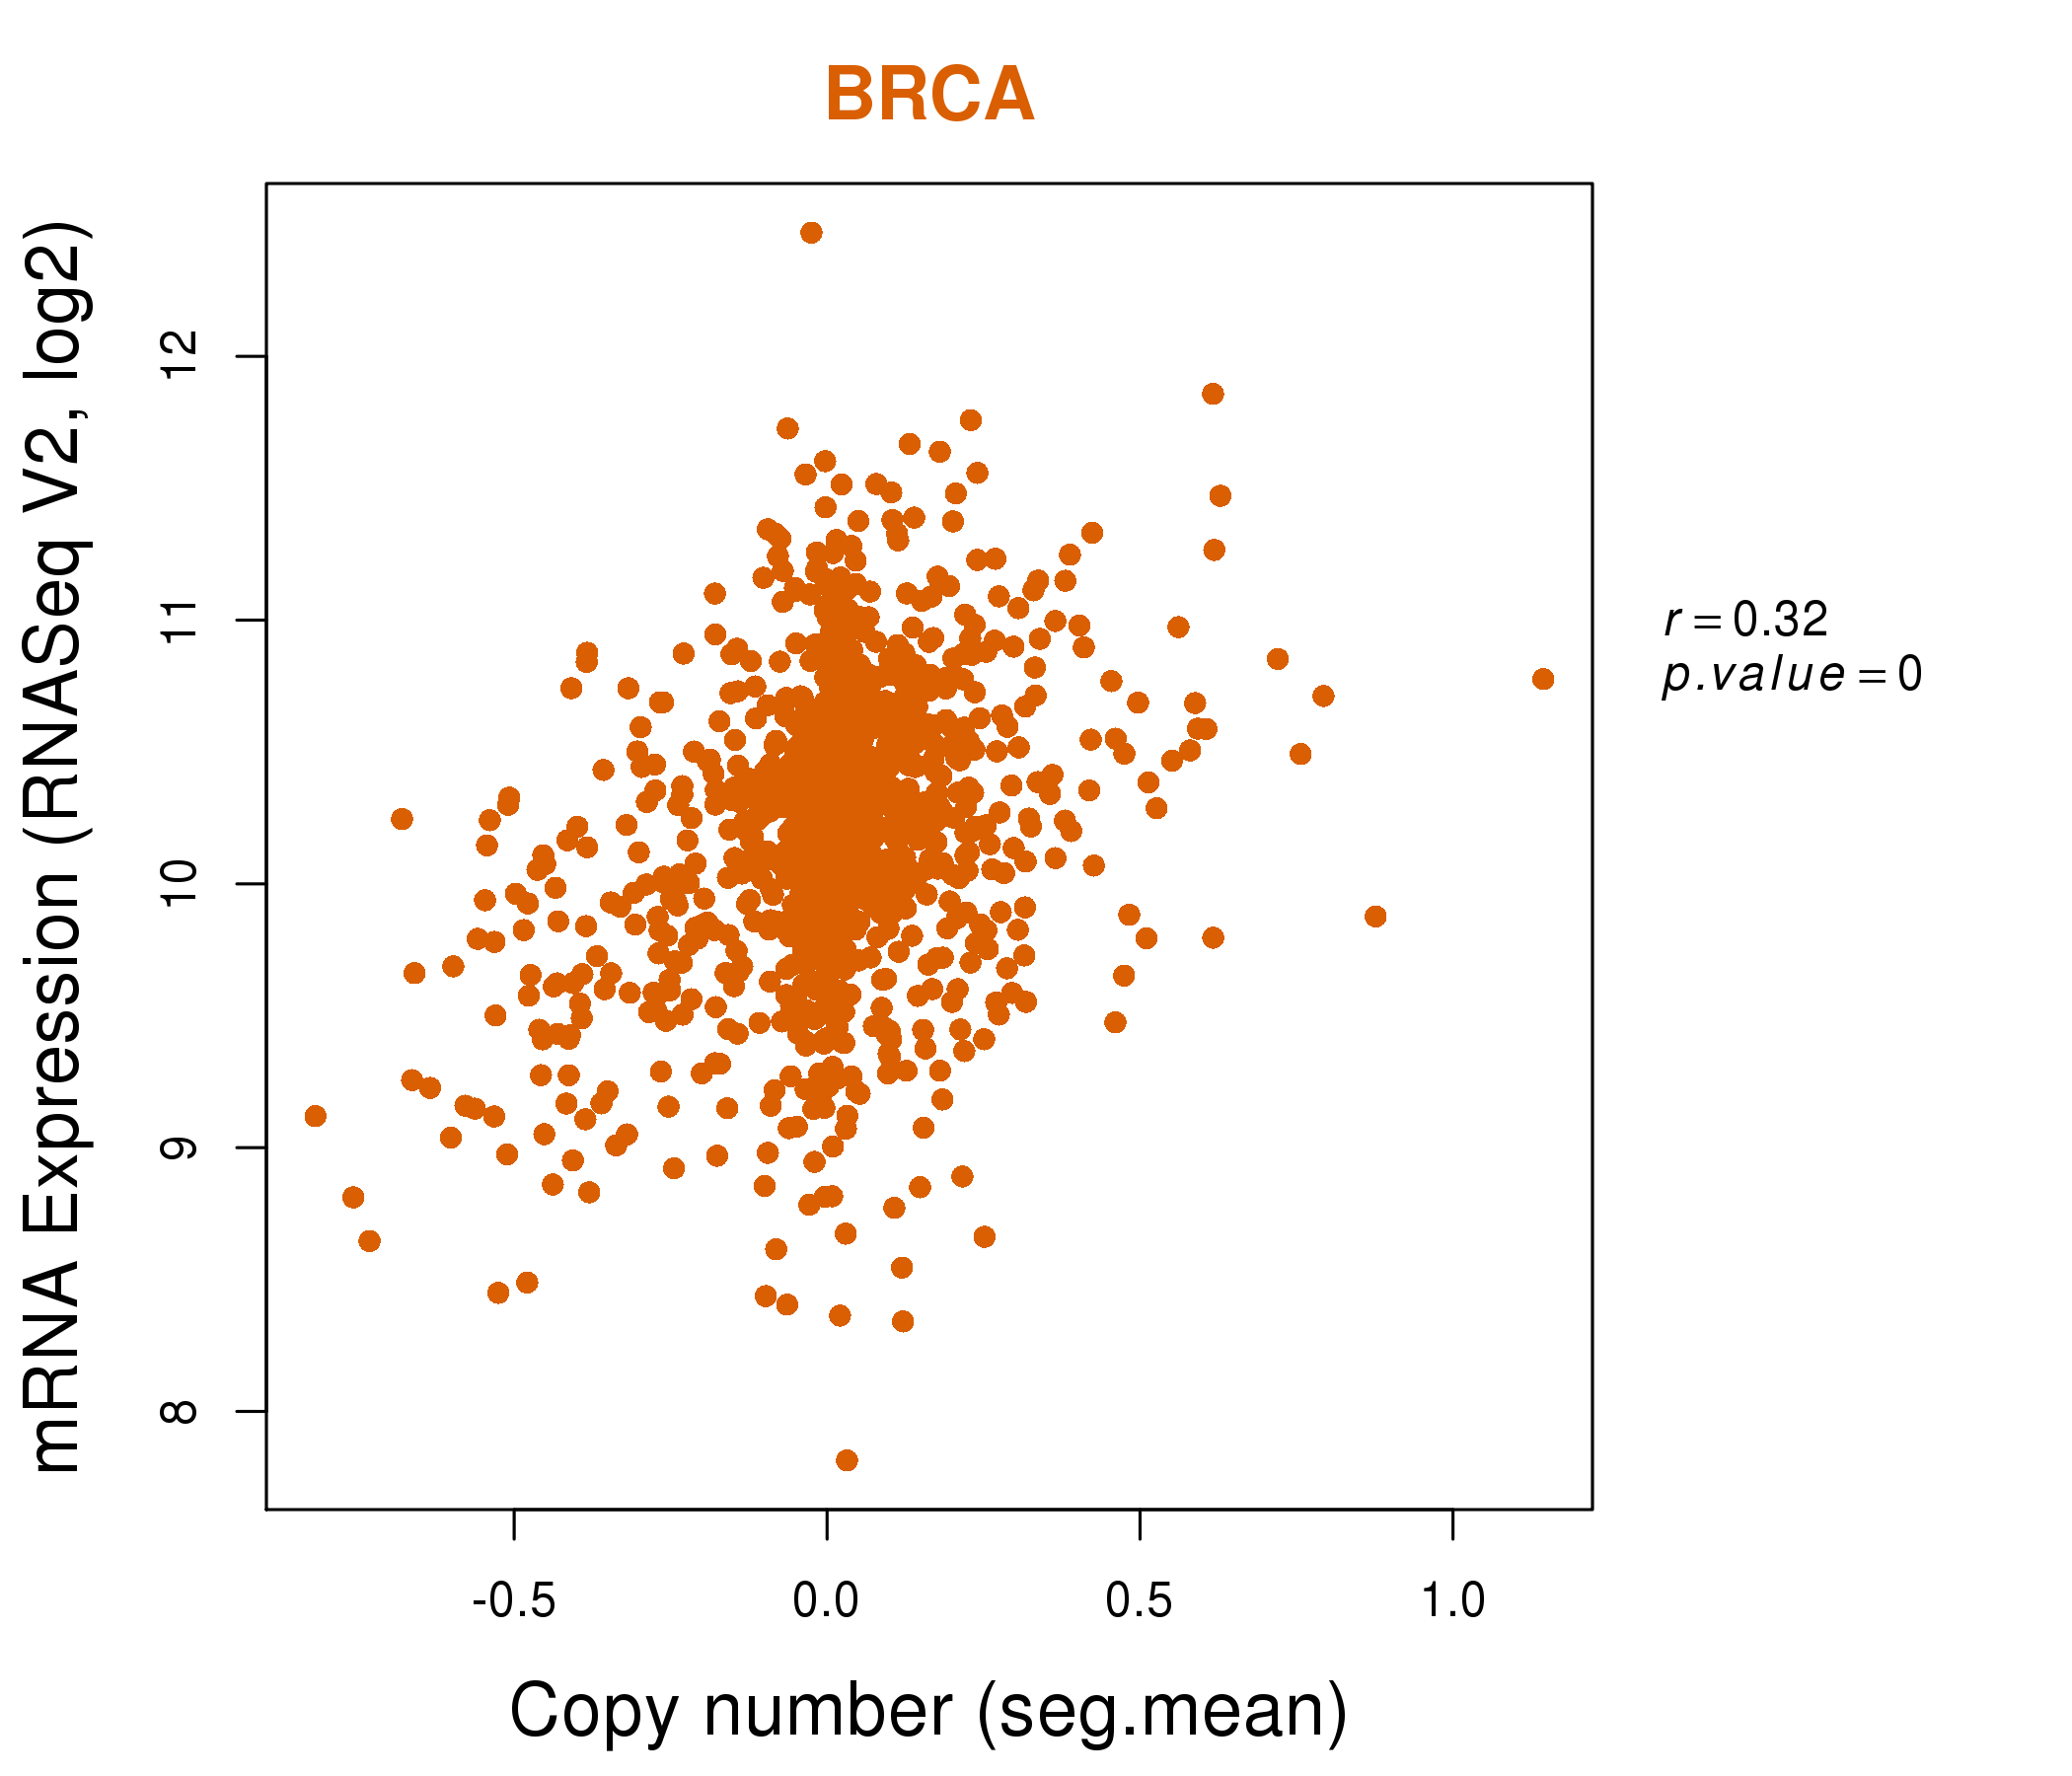
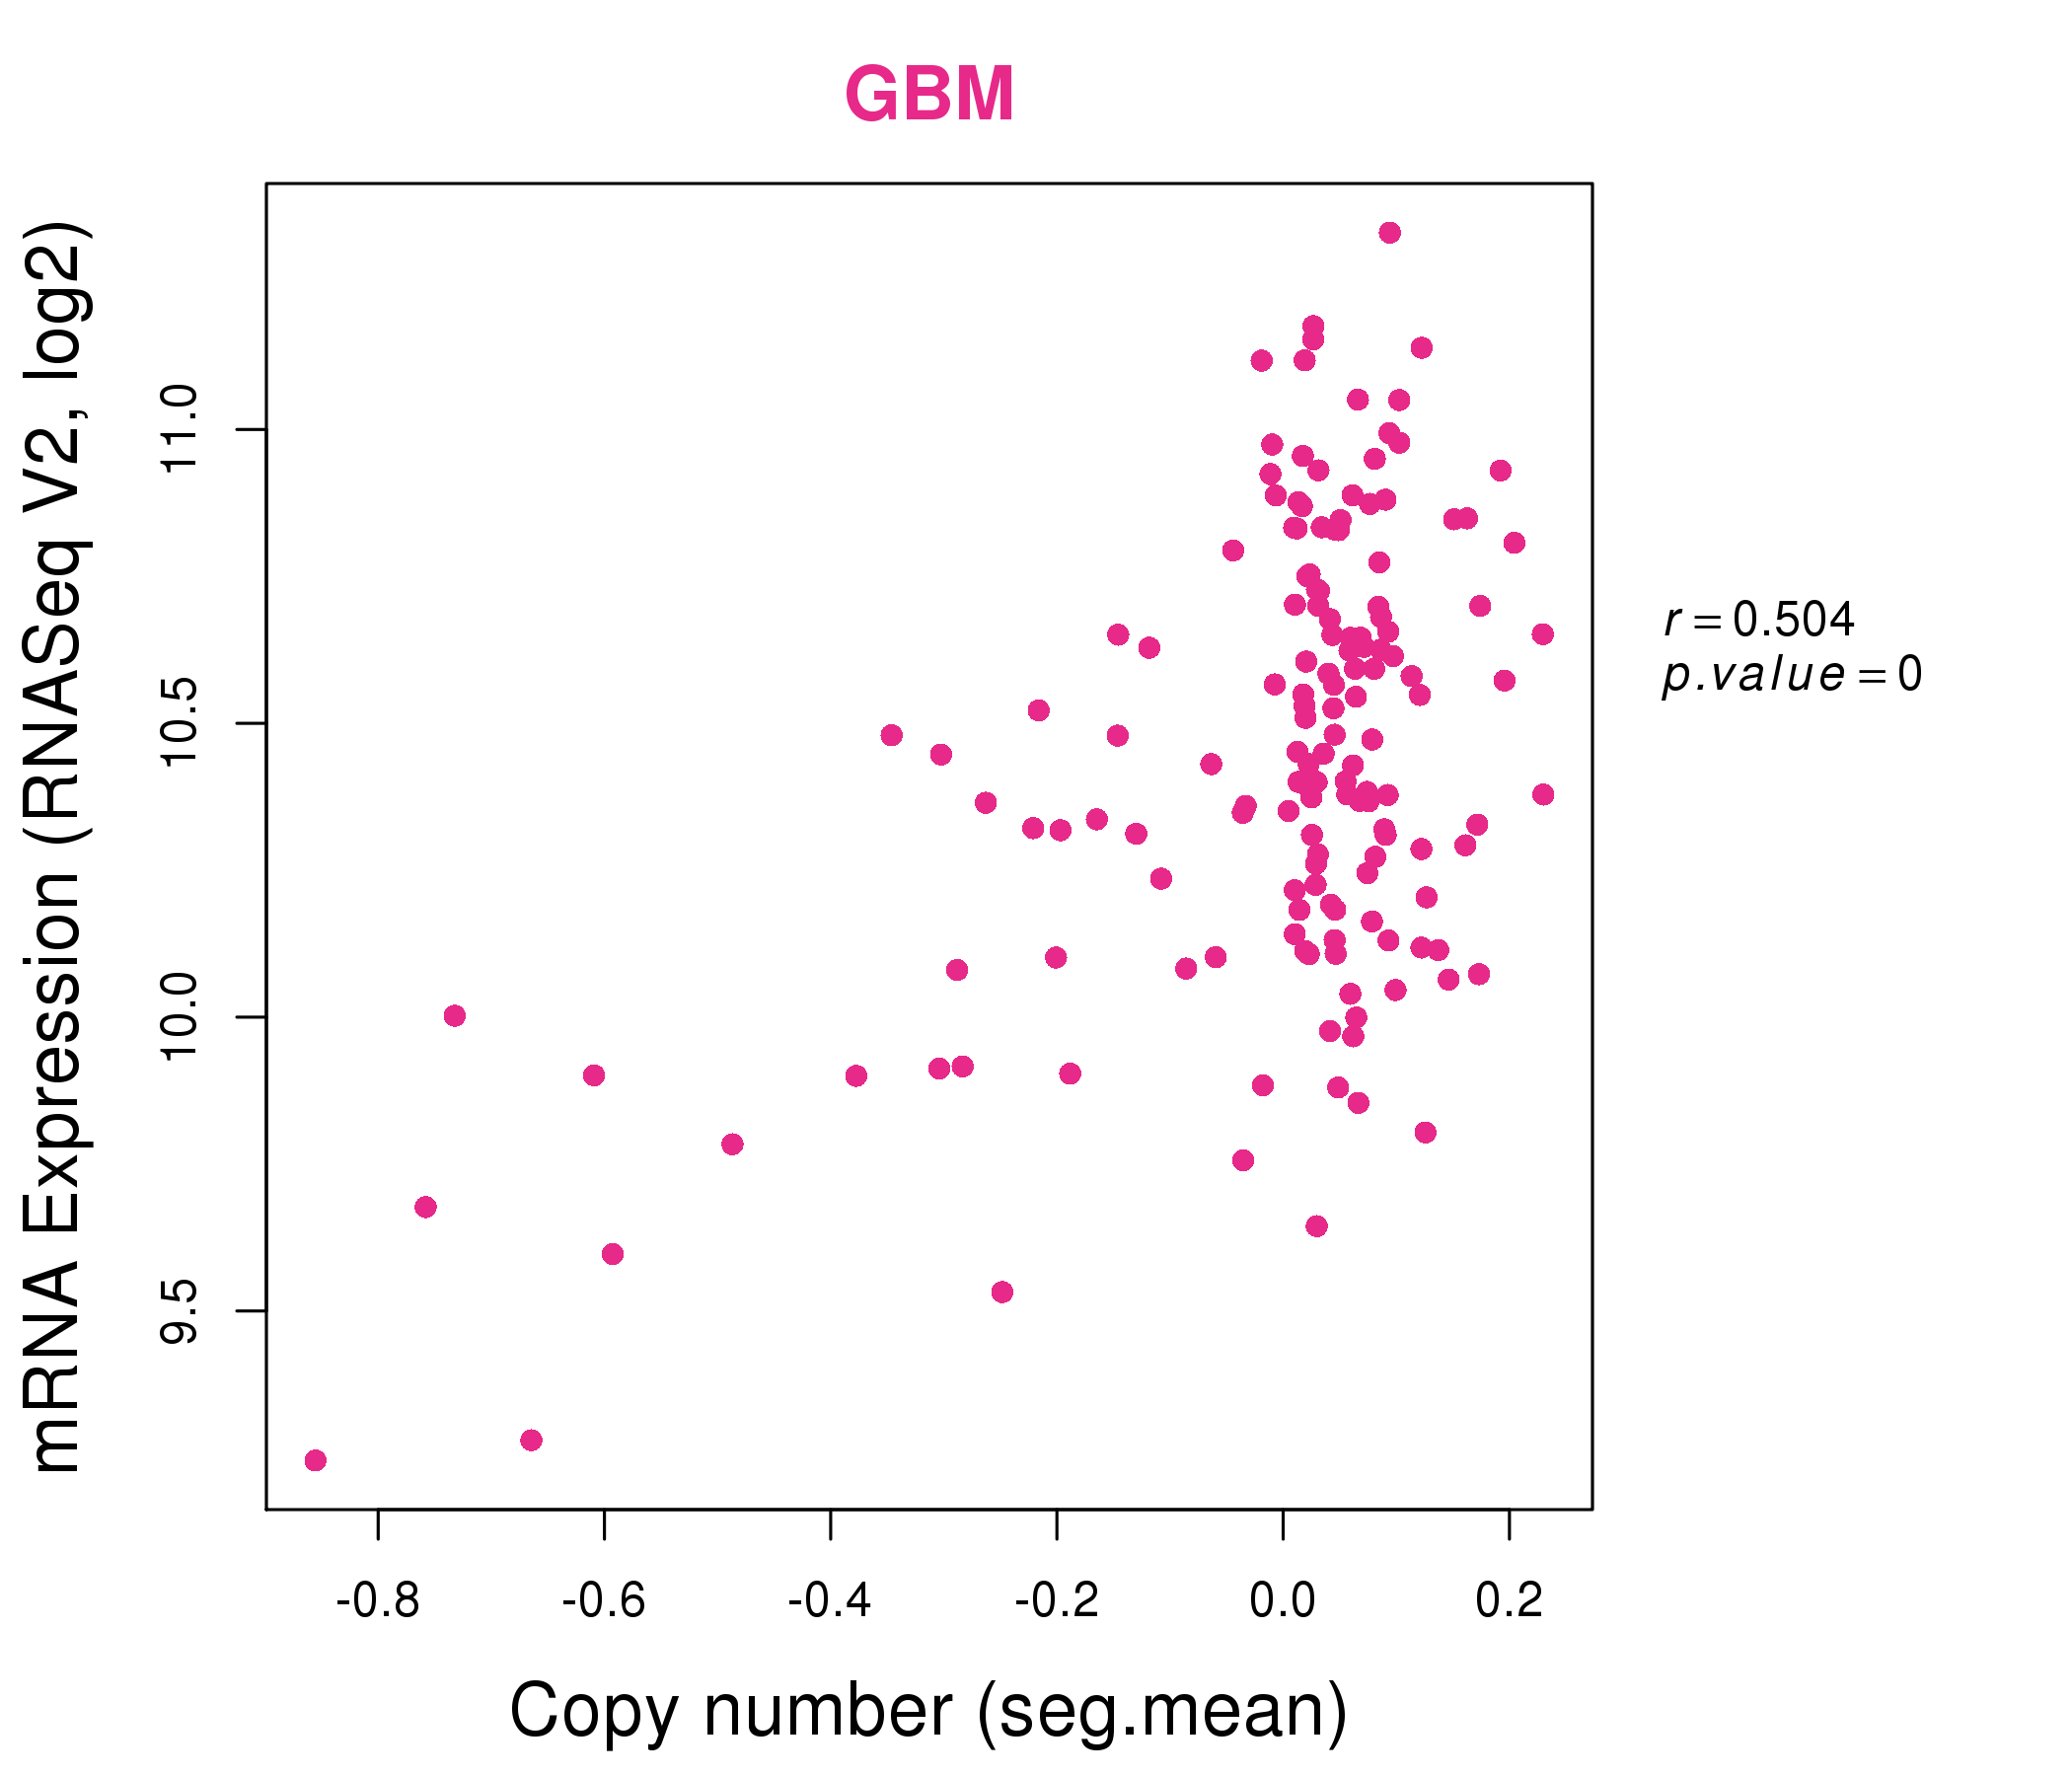
| * Normalized gene expression data of RNASeqV2 was extracted from TCGA using R package TCGA-Assembler. The URLs of all public data files on TCGA DCC data server were gathered at Jan-05-2015. Only eight cancer types have enough normal control samples for differential expression analysis. (t test, adjusted p<0.05 (using Benjamini-Hochberg FDR)) |
 |
| Top |
| * This plots show the correlation between CNV and gene expression. |
: Open all plots for all cancer types
 |
|
 |
|
| Top |
| Gene-Gene Network Information |
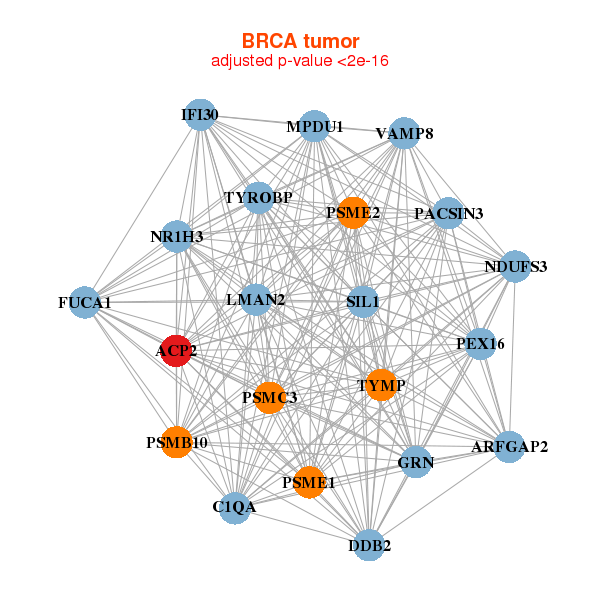
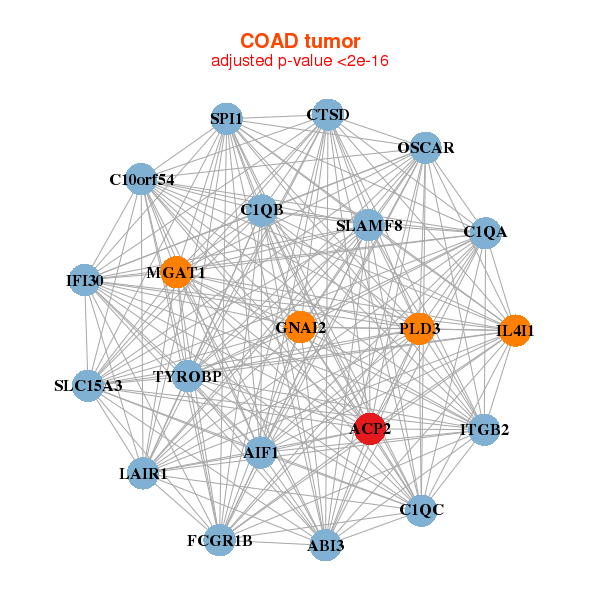
| * Co-Expression network figures were drawn using R package igraph. Only the top 20 genes with the highest correlations were shown. Red circle: input gene, orange circle: cell metabolism gene, sky circle: other gene |
: Open all plots for all cancer types
 |
| ||||
| ACP2,ARFGAP2,C1QA,DDB2,FUCA1,GRN,IFI30, LMAN2,MPDU1,NDUFS3,NR1H3,PACSIN3,PEX16,PSMB10, PSMC3,PSME1,PSME2,SIL1,TYMP,TYROBP,VAMP8 | ABHD12,ACP2,ALDH3B1,AP2S1,ARPC1B,ATOX1,C1orf85, CSTB,CTSD,CTSZ,FCGRT,GRN,HPCAL1,NAGPA, PLD3,PSAP,LAMTOR2,SIL1,SLC8B1,SMPD1,TYROBP | ||||
 |
| ||||
| ABI3,ACP2,AIF1,C10orf54,C1QA,C1QB,C1QC, CTSD,FCGR1B,GNAI2,IFI30,IL4I1,ITGB2,LAIR1, MGAT1,OSCAR,PLD3,SLAMF8,SLC15A3,SPI1,TYROBP | ACP2,CTSZ,ESPN,FAM83F,HECTD3,ITGA3,LASP1, MAPK3,PARP12,PLEKHG6,PRKCD,PRKCZ,PRSS8,SESN2, SLC9A3R1,SPINT1,SRC,TNIP1,TOM1,TRIM14,VPS33B |
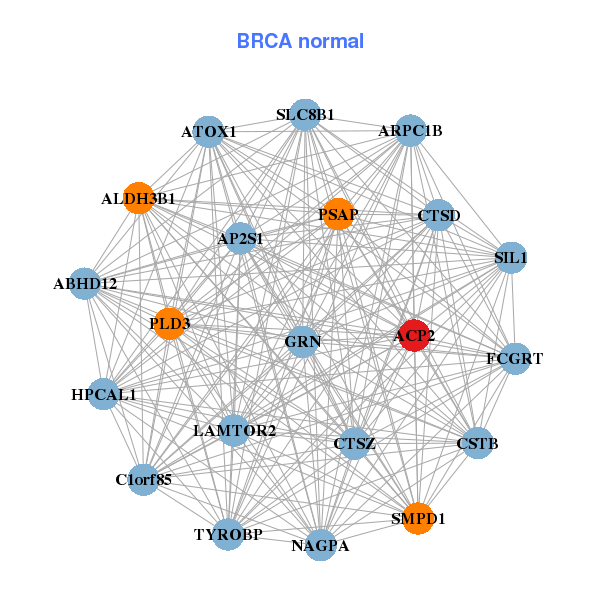
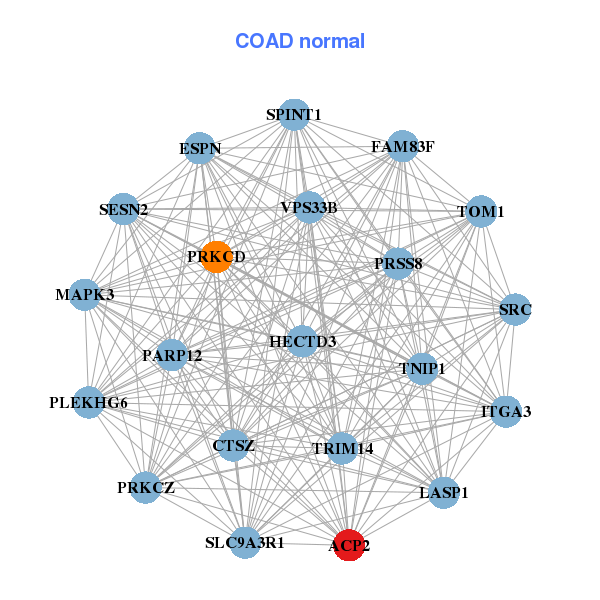
| * Co-Expression network figures were drawn using R package igraph. Only the top 20 genes with the highest correlations were shown. Red circle: input gene, orange circle: cell metabolism gene, sky circle: other gene |
: Open all plots for all cancer types
| Top |
: Open all interacting genes' information including KEGG pathway for all interacting genes from DAVID
| Top |
| Pharmacological Information for ACP2 |
| DB Category | DB Name | DB's ID and Url link |
| * Gene Centered Interaction Network. |
 |
| * Drug Centered Interaction Network. |
| DrugBank ID | Target Name | Drug Groups | Generic Name | Drug Centered Network | Drug Structure |
| DB01033 | acid phosphatase 2, lysosomal | approved | Mercaptopurine | 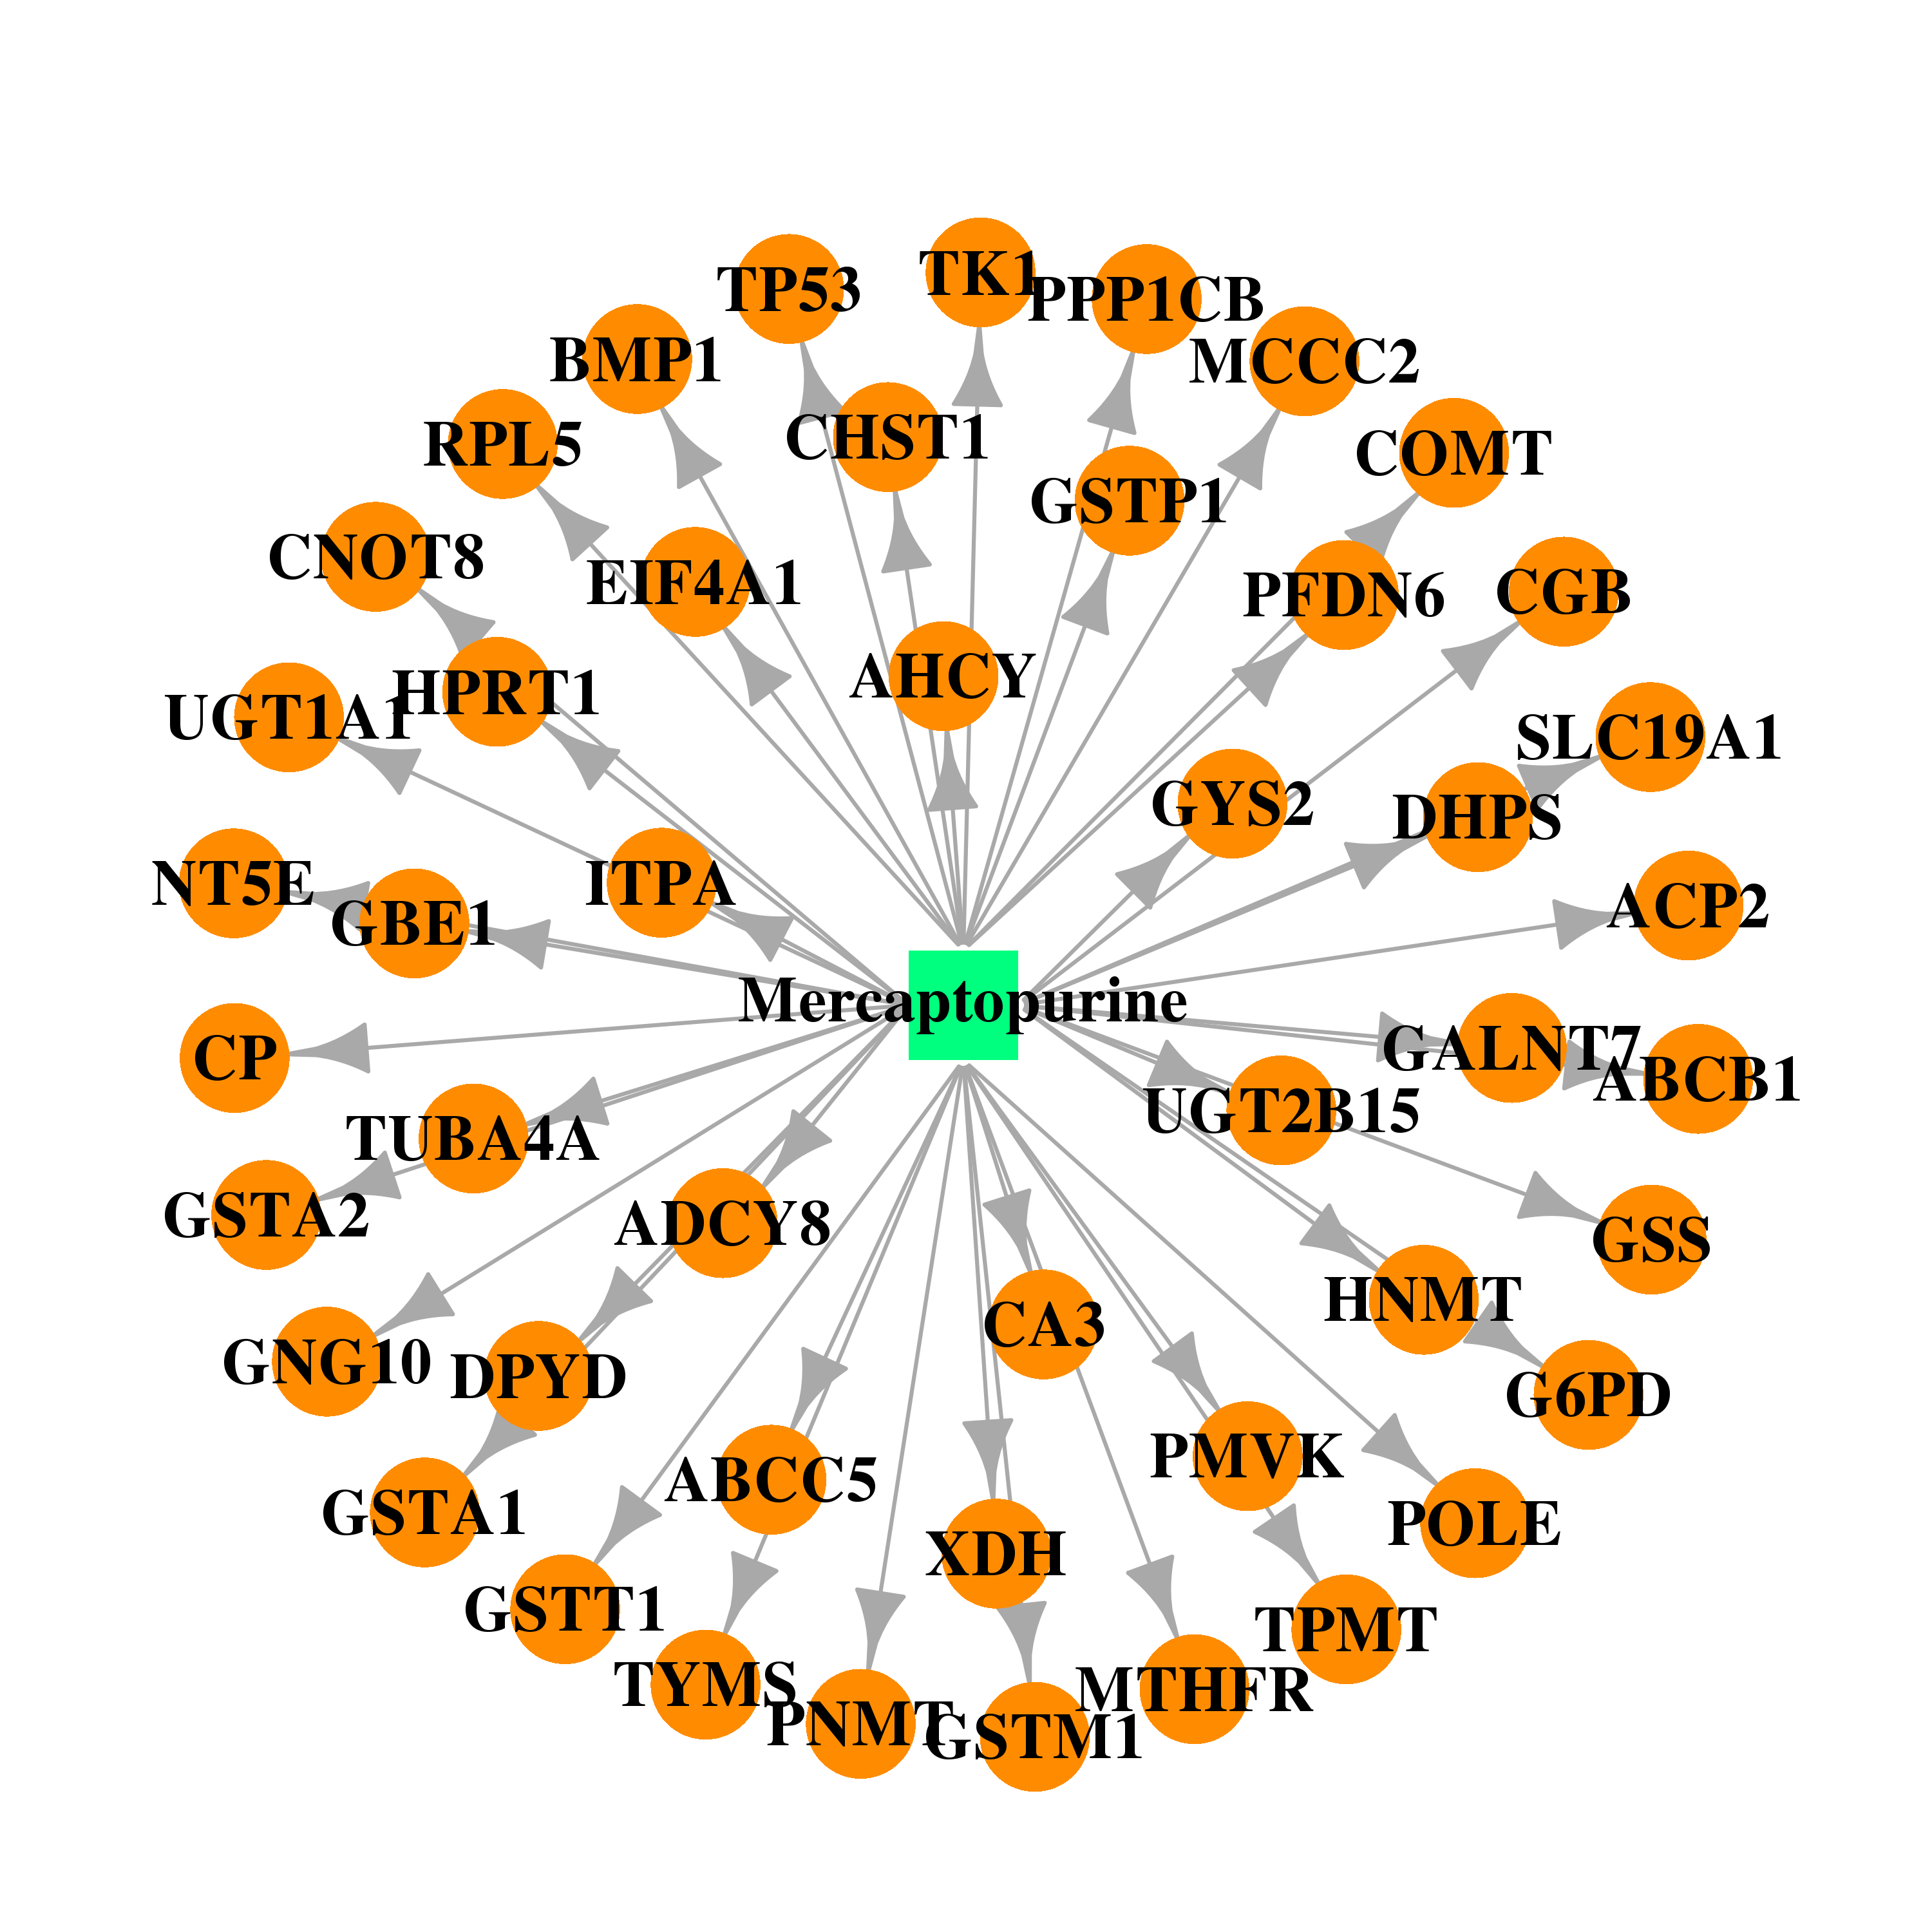 | 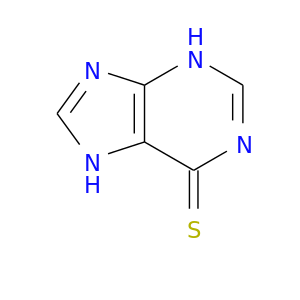 |
| DB00563 | acid phosphatase 2, lysosomal | approved | Methotrexate |  |  |
| Top |
| Cross referenced IDs for ACP2 |
| * We obtained these cross-references from Uniprot database. It covers 150 different DBs, 18 categories. http://www.uniprot.org/help/cross_references_section |
: Open all cross reference information
|
Copyright © 2016-Present - The Univsersity of Texas Health Science Center at Houston @ |