|
||||||||||||||||||||||||||||||||||||||||||||||||||||||||||||||||||||||||||||||||||||||||||||||||||||||||||||||||||||||||||||||||||||||||||||||||||||||||||||||||||||||||||||||||||||||||||||||||||||||||||||||||||||||||||||||||||||||||||||||||||||||||||||||||||||||||||||||||||||||||||||||||||||||||||||||||||||||||||
| |
| Phenotypic Information (metabolism pathway, cancer, disease, phenome) |
| |
| |
| Gene-Gene Network Information: Co-Expression Network, Interacting Genes & KEGG |
| |
|


| Gene Summary for PIP4K2A |
| Basic gene info. | Gene symbol | PIP4K2A |
| Gene name | phosphatidylinositol-5-phosphate 4-kinase, type II, alpha | |
| Synonyms | PI5P4KA|PIP5K2A|PIP5KII-alpha|PIP5KIIA|PIPK | |
| Cytomap | UCSC genome browser: 10p12.2 | |
| Genomic location | chr10 :22823765-23003503 | |
| Type of gene | protein-coding | |
| RefGenes | NM_005028.4, | |
| Ensembl id | ENSG00000150867 | |
| Description | 1-phosphatidylinositol 5-phosphate 4-kinase 2-alpha1-phosphatidylinositol-4-phosphate kinase1-phosphatidylinositol-4-phosphate-5-kinase1-phosphatidylinositol-5-phosphate 4-kinase 2-alphaPI(5)P 4-kinase type II alphaPIP4KII-alphaPIP5KIIIPIP5KIIalpha | |
| Modification date | 20141207 | |
| dbXrefs | MIM : 603140 | |
| HGNC : HGNC | ||
| Ensembl : ENSG00000150867 | ||
| HPRD : 11931 | ||
| Vega : OTTHUMG00000017810 | ||
| Protein | UniProt: go to UniProt's Cross Reference DB Table | |
| Expression | CleanEX: HS_PIP4K2A | |
| BioGPS: 5305 | ||
| Gene Expression Atlas: ENSG00000150867 | ||
| The Human Protein Atlas: ENSG00000150867 | ||
| Pathway | NCI Pathway Interaction Database: PIP4K2A | |
| KEGG: PIP4K2A | ||
| REACTOME: PIP4K2A | ||
| ConsensusPathDB | ||
| Pathway Commons: PIP4K2A | ||
| Metabolism | MetaCyc: PIP4K2A | |
| HUMANCyc: PIP4K2A | ||
| Regulation | Ensembl's Regulation: ENSG00000150867 | |
| miRBase: chr10 :22,823,765-23,003,503 | ||
| TargetScan: NM_005028 | ||
| cisRED: ENSG00000150867 | ||
| Context | iHOP: PIP4K2A | |
| cancer metabolism search in PubMed: PIP4K2A | ||
| UCL Cancer Institute: PIP4K2A | ||
| Assigned class in ccmGDB | C | |
| Top |
| Phenotypic Information for PIP4K2A(metabolism pathway, cancer, disease, phenome) |
| Cancer | CGAP: PIP4K2A |
| Familial Cancer Database: PIP4K2A | |
| * This gene is included in those cancer gene databases. |
|
|
|
|
|
|
| ||||||||||||||||||||||||||||||||||||||||||||||||||||||||||||||||||||||||||||||||||||||||||||||||||||||||||||||||||||||||||||||||||||||||||||||||||||||||||||||||||||||||||||||||||||||||||||||||||||||||||||||||||||||||||||||||||||||||||||||||||||||||||||||||||||||||||||||||||||||||||||||||||||||||||||||||||||
Oncogene 1 | Significant driver gene in | |||||||||||||||||||||||||||||||||||||||||||||||||||||||||||||||||||||||||||||||||||||||||||||||||||||||||||||||||||||||||||||||||||||||||||||||||||||||||||||||||||||||||||||||||||||||||||||||||||||||||||||||||||||||||||||||||||||||||||||||||||||||||||||||||||||||||||||||||||||||||||||||||||||||||||||||||||||||||
| cf) number; DB name 1 Oncogene; http://nar.oxfordjournals.org/content/35/suppl_1/D721.long, 2 Tumor Suppressor gene; https://bioinfo.uth.edu/TSGene/, 3 Cancer Gene Census; http://www.nature.com/nrc/journal/v4/n3/abs/nrc1299.html, 4 CancerGenes; http://nar.oxfordjournals.org/content/35/suppl_1/D721.long, 5 Network of Cancer Gene; http://ncg.kcl.ac.uk/index.php, 1Therapeutic Vulnerabilities in Cancer; http://cbio.mskcc.org/cancergenomics/statius/ |
| KEGG_INOSITOL_PHOSPHATE_METABOLISM REACTOME_PHOSPHOLIPID_METABOLISM REACTOME_PI_METABOLISM REACTOME_METABOLISM_OF_LIPIDS_AND_LIPOPROTEINS | |
| Mutations for PIP4K2A |
| * Under tables are showing count per each tissue to give us broad intuition about tissue specific mutation patterns.You can go to the detailed page for each mutation database's web site. |
| - Statistics for Tissue and Mutation type | Top |
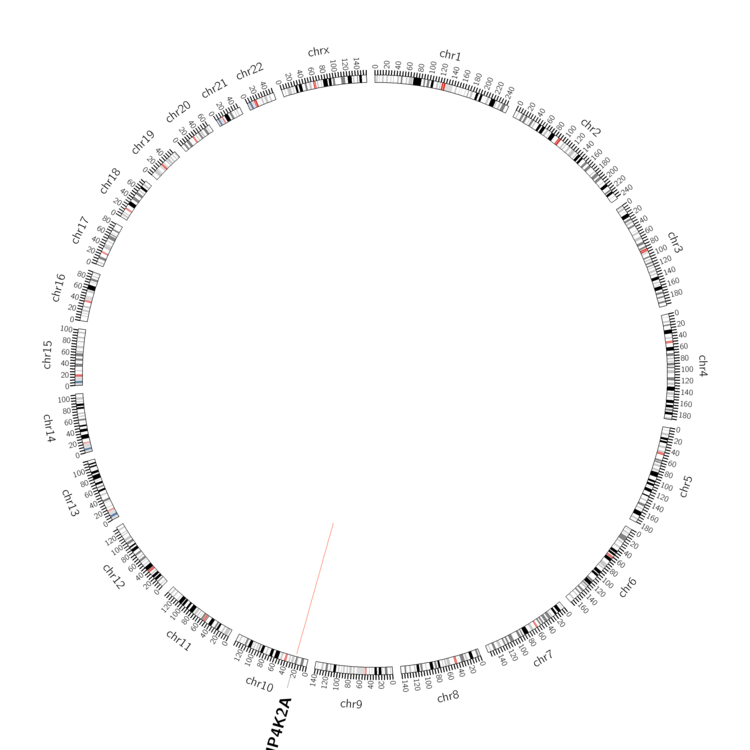 |
| - For Inter-chromosomal Variations |
| There's no inter-chromosomal structural variation. |
| - For Intra-chromosomal Variations |
| * Intra-chromosomal variantions includes 'intrachromosomal amplicon to amplicon', 'intrachromosomal amplicon to non-amplified dna', 'intrachromosomal deletion', 'intrachromosomal fold-back inversion', 'intrachromosomal inversion', 'intrachromosomal tandem duplication', 'Intrachromosomal unknown type', 'intrachromosomal with inverted orientation', 'intrachromosomal with non-inverted orientation'. |
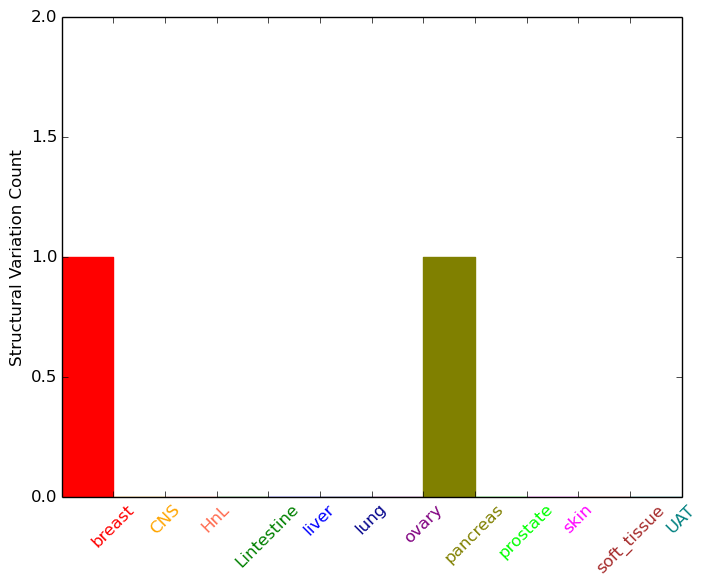 |
| Sample | Symbol_a | Chr_a | Start_a | End_a | Symbol_b | Chr_b | Start_b | End_b |
| breast | PIP4K2A | chr10 | 22944963 | 22944963 | PIP4K2A | chr10 | 22974982 | 22974982 |
| pancreas | PIP4K2A | chr10 | 22931519 | 22931539 | PIP4K2A | chr10 | 22931570 | 22931590 |
| cf) Tissue number; Tissue name (1;Breast, 2;Central_nervous_system, 3;Haematopoietic_and_lymphoid_tissue, 4;Large_intestine, 5;Liver, 6;Lung, 7;Ovary, 8;Pancreas, 9;Prostate, 10;Skin, 11;Soft_tissue, 12;Upper_aerodigestive_tract) |
| * From mRNA Sanger sequences, Chitars2.0 arranged chimeric transcripts. This table shows PIP4K2A related fusion information. |
| ID | Head Gene | Tail Gene | Accession | Gene_a | qStart_a | qEnd_a | Chromosome_a | tStart_a | tEnd_a | Gene_a | qStart_a | qEnd_a | Chromosome_a | tStart_a | tEnd_a |
| BC036779 | PIP4K2A | 1 | 342 | 10 | 23003111 | 23003452 | RPS6KC1 | 341 | 1552 | 1 | 213415911 | 213446808 | |
| BM925273 | PIP4K2A | 18 | 359 | 10 | 23003111 | 23003452 | RPS6KC1 | 358 | 893 | 1 | 213415911 | 213446127 | |
| BG007476 | PSMG2 | 6 | 367 | 18 | 12720568 | 12725566 | PIP4K2A | 366 | 420 | 10 | 22834917 | 22834971 | |
| Top |
| Mutation type/ Tissue ID | brca | cns | cerv | endome | haematopo | kidn | Lintest | liver | lung | ns | ovary | pancre | prost | skin | stoma | thyro | urina | |||
| Total # sample | 2 | 2 | 1 | 1 | 3 | 1 | 1 | |||||||||||||
| GAIN (# sample) | 2 | 1 | 1 | 1 | 2 | 1 | ||||||||||||||
| LOSS (# sample) | 1 | 1 | 1 |
| cf) Tissue ID; Tissue type (1; Breast, 2; Central_nervous_system, 3; Cervix, 4; Endometrium, 5; Haematopoietic_and_lymphoid_tissue, 6; Kidney, 7; Large_intestine, 8; Liver, 9; Lung, 10; NS, 11; Ovary, 12; Pancreas, 13; Prostate, 14; Skin, 15; Stomach, 16; Thyroid, 17; Urinary_tract) |
| Top |
|
 |
| Top |
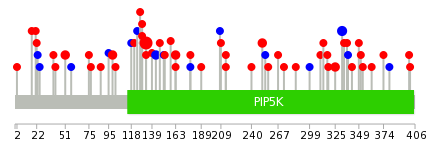
| Stat. for Non-Synonymous SNVs (# total SNVs=50) | (# total SNVs=15) |
 | 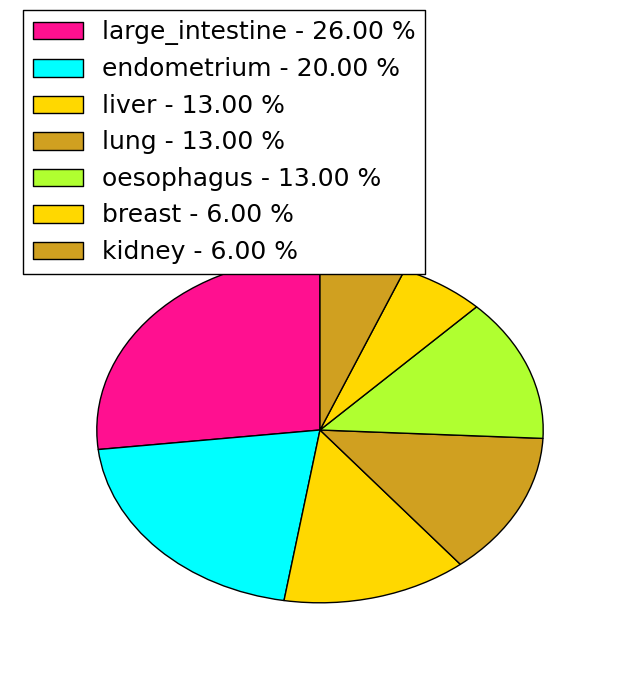 |
(# total SNVs=1) | (# total SNVs=1) |
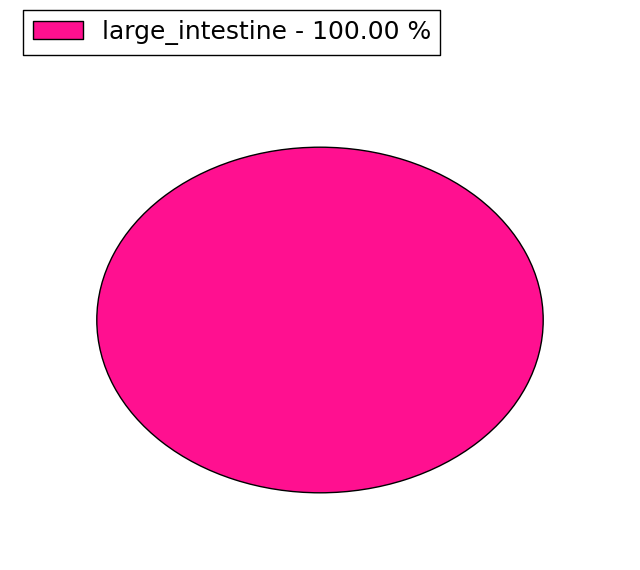 |  |
| Top |
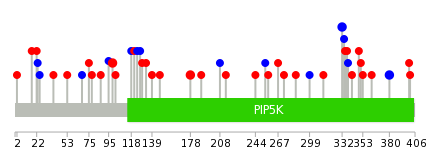
| * When you move the cursor on each content, you can see more deailed mutation information on the Tooltip. Those are primary_site,primary_histology,mutation(aa),pubmedID. |
| GRCh37 position | Mutation(aa) | Unique sampleID count |
| chr10:22880652-22880652 | p.R133H | 12 |
| chr10:22830773-22830773 | p.F332F | 3 |
| chr10:22880563-22880563 | p.H163Y | 2 |
| chr10:22898640-22898640 | p.E51K | 2 |
| chr10:22839628-22839628 | p.N251S | 2 |
| chr10:22880621-22880621 | p.I143I | 2 |
| chr10:22896899-22896899 | p.R99H | 2 |
| chr10:22862345-22862345 | p.F178L | 2 |
| chr10:22830970-22830970 | p.A267T | 1 |
| chr10:22898568-22898568 | p.D75N | 1 |
| Top |
|
 |
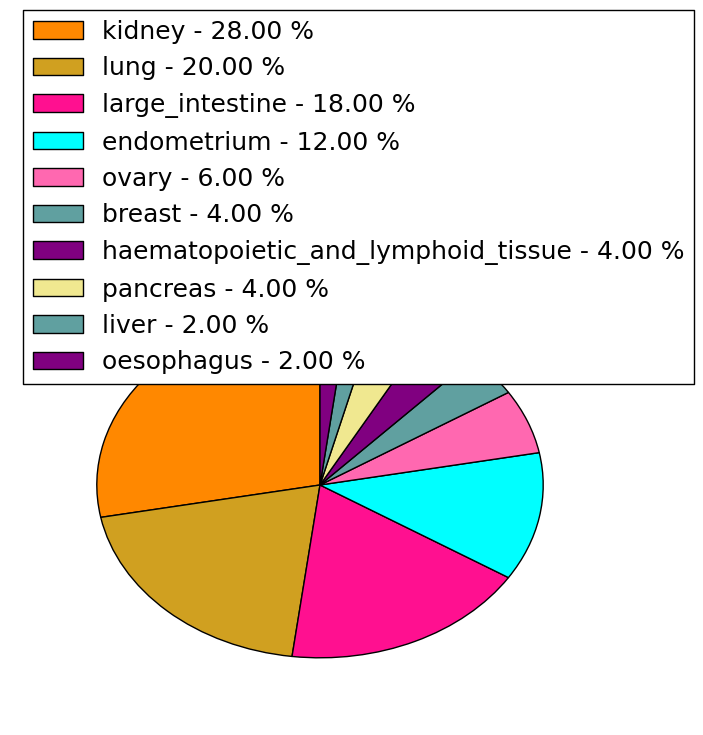
| Point Mutation/ Tissue ID | 1 | 2 | 3 | 4 | 5 | 6 | 7 | 8 | 9 | 10 | 11 | 12 | 13 | 14 | 15 | 16 | 17 | 18 | 19 | 20 |
| # sample | 3 | 1 | 11 | 1 | 2 | 1 | 7 | 3 | 1 | 5 | 5 | 9 | ||||||||
| # mutation | 3 | 1 | 9 | 1 | 2 | 1 | 7 | 3 | 1 | 5 | 5 | 9 | ||||||||
| nonsynonymous SNV | 2 | 1 | 5 | 2 | 5 | 3 | 1 | 4 | 4 | 6 | ||||||||||
| synonymous SNV | 1 | 4 | 1 | 1 | 2 | 1 | 1 | 3 |
| cf) Tissue ID; Tissue type (1; BLCA[Bladder Urothelial Carcinoma], 2; BRCA[Breast invasive carcinoma], 3; CESC[Cervical squamous cell carcinoma and endocervical adenocarcinoma], 4; COAD[Colon adenocarcinoma], 5; GBM[Glioblastoma multiforme], 6; Glioma Low Grade, 7; HNSC[Head and Neck squamous cell carcinoma], 8; KICH[Kidney Chromophobe], 9; KIRC[Kidney renal clear cell carcinoma], 10; KIRP[Kidney renal papillary cell carcinoma], 11; LAML[Acute Myeloid Leukemia], 12; LUAD[Lung adenocarcinoma], 13; LUSC[Lung squamous cell carcinoma], 14; OV[Ovarian serous cystadenocarcinoma ], 15; PAAD[Pancreatic adenocarcinoma], 16; PRAD[Prostate adenocarcinoma], 17; SKCM[Skin Cutaneous Melanoma], 18:STAD[Stomach adenocarcinoma], 19:THCA[Thyroid carcinoma], 20:UCEC[Uterine Corpus Endometrial Carcinoma]) |
| Top |
| * We represented just top 10 SNVs. When you move the cursor on each content, you can see more deailed mutation information on the Tooltip. Those are primary_site, primary_histology, mutation(aa), pubmedID. |
| Genomic Position | Mutation(aa) | Unique sampleID count |
| chr10:22862345 | p.G380G | 2 |
| chr10:22830773 | p.R99H | 2 |
| chr10:22828900 | p.F178L | 2 |
| chr10:22896899 | p.F332F | 2 |
| chr10:22828956 | p.F400L | 1 |
| chr10:22896910 | p.A267T | 1 |
| chr10:22830872 | p.R102L | 1 |
| chr10:23003251 | p.E257G | 1 |
| chr10:22880610 | p.T362A | 1 |
| chr10:22828982 | p.V254V | 1 |
| * Copy number data were extracted from TCGA using R package TCGA-Assembler. The URLs of all public data files on TCGA DCC data server were gathered on Jan-05-2015. Function ProcessCNAData in TCGA-Assembler package was used to obtain gene-level copy number value which is calculated as the average copy number of the genomic region of a gene. |
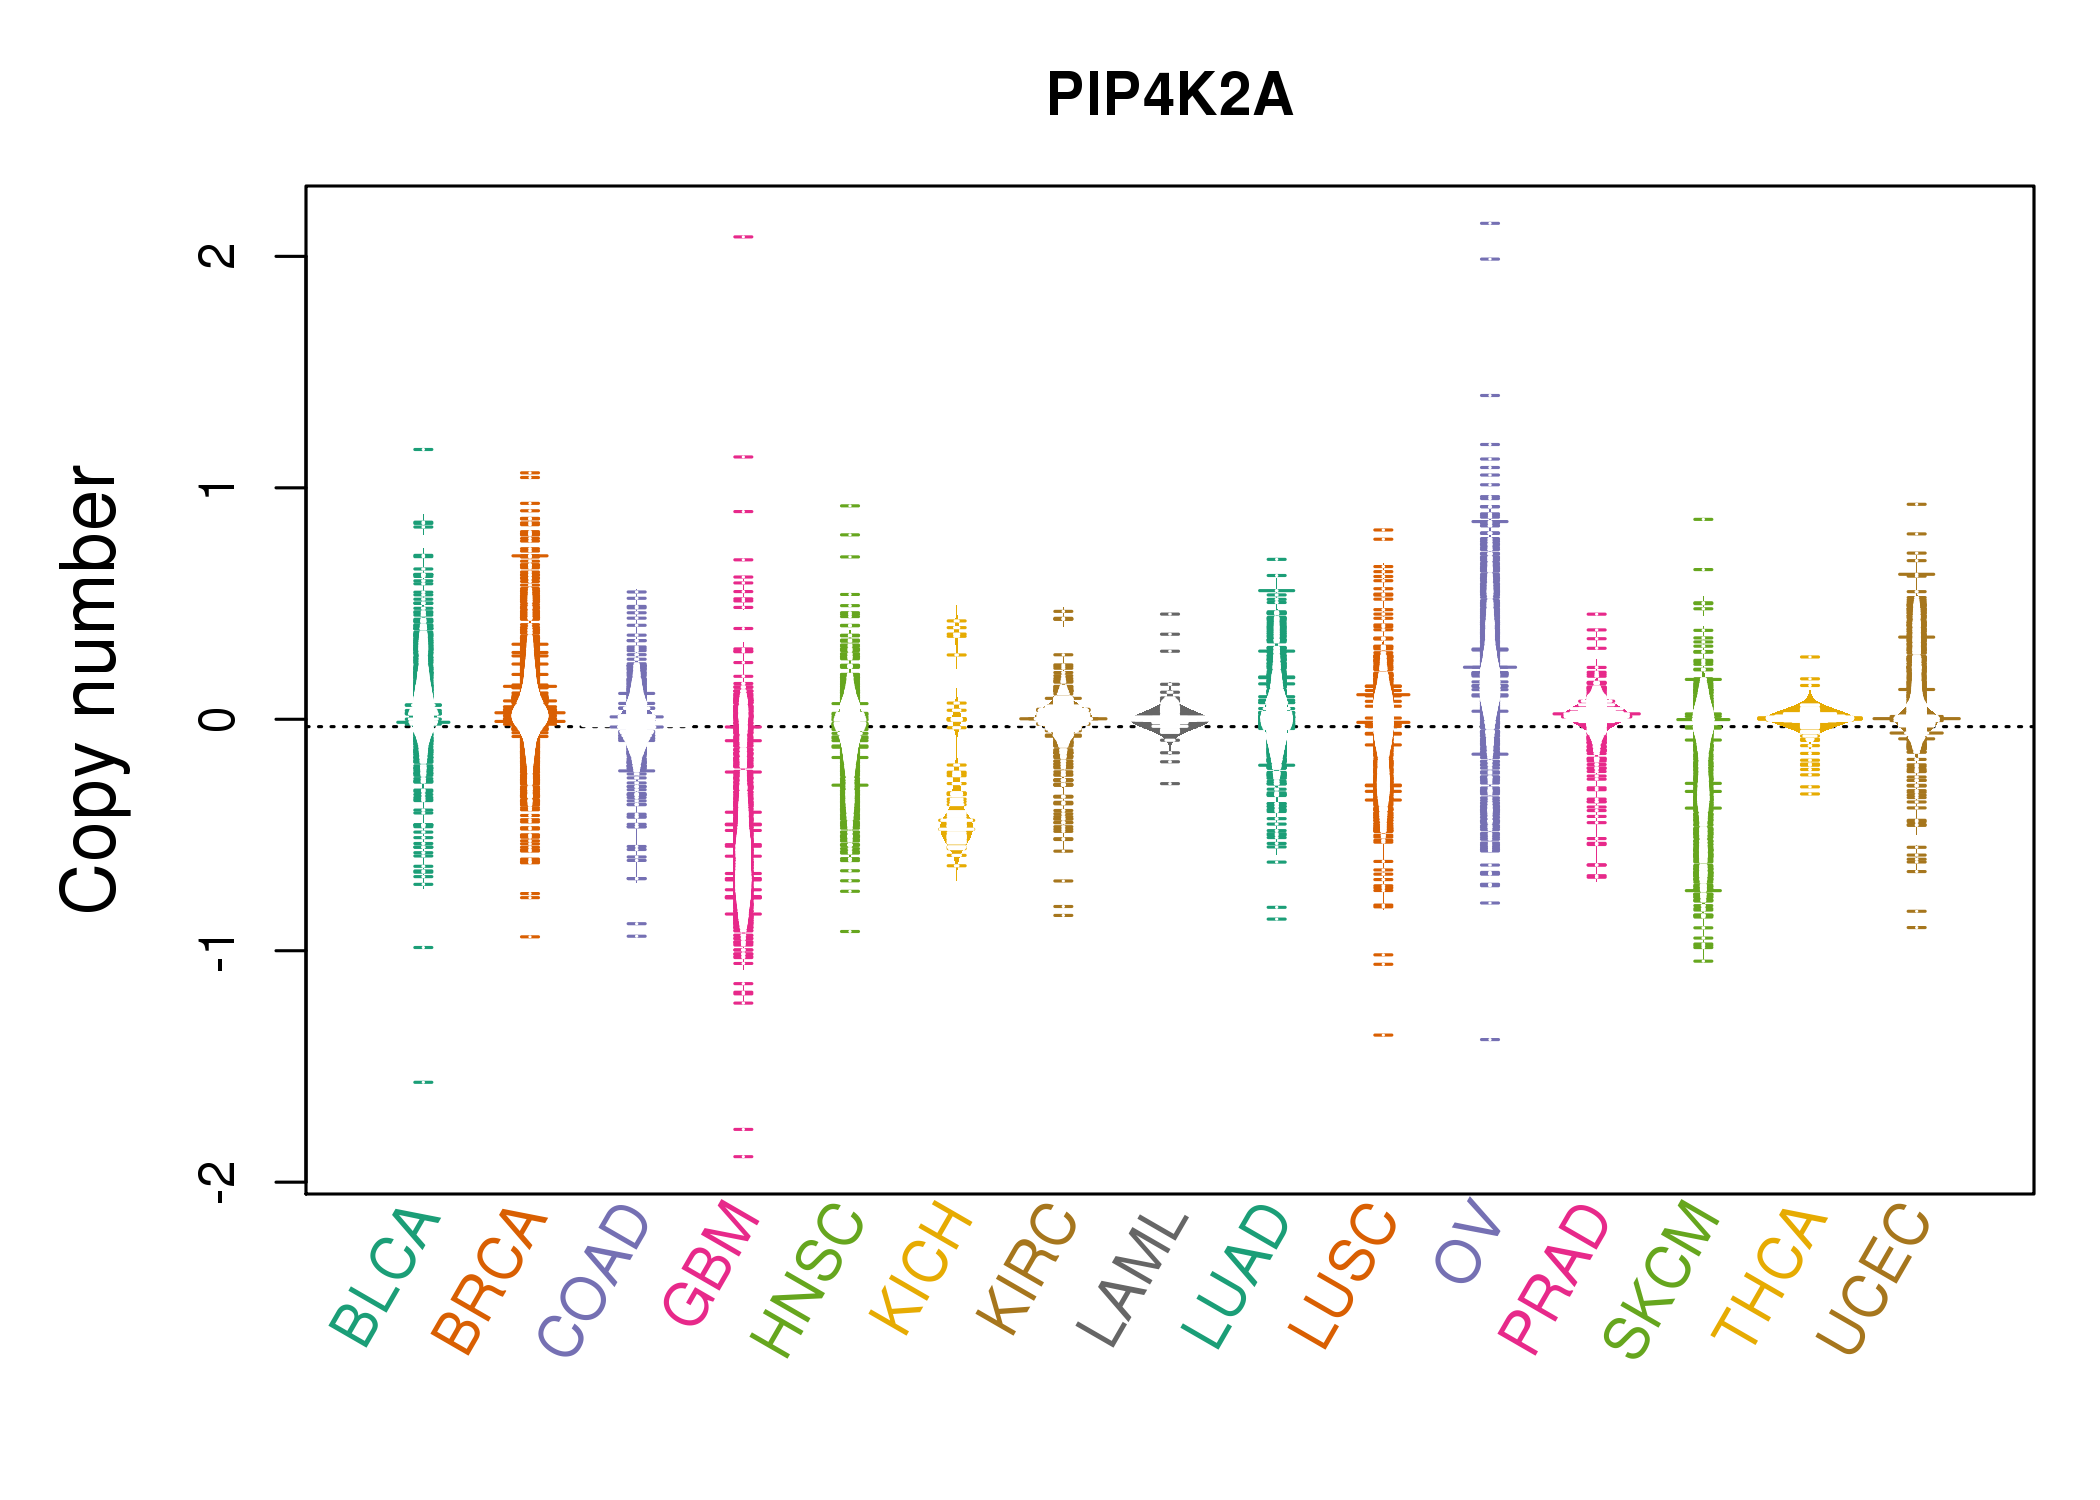 |
| cf) Tissue ID[Tissue type]: BLCA[Bladder Urothelial Carcinoma], BRCA[Breast invasive carcinoma], CESC[Cervical squamous cell carcinoma and endocervical adenocarcinoma], COAD[Colon adenocarcinoma], GBM[Glioblastoma multiforme], Glioma Low Grade, HNSC[Head and Neck squamous cell carcinoma], KICH[Kidney Chromophobe], KIRC[Kidney renal clear cell carcinoma], KIRP[Kidney renal papillary cell carcinoma], LAML[Acute Myeloid Leukemia], LUAD[Lung adenocarcinoma], LUSC[Lung squamous cell carcinoma], OV[Ovarian serous cystadenocarcinoma ], PAAD[Pancreatic adenocarcinoma], PRAD[Prostate adenocarcinoma], SKCM[Skin Cutaneous Melanoma], STAD[Stomach adenocarcinoma], THCA[Thyroid carcinoma], UCEC[Uterine Corpus Endometrial Carcinoma] |
| Top |
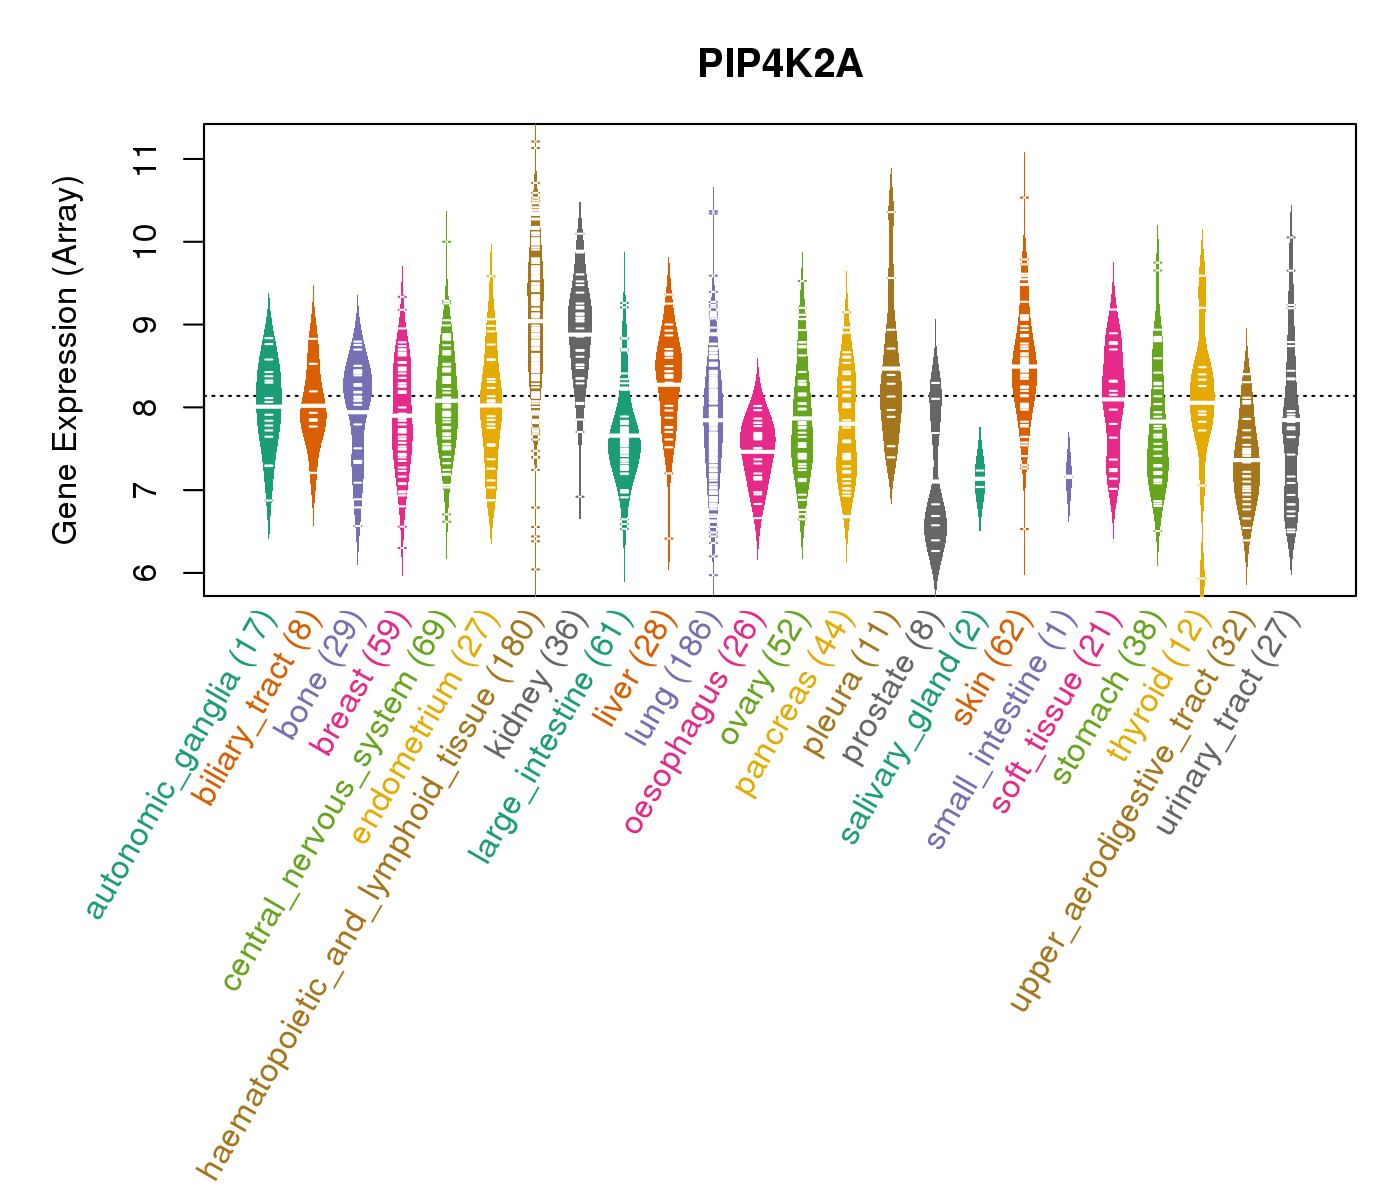
| Gene Expression for PIP4K2A |
| * CCLE gene expression data were extracted from CCLE_Expression_Entrez_2012-10-18.res: Gene-centric RMA-normalized mRNA expression data. |
 |
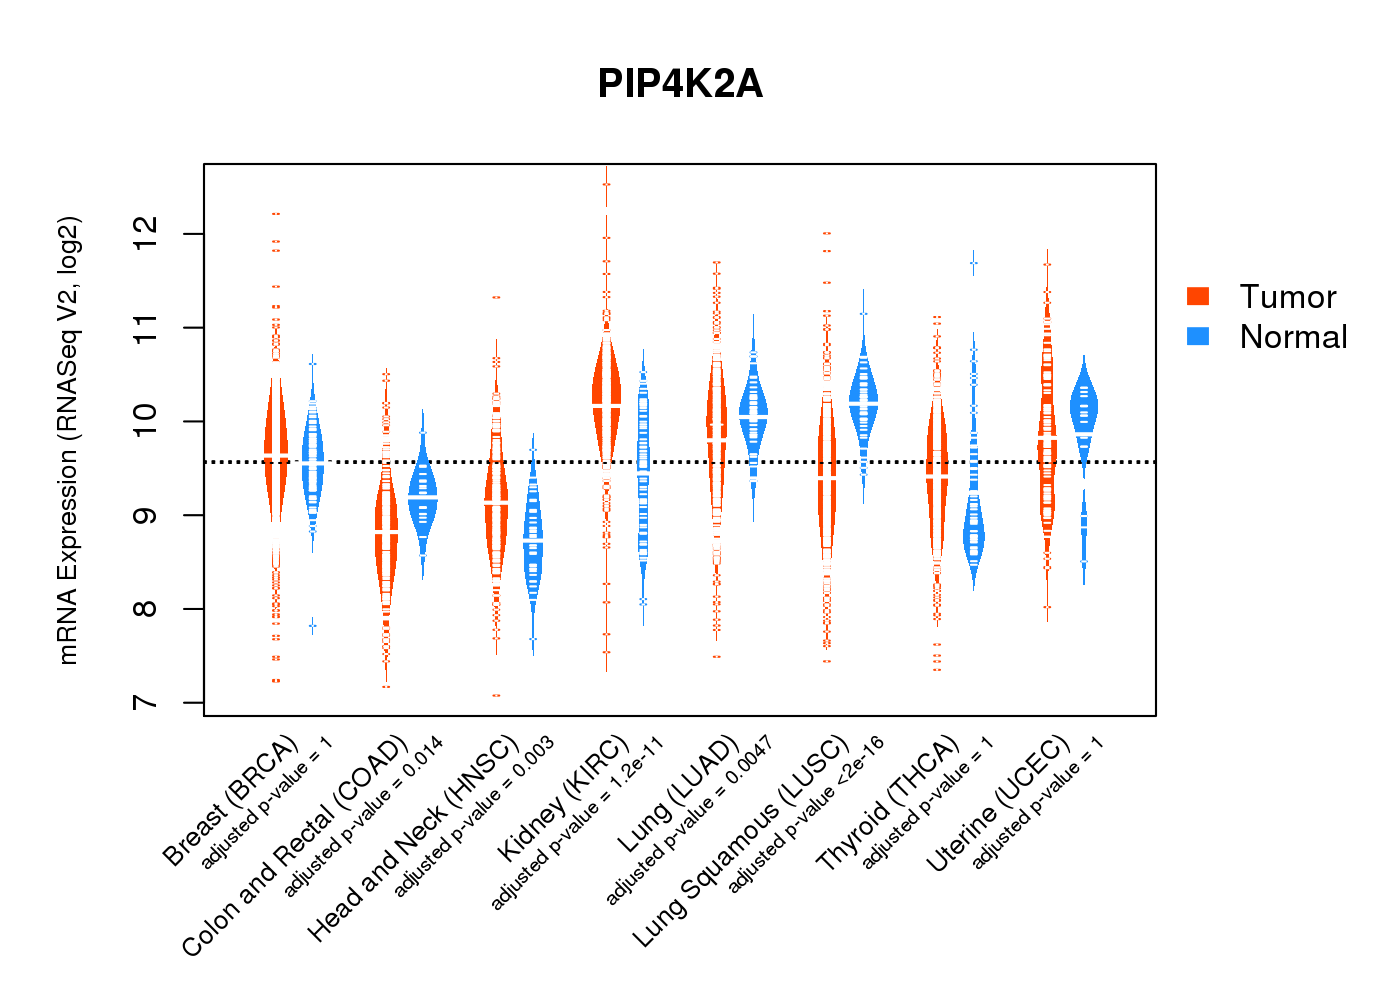
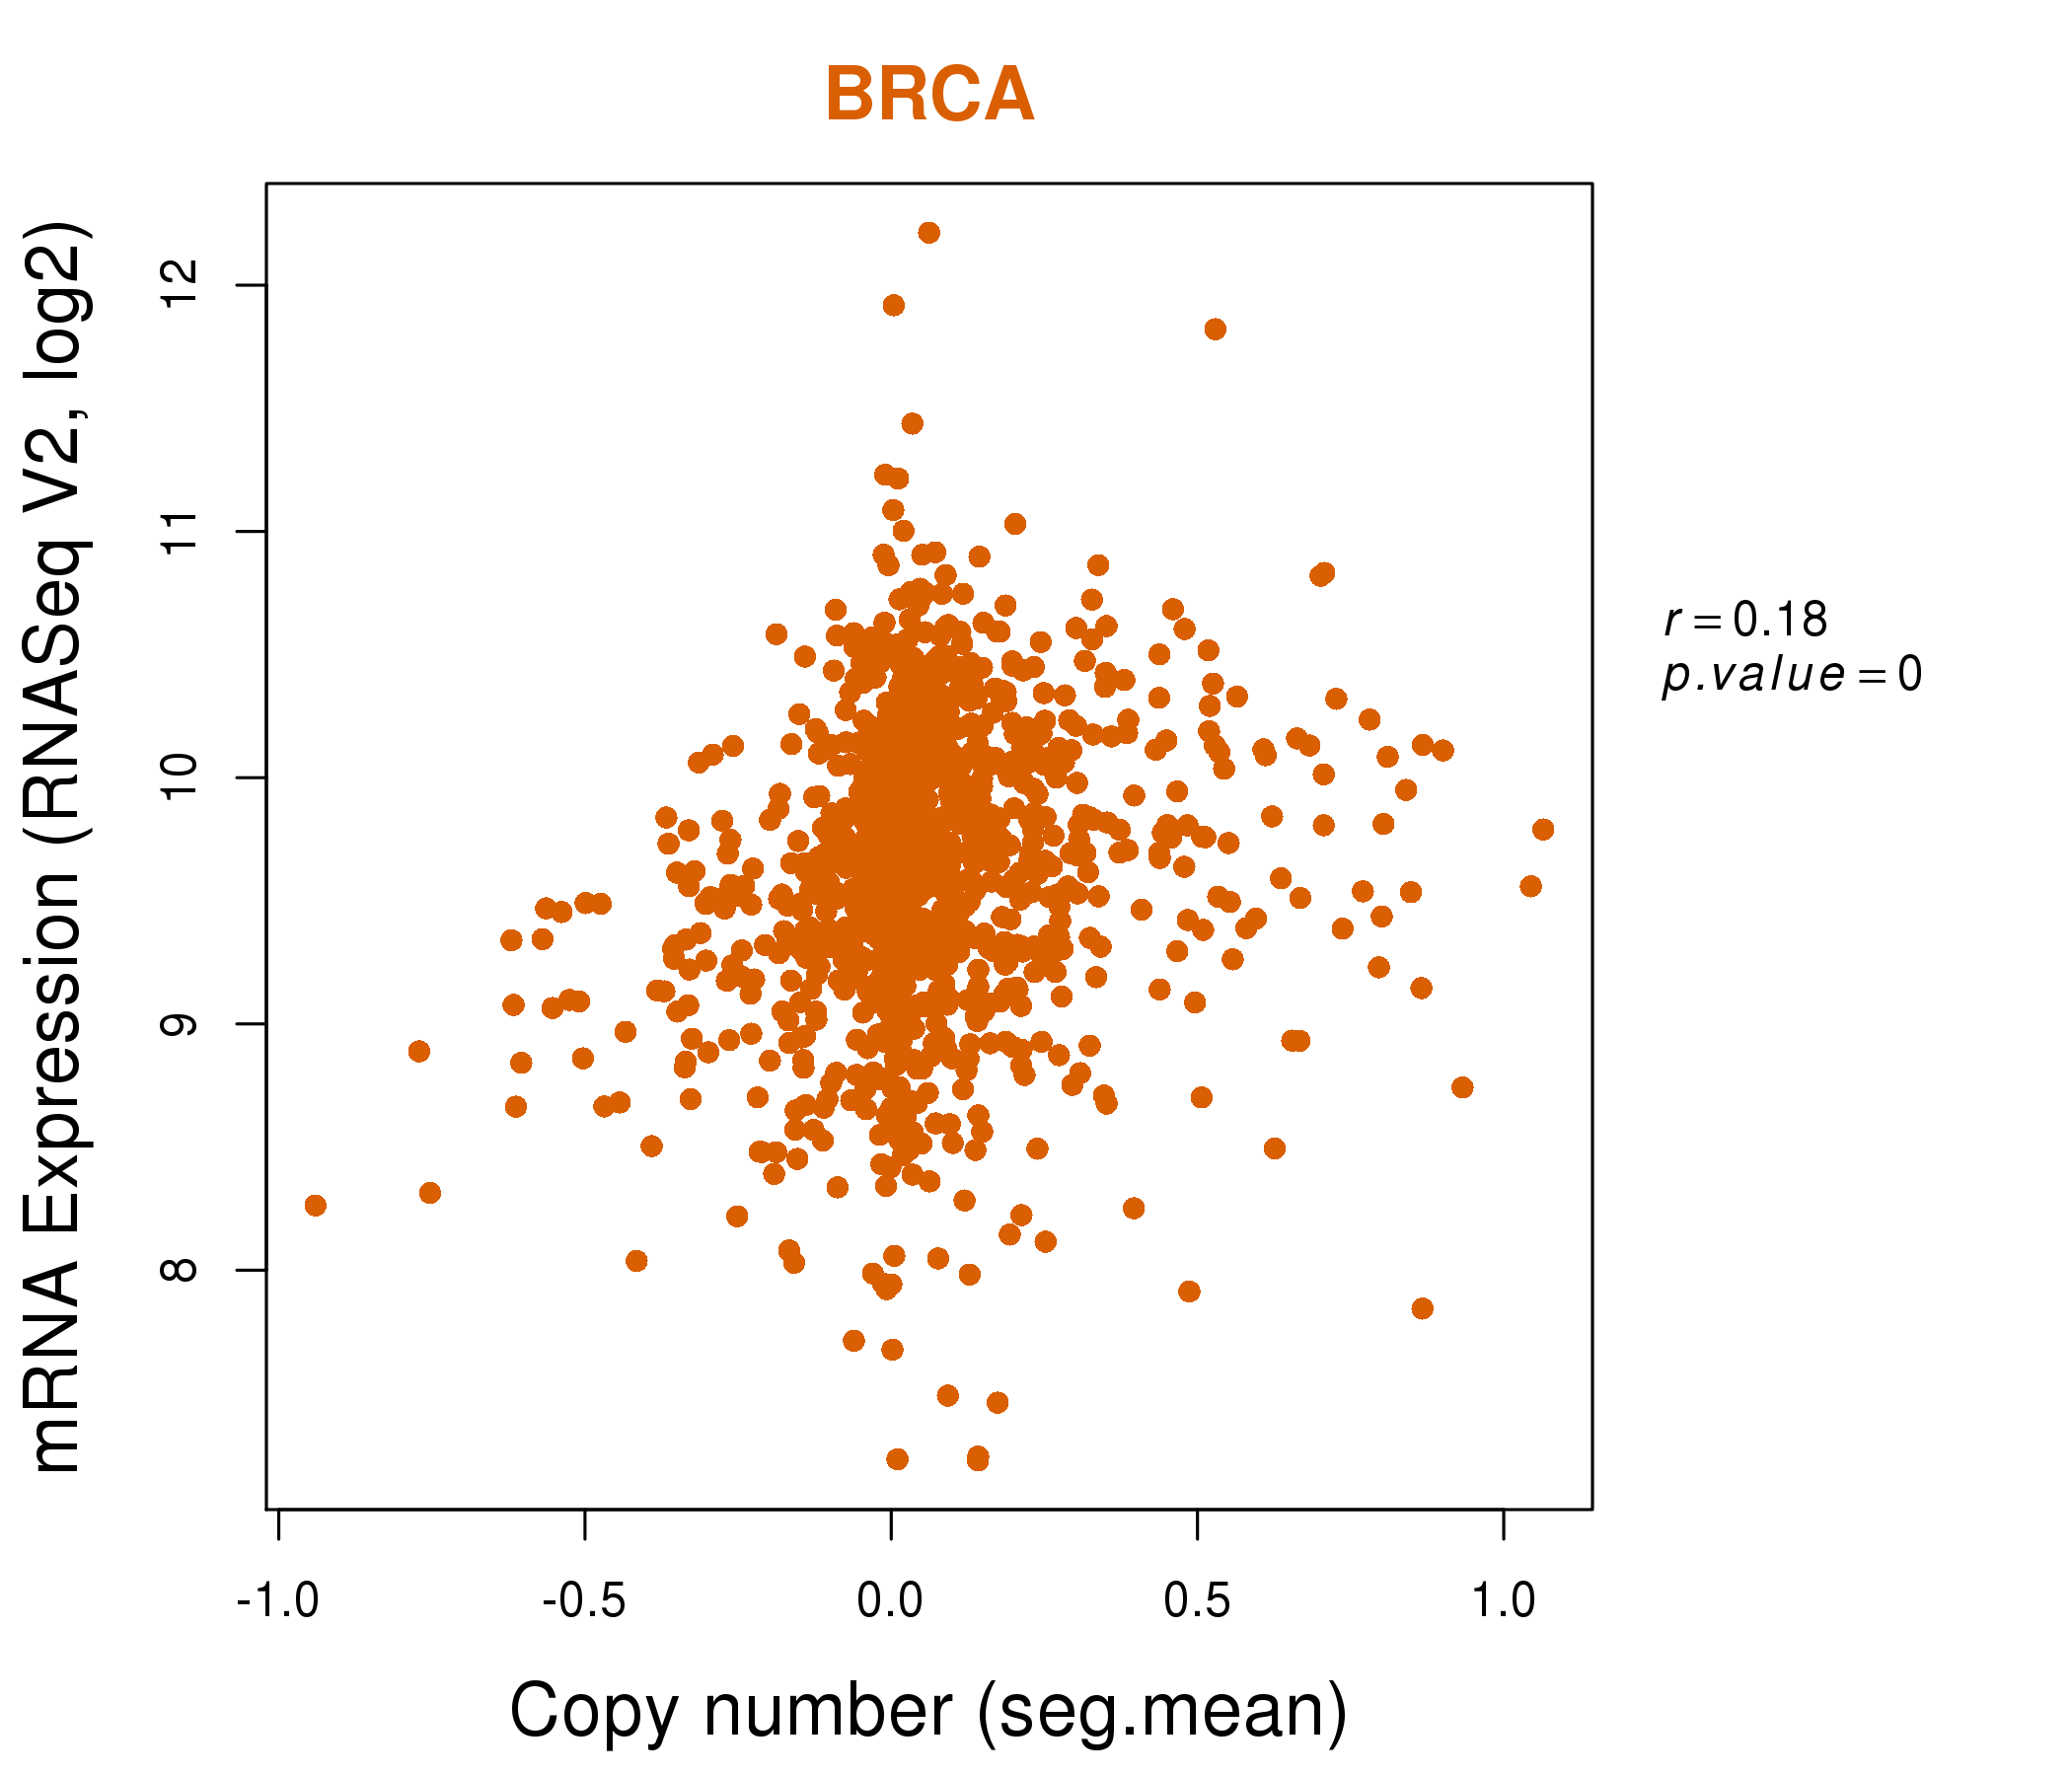
| * Normalized gene expression data of RNASeqV2 was extracted from TCGA using R package TCGA-Assembler. The URLs of all public data files on TCGA DCC data server were gathered at Jan-05-2015. Only eight cancer types have enough normal control samples for differential expression analysis. (t test, adjusted p<0.05 (using Benjamini-Hochberg FDR)) |
 |
| Top |
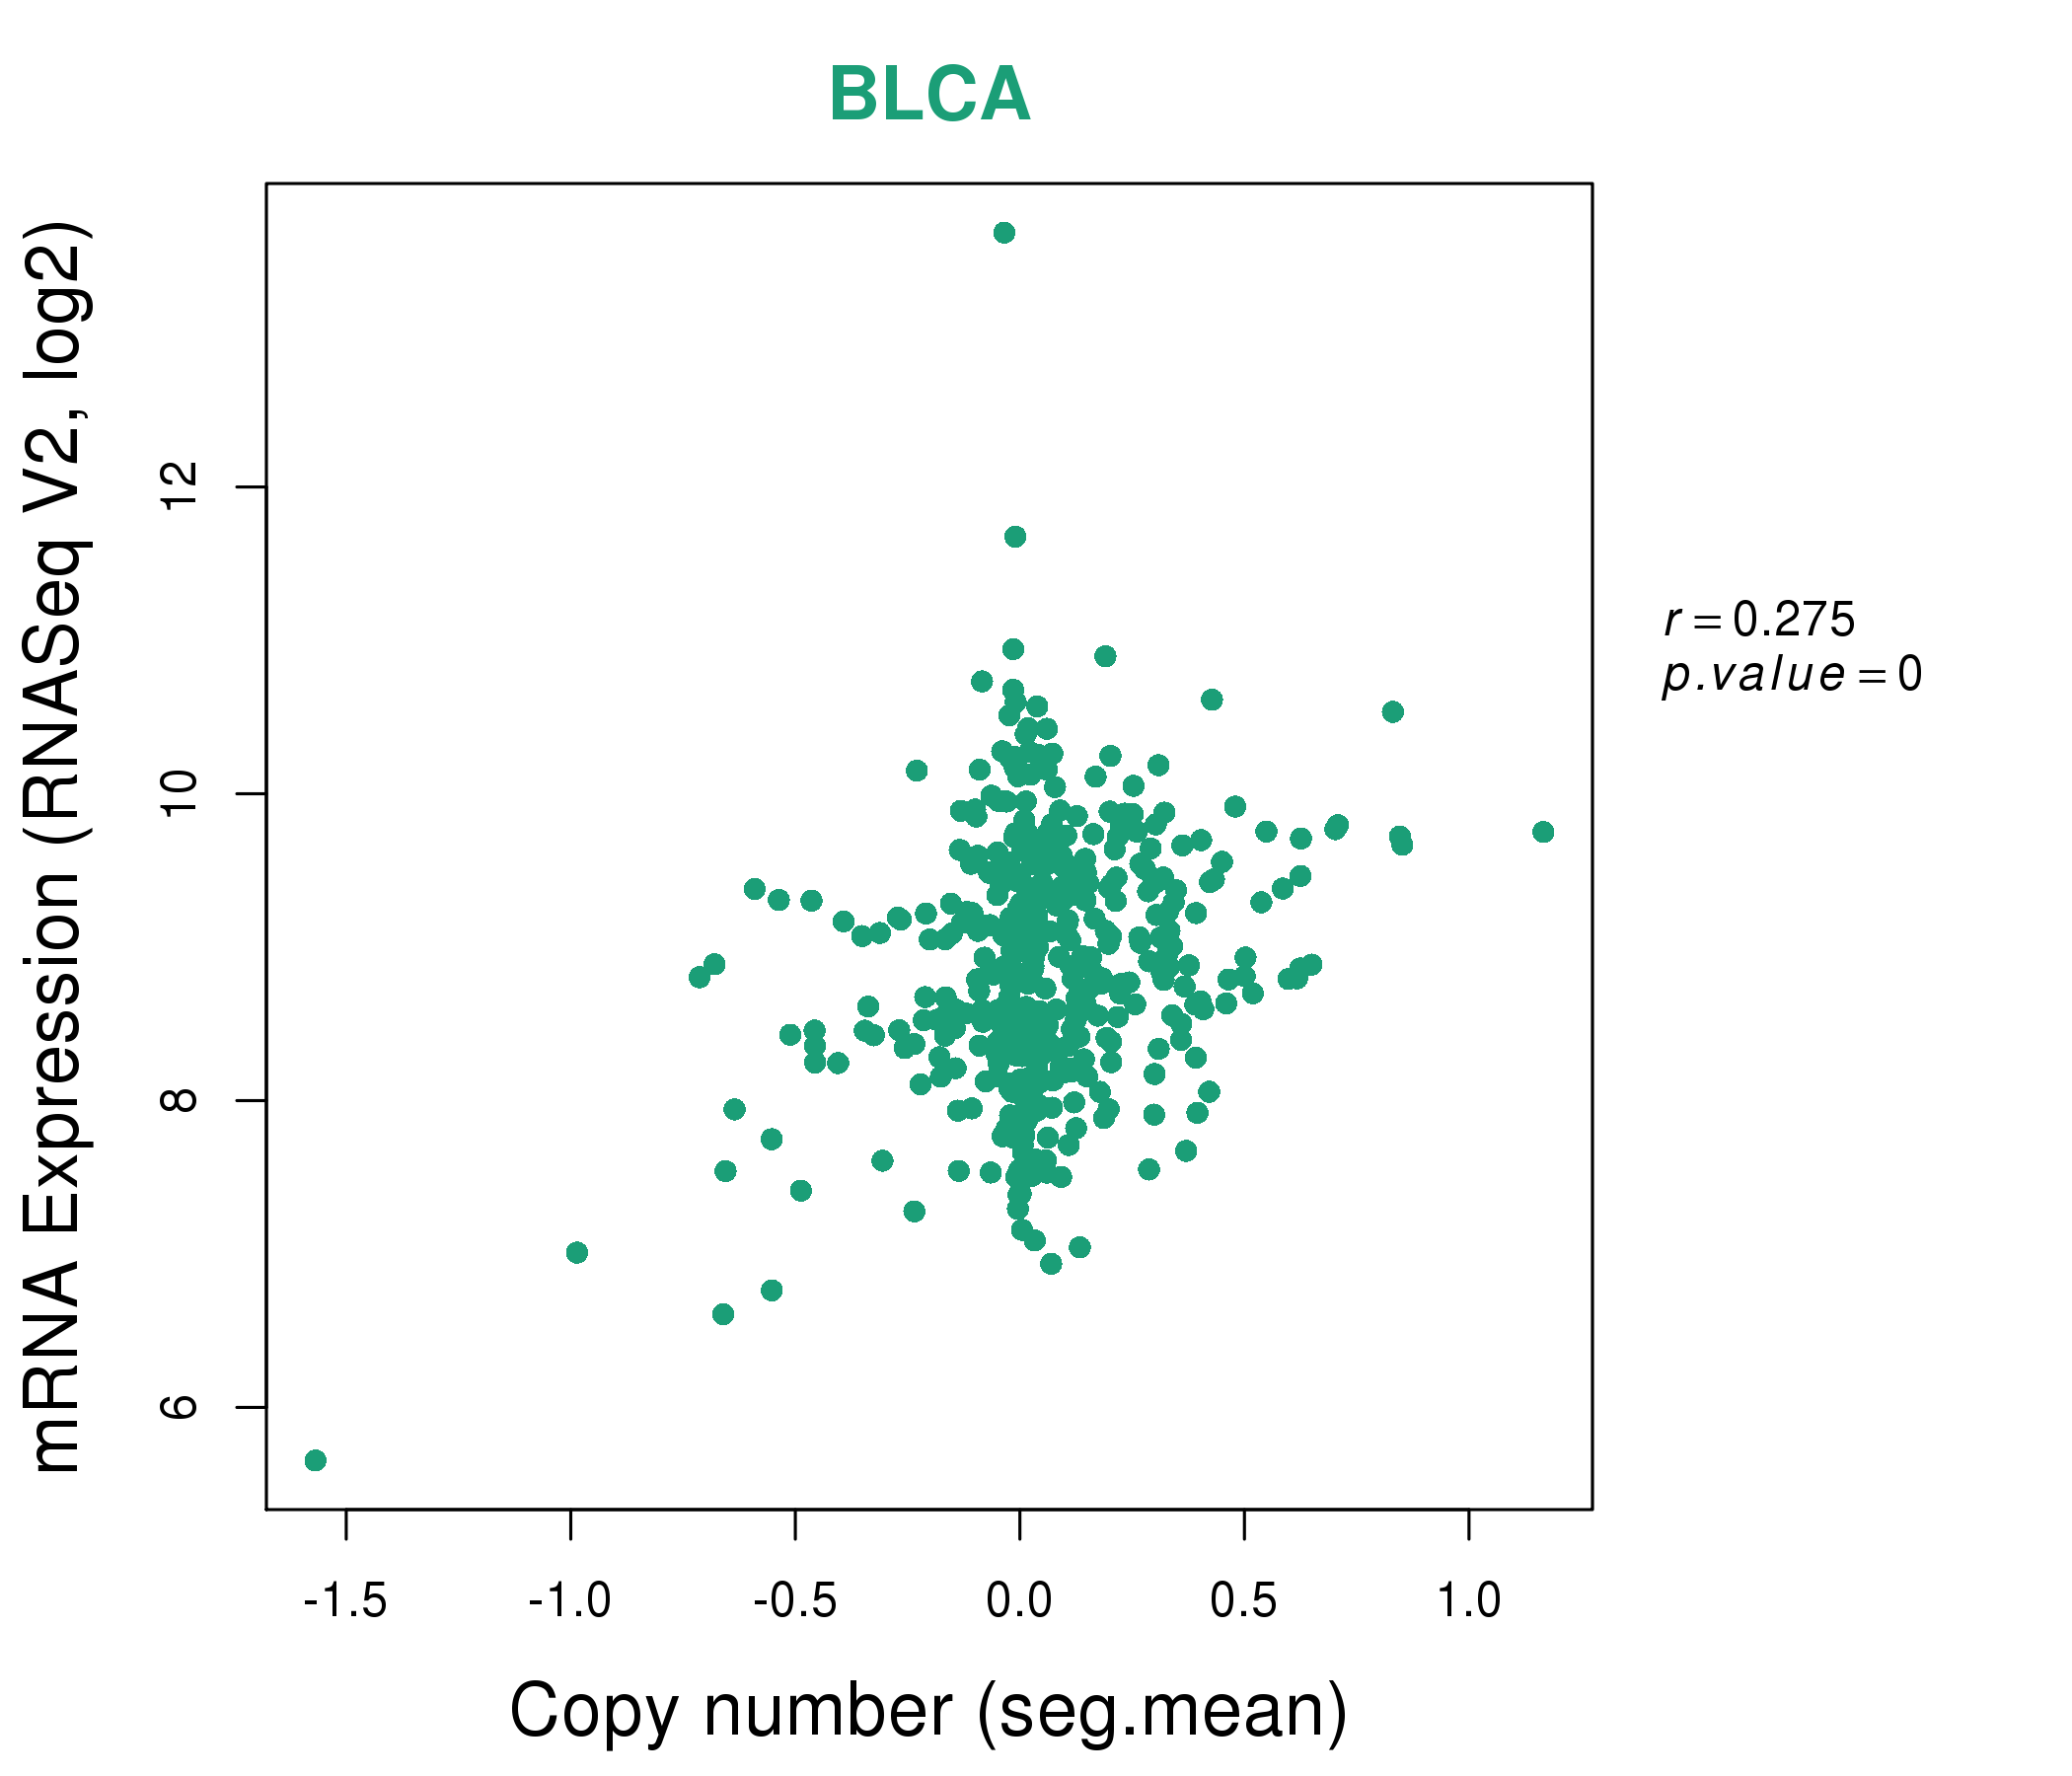
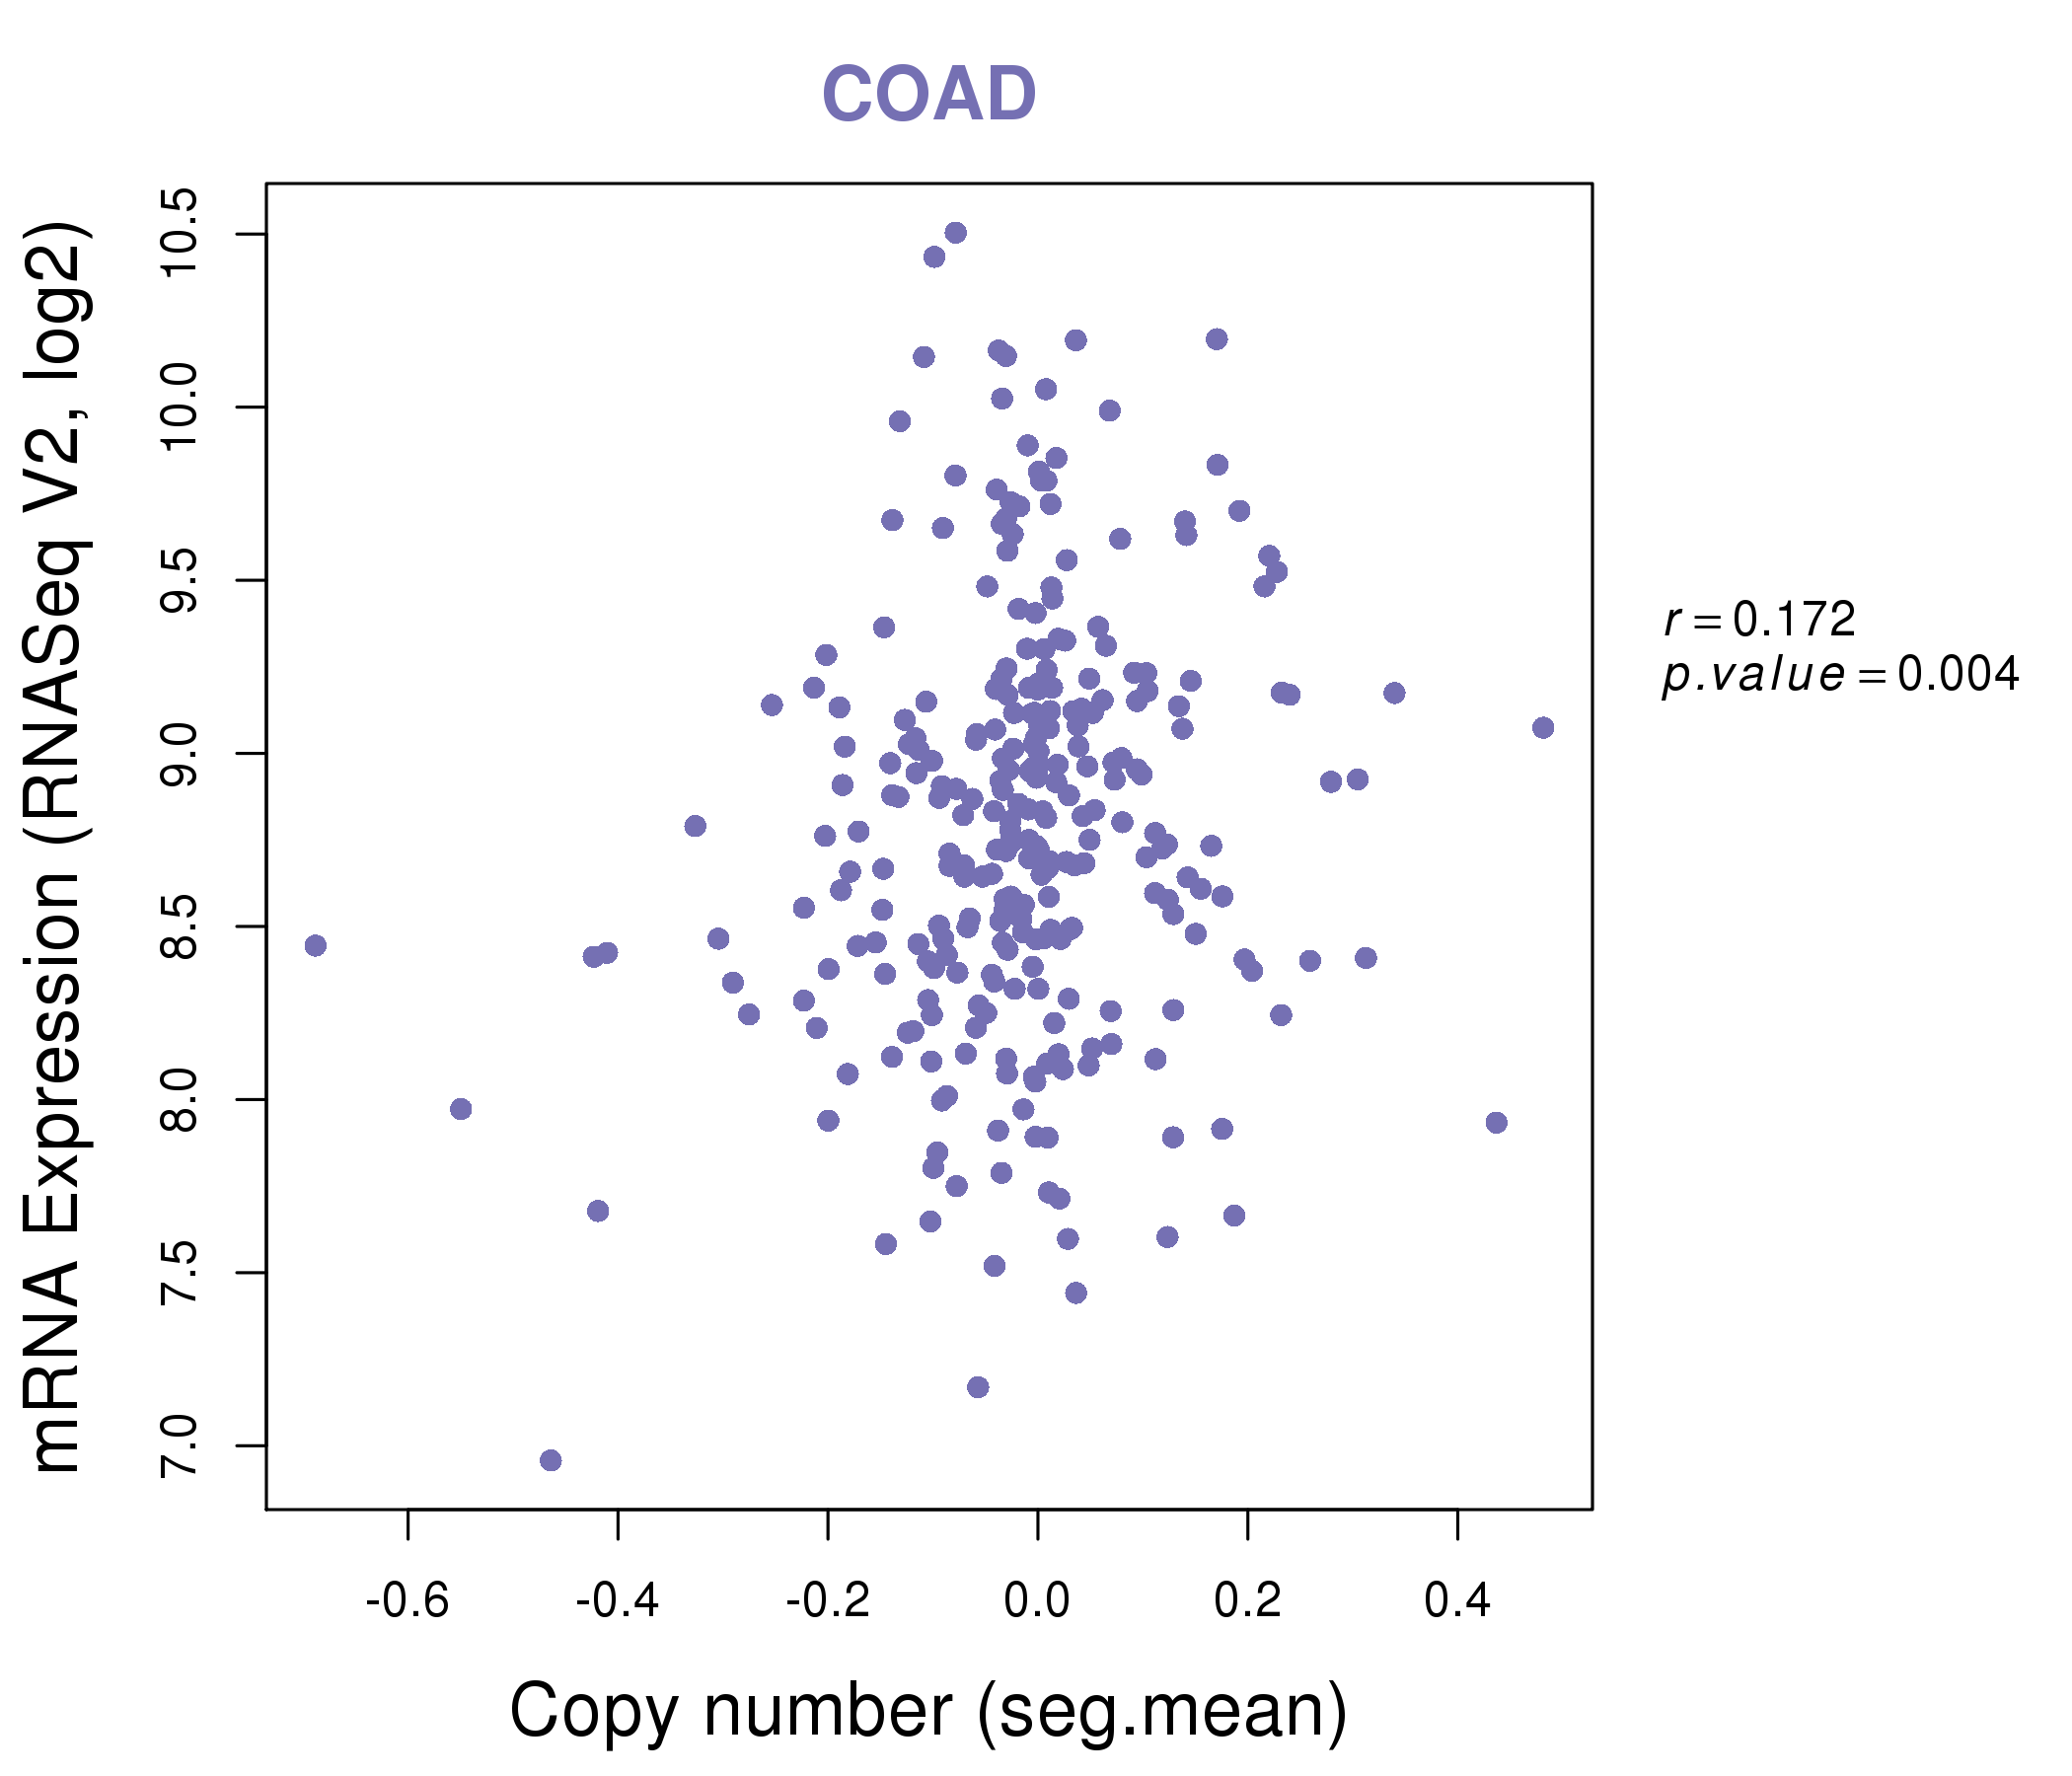
| * This plots show the correlation between CNV and gene expression. |
: Open all plots for all cancer types
 |
|
 |
|

| Top |
| Gene-Gene Network Information |
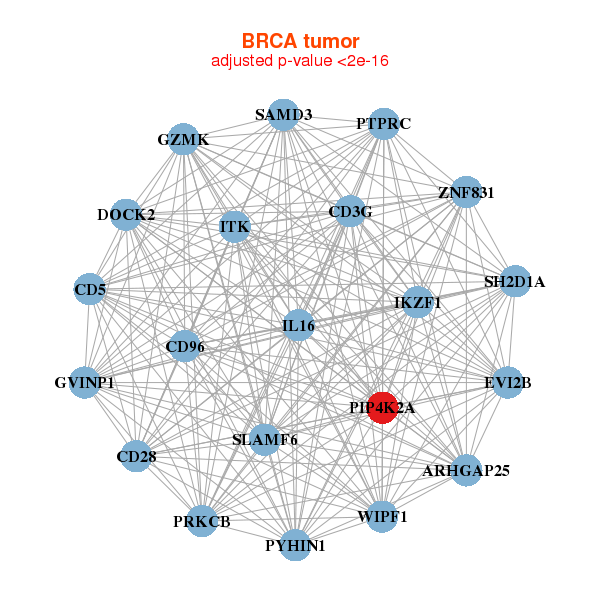
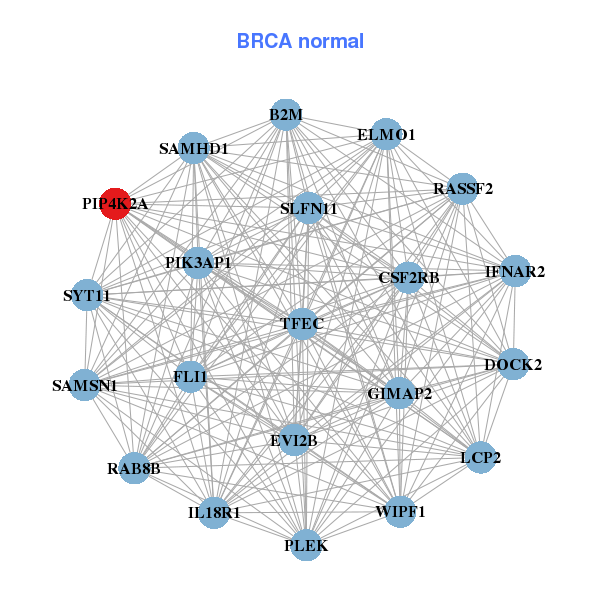
| * Co-Expression network figures were drawn using R package igraph. Only the top 20 genes with the highest correlations were shown. Red circle: input gene, orange circle: cell metabolism gene, sky circle: other gene |
: Open all plots for all cancer types
 |
|
| ARHGAP25,CD28,CD3G,CD5,CD96,DOCK2,EVI2B, GVINP1,GZMK,IKZF1,IL16,ITK,PIP4K2A,PRKCB, PTPRC,PYHIN1,SAMD3,SH2D1A,SLAMF6,WIPF1,ZNF831 | B2M,CSF2RB,DOCK2,ELMO1,EVI2B,FLI1,GIMAP2, IFNAR2,IL18R1,LCP2,PIK3AP1,PIP4K2A,PLEK,RAB8B, RASSF2,SAMHD1,SAMSN1,SLFN11,SYT11,TFEC,WIPF1 |
 |
|
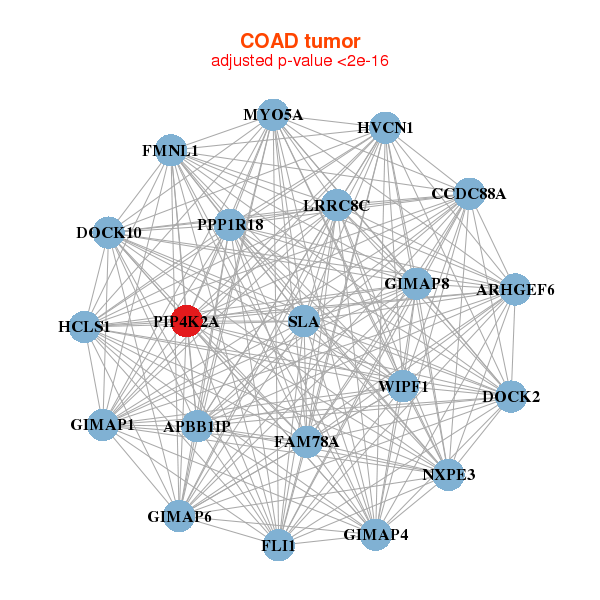
| APBB1IP,ARHGEF6,CCDC88A,DOCK10,DOCK2,NXPE3,FAM78A, FLI1,FMNL1,GIMAP1,GIMAP4,GIMAP6,GIMAP8,HCLS1, HVCN1,PPP1R18,LRRC8C,MYO5A,PIP4K2A,SLA,WIPF1 | ANKRD44,APBB1IP,ARHGAP25,ARHGAP30,BEND4,CHST11,FLI1, FMNL3,HVCN1,INPP5D,KIAA0922,NCKAP1L,ORAI2,PIK3CD, PIP4K2A,RAB39B,RFTN1,SH2D3C,SPOCK2,TRAF1,WIPF1 |
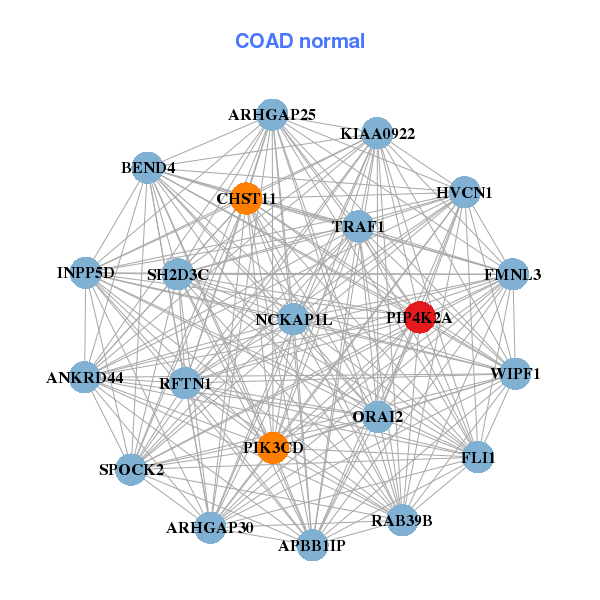
| * Co-Expression network figures were drawn using R package igraph. Only the top 20 genes with the highest correlations were shown. Red circle: input gene, orange circle: cell metabolism gene, sky circle: other gene |
: Open all plots for all cancer types
| Top |
: Open all interacting genes' information including KEGG pathway for all interacting genes from DAVID
| Top |
| Pharmacological Information for PIP4K2A |
| There's no related Drug. |
| Top |
| Cross referenced IDs for PIP4K2A |
| * We obtained these cross-references from Uniprot database. It covers 150 different DBs, 18 categories. http://www.uniprot.org/help/cross_references_section |
: Open all cross reference information
|
Copyright © 2016-Present - The Univsersity of Texas Health Science Center at Houston @ |