|
||||||||||||||||||||||||||||||||||||||||||||||||||||||||||||||||||||||||||||||||||||||||||||||||||||||||||||||||||||||||||||||||||||||||||||||||||||||||||||||||||||||||||||||||||||||||||||||||||||||||||||||||||||||||||||||||||||||||||||||||||||||||||||||||||||||||||||||||||||||||||||||||||||||||||||||||||||||||||
| |
| Phenotypic Information (metabolism pathway, cancer, disease, phenome) |
| |
| |
| Gene-Gene Network Information: Co-Expression Network, Interacting Genes & KEGG |
| |
|


| Gene Summary for PLCB4 |
| Basic gene info. | Gene symbol | PLCB4 |
| Gene name | phospholipase C, beta 4 | |
| Synonyms | ARCND2|PI-PLC | |
| Cytomap | UCSC genome browser: 20p12 | |
| Genomic location | chr20 :9198036-9461462 | |
| Type of gene | protein-coding | |
| RefGenes | NM_000933.3, NM_001172646.1,NM_182797.2, | |
| Ensembl id | ENSG00000101333 | |
| Description | 1-phosphatidyl-D-myo-inositol-4,5-bisphosphate1-phosphatidylinositol 4,5-bisphosphate phosphodiesterase beta-4PLC-beta-4dJ1119D9.2 (Phopholipase C, beta 4 (1-Phosphatidylinositol-4,5-Bisphosphate Phosphodiesterase Beta 4))inositoltrisphosphohydrolase | |
| Modification date | 20141207 | |
| dbXrefs | MIM : 600810 | |
| HGNC : HGNC | ||
| Ensembl : ENSG00000101333 | ||
| HPRD : 02885 | ||
| Vega : OTTHUMG00000031853 | ||
| Protein | UniProt: Q15147 go to UniProt's Cross Reference DB Table | |
| Expression | CleanEX: HS_PLCB4 | |
| BioGPS: 5332 | ||
| Gene Expression Atlas: ENSG00000101333 | ||
| The Human Protein Atlas: ENSG00000101333 | ||
| Pathway | NCI Pathway Interaction Database: PLCB4 | |
| KEGG: PLCB4 | ||
| REACTOME: PLCB4 | ||
| ConsensusPathDB | ||
| Pathway Commons: PLCB4 | ||
| Metabolism | MetaCyc: PLCB4 | |
| HUMANCyc: PLCB4 | ||
| Regulation | Ensembl's Regulation: ENSG00000101333 | |
| miRBase: chr20 :9,198,036-9,461,462 | ||
| TargetScan: NM_000933 | ||
| cisRED: ENSG00000101333 | ||
| Context | iHOP: PLCB4 | |
| cancer metabolism search in PubMed: PLCB4 | ||
| UCL Cancer Institute: PLCB4 | ||
| Assigned class in ccmGDB | B - This gene belongs to cancer gene. | |
| Top |
| Phenotypic Information for PLCB4(metabolism pathway, cancer, disease, phenome) |
| Cancer | CGAP: PLCB4 |
| Familial Cancer Database: PLCB4 | |
| * This gene is included in those cancer gene databases. |
|
|
|
|
|
| . | ||||||||||||||||||||||||||||||||||||||||||||||||||||||||||||||||||||||||||||||||||||||||||||||||||||||||||||||||||||||||||||||||||||||||||||||||||||||||||||||||||||||||||||||||||||||||||||||||||||||||||||||||||||||||||||||||||||||||||||||||||||||||||||||||||||||||||||||||||||||||||||||||||||||||||||||||||||
Oncogene 1 | Significant driver gene in | |||||||||||||||||||||||||||||||||||||||||||||||||||||||||||||||||||||||||||||||||||||||||||||||||||||||||||||||||||||||||||||||||||||||||||||||||||||||||||||||||||||||||||||||||||||||||||||||||||||||||||||||||||||||||||||||||||||||||||||||||||||||||||||||||||||||||||||||||||||||||||||||||||||||||||||||||||||||||
| cf) number; DB name 1 Oncogene; http://nar.oxfordjournals.org/content/35/suppl_1/D721.long, 2 Tumor Suppressor gene; https://bioinfo.uth.edu/TSGene/, 3 Cancer Gene Census; http://www.nature.com/nrc/journal/v4/n3/abs/nrc1299.html, 4 CancerGenes; http://nar.oxfordjournals.org/content/35/suppl_1/D721.long, 5 Network of Cancer Gene; http://ncg.kcl.ac.uk/index.php, 1Therapeutic Vulnerabilities in Cancer; http://cbio.mskcc.org/cancergenomics/statius/ |
| KEGG_INOSITOL_PHOSPHATE_METABOLISM | |
| OMIM | 600810; gene. 600810; gene. 614669; phenotype. 614669; phenotype. |
| Orphanet | 137888; Auriculocondylar syndrome. 137888; Auriculocondylar syndrome. |
| Disease | KEGG Disease: PLCB4 |
| MedGen: PLCB4 (Human Medical Genetics with Condition) | |
| ClinVar: PLCB4 | |
| Phenotype | MGI: PLCB4 (International Mouse Phenotyping Consortium) |
| PhenomicDB: PLCB4 | |
| Mutations for PLCB4 |
| * Under tables are showing count per each tissue to give us broad intuition about tissue specific mutation patterns.You can go to the detailed page for each mutation database's web site. |
| - Statistics for Tissue and Mutation type | Top |
 |
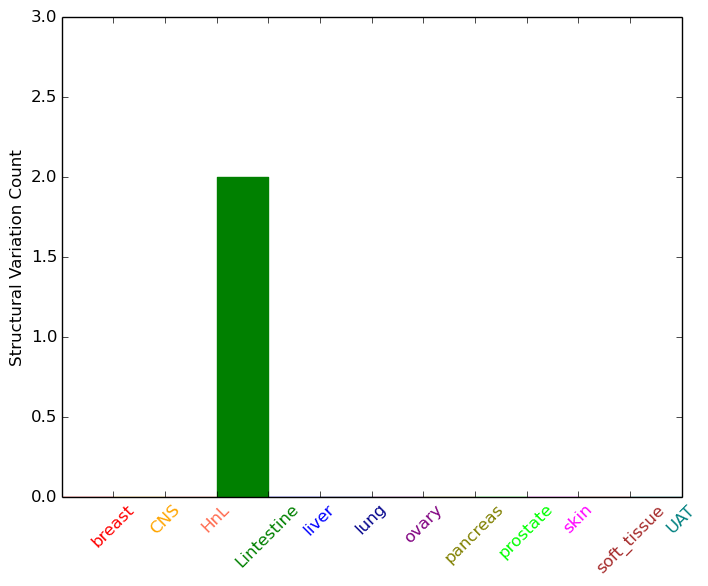
| - For Inter-chromosomal Variations |
| * Inter-chromosomal variantions includes 'interchromosomal amplicon to amplicon', 'interchromosomal amplicon to non-amplified dna', 'interchromosomal insertion', 'Interchromosomal unknown type'. |
 |
| - For Intra-chromosomal Variations |
| * Intra-chromosomal variantions includes 'intrachromosomal amplicon to amplicon', 'intrachromosomal amplicon to non-amplified dna', 'intrachromosomal deletion', 'intrachromosomal fold-back inversion', 'intrachromosomal inversion', 'intrachromosomal tandem duplication', 'Intrachromosomal unknown type', 'intrachromosomal with inverted orientation', 'intrachromosomal with non-inverted orientation'. |
 |
| Sample | Symbol_a | Chr_a | Start_a | End_a | Symbol_b | Chr_b | Start_b | End_b |
| ovary | PLCB4 | chr20 | 9309989 | 9310009 | chr20 | 20828440 | 20828460 |
| cf) Tissue number; Tissue name (1;Breast, 2;Central_nervous_system, 3;Haematopoietic_and_lymphoid_tissue, 4;Large_intestine, 5;Liver, 6;Lung, 7;Ovary, 8;Pancreas, 9;Prostate, 10;Skin, 11;Soft_tissue, 12;Upper_aerodigestive_tract) |
| * From mRNA Sanger sequences, Chitars2.0 arranged chimeric transcripts. This table shows PLCB4 related fusion information. |
| ID | Head Gene | Tail Gene | Accession | Gene_a | qStart_a | qEnd_a | Chromosome_a | tStart_a | tEnd_a | Gene_a | qStart_a | qEnd_a | Chromosome_a | tStart_a | tEnd_a |
| BE926711 | PLCB4 | 8 | 389 | 20 | 9404462 | 9417800 | PLCB4 | 387 | 480 | 20 | 9388562 | 9388655 | |
| DA775941 | ZC3H7A | 1 | 115 | 16 | 11854972 | 11855086 | PLCB4 | 106 | 567 | 20 | 9351444 | 9351904 | |
| BF346361 | PLCB4 | 582 | 621 | 20 | 9149571 | 9149611 | GBE1 | 621 | 648 | 3 | 81780156 | 81780186 | |
| AW519364 | RNF187 | 4 | 97 | 1 | 228682575 | 228682668 | PLCB4 | 88 | 211 | 20 | 9223560 | 9223685 | |
| Top |
| Mutation type/ Tissue ID | brca | cns | cerv | endome | haematopo | kidn | Lintest | liver | lung | ns | ovary | pancre | prost | skin | stoma | thyro | urina | |||
| Total # sample | 4 | 2 | 2 | 1 | 1 | |||||||||||||||
| GAIN (# sample) | 2 | 2 | 2 | 1 | 1 | |||||||||||||||
| LOSS (# sample) | 2 |
| cf) Tissue ID; Tissue type (1; Breast, 2; Central_nervous_system, 3; Cervix, 4; Endometrium, 5; Haematopoietic_and_lymphoid_tissue, 6; Kidney, 7; Large_intestine, 8; Liver, 9; Lung, 10; NS, 11; Ovary, 12; Pancreas, 13; Prostate, 14; Skin, 15; Stomach, 16; Thyroid, 17; Urinary_tract) |
| Top |
|
 |
| Top |
| Stat. for Non-Synonymous SNVs (# total SNVs=139) | (# total SNVs=34) |
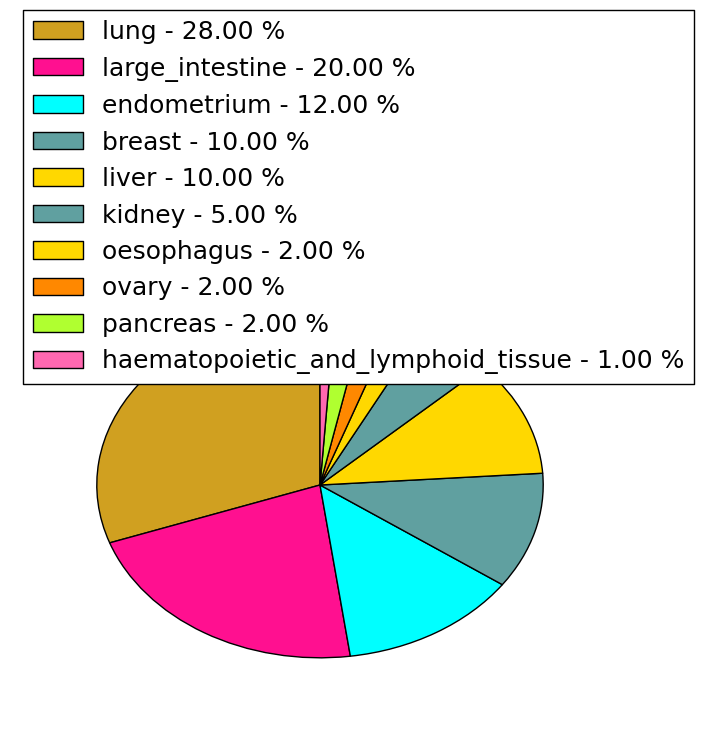 |  |
(# total SNVs=5) | (# total SNVs=2) |
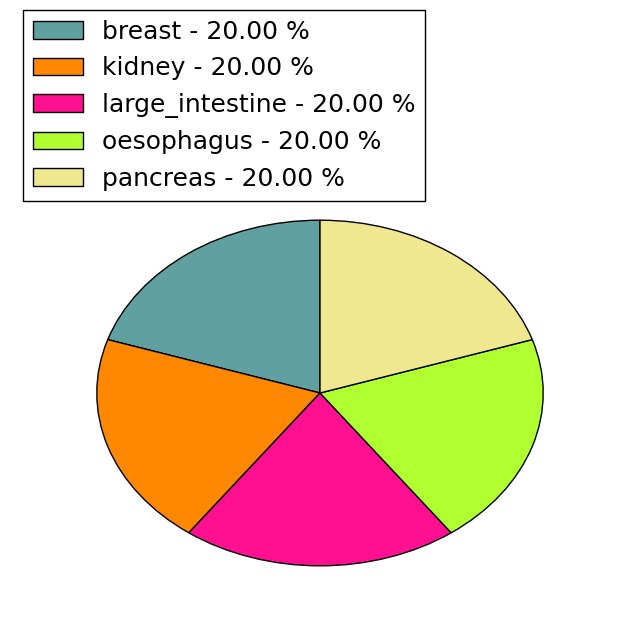 | 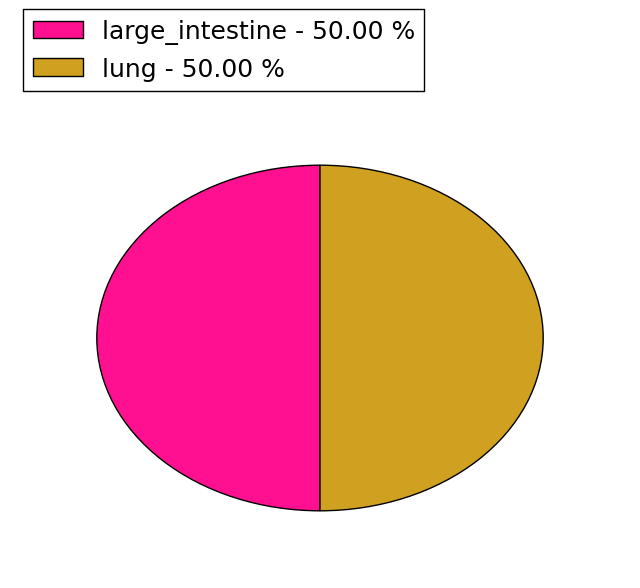 |
| Top |
| * When you move the cursor on each content, you can see more deailed mutation information on the Tooltip. Those are primary_site,primary_histology,mutation(aa),pubmedID. |
| GRCh37 position | Mutation(aa) | Unique sampleID count |
| chr20:9404516-9404516 | p.R802Q | 5 |
| chr20:9417698-9417698 | p.G876E | 5 |
| chr20:9449315-9449315 | p.E1104K | 5 |
| chr20:9391729-9391729 | p.S670L | 5 |
| chr20:9400450-9400450 | p.? | 3 |
| chr20:9402041-9402041 | p.R739Q | 3 |
| chr20:9459645-9459645 | p.N1192H | 3 |
| chr20:9434098-9434098 | p.M983I | 3 |
| chr20:9364983-9364983 | p.T330I | 3 |
| chr20:9459604-9459604 | p.R1178P | 2 |
| Top |
|
 |
| Point Mutation/ Tissue ID | 1 | 2 | 3 | 4 | 5 | 6 | 7 | 8 | 9 | 10 | 11 | 12 | 13 | 14 | 15 | 16 | 17 | 18 | 19 | 20 |
| # sample | 2 | 7 | 19 | 2 | 10 | 6 | 24 | 10 | 5 | 2 | 62 | 11 | 11 | |||||||
| # mutation | 2 | 7 | 19 | 2 | 10 | 6 | 28 | 10 | 5 | 2 | 74 | 13 | 18 | |||||||
| nonsynonymous SNV | 2 | 6 | 18 | 1 | 8 | 5 | 18 | 6 | 3 | 2 | 57 | 11 | 15 | |||||||
| synonymous SNV | 1 | 1 | 1 | 2 | 1 | 10 | 4 | 2 | 17 | 2 | 3 |
| cf) Tissue ID; Tissue type (1; BLCA[Bladder Urothelial Carcinoma], 2; BRCA[Breast invasive carcinoma], 3; CESC[Cervical squamous cell carcinoma and endocervical adenocarcinoma], 4; COAD[Colon adenocarcinoma], 5; GBM[Glioblastoma multiforme], 6; Glioma Low Grade, 7; HNSC[Head and Neck squamous cell carcinoma], 8; KICH[Kidney Chromophobe], 9; KIRC[Kidney renal clear cell carcinoma], 10; KIRP[Kidney renal papillary cell carcinoma], 11; LAML[Acute Myeloid Leukemia], 12; LUAD[Lung adenocarcinoma], 13; LUSC[Lung squamous cell carcinoma], 14; OV[Ovarian serous cystadenocarcinoma ], 15; PAAD[Pancreatic adenocarcinoma], 16; PRAD[Prostate adenocarcinoma], 17; SKCM[Skin Cutaneous Melanoma], 18:STAD[Stomach adenocarcinoma], 19:THCA[Thyroid carcinoma], 20:UCEC[Uterine Corpus Endometrial Carcinoma]) |
| Top |
| * We represented just top 10 SNVs. When you move the cursor on each content, you can see more deailed mutation information on the Tooltip. Those are primary_site, primary_histology, mutation(aa), pubmedID. |
| Genomic Position | Mutation(aa) | Unique sampleID count |
| chr20:9404516 | p.G876E,PLCB4 | 4 |
| chr20:9417698 | p.R802Q,PLCB4 | 4 |
| chr20:9391729 | p.E1104K,PLCB4 | 3 |
| chr20:9449315 | p.R739L,PLCB4 | 3 |
| chr20:9434098 | p.S670L,PLCB4 | 3 |
| chr20:9402041 | p.M983I,PLCB4 | 3 |
| chr20:9376218 | p.L992L,PLCB4 | 2 |
| chr20:9438112 | p.P1181L,PLCB4 | 2 |
| chr20:9391708 | p.E513K,PLCB4 | 2 |
| chr20:9434089 | p.K839N,PLCB4 | 2 |
| * Copy number data were extracted from TCGA using R package TCGA-Assembler. The URLs of all public data files on TCGA DCC data server were gathered on Jan-05-2015. Function ProcessCNAData in TCGA-Assembler package was used to obtain gene-level copy number value which is calculated as the average copy number of the genomic region of a gene. |
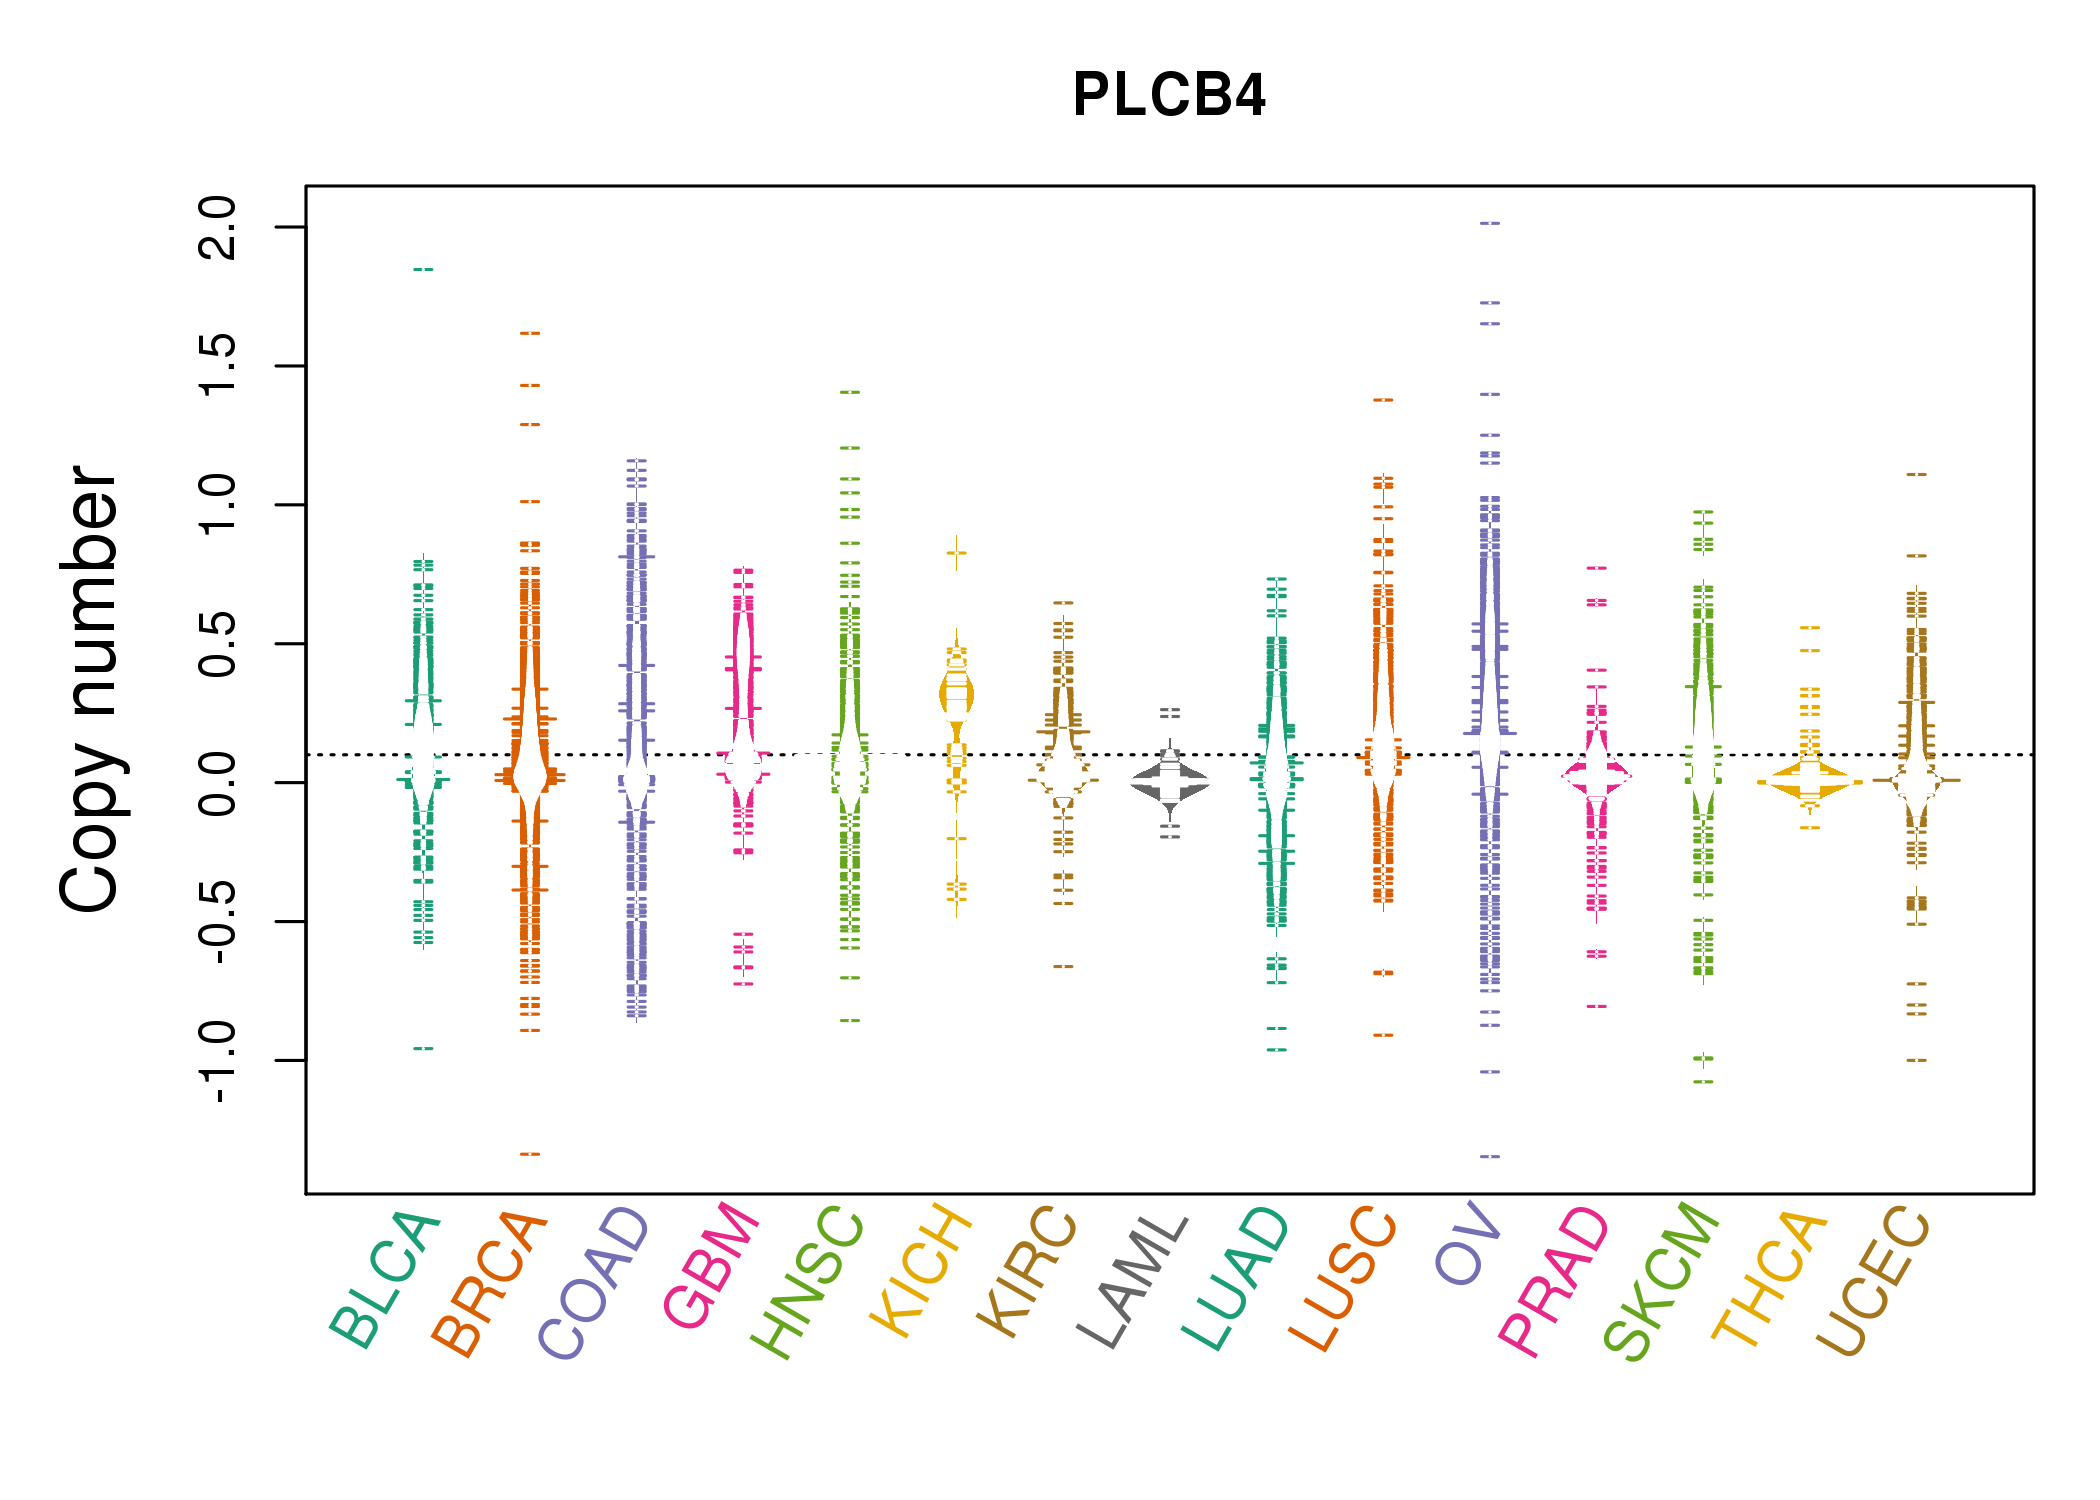 |
| cf) Tissue ID[Tissue type]: BLCA[Bladder Urothelial Carcinoma], BRCA[Breast invasive carcinoma], CESC[Cervical squamous cell carcinoma and endocervical adenocarcinoma], COAD[Colon adenocarcinoma], GBM[Glioblastoma multiforme], Glioma Low Grade, HNSC[Head and Neck squamous cell carcinoma], KICH[Kidney Chromophobe], KIRC[Kidney renal clear cell carcinoma], KIRP[Kidney renal papillary cell carcinoma], LAML[Acute Myeloid Leukemia], LUAD[Lung adenocarcinoma], LUSC[Lung squamous cell carcinoma], OV[Ovarian serous cystadenocarcinoma ], PAAD[Pancreatic adenocarcinoma], PRAD[Prostate adenocarcinoma], SKCM[Skin Cutaneous Melanoma], STAD[Stomach adenocarcinoma], THCA[Thyroid carcinoma], UCEC[Uterine Corpus Endometrial Carcinoma] |
| Top |
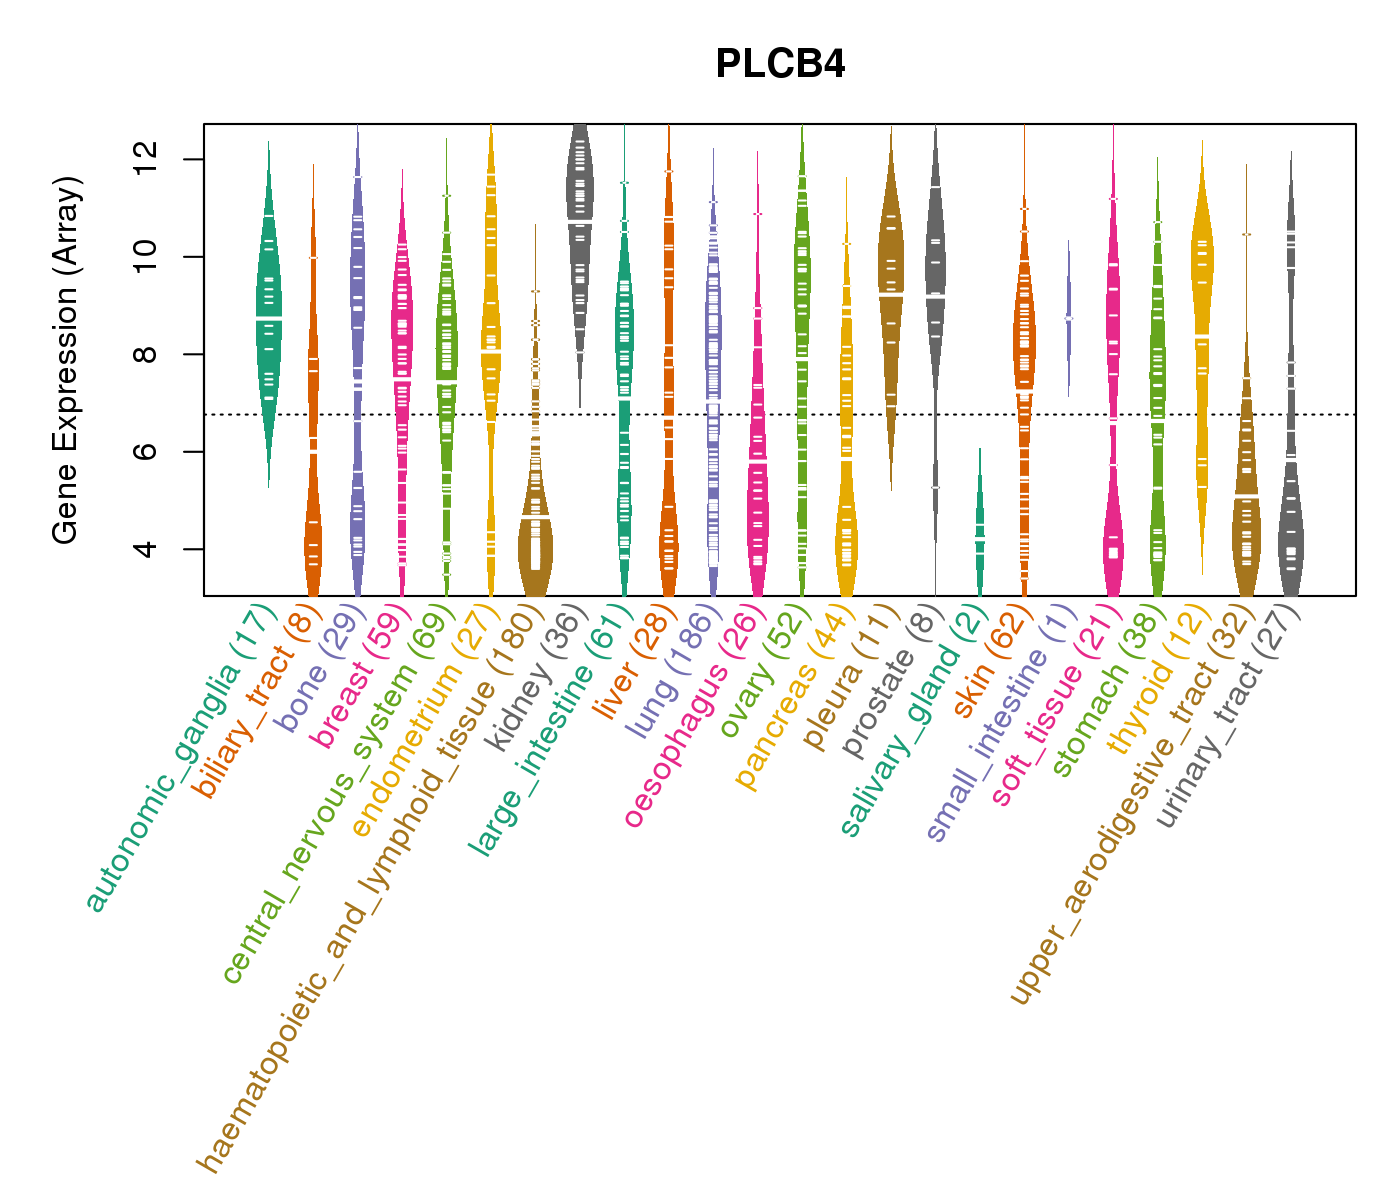
| Gene Expression for PLCB4 |
| * CCLE gene expression data were extracted from CCLE_Expression_Entrez_2012-10-18.res: Gene-centric RMA-normalized mRNA expression data. |
 |
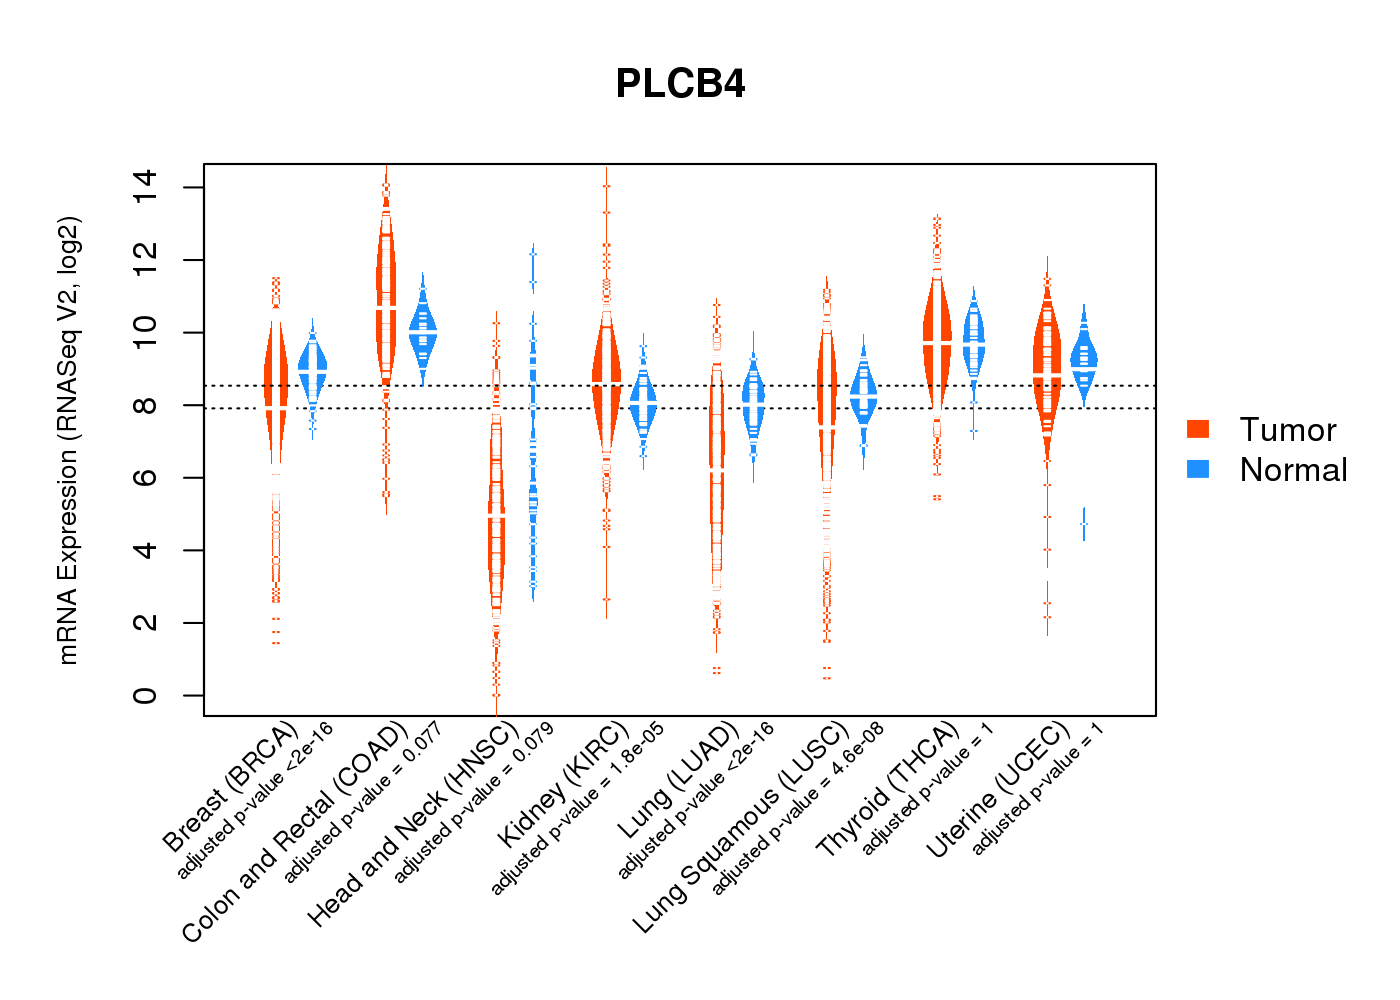
| * Normalized gene expression data of RNASeqV2 was extracted from TCGA using R package TCGA-Assembler. The URLs of all public data files on TCGA DCC data server were gathered at Jan-05-2015. Only eight cancer types have enough normal control samples for differential expression analysis. (t test, adjusted p<0.05 (using Benjamini-Hochberg FDR)) |
 |
| Top |
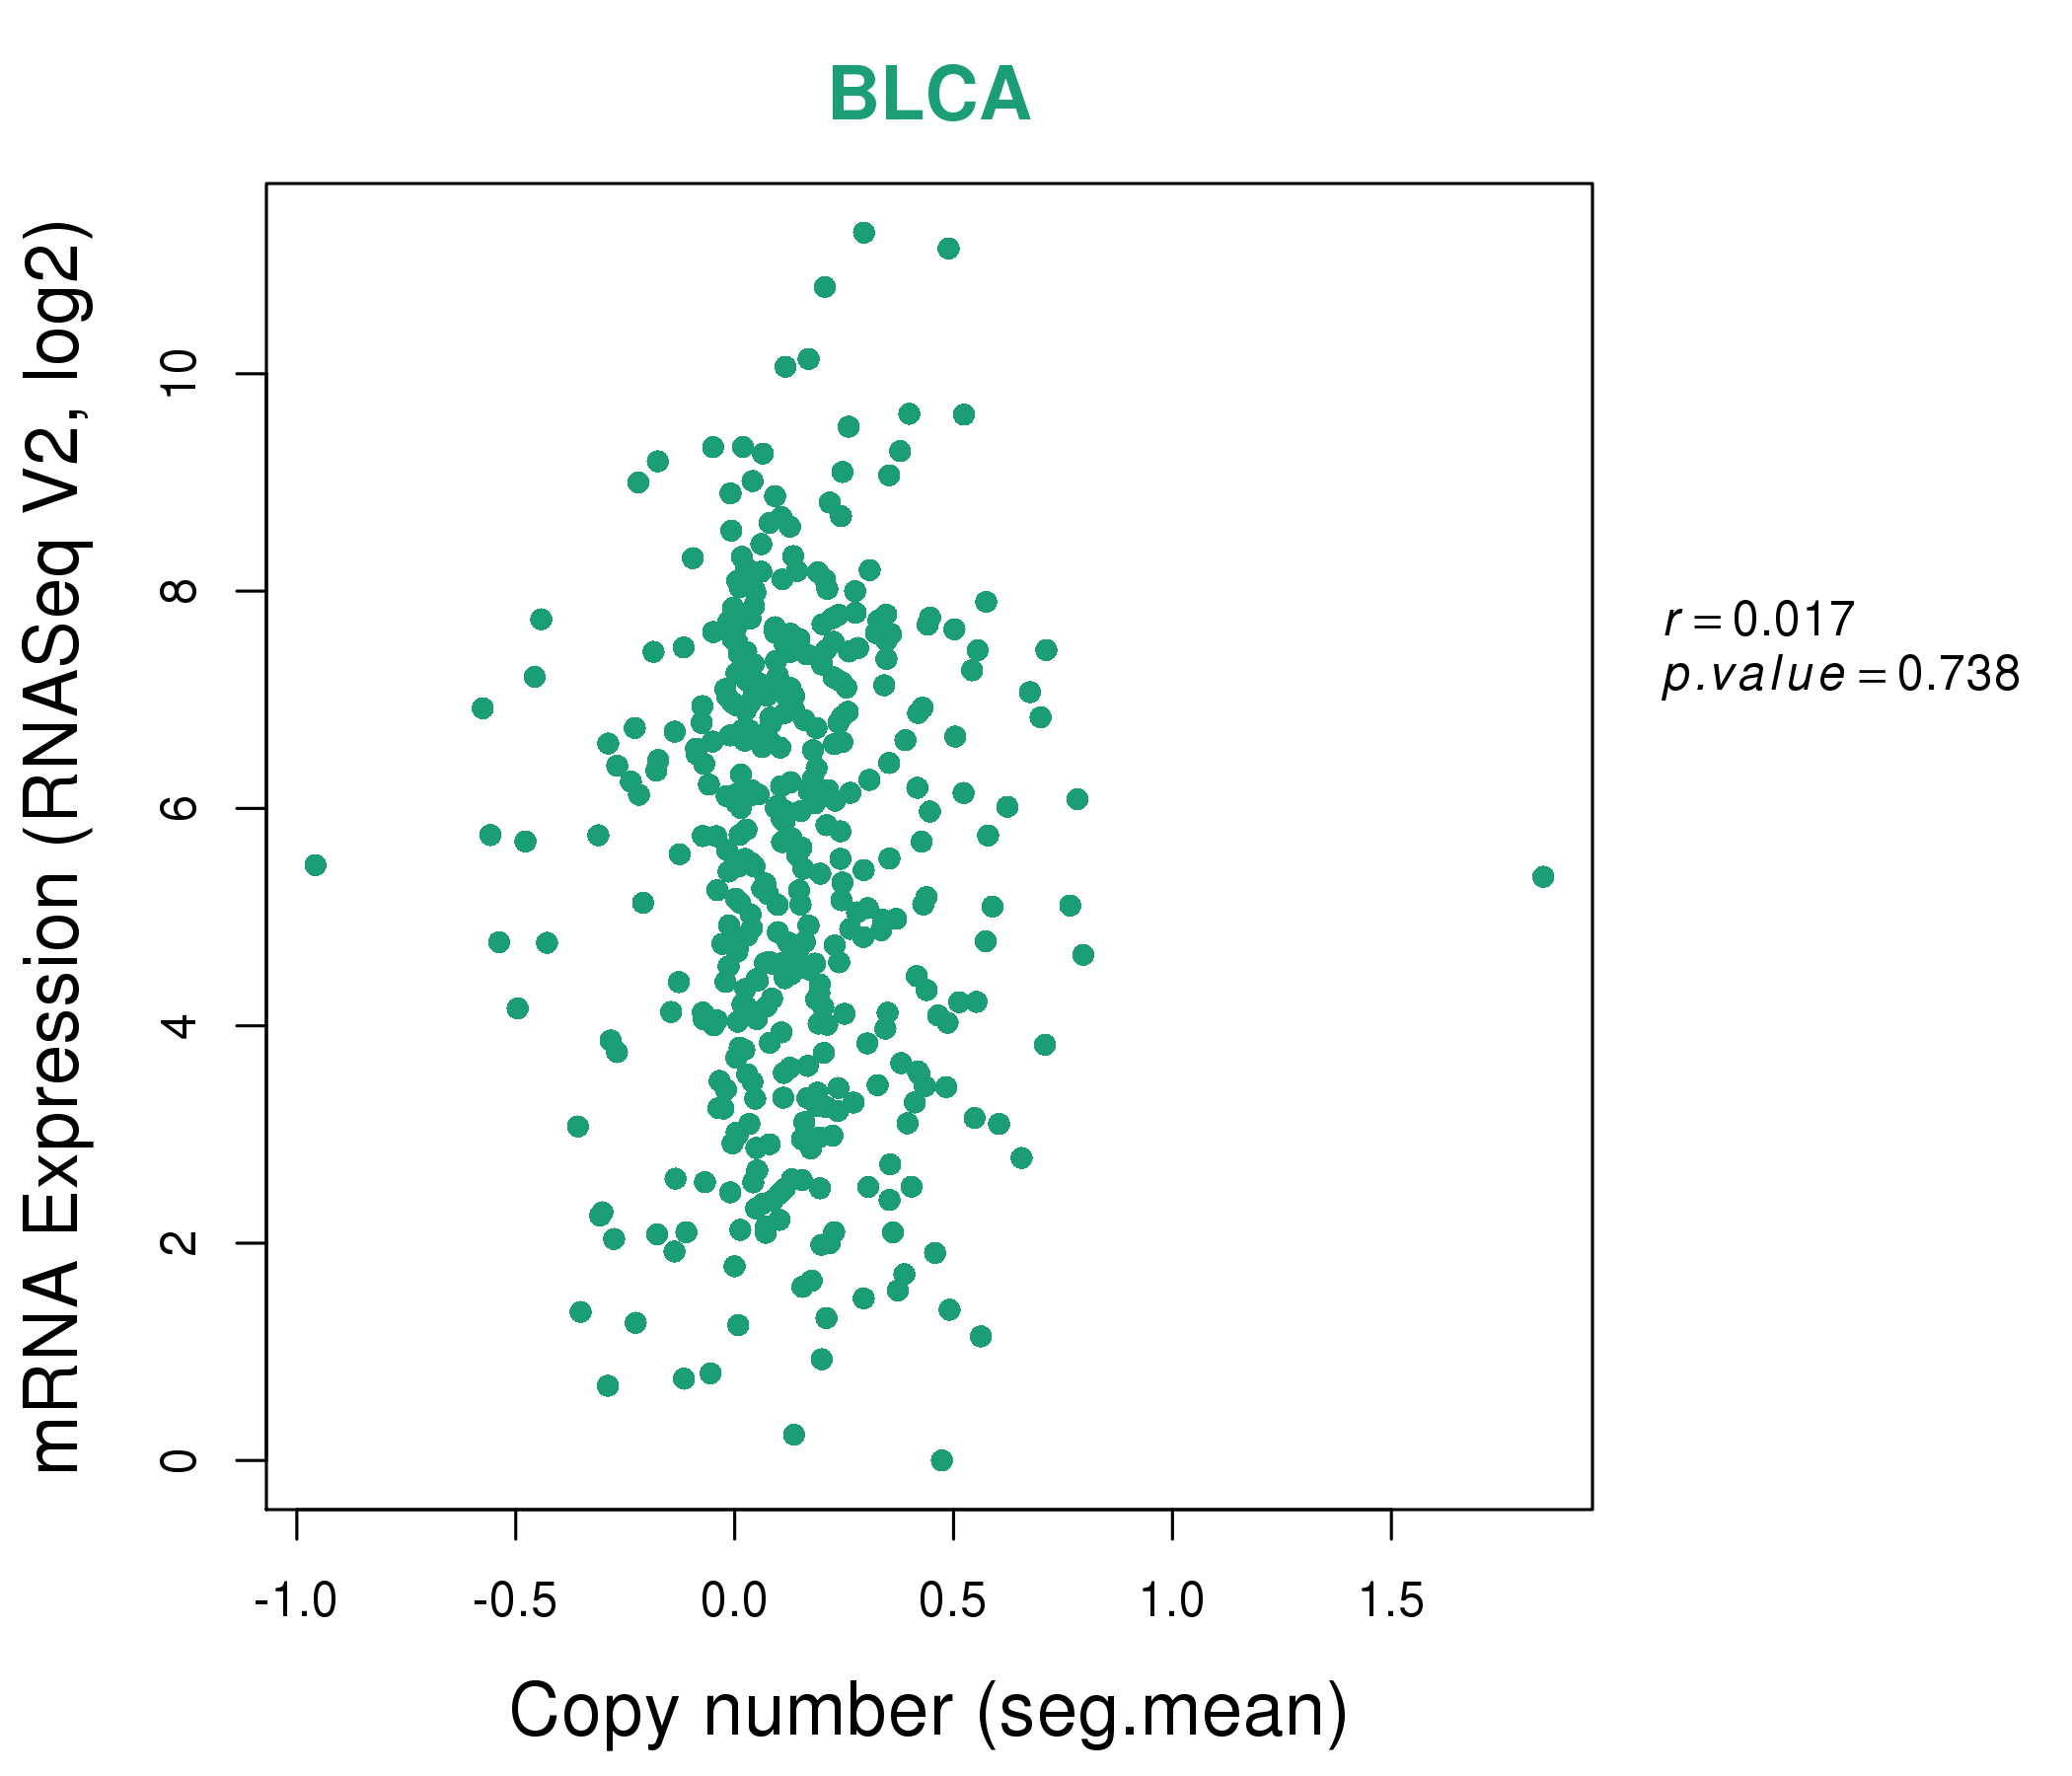
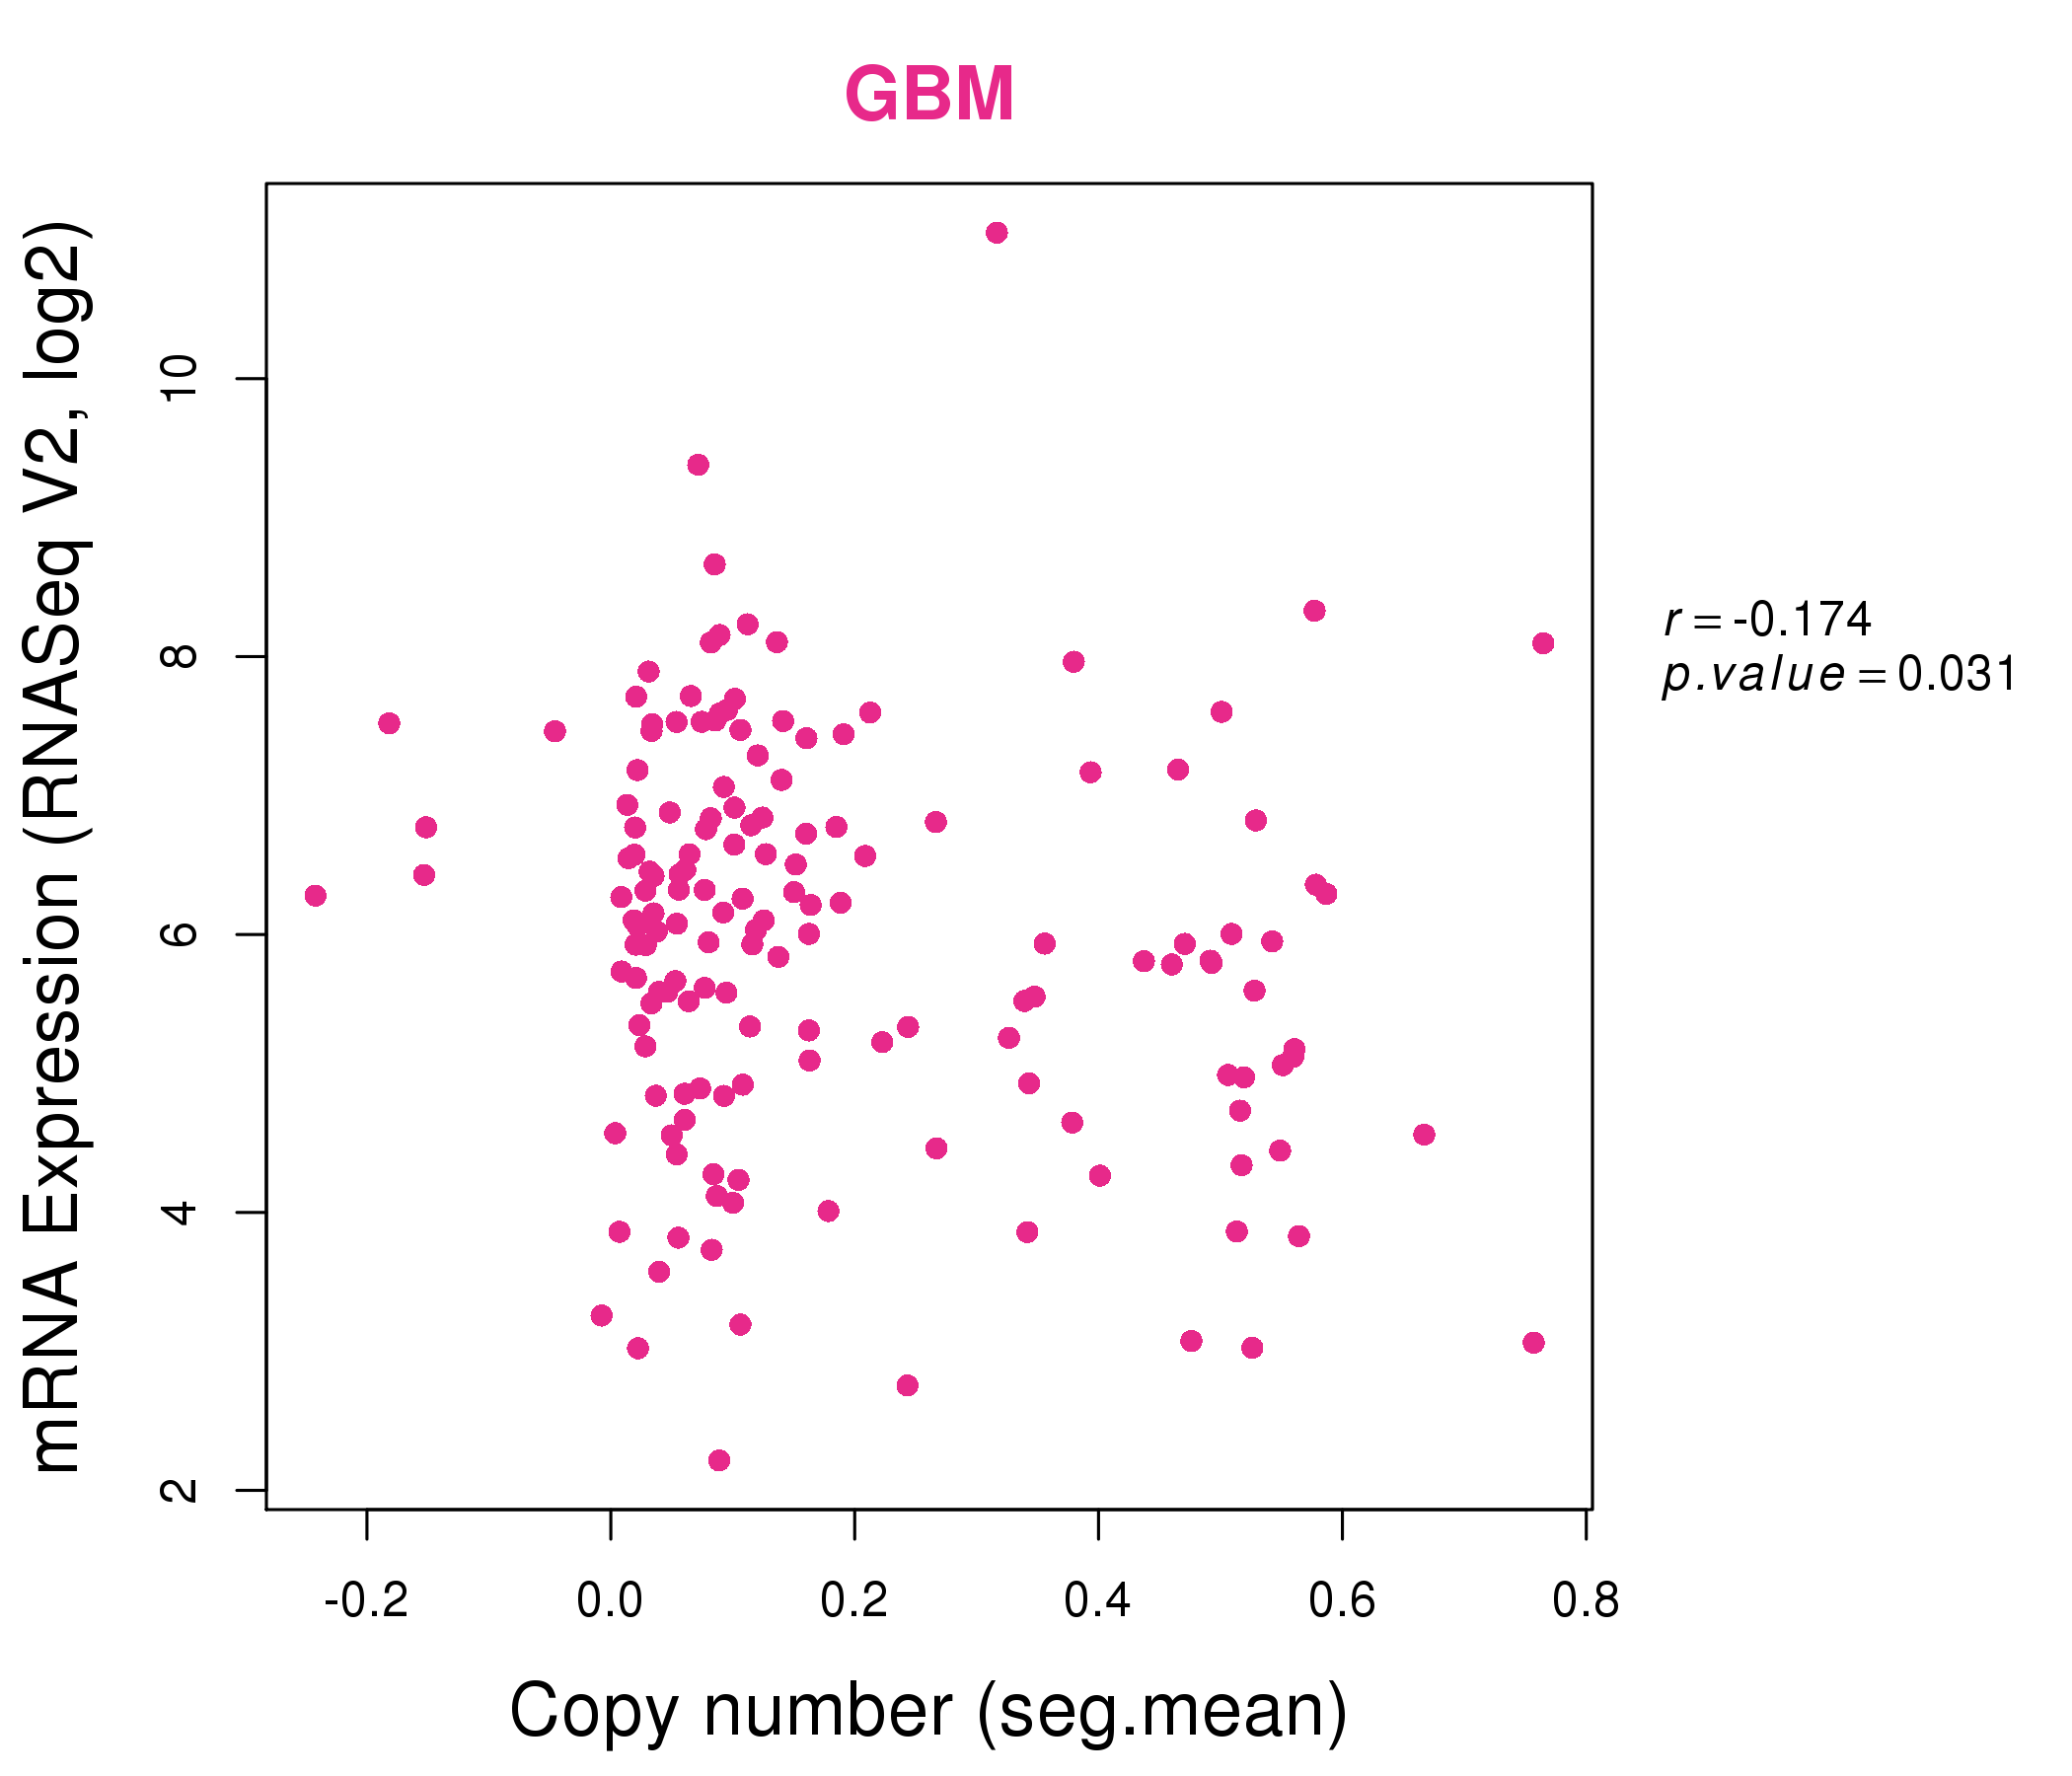
| * This plots show the correlation between CNV and gene expression. |
: Open all plots for all cancer types
 |
|
 |
|

| Top |
| Gene-Gene Network Information |
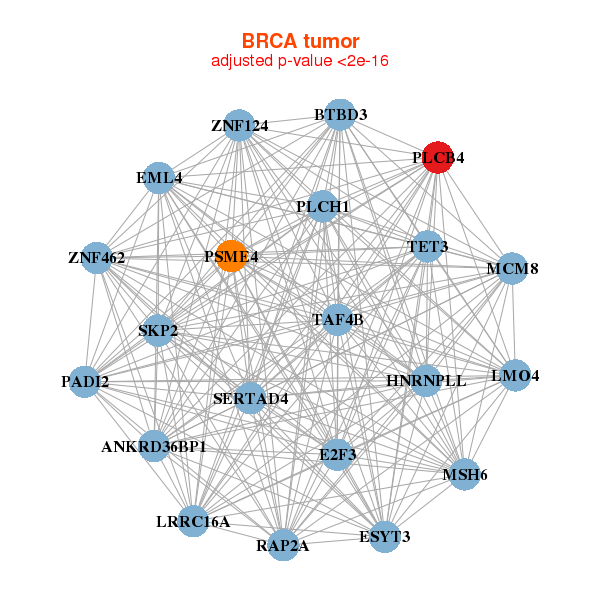
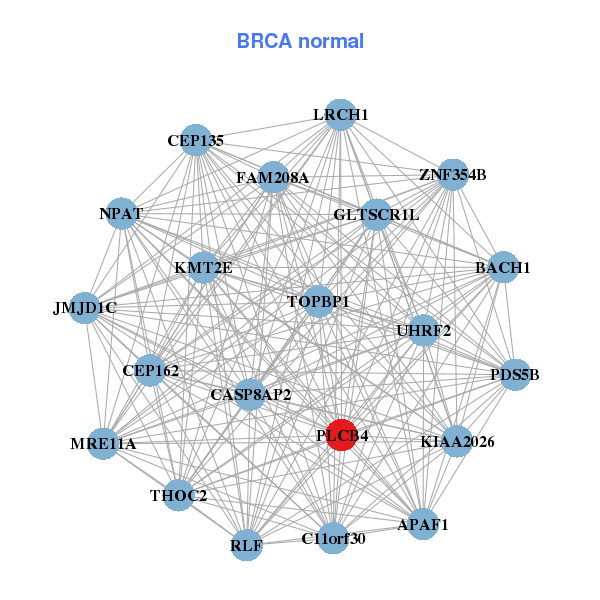
| * Co-Expression network figures were drawn using R package igraph. Only the top 20 genes with the highest correlations were shown. Red circle: input gene, orange circle: cell metabolism gene, sky circle: other gene |
: Open all plots for all cancer types
 |
|
| ANKRD36BP1,BTBD3,E2F3,EML4,ESYT3,HNRNPLL,LMO4, LRRC16A,MCM8,MSH6,PADI2,PLCB4,PLCH1,PSME4, RAP2A,SERTAD4,SKP2,TAF4B,TET3,ZNF124,ZNF462 | APAF1,BACH1,C11orf30,FAM208A,CASP8AP2,CEP135,JMJD1C, GLTSCR1L,CEP162,KIAA2026,LRCH1,KMT2E,MRE11A,NPAT, PDS5B,PLCB4,RLF,THOC2,TOPBP1,UHRF2,ZNF354B |
 |
|
| ASB12,C20orf196,CDS2,CRLS1,CSRP2BP,FERMT1,GPCPD1, NAALADL2,NR1I2,NUDT4,PLCB4,PTPRA,SHROOM4,ST6GAL1, TASP1,TRMT6,TSPAN6,VAV3,ZDHHC9,ZNF343,ZNF41 | ADAMTS18,ALOX12B,CCDC129,COL4A6,FKTN,FOXA1,HTR3E, KIAA1804,KREMEN1,LIMD1,FOXD2-AS1,NAPEPLD,PLAGL1,PLCB4, REPS2,SH2D7,SOX9,TAS1R3,TRPM5,ZBTB10,ZNF814 |
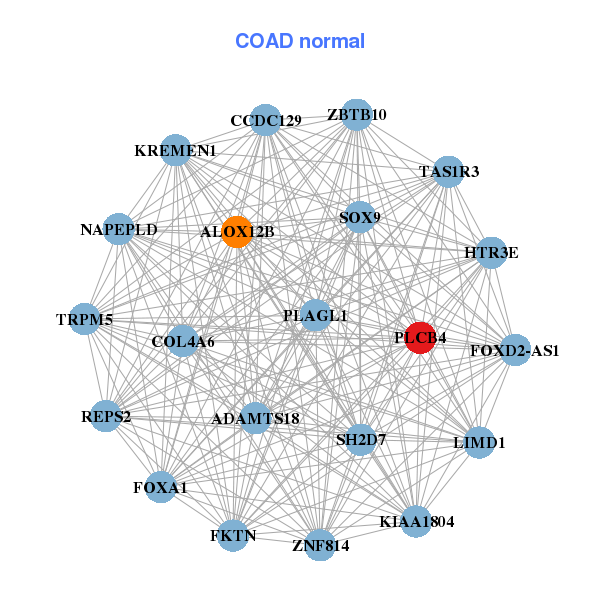
| * Co-Expression network figures were drawn using R package igraph. Only the top 20 genes with the highest correlations were shown. Red circle: input gene, orange circle: cell metabolism gene, sky circle: other gene |
: Open all plots for all cancer types
| Top |
: Open all interacting genes' information including KEGG pathway for all interacting genes from DAVID
| Top |
| Pharmacological Information for PLCB4 |
| There's no related Drug. |
| Top |
| Cross referenced IDs for PLCB4 |
| * We obtained these cross-references from Uniprot database. It covers 150 different DBs, 18 categories. http://www.uniprot.org/help/cross_references_section |
: Open all cross reference information
|
Copyright © 2016-Present - The Univsersity of Texas Health Science Center at Houston @ |