|
||||||||||||||||||||
| |
| Phenotypic Information (metabolism pathway, cancer, disease, phenome) |
| |
| |
| Gene-Gene Network Information: Co-Expression Network, Interacting Genes & KEGG |
| |
|


| Gene Summary for PLCD1 |
| Basic gene info. | Gene symbol | PLCD1 |
| Gene name | phospholipase C, delta 1 | |
| Synonyms | NDNC3|PLC-III | |
| Cytomap | UCSC genome browser: 3p22-p21.3 | |
| Genomic location | chr3 :38048986-38066278 | |
| Type of gene | protein-coding | |
| RefGenes | NM_001130964.1, NM_006225.3,NR_024071.1, | |
| Ensembl id | ENSG00000187091 | |
| Description | 1-phosphatidylinositol 4,5-bisphosphate phosphodiesterase delta-11-phosphatidylinositol-4,5-bisphosphate phosphodiesterase delta-1PLC-delta-1phosphoinositide phospholipase C-delta-1phospholipase C-III | |
| Modification date | 20141207 | |
| dbXrefs | MIM : 602142 | |
| HGNC : HGNC | ||
| Ensembl : ENSG00000187091 | ||
| HPRD : 09073 | ||
| Vega : OTTHUMG00000130813 | ||
| Protein | UniProt: P51178 go to UniProt's Cross Reference DB Table | |
| Expression | CleanEX: HS_PLCD1 | |
| BioGPS: 5333 | ||
| Gene Expression Atlas: ENSG00000187091 | ||
| The Human Protein Atlas: ENSG00000187091 | ||
| Pathway | NCI Pathway Interaction Database: PLCD1 | |
| KEGG: PLCD1 | ||
| REACTOME: PLCD1 | ||
| ConsensusPathDB | ||
| Pathway Commons: PLCD1 | ||
| Metabolism | MetaCyc: PLCD1 | |
| HUMANCyc: PLCD1 | ||
| Regulation | Ensembl's Regulation: ENSG00000187091 | |
| miRBase: chr3 :38,048,986-38,066,278 | ||
| TargetScan: NM_001130964 | ||
| cisRED: ENSG00000187091 | ||
| Context | iHOP: PLCD1 | |
| cancer metabolism search in PubMed: PLCD1 | ||
| UCL Cancer Institute: PLCD1 | ||
| Assigned class in ccmGDB | A - This gene has a literature evidence and it belongs to cancer gene. | |
| References showing role of PLCD1 in cancer cell metabolism | 1. Xiang T, Li L, Fan Y, Jiang Y, Ying Y, et al. (2010) PLCD1 is a functional tumor suppressor inducing G2/M arrest and frequently methylated in breast cancer. Cancer biology & therapy 10: 520-527. go to article | |
| Top |
| Phenotypic Information for PLCD1(metabolism pathway, cancer, disease, phenome) |
| Cancer | CGAP: PLCD1 |
| Familial Cancer Database: PLCD1 | |
| * This gene is included in those cancer gene databases. |
|
|
|
|
|
| . | ||||||||||||||
Oncogene 1 | Significant driver gene in | |||||||||||||||||||
| cf) number; DB name 1 Oncogene; http://nar.oxfordjournals.org/content/35/suppl_1/D721.long, 2 Tumor Suppressor gene; https://bioinfo.uth.edu/TSGene/, 3 Cancer Gene Census; http://www.nature.com/nrc/journal/v4/n3/abs/nrc1299.html, 4 CancerGenes; http://nar.oxfordjournals.org/content/35/suppl_1/D721.long, 5 Network of Cancer Gene; http://ncg.kcl.ac.uk/index.php, 1Therapeutic Vulnerabilities in Cancer; http://cbio.mskcc.org/cancergenomics/statius/ |
| KEGG_INOSITOL_PHOSPHATE_METABOLISM | |
| OMIM | 151600; phenotype. 602142; gene. |
| Orphanet | 2387; Leukonychia totalis. |
| Disease | KEGG Disease: PLCD1 |
| MedGen: PLCD1 (Human Medical Genetics with Condition) | |
| ClinVar: PLCD1 | |
| Phenotype | MGI: PLCD1 (International Mouse Phenotyping Consortium) |
| PhenomicDB: PLCD1 | |
| Mutations for PLCD1 |
| * Under tables are showing count per each tissue to give us broad intuition about tissue specific mutation patterns.You can go to the detailed page for each mutation database's web site. |
| There's no structural variation information in COSMIC data for this gene. |
| * From mRNA Sanger sequences, Chitars2.0 arranged chimeric transcripts. This table shows PLCD1 related fusion information. |
| ID | Head Gene | Tail Gene | Accession | Gene_a | qStart_a | qEnd_a | Chromosome_a | tStart_a | tEnd_a | Gene_a | qStart_a | qEnd_a | Chromosome_a | tStart_a | tEnd_a |
| CN404773 | INS-IGF2 | 1 | 111 | 11 | 2153887 | 2153997 | PLCD1 | 94 | 185 | 3 | 38053505 | 38246281 | |
| Top |
| There's no copy number variation information in COSMIC data for this gene. |
| Top |
|
 |
| Top |
| Stat. for Non-Synonymous SNVs (# total SNVs=44) | (# total SNVs=19) |
 |  |
(# total SNVs=1) | (# total SNVs=0) |
 |
| Top |
| * When you move the cursor on each content, you can see more deailed mutation information on the Tooltip. Those are primary_site,primary_histology,mutation(aa),pubmedID. |
| GRCh37 position | Mutation(aa) | Unique sampleID count |
| chr3:38052853-38052853 | p.I214I | 4 |
| chr3:38061700-38061700 | p.R60W | 3 |
| chr3:38051941-38051941 | p.P301P | 2 |
| chr3:38058047-38058047 | p.W121* | 2 |
| chr3:38050789-38050789 | p.R527H | 2 |
| chr3:38051251-38051251 | p.P447A | 2 |
| chr3:38050068-38050068 | p.D595N | 1 |
| chr3:38052911-38052911 | p.S195Y | 1 |
| chr3:38050870-38050870 | p.K500T | 1 |
| chr3:38051462-38051462 | p.A407D | 1 |
| Top |
|
 |
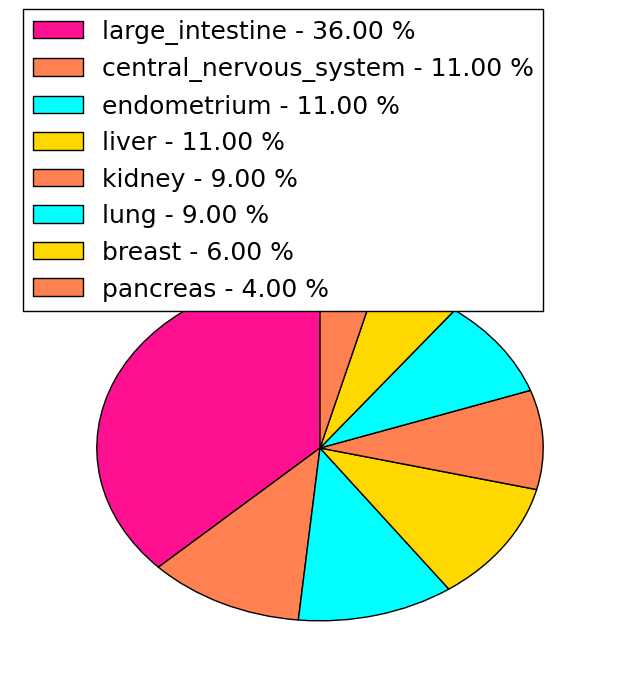
| Point Mutation/ Tissue ID | 1 | 2 | 3 | 4 | 5 | 6 | 7 | 8 | 9 | 10 | 11 | 12 | 13 | 14 | 15 | 16 | 17 | 18 | 19 | 20 |
| # sample | 1 | 1 | 12 | 3 | 2 | 2 | 1 | 5 | 2 | 4 | 5 | 1 | 11 | |||||||
| # mutation | 1 | 1 | 12 | 3 | 2 | 2 | 1 | 6 | 2 | 5 | 5 | 1 | 11 | |||||||
| nonsynonymous SNV | 1 | 10 | 3 | 2 | 2 | 1 | 5 | 1 | 4 | 4 | 1 | 6 | ||||||||
| synonymous SNV | 1 | 2 | 1 | 1 | 1 | 1 | 5 |
| cf) Tissue ID; Tissue type (1; BLCA[Bladder Urothelial Carcinoma], 2; BRCA[Breast invasive carcinoma], 3; CESC[Cervical squamous cell carcinoma and endocervical adenocarcinoma], 4; COAD[Colon adenocarcinoma], 5; GBM[Glioblastoma multiforme], 6; Glioma Low Grade, 7; HNSC[Head and Neck squamous cell carcinoma], 8; KICH[Kidney Chromophobe], 9; KIRC[Kidney renal clear cell carcinoma], 10; KIRP[Kidney renal papillary cell carcinoma], 11; LAML[Acute Myeloid Leukemia], 12; LUAD[Lung adenocarcinoma], 13; LUSC[Lung squamous cell carcinoma], 14; OV[Ovarian serous cystadenocarcinoma ], 15; PAAD[Pancreatic adenocarcinoma], 16; PRAD[Prostate adenocarcinoma], 17; SKCM[Skin Cutaneous Melanoma], 18:STAD[Stomach adenocarcinoma], 19:THCA[Thyroid carcinoma], 20:UCEC[Uterine Corpus Endometrial Carcinoma]) |
| Top |
| * We represented just top 10 SNVs. When you move the cursor on each content, you can see more deailed mutation information on the Tooltip. Those are primary_site, primary_histology, mutation(aa), pubmedID. |
| Genomic Position | Mutation(aa) | Unique sampleID count |
| chr3:38061700 | p.R81W,PLCD1 | 3 |
| chr3:38052853 | p.I235I,PLCD1 | 3 |
| chr3:38050888 | p.D515G,PLCD1 | 2 |
| chr3:38049554 | p.R61H,PLCD1 | 2 |
| chr3:38061759 | p.K733N,PLCD1 | 2 |
| chr3:38061761 | p.Q536H,PLCD1 | 1 |
| chr3:38050545 | p.S216Y,PLCD1 | 1 |
| chr3:38051458 | p.D727Y,PLCD1 | 1 |
| chr3:38053062 | p.F528L,PLCD1 | 1 |
| chr3:38049598 | p.D198D,PLCD1 | 1 |
| * Copy number data were extracted from TCGA using R package TCGA-Assembler. The URLs of all public data files on TCGA DCC data server were gathered on Jan-05-2015. Function ProcessCNAData in TCGA-Assembler package was used to obtain gene-level copy number value which is calculated as the average copy number of the genomic region of a gene. |
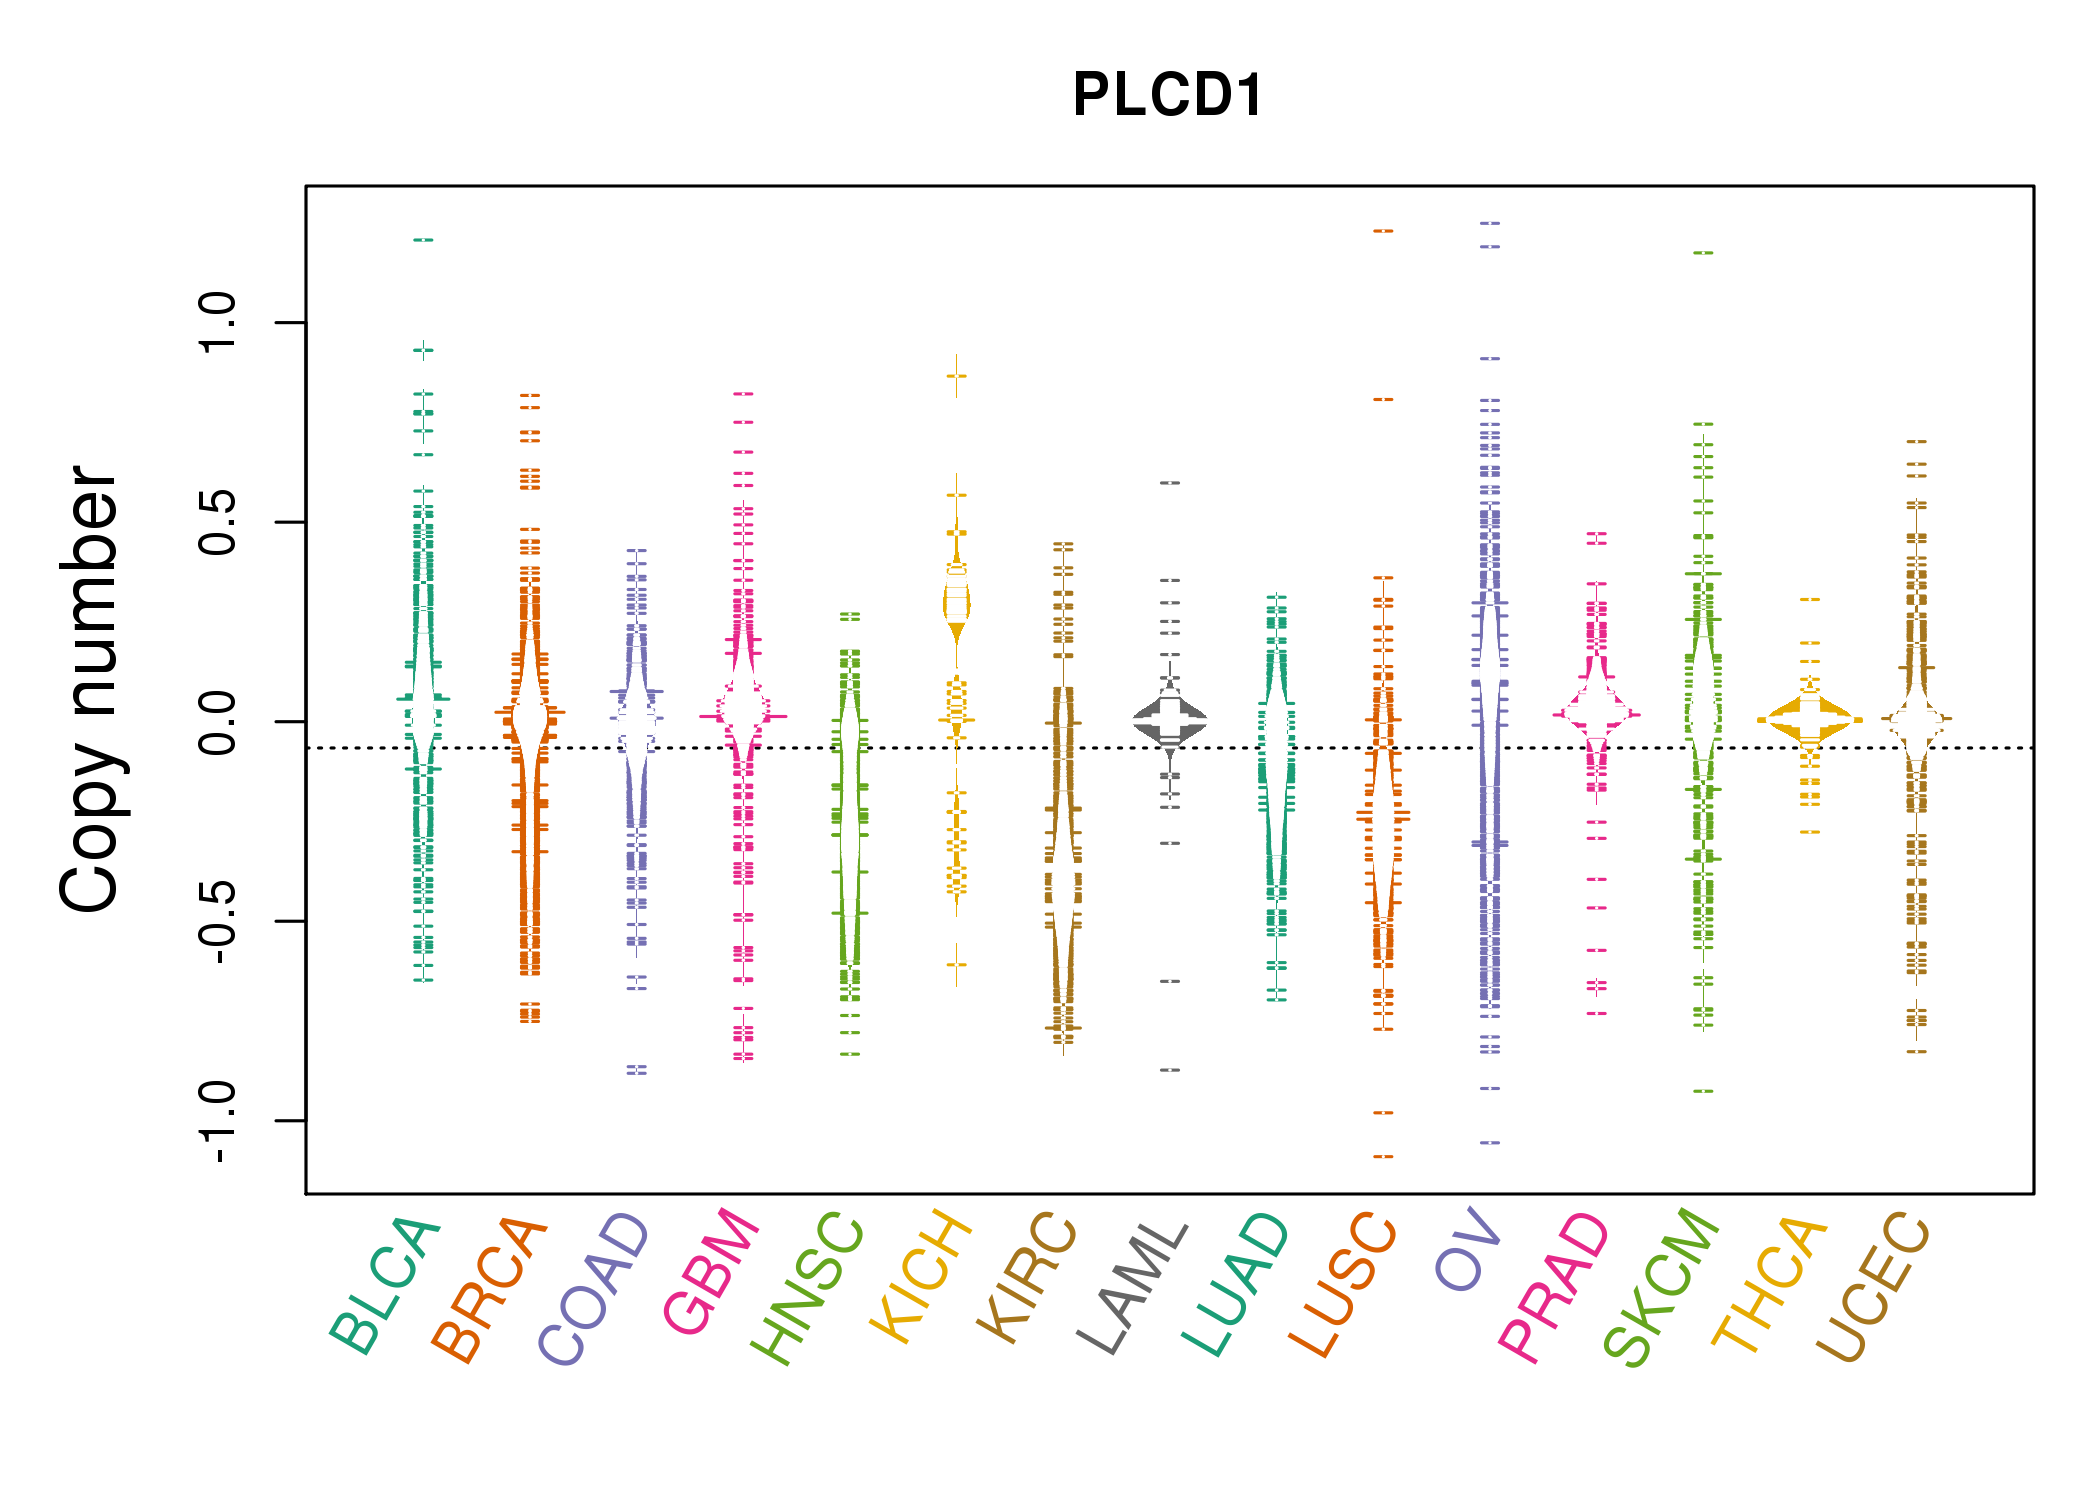 |
| cf) Tissue ID[Tissue type]: BLCA[Bladder Urothelial Carcinoma], BRCA[Breast invasive carcinoma], CESC[Cervical squamous cell carcinoma and endocervical adenocarcinoma], COAD[Colon adenocarcinoma], GBM[Glioblastoma multiforme], Glioma Low Grade, HNSC[Head and Neck squamous cell carcinoma], KICH[Kidney Chromophobe], KIRC[Kidney renal clear cell carcinoma], KIRP[Kidney renal papillary cell carcinoma], LAML[Acute Myeloid Leukemia], LUAD[Lung adenocarcinoma], LUSC[Lung squamous cell carcinoma], OV[Ovarian serous cystadenocarcinoma ], PAAD[Pancreatic adenocarcinoma], PRAD[Prostate adenocarcinoma], SKCM[Skin Cutaneous Melanoma], STAD[Stomach adenocarcinoma], THCA[Thyroid carcinoma], UCEC[Uterine Corpus Endometrial Carcinoma] |
| Top |
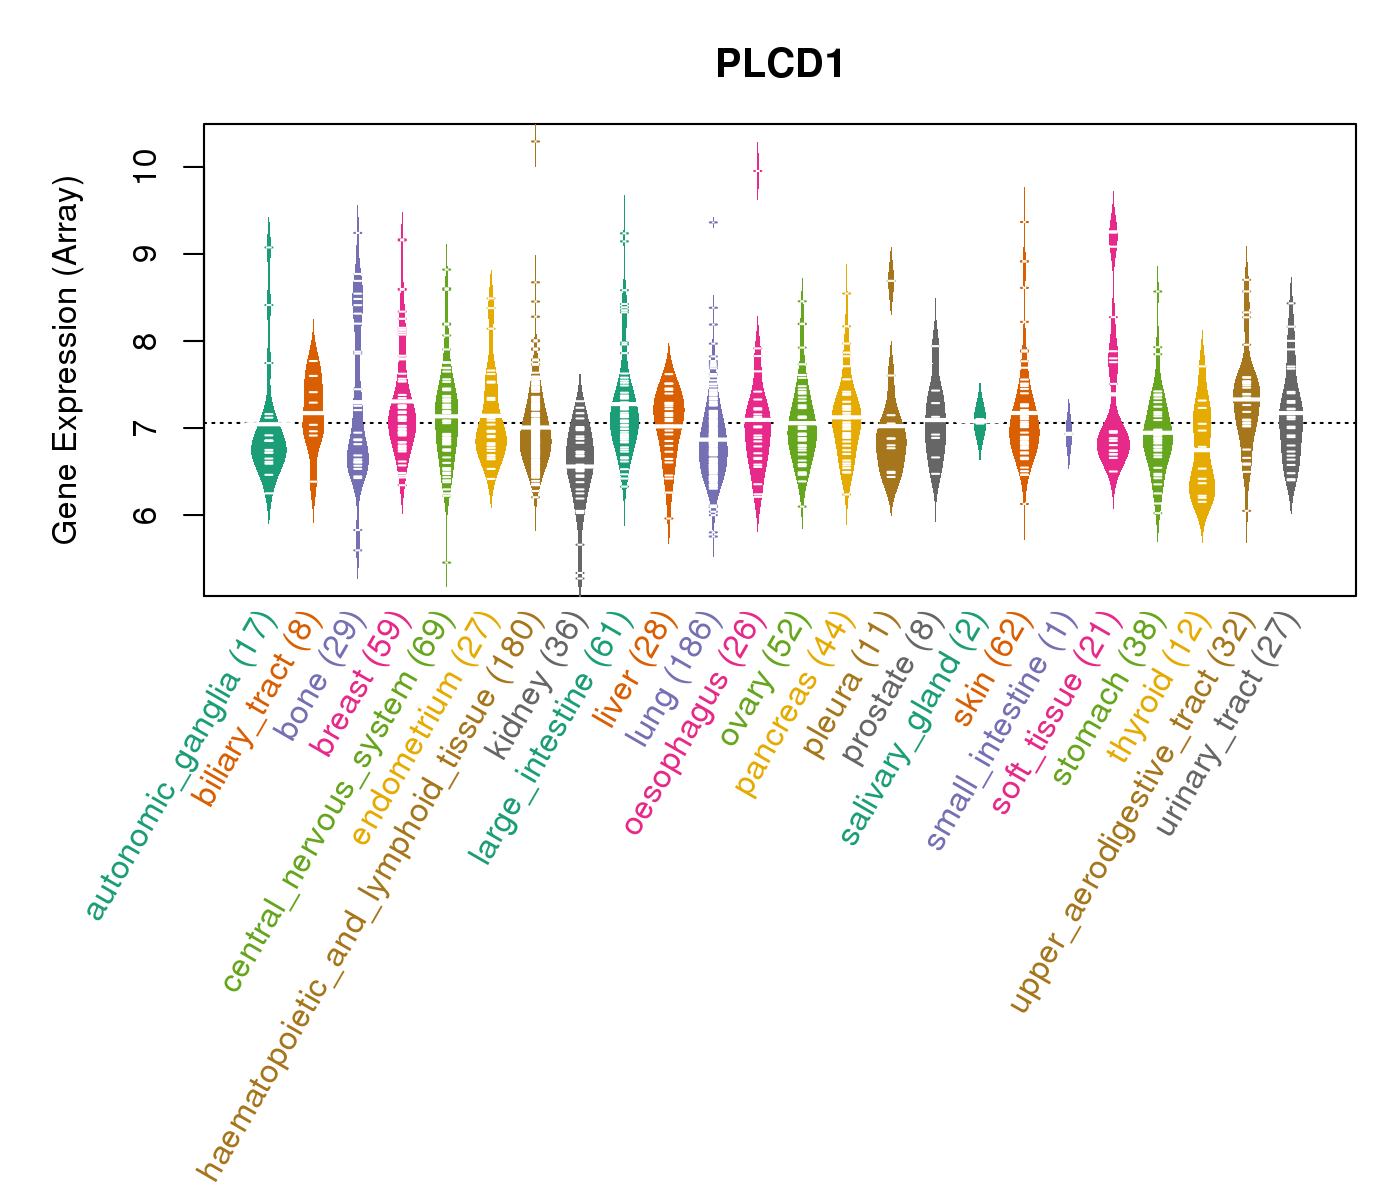
| Gene Expression for PLCD1 |
| * CCLE gene expression data were extracted from CCLE_Expression_Entrez_2012-10-18.res: Gene-centric RMA-normalized mRNA expression data. |
 |
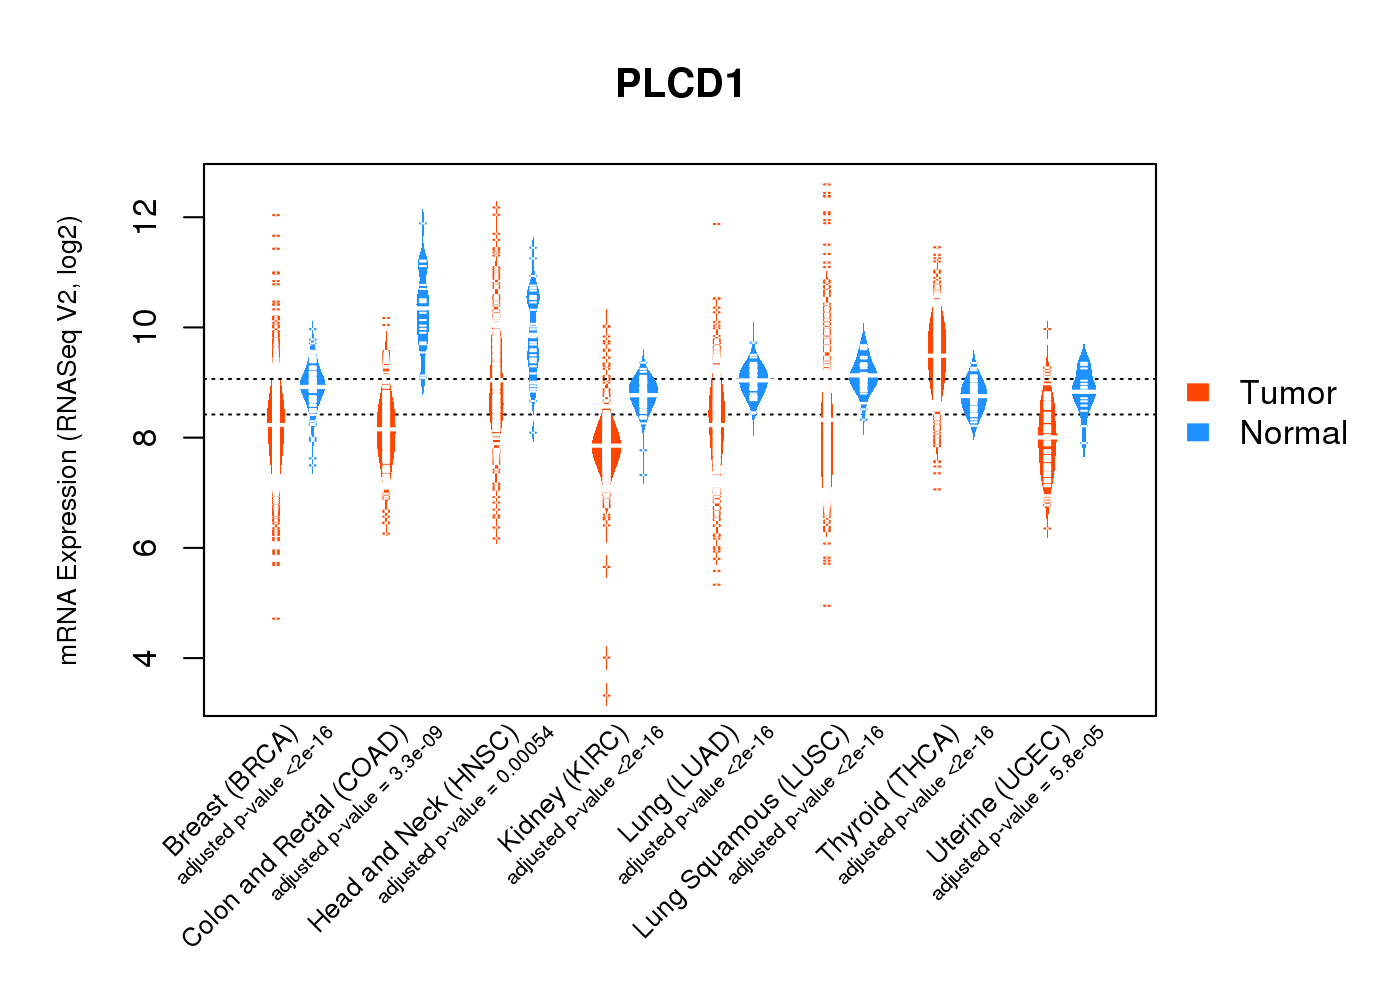
| * Normalized gene expression data of RNASeqV2 was extracted from TCGA using R package TCGA-Assembler. The URLs of all public data files on TCGA DCC data server were gathered at Jan-05-2015. Only eight cancer types have enough normal control samples for differential expression analysis. (t test, adjusted p<0.05 (using Benjamini-Hochberg FDR)) |
 |
| Top |
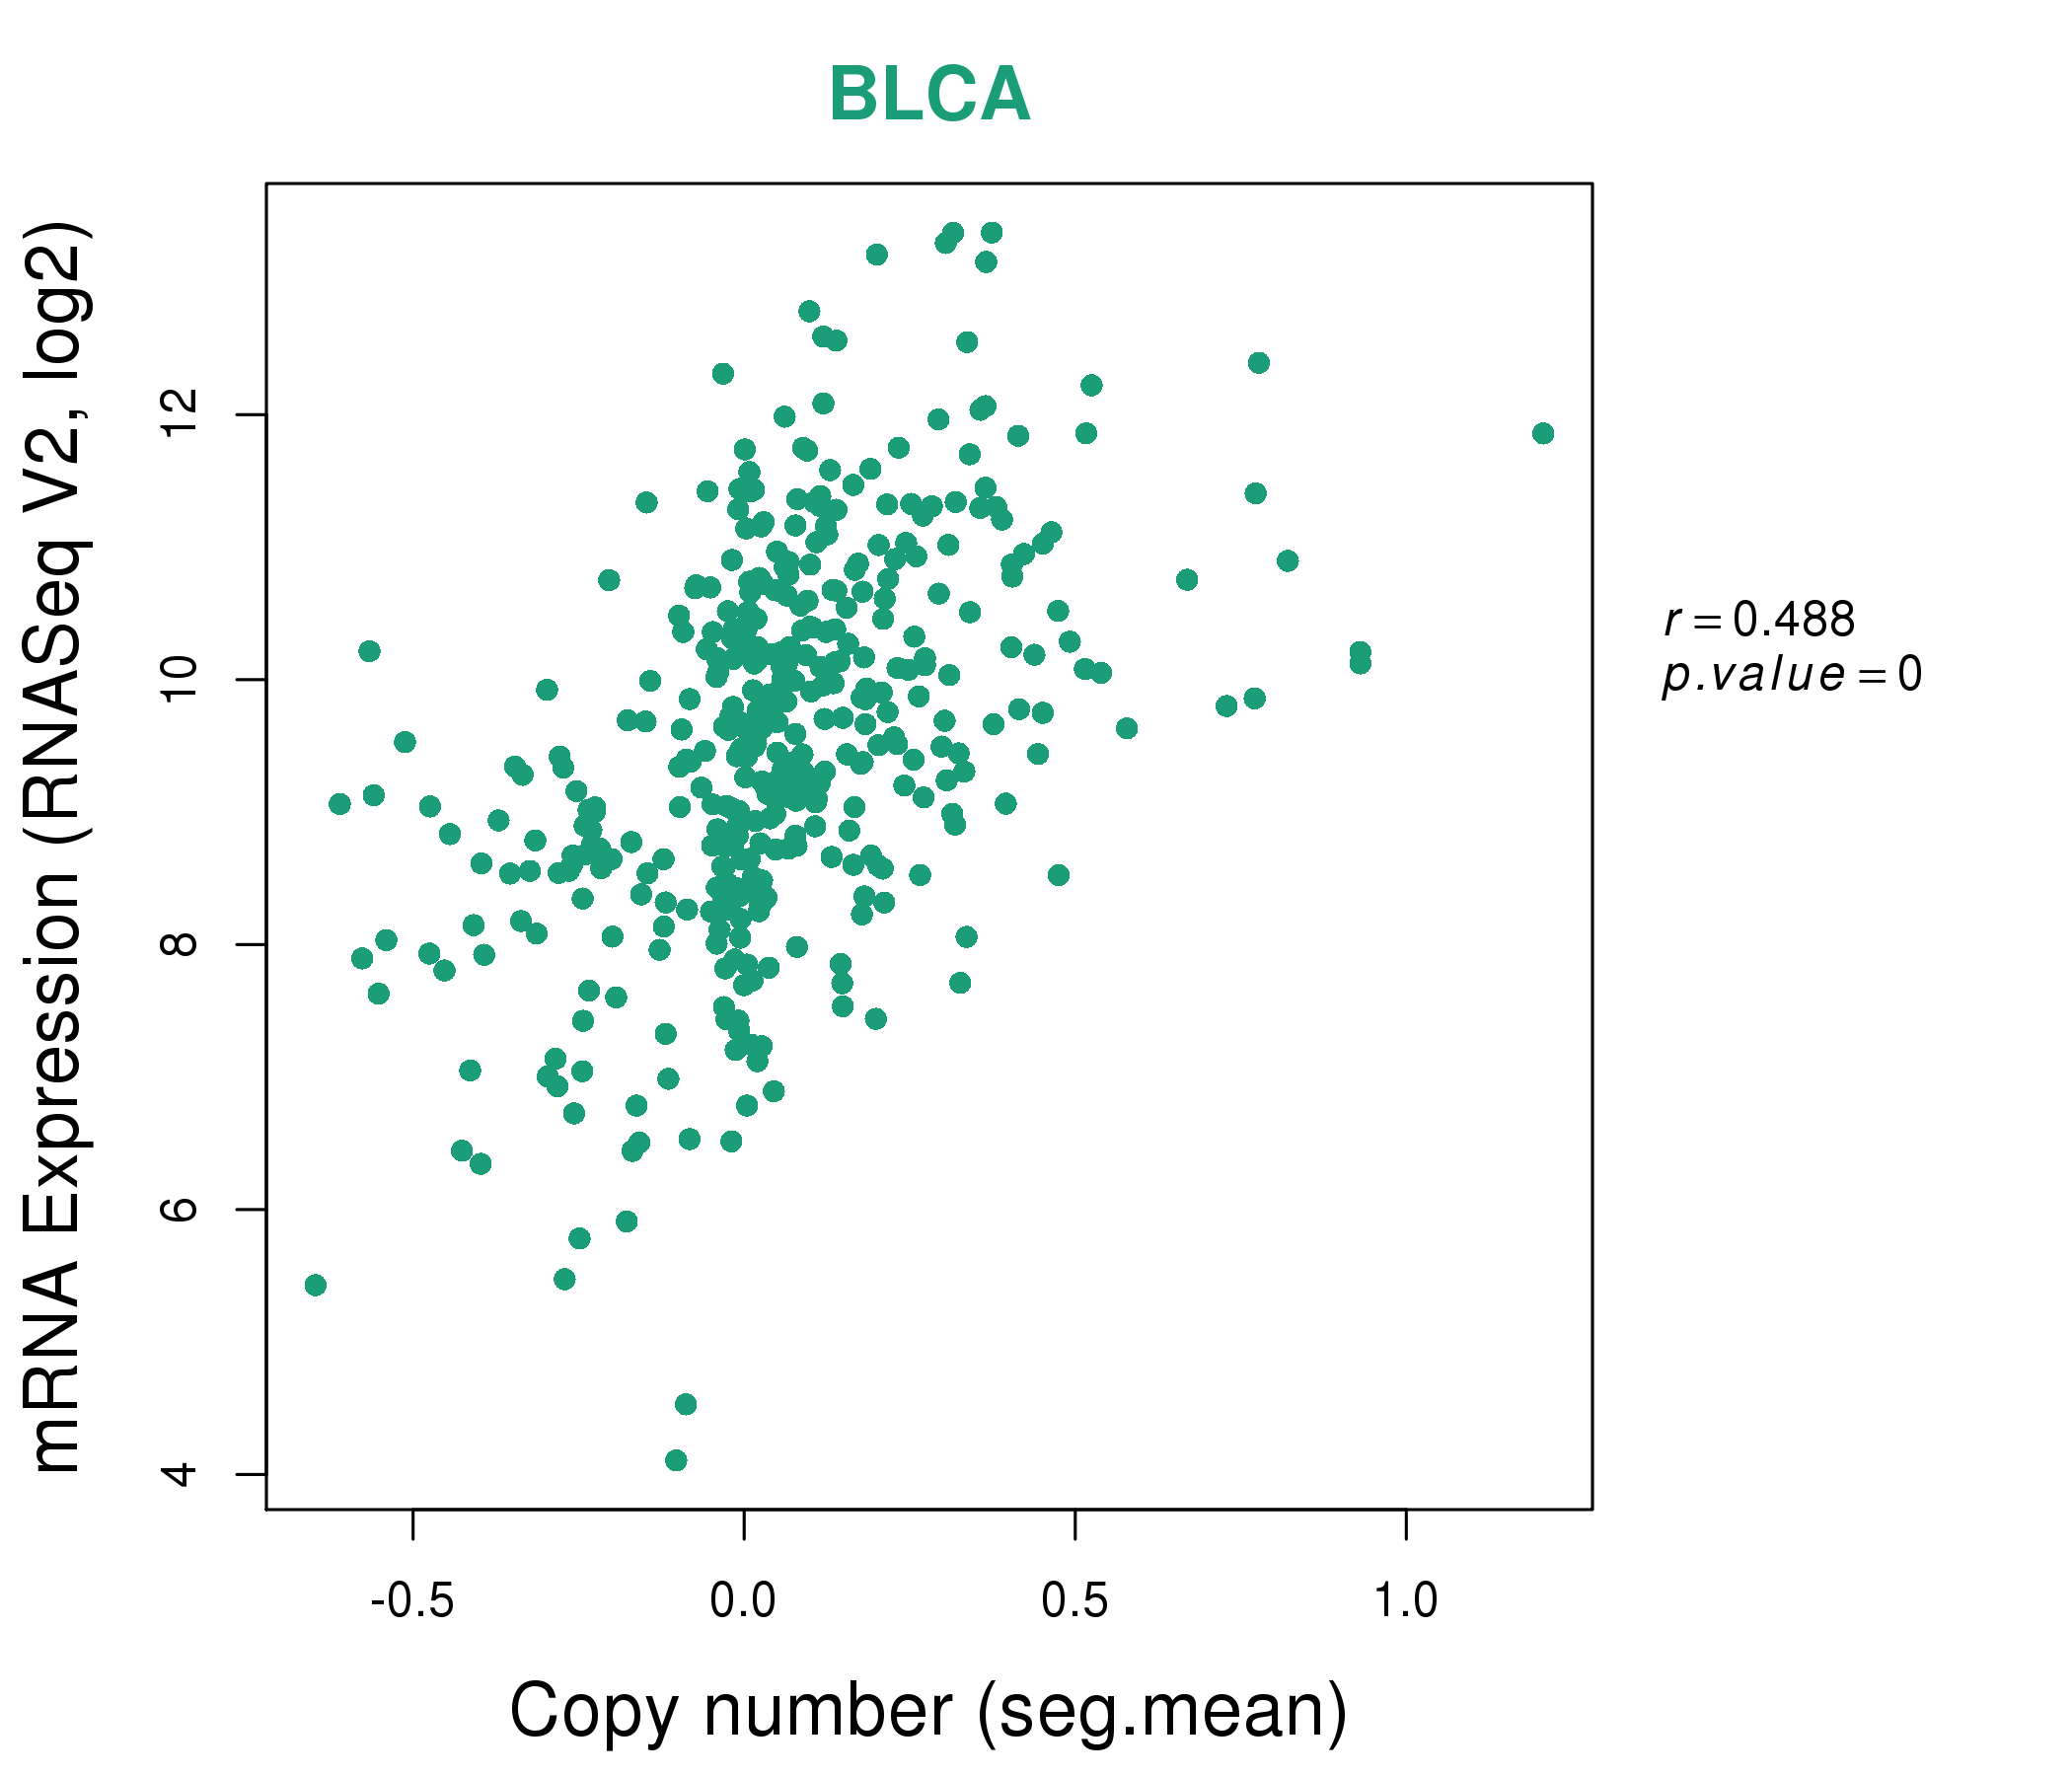
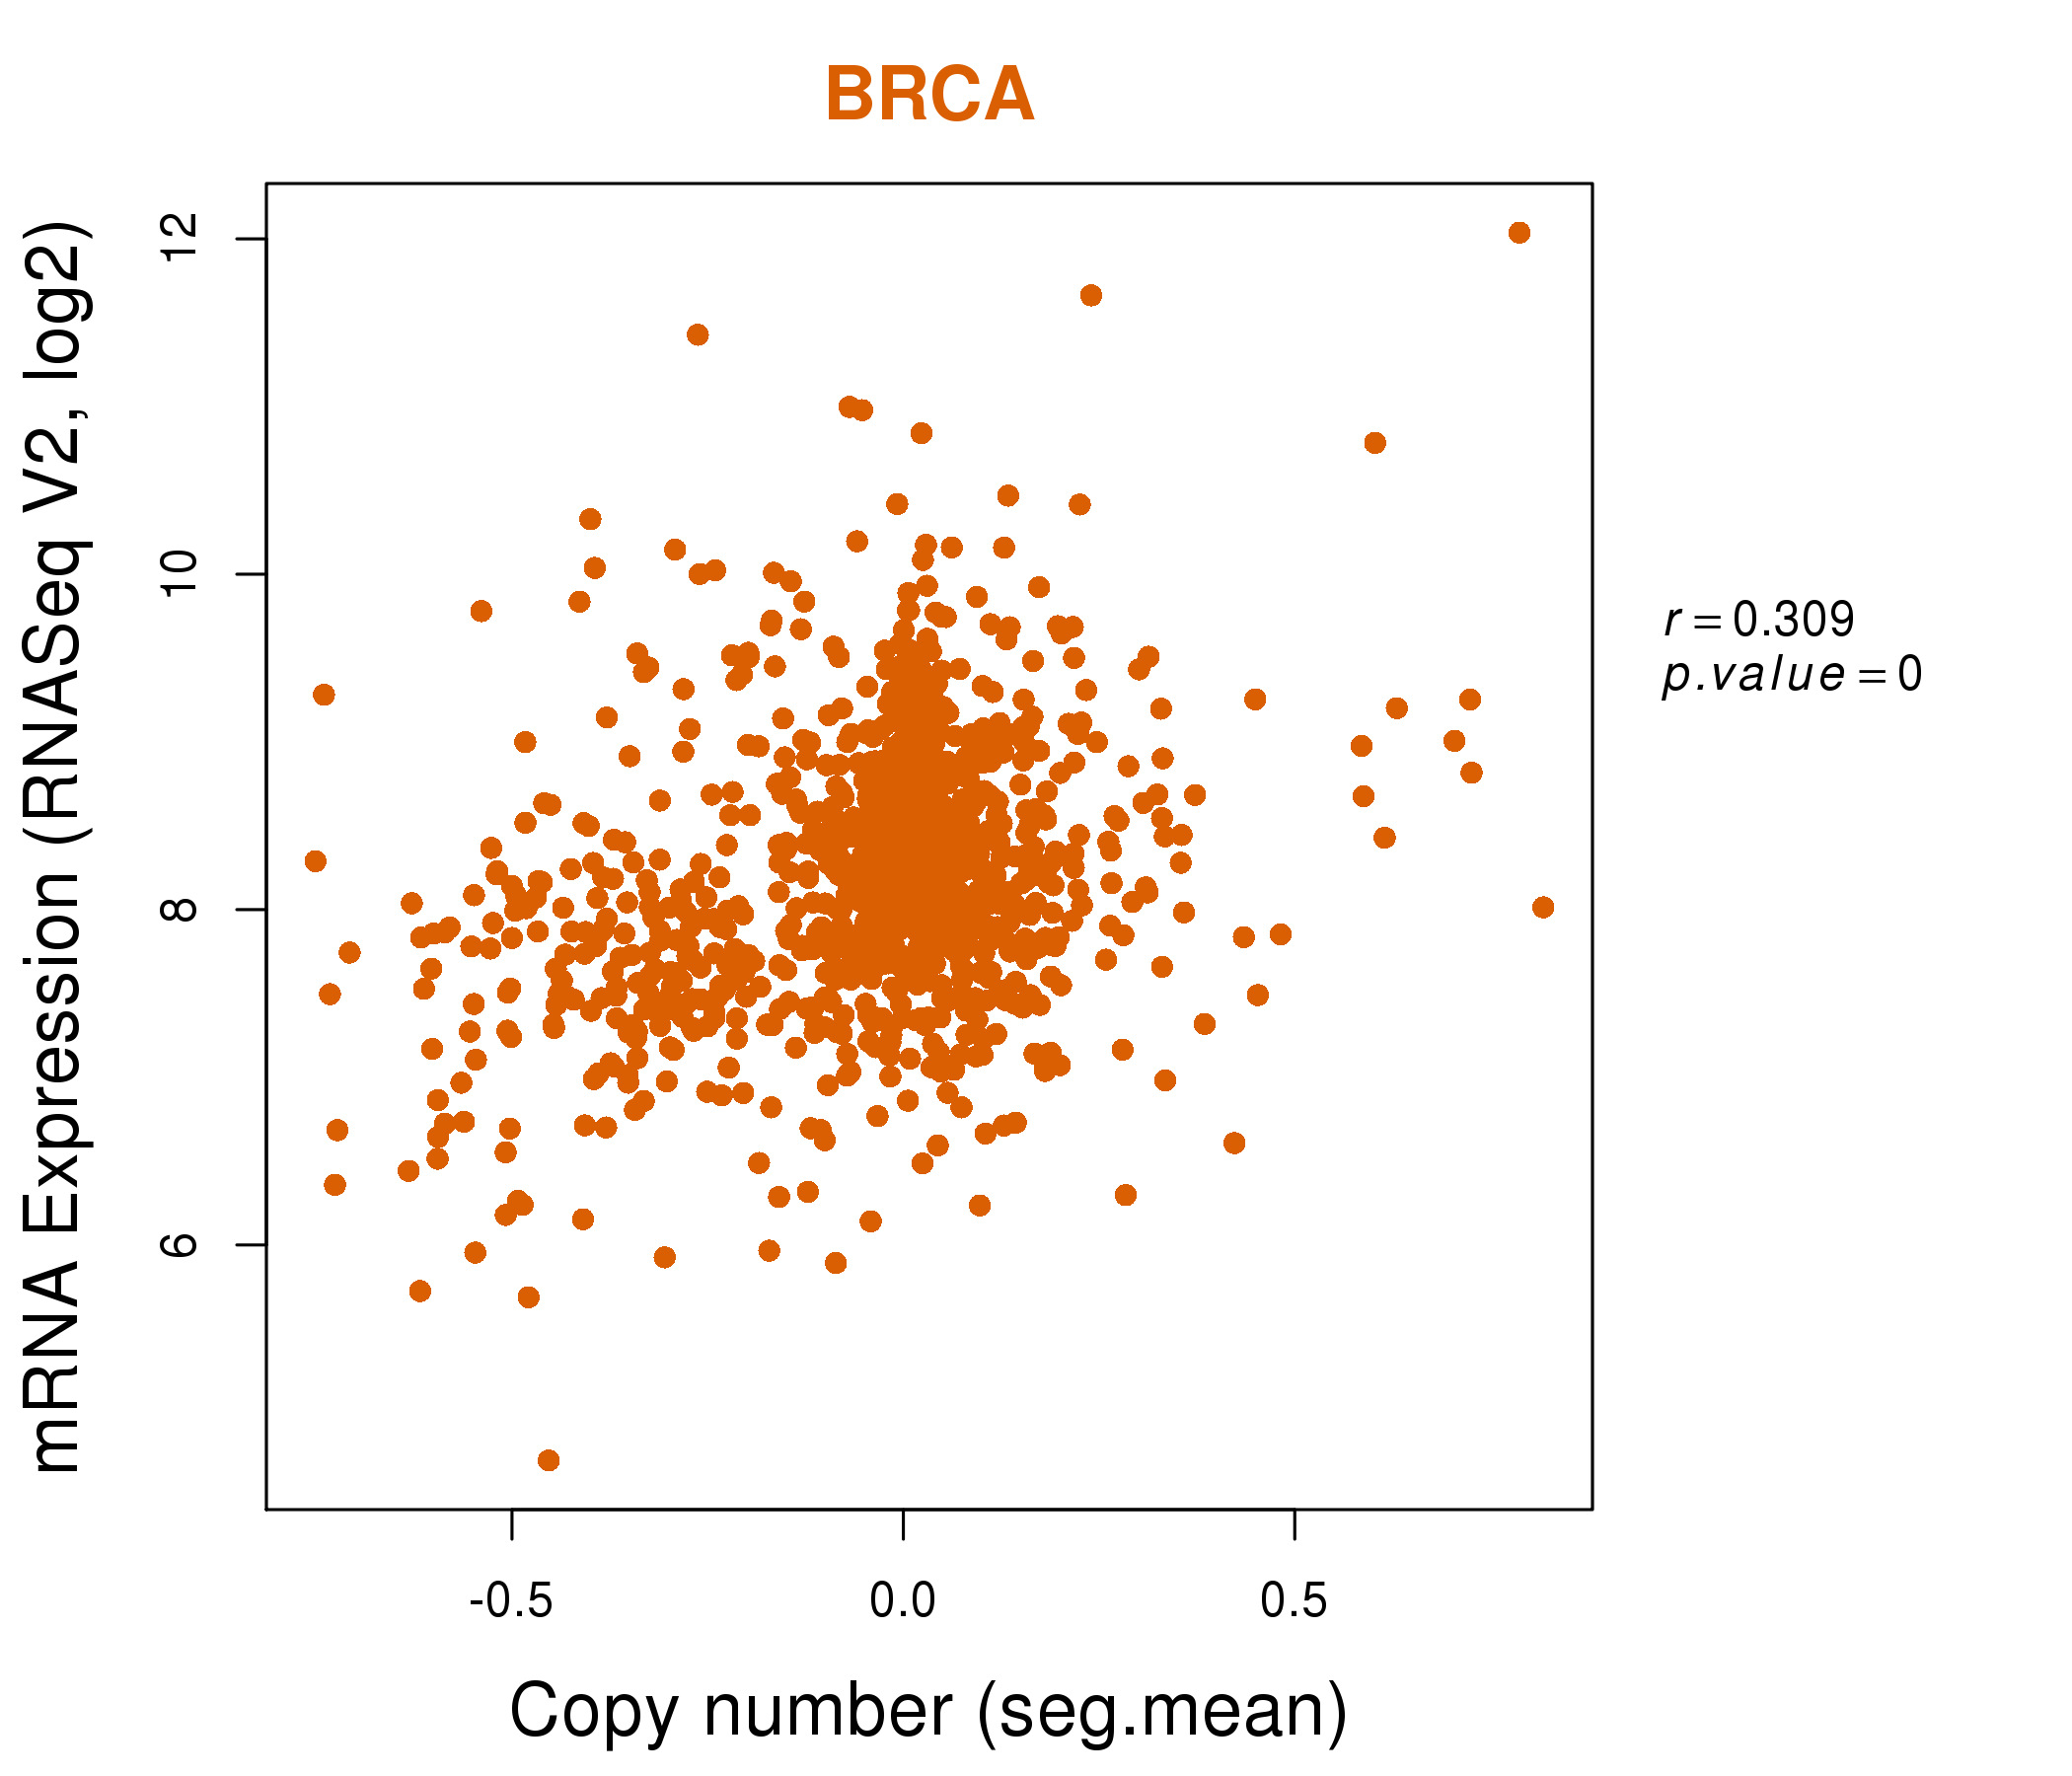
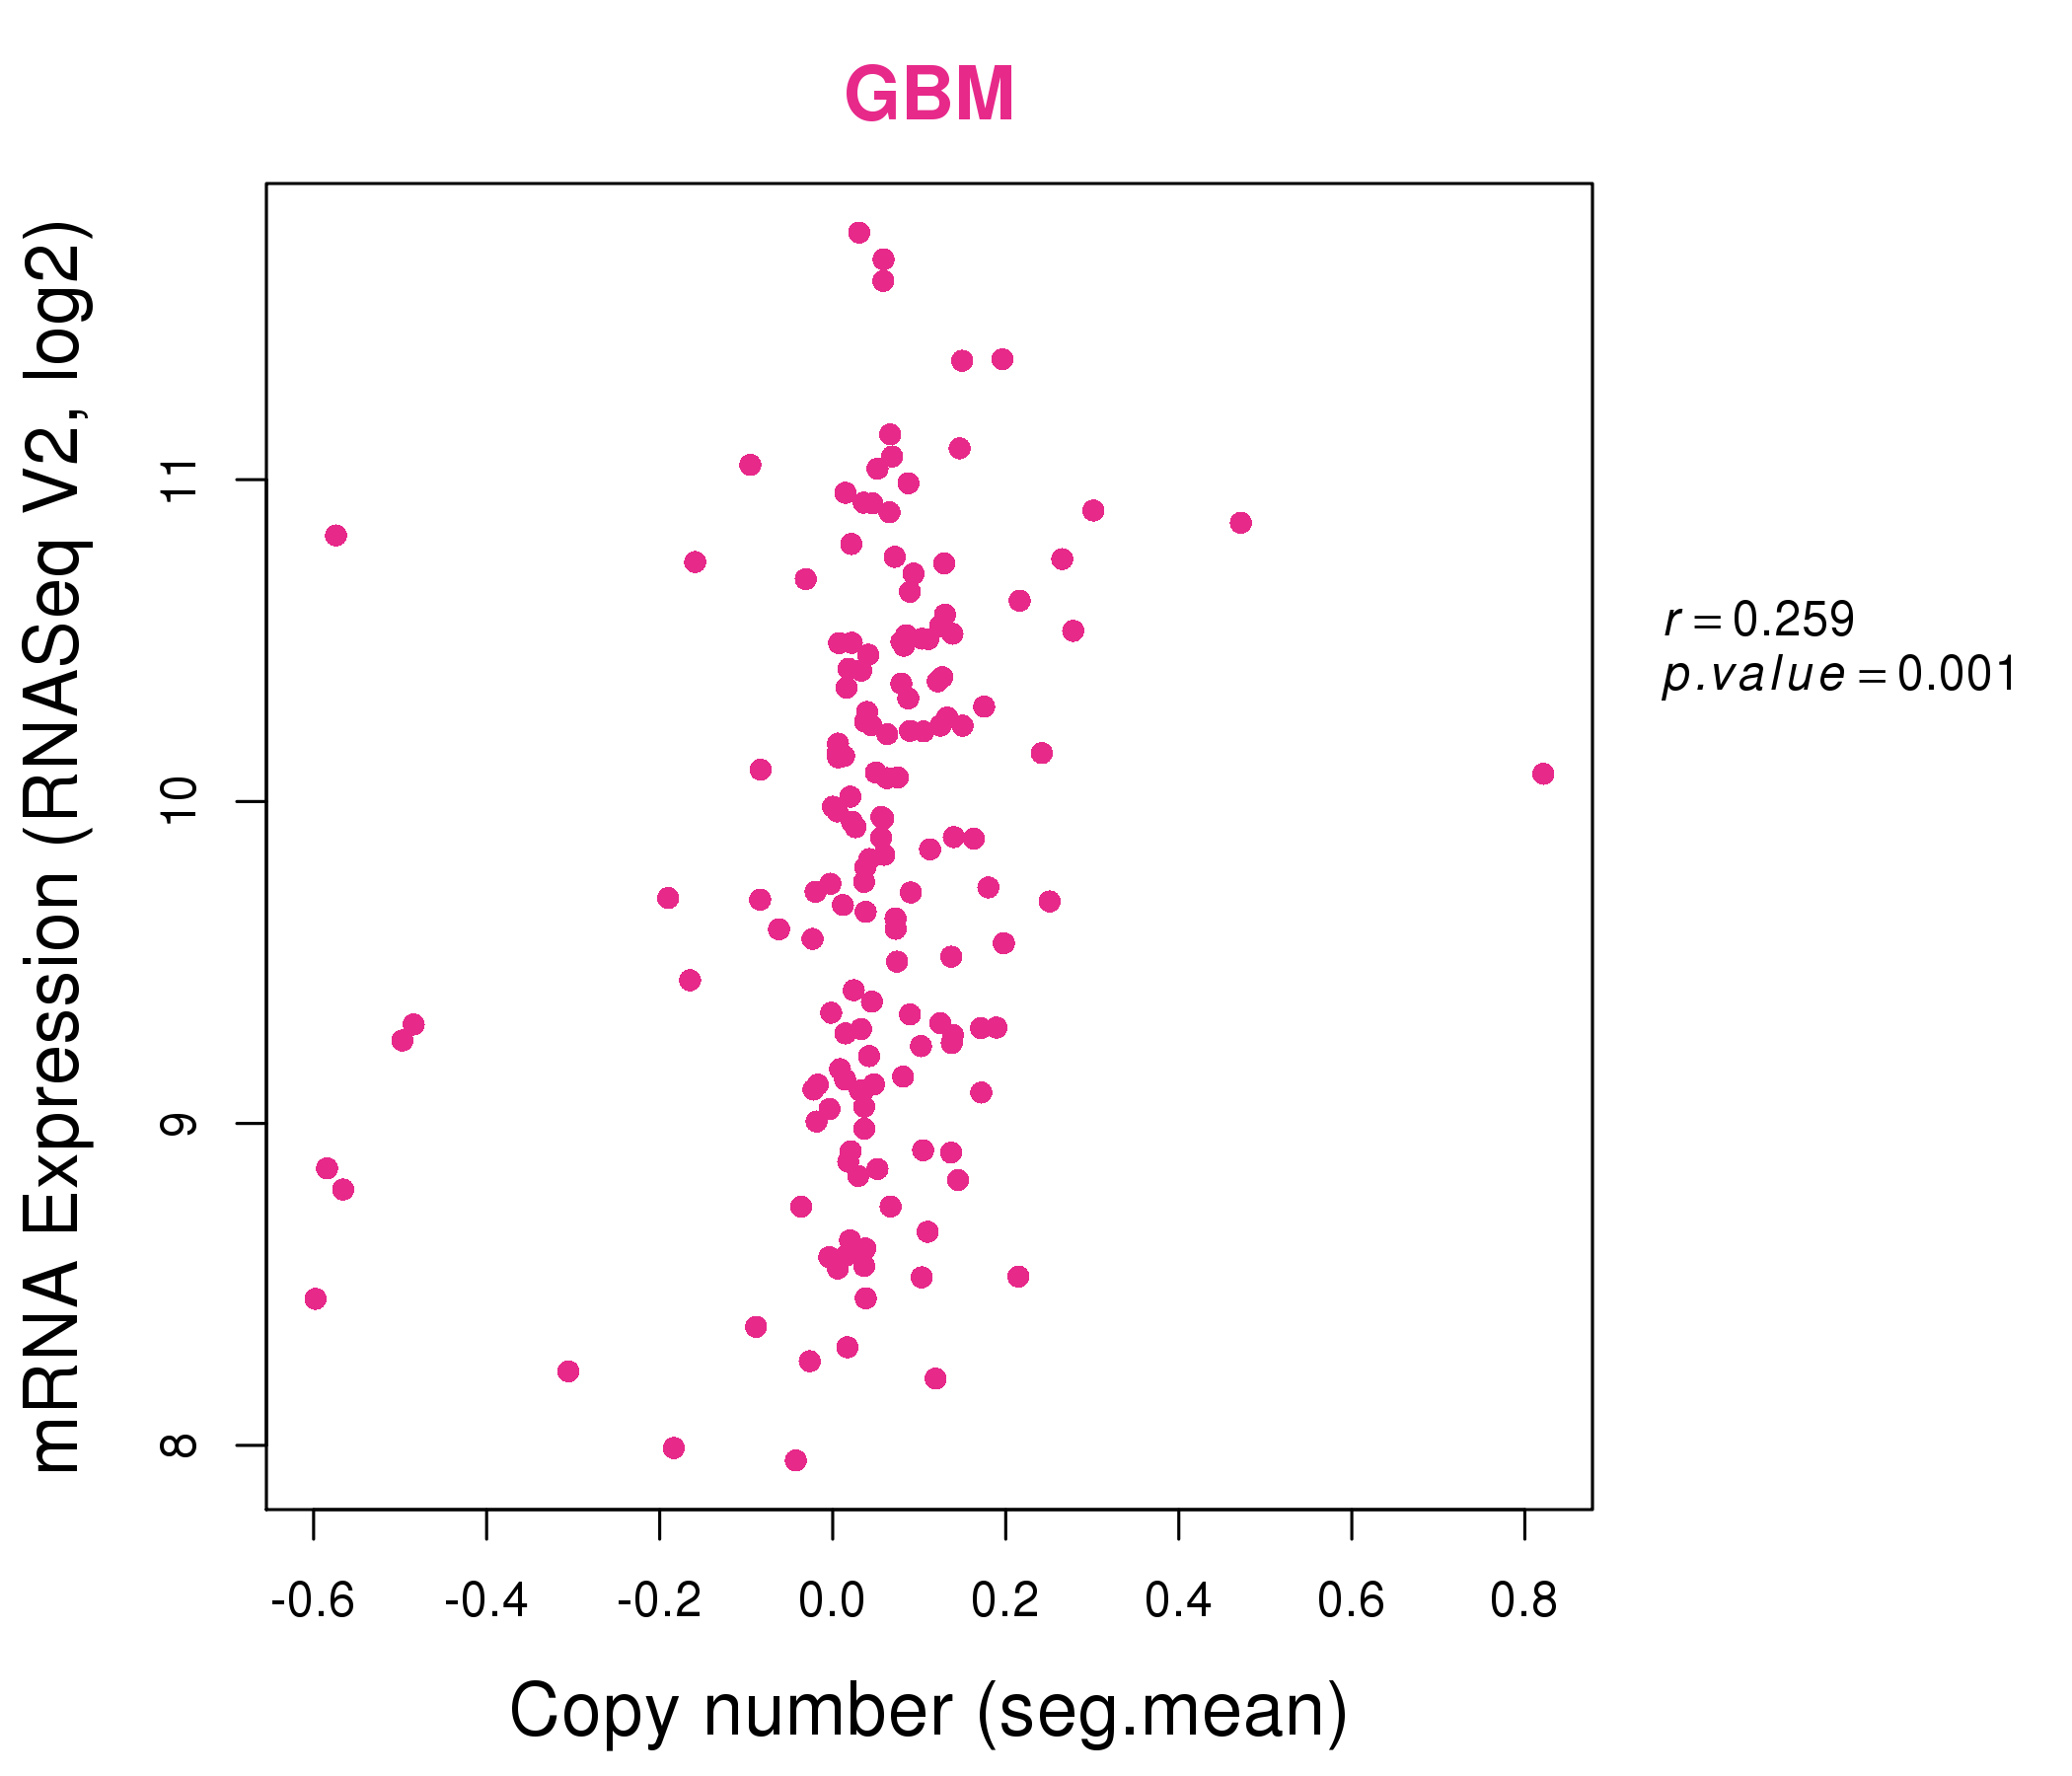
| * This plots show the correlation between CNV and gene expression. |
: Open all plots for all cancer types
 |
|
 |
|
| Top |
| Gene-Gene Network Information |
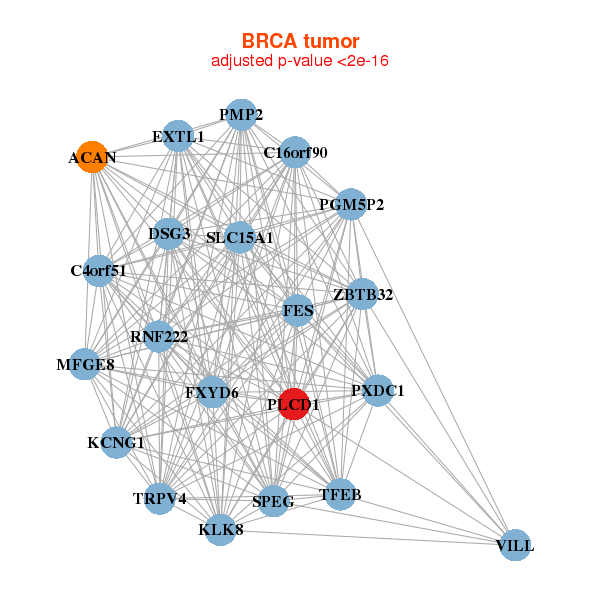
| * Co-Expression network figures were drawn using R package igraph. Only the top 20 genes with the highest correlations were shown. Red circle: input gene, orange circle: cell metabolism gene, sky circle: other gene |
: Open all plots for all cancer types
 |
|
| ACAN,C16orf90,C4orf51,PXDC1,DSG3,EXTL1,FES, FXYD6,KCNG1,KLK8,MFGE8,PGM5P2,PLCD1,PMP2, RNF222,SLC15A1,SPEG,TFEB,TRPV4,VILL,ZBTB32 | B3GALT4,CTDSP1,DDAH2,EML3,HYI,INF2,KIFC3, KLHL22,LMF2,LOC729991,LRP3,MMP24,MXD4,NUCB1, PLCD1,SNX17,TMEM129,TSPAN15,UCK1,UROD,WTIP |
 |
|
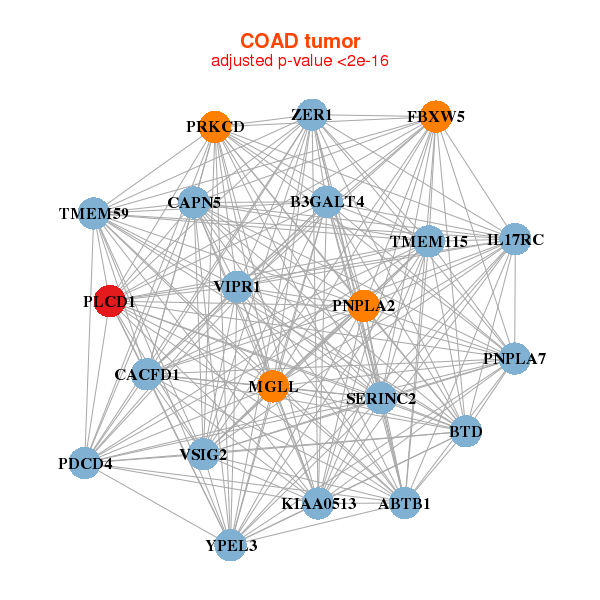
| ABTB1,B3GALT4,BTD,CACFD1,CAPN5,FBXW5,IL17RC, KIAA0513,MGLL,PDCD4,PLCD1,PNPLA2,PNPLA7,PRKCD, SERINC2,TMEM115,TMEM59,VIPR1,VSIG2,YPEL3,ZER1 | ABHD3,AHCYL2,AMACR,CA4,CAPN2,CLCN2,ENPP1, GBA,LIPH,LITAF,MGLL,MKRN1,PEX26,PLCD1, PRDX6,SCNN1A,SLC26A3,SLC4A4,SPATS2L,TJP3,TMEM63B |
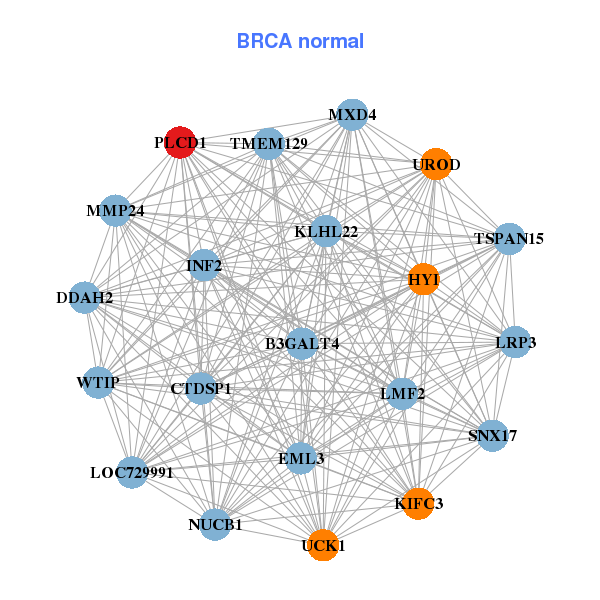
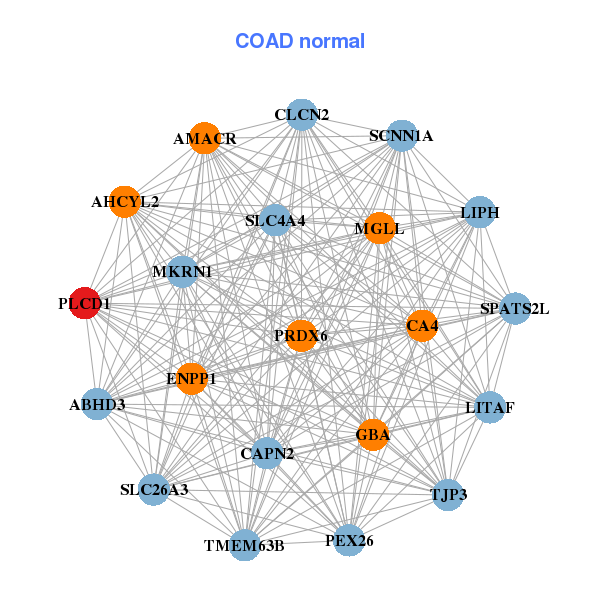
| * Co-Expression network figures were drawn using R package igraph. Only the top 20 genes with the highest correlations were shown. Red circle: input gene, orange circle: cell metabolism gene, sky circle: other gene |
: Open all plots for all cancer types
| Top |
: Open all interacting genes' information including KEGG pathway for all interacting genes from DAVID
| Top |
| Pharmacological Information for PLCD1 |
| There's no related Drug. |
| Top |
| Cross referenced IDs for PLCD1 |
| * We obtained these cross-references from Uniprot database. It covers 150 different DBs, 18 categories. http://www.uniprot.org/help/cross_references_section |
: Open all cross reference information
|
Copyright © 2016-Present - The Univsersity of Texas Health Science Center at Houston @ |