|
|||||||||||||||||||||||||||||||||||||||||||||||||||||||||||||||||||||||||||||||||||||||||||||||||||||||||||||||||||||||||||||||||||||||||||||||||||||||||||||||||||||||||||||||||||||||||||||||||||||||||||||||||||||||||||||||||||||||||||||||||||||||||||||||||||||||||||||||||||||||||||||||||||||||||||||||||||||||||||||||||||||||||||||||||||||||||||||||||||||||||||||||||||||||||||||
| |
| Phenotypic Information (metabolism pathway, cancer, disease, phenome) |
| |
| |
| Gene-Gene Network Information: Co-Expression Network, Interacting Genes & KEGG |
| |
|


| Gene Summary for PLCG1 |
| Basic gene info. | Gene symbol | PLCG1 |
| Gene name | phospholipase C, gamma 1 | |
| Synonyms | NCKAP3|PLC-II|PLC1|PLC148|PLCgamma1 | |
| Cytomap | UCSC genome browser: 20q12-q13.1 | |
| Genomic location | chr20 :39766160-39804357 | |
| Type of gene | protein-coding | |
| RefGenes | NM_002660.2, NM_182811.1, | |
| Ensembl id | ENSG00000124181 | |
| Description | 1-phosphatidyl-D-myo-inositol-4,5-bisphosphate1-phosphatidylinositol 4,5-bisphosphate phosphodiesterase gamma-11-phosphatidylinositol-4,5-bisphosphate phosphodiesterase gamma 11-phosphatidylinositol-4,5-bisphosphate phosphodiesterase gamma-1PLC-148PL | |
| Modification date | 20141207 | |
| dbXrefs | MIM : 172420 | |
| HGNC : HGNC | ||
| Ensembl : ENSG00000124181 | ||
| HPRD : 01398 | ||
| Vega : OTTHUMG00000033082 | ||
| Protein | UniProt: P19174 go to UniProt's Cross Reference DB Table | |
| Expression | CleanEX: HS_PLCG1 | |
| BioGPS: 5335 | ||
| Gene Expression Atlas: ENSG00000124181 | ||
| The Human Protein Atlas: ENSG00000124181 | ||
| Pathway | NCI Pathway Interaction Database: PLCG1 | |
| KEGG: PLCG1 | ||
| REACTOME: PLCG1 | ||
| ConsensusPathDB | ||
| Pathway Commons: PLCG1 | ||
| Metabolism | MetaCyc: PLCG1 | |
| HUMANCyc: PLCG1 | ||
| Regulation | Ensembl's Regulation: ENSG00000124181 | |
| miRBase: chr20 :39,766,160-39,804,357 | ||
| TargetScan: NM_002660 | ||
| cisRED: ENSG00000124181 | ||
| Context | iHOP: PLCG1 | |
| cancer metabolism search in PubMed: PLCG1 | ||
| UCL Cancer Institute: PLCG1 | ||
| Assigned class in ccmGDB | B - This gene belongs to cancer gene. | |
| Top |
| Phenotypic Information for PLCG1(metabolism pathway, cancer, disease, phenome) |
| Cancer | CGAP: PLCG1 |
| Familial Cancer Database: PLCG1 | |
| * This gene is included in those cancer gene databases. |
|
|
|
|
|
| . | |||||||||||||||||||||||||||||||||||||||||||||||||||||||||||||||||||||||||||||||||||||||||||||||||||||||||||||||||||||||||||||||||||||||||||||||||||||||||||||||||||||||||||||||||||||||||||||||||||||||||||||||||||||||||||||||||||||||||||||||||||||||||||||||||||||||||||||||||||||||||||||||||||||||||||||||||||||||||||||||||||||||||||||||||||||||||||||||||||||||||||||||||||||||
Oncogene 1 | Significant driver gene in GBM 6, | ||||||||||||||||||||||||||||||||||||||||||||||||||||||||||||||||||||||||||||||||||||||||||||||||||||||||||||||||||||||||||||||||||||||||||||||||||||||||||||||||||||||||||||||||||||||||||||||||||||||||||||||||||||||||||||||||||||||||||||||||||||||||||||||||||||||||||||||||||||||||||||||||||||||||||||||||||||||||||||||||||||||||||||||||||||||||||||||||||||||||||||||||||||||||||||
| cf) number; DB name 1 Oncogene; http://nar.oxfordjournals.org/content/35/suppl_1/D721.long, 2 Tumor Suppressor gene; https://bioinfo.uth.edu/TSGene/, 3 Cancer Gene Census; http://www.nature.com/nrc/journal/v4/n3/abs/nrc1299.html, 4 CancerGenes; http://nar.oxfordjournals.org/content/35/suppl_1/D721.long, 5 Network of Cancer Gene; http://ncg.kcl.ac.uk/index.php, 6 http://www.nejm.org/doi/full/10.1056/NEJMoa1402121, 7Therapeutic Vulnerabilities in Cancer; http://cbio.mskcc.org/cancergenomics/statius/ |
| KEGG_INOSITOL_PHOSPHATE_METABOLISM KEGG_FC_GAMMA_R_MEDIATED_PHAGOCYTOSIS | |
| OMIM | 172420; gene. |
| Orphanet | |
| Disease | KEGG Disease: PLCG1 |
| MedGen: PLCG1 (Human Medical Genetics with Condition) | |
| ClinVar: PLCG1 | |
| Phenotype | MGI: PLCG1 (International Mouse Phenotyping Consortium) |
| PhenomicDB: PLCG1 | |
| Mutations for PLCG1 |
| * Under tables are showing count per each tissue to give us broad intuition about tissue specific mutation patterns.You can go to the detailed page for each mutation database's web site. |
| - Statistics for Tissue and Mutation type | Top |
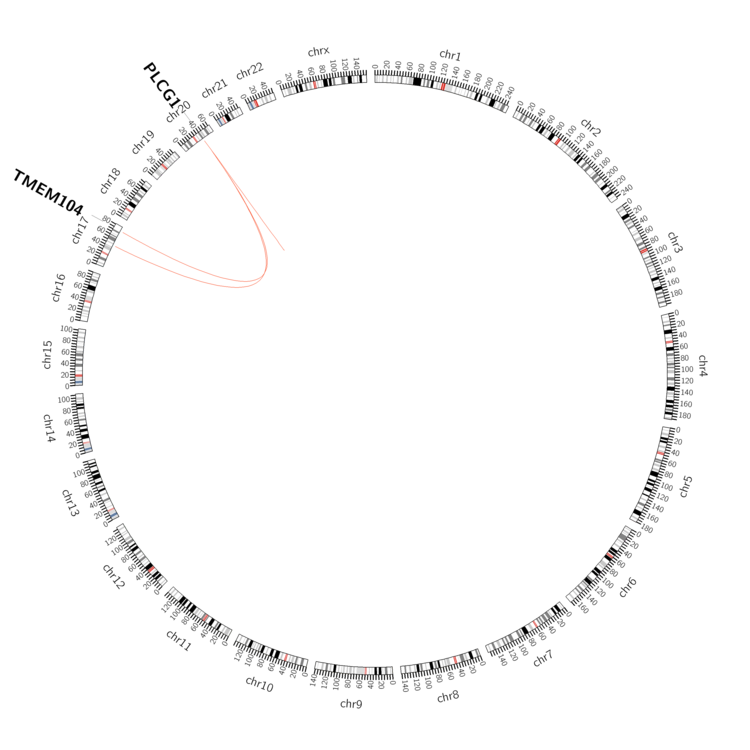 |
| - For Inter-chromosomal Variations |
| * Inter-chromosomal variantions includes 'interchromosomal amplicon to amplicon', 'interchromosomal amplicon to non-amplified dna', 'interchromosomal insertion', 'Interchromosomal unknown type'. |
 |
| - For Intra-chromosomal Variations |
| * Intra-chromosomal variantions includes 'intrachromosomal amplicon to amplicon', 'intrachromosomal amplicon to non-amplified dna', 'intrachromosomal deletion', 'intrachromosomal fold-back inversion', 'intrachromosomal inversion', 'intrachromosomal tandem duplication', 'Intrachromosomal unknown type', 'intrachromosomal with inverted orientation', 'intrachromosomal with non-inverted orientation'. |
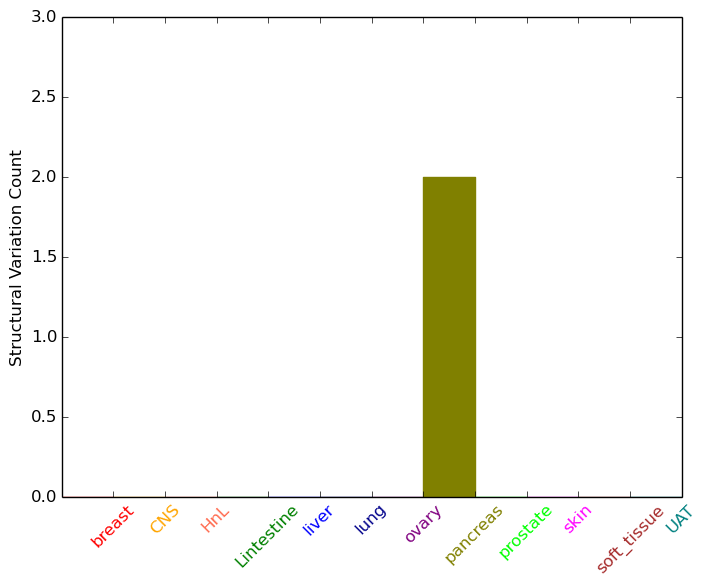 |
| Sample | Symbol_a | Chr_a | Start_a | End_a | Symbol_b | Chr_b | Start_b | End_b |
| pancreas | PLCG1 | chr20 | 39771701 | 39771721 | TMEM104 | chr17 | 72782166 | 72782186 |
| pancreas | PLCG1 | chr20 | 39796383 | 39796403 | PLCG1 | chr20 | 39771957 | 39771977 |
| cf) Tissue number; Tissue name (1;Breast, 2;Central_nervous_system, 3;Haematopoietic_and_lymphoid_tissue, 4;Large_intestine, 5;Liver, 6;Lung, 7;Ovary, 8;Pancreas, 9;Prostate, 10;Skin, 11;Soft_tissue, 12;Upper_aerodigestive_tract) |
| * From mRNA Sanger sequences, Chitars2.0 arranged chimeric transcripts. This table shows PLCG1 related fusion information. |
| ID | Head Gene | Tail Gene | Accession | Gene_a | qStart_a | qEnd_a | Chromosome_a | tStart_a | tEnd_a | Gene_a | qStart_a | qEnd_a | Chromosome_a | tStart_a | tEnd_a |
| CK724856 | PLCG1 | 19 | 180 | 20 | 39804198 | 39804359 | FRMD8 | 178 | 666 | 11 | 65164272 | 65168339 | |
| BI014551 | MYH14 | 14 | 278 | 19 | 50811894 | 50812157 | PLCG1 | 271 | 417 | 20 | 39799116 | 39799262 | |
| AA018565 | ZBTB22 | 1 | 83 | 6 | 4514441 | 4514523 | PLCG1 | 66 | 412 | 20 | 39795329 | 39797506 | |
| BF770556 | ARID1B | 6 | 301 | 6 | 157110928 | 157111227 | PLCG1 | 298 | 509 | 20 | 39799245 | 39799456 | |
| AW894554 | ZEB2 | 14 | 189 | 2 | 145271641 | 145271818 | PLCG1 | 184 | 355 | 20 | 39800849 | 39801151 | |
| Top |
| Mutation type/ Tissue ID | brca | cns | cerv | endome | haematopo | kidn | Lintest | liver | lung | ns | ovary | pancre | prost | skin | stoma | thyro | urina | |||
| Total # sample | 1 | 2 | ||||||||||||||||||
| GAIN (# sample) | 1 | 2 | ||||||||||||||||||
| LOSS (# sample) |
| cf) Tissue ID; Tissue type (1; Breast, 2; Central_nervous_system, 3; Cervix, 4; Endometrium, 5; Haematopoietic_and_lymphoid_tissue, 6; Kidney, 7; Large_intestine, 8; Liver, 9; Lung, 10; NS, 11; Ovary, 12; Pancreas, 13; Prostate, 14; Skin, 15; Stomach, 16; Thyroid, 17; Urinary_tract) |
| Top |
|
 |
| Top |
| Stat. for Non-Synonymous SNVs (# total SNVs=108) | (# total SNVs=36) |
 |  |
(# total SNVs=1) | (# total SNVs=0) |
 |
| Top |
| * When you move the cursor on each content, you can see more deailed mutation information on the Tooltip. Those are primary_site,primary_histology,mutation(aa),pubmedID. |
| GRCh37 position | Mutation(aa) | Unique sampleID count |
| chr20:39792584-39792584 | p.S345F | 9 |
| chr20:39795235-39795235 | p.R707Q | 6 |
| chr20:39793963-39793963 | p.S489P | 3 |
| chr20:39802384-39802384 | p.E1163K | 3 |
| chr20:39802942-39802942 | p.R1275Q | 3 |
| chr20:39802848-39802848 | p.R1244* | 2 |
| chr20:39801087-39801087 | p.R978W | 2 |
| chr20:39802889-39802889 | p.P1257P | 2 |
| chr20:39794389-39794389 | p.I574I | 2 |
| chr20:39801100-39801100 | p.S982F | 2 |
| Top |
|
 |
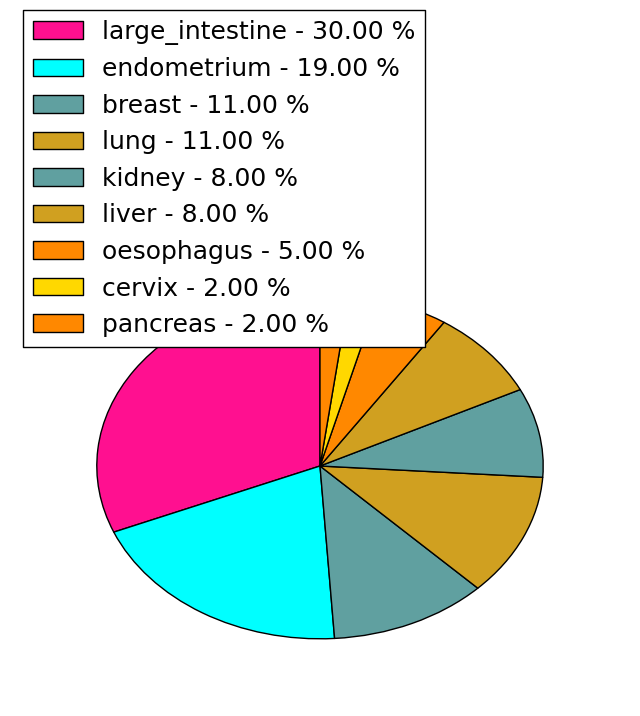
| Point Mutation/ Tissue ID | 1 | 2 | 3 | 4 | 5 | 6 | 7 | 8 | 9 | 10 | 11 | 12 | 13 | 14 | 15 | 16 | 17 | 18 | 19 | 20 |
| # sample | 4 | 7 | 1 | 24 | 4 | 5 | 1 | 3 | 7 | 7 | 1 | 15 | 16 | 17 | ||||||
| # mutation | 4 | 7 | 1 | 22 | 5 | 5 | 1 | 3 | 7 | 7 | 1 | 16 | 17 | 18 | ||||||
| nonsynonymous SNV | 4 | 5 | 13 | 5 | 5 | 1 | 7 | 4 | 1 | 9 | 14 | 12 | ||||||||
| synonymous SNV | 2 | 1 | 9 | 3 | 3 | 7 | 3 | 6 |
| cf) Tissue ID; Tissue type (1; BLCA[Bladder Urothelial Carcinoma], 2; BRCA[Breast invasive carcinoma], 3; CESC[Cervical squamous cell carcinoma and endocervical adenocarcinoma], 4; COAD[Colon adenocarcinoma], 5; GBM[Glioblastoma multiforme], 6; Glioma Low Grade, 7; HNSC[Head and Neck squamous cell carcinoma], 8; KICH[Kidney Chromophobe], 9; KIRC[Kidney renal clear cell carcinoma], 10; KIRP[Kidney renal papillary cell carcinoma], 11; LAML[Acute Myeloid Leukemia], 12; LUAD[Lung adenocarcinoma], 13; LUSC[Lung squamous cell carcinoma], 14; OV[Ovarian serous cystadenocarcinoma ], 15; PAAD[Pancreatic adenocarcinoma], 16; PRAD[Prostate adenocarcinoma], 17; SKCM[Skin Cutaneous Melanoma], 18:STAD[Stomach adenocarcinoma], 19:THCA[Thyroid carcinoma], 20:UCEC[Uterine Corpus Endometrial Carcinoma]) |
| Top |
| * We represented just top 10 SNVs. When you move the cursor on each content, you can see more deailed mutation information on the Tooltip. Those are primary_site, primary_histology, mutation(aa), pubmedID. |
| Genomic Position | Mutation(aa) | Unique sampleID count |
| chr20:39798904 | p.A935T,PLCG1 | 3 |
| chr20:39802384 | p.E1163K,PLCG1 | 3 |
| chr20:39793963 | p.S489P,PLCG1 | 3 |
| chr20:39794395 | p.V108A,PLCG1 | 2 |
| chr20:39792036 | p.F731F,PLCG1 | 2 |
| chr20:39797452 | p.T576T,PLCG1 | 2 |
| chr20:39788351 | p.R270C,PLCG1 | 2 |
| chr20:39793965 | p.R978W,PLCG1 | 2 |
| chr20:39801087 | p.E809K,PLCG1 | 2 |
| chr20:39795391 | p.S489S,PLCG1 | 2 |
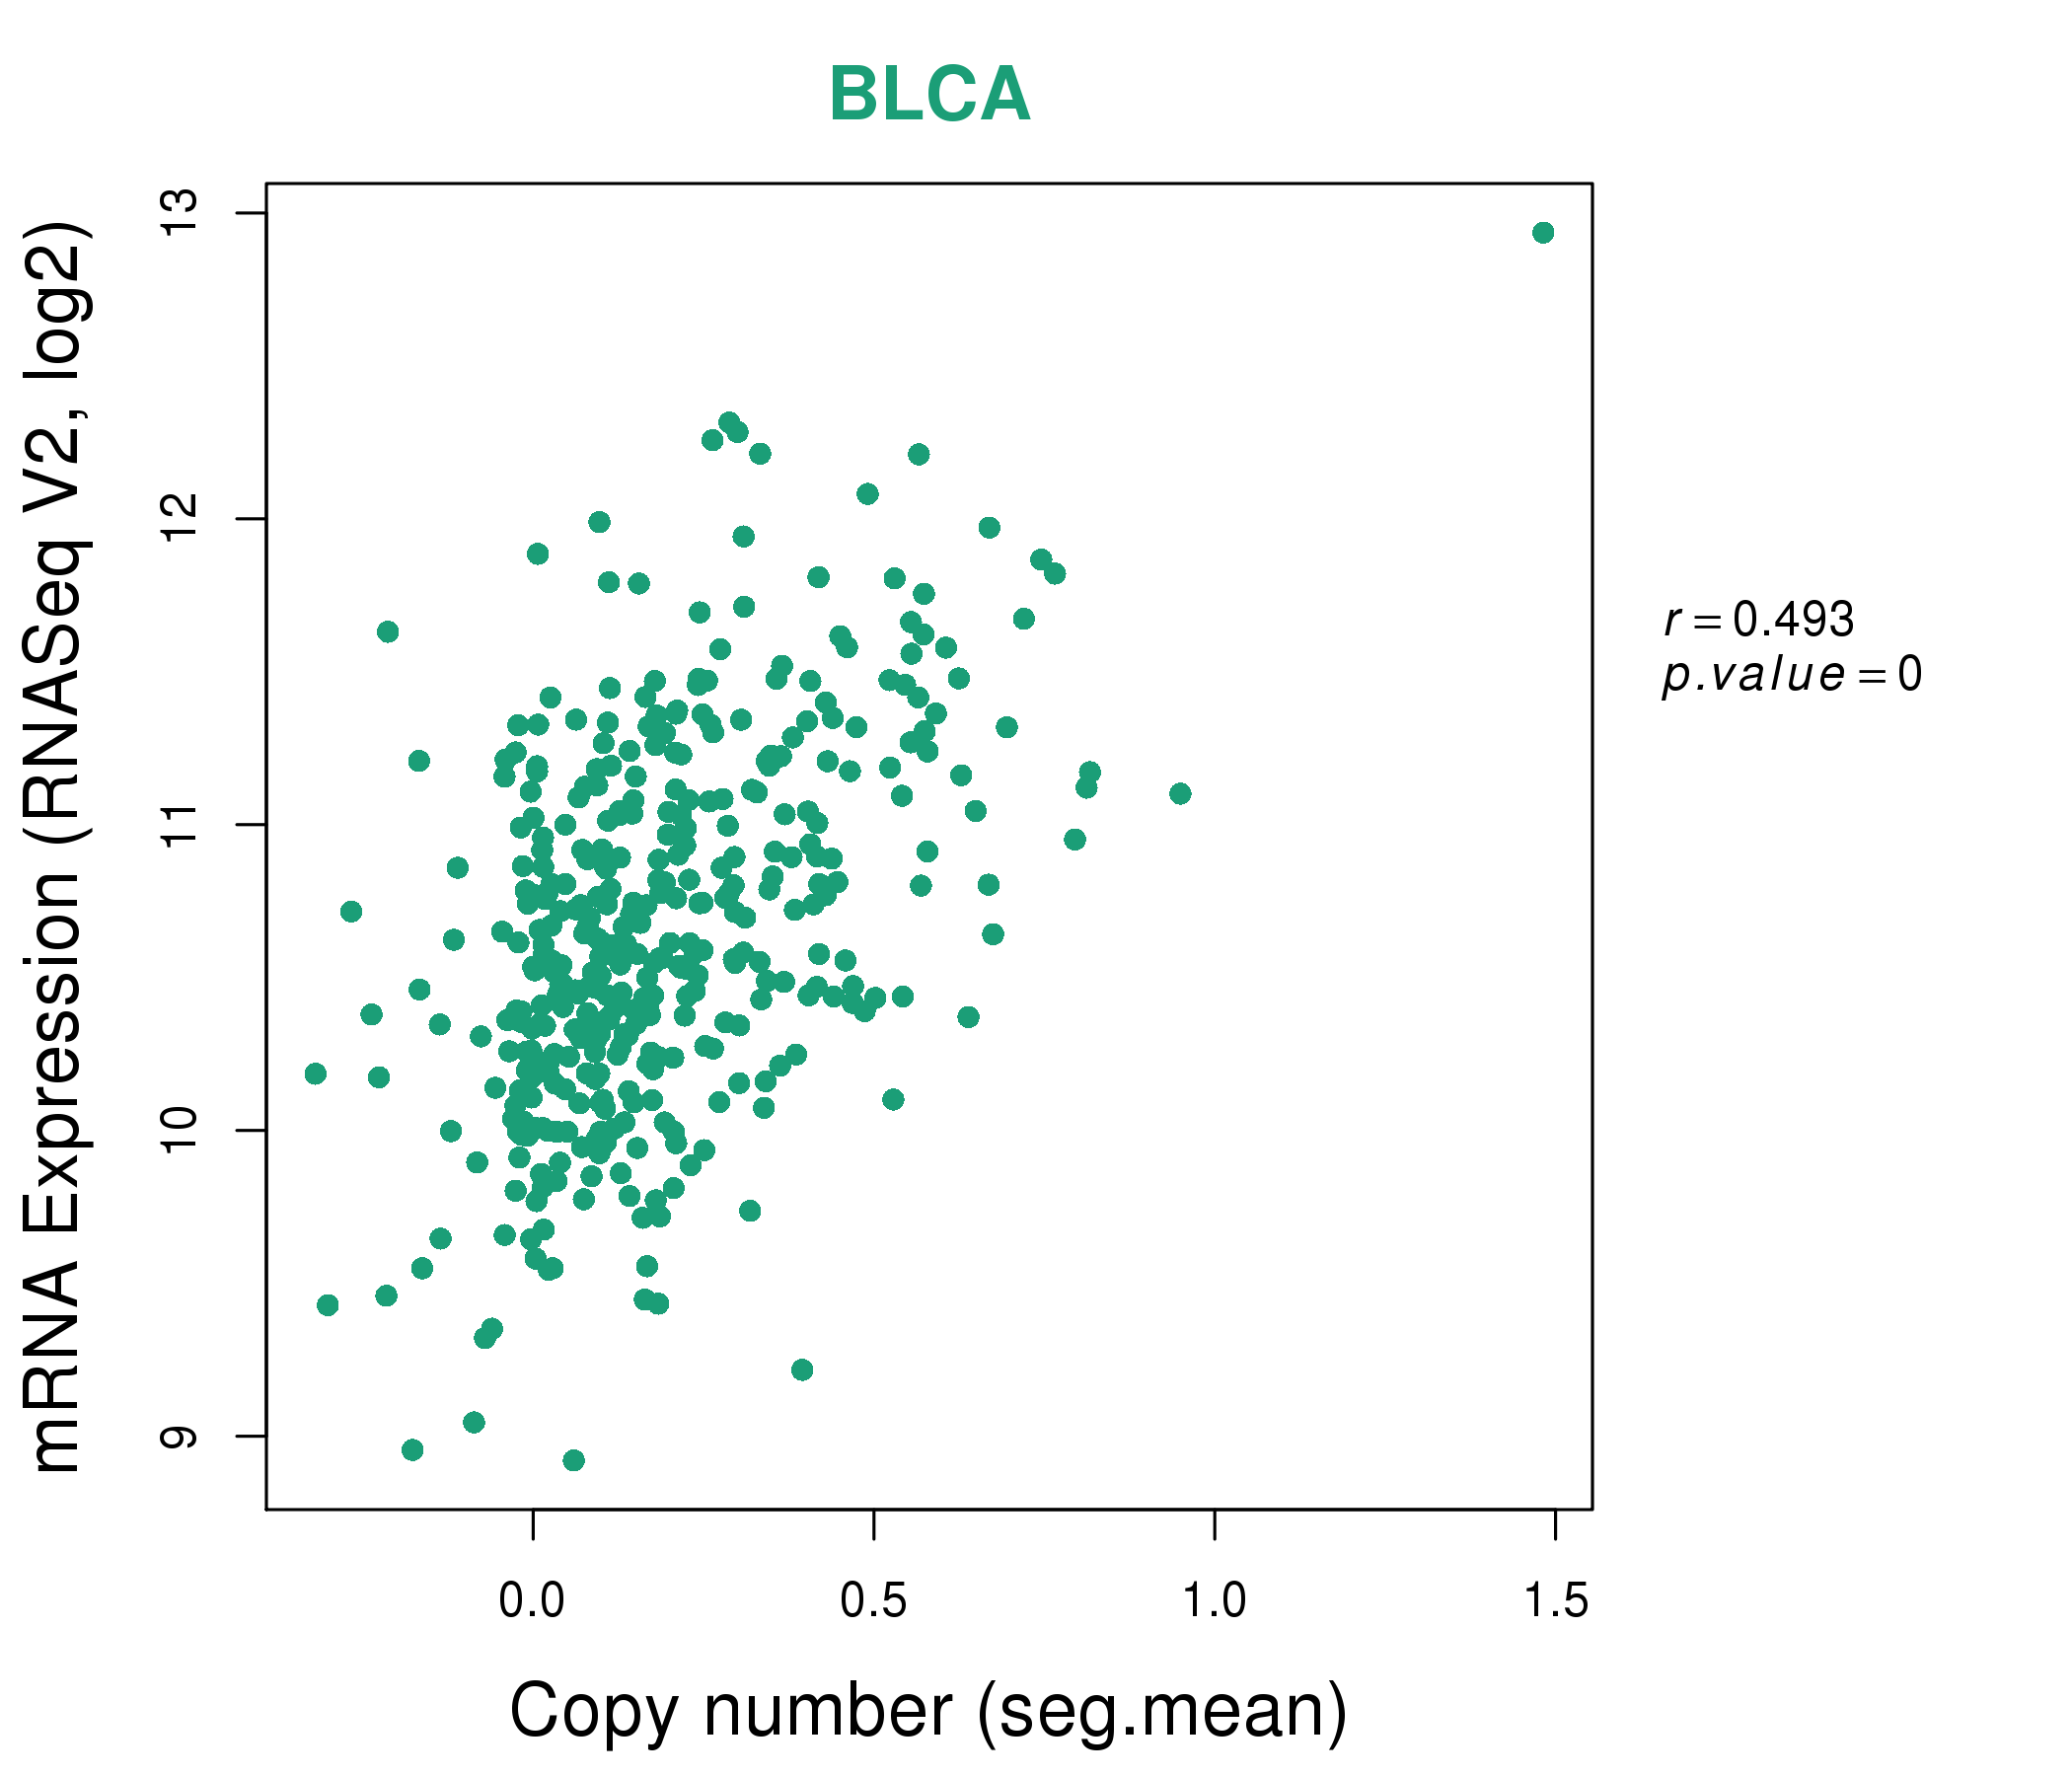
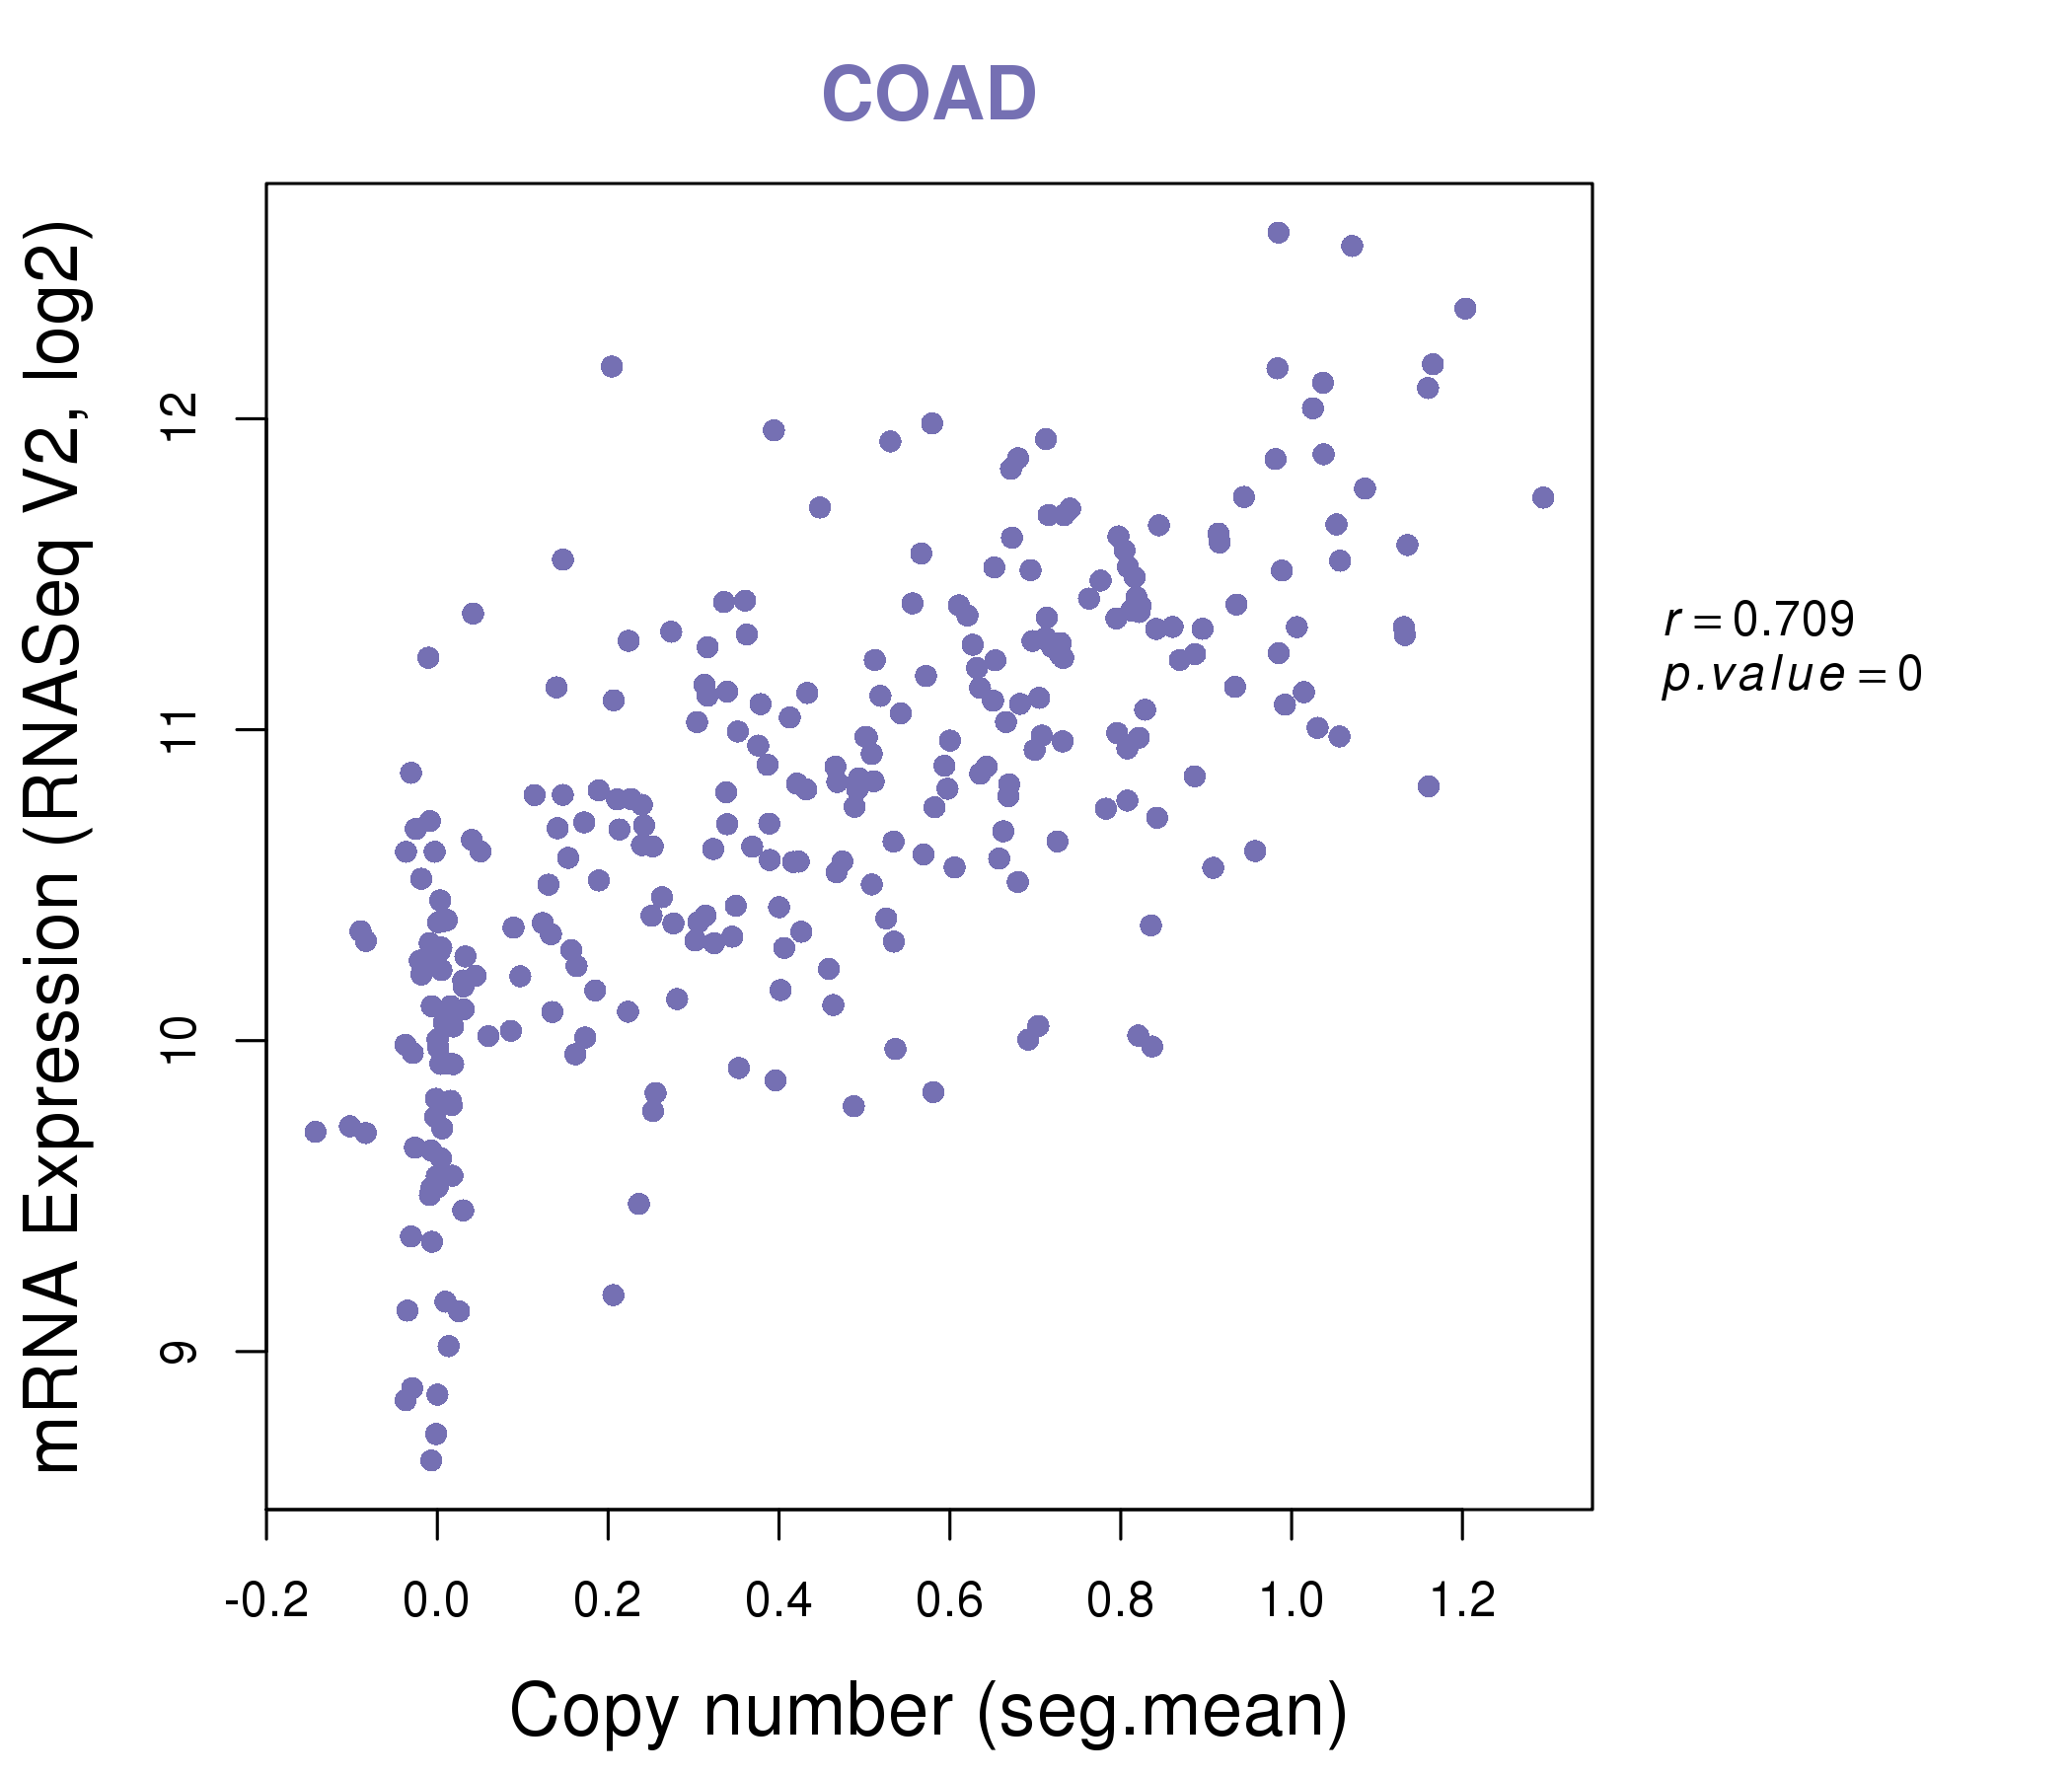
| * Copy number data were extracted from TCGA using R package TCGA-Assembler. The URLs of all public data files on TCGA DCC data server were gathered on Jan-05-2015. Function ProcessCNAData in TCGA-Assembler package was used to obtain gene-level copy number value which is calculated as the average copy number of the genomic region of a gene. |
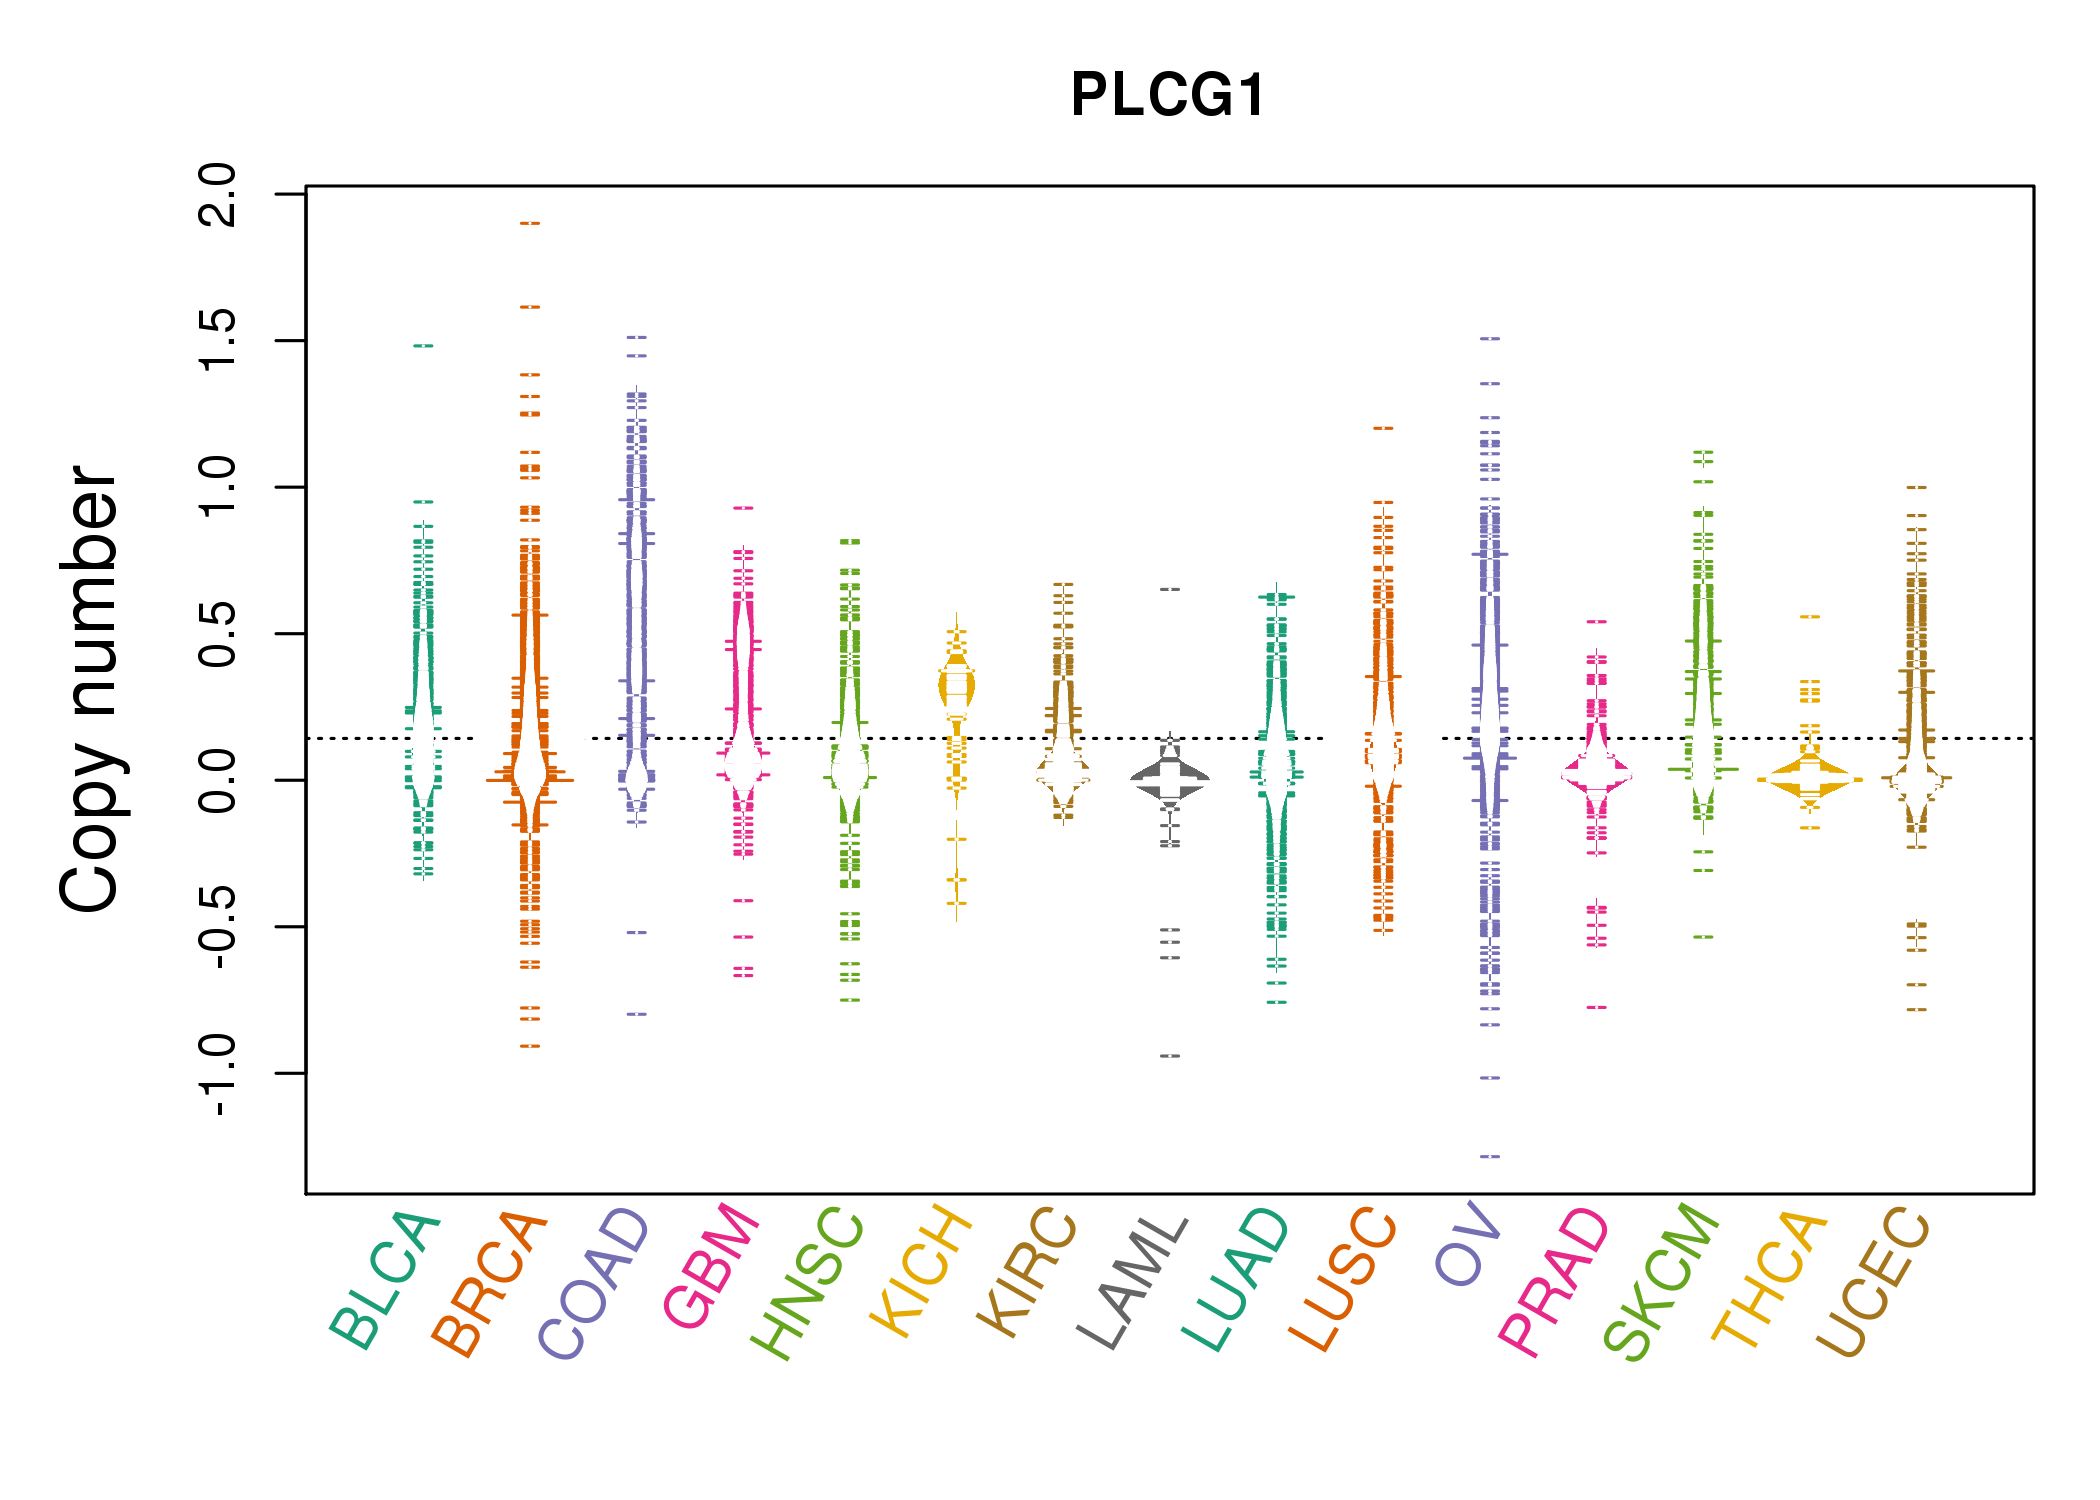 |
| cf) Tissue ID[Tissue type]: BLCA[Bladder Urothelial Carcinoma], BRCA[Breast invasive carcinoma], CESC[Cervical squamous cell carcinoma and endocervical adenocarcinoma], COAD[Colon adenocarcinoma], GBM[Glioblastoma multiforme], Glioma Low Grade, HNSC[Head and Neck squamous cell carcinoma], KICH[Kidney Chromophobe], KIRC[Kidney renal clear cell carcinoma], KIRP[Kidney renal papillary cell carcinoma], LAML[Acute Myeloid Leukemia], LUAD[Lung adenocarcinoma], LUSC[Lung squamous cell carcinoma], OV[Ovarian serous cystadenocarcinoma ], PAAD[Pancreatic adenocarcinoma], PRAD[Prostate adenocarcinoma], SKCM[Skin Cutaneous Melanoma], STAD[Stomach adenocarcinoma], THCA[Thyroid carcinoma], UCEC[Uterine Corpus Endometrial Carcinoma] |
| Top |
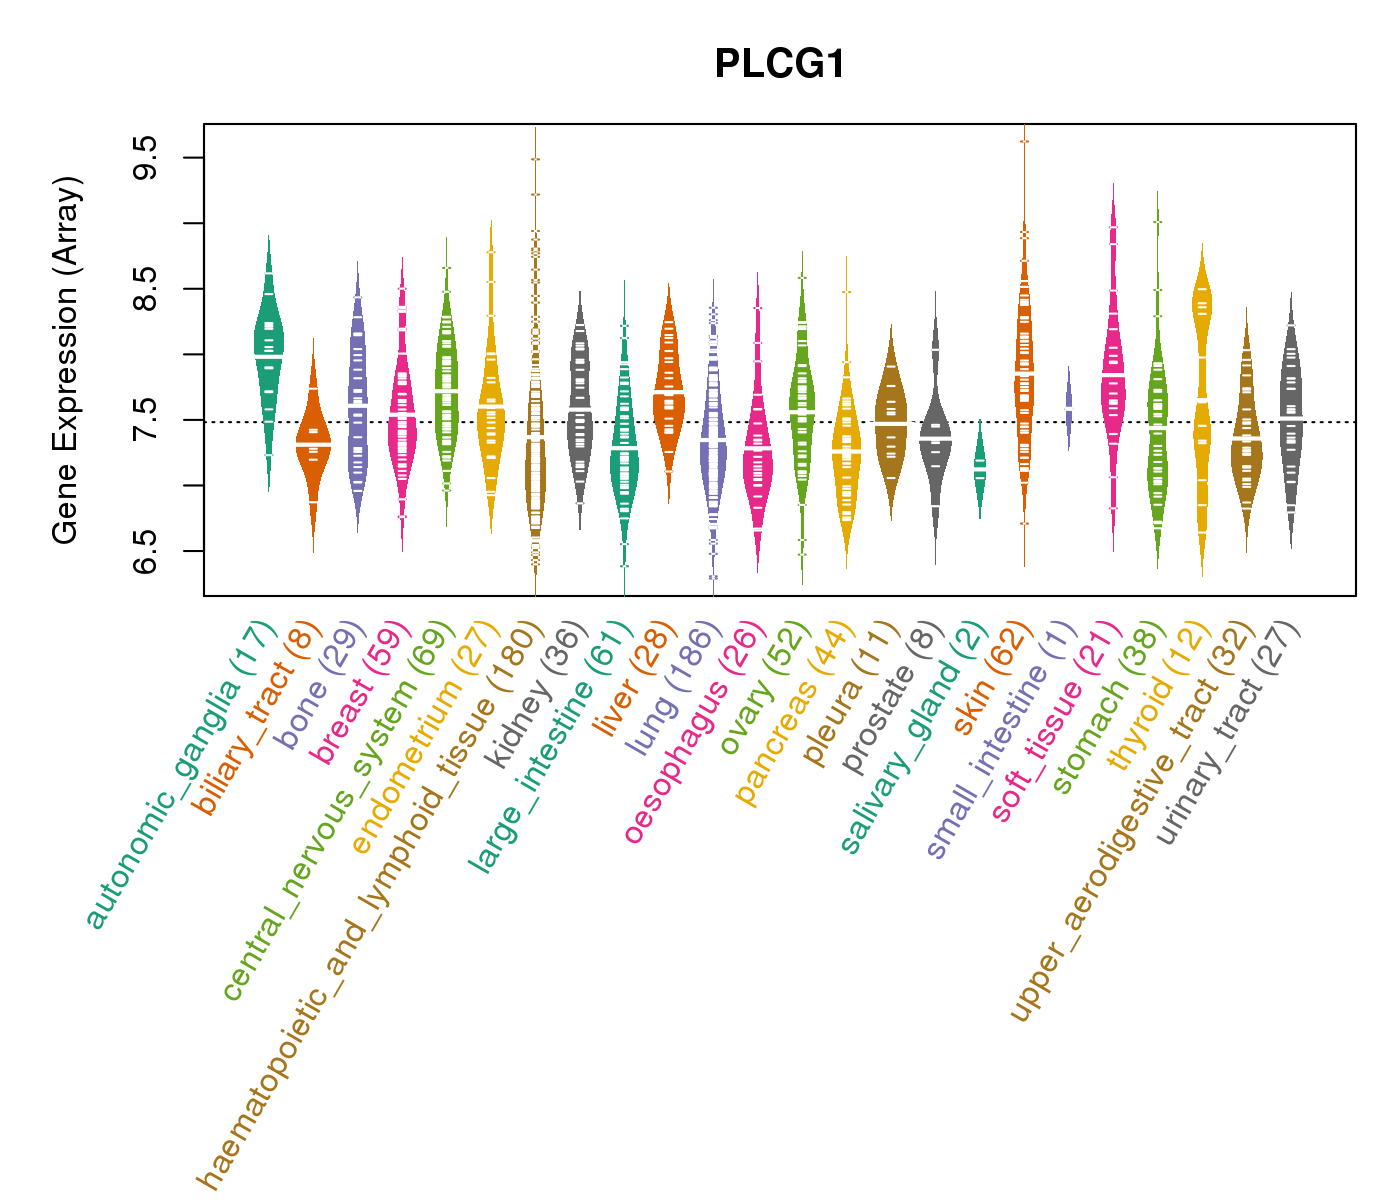
| Gene Expression for PLCG1 |
| * CCLE gene expression data were extracted from CCLE_Expression_Entrez_2012-10-18.res: Gene-centric RMA-normalized mRNA expression data. |
 |
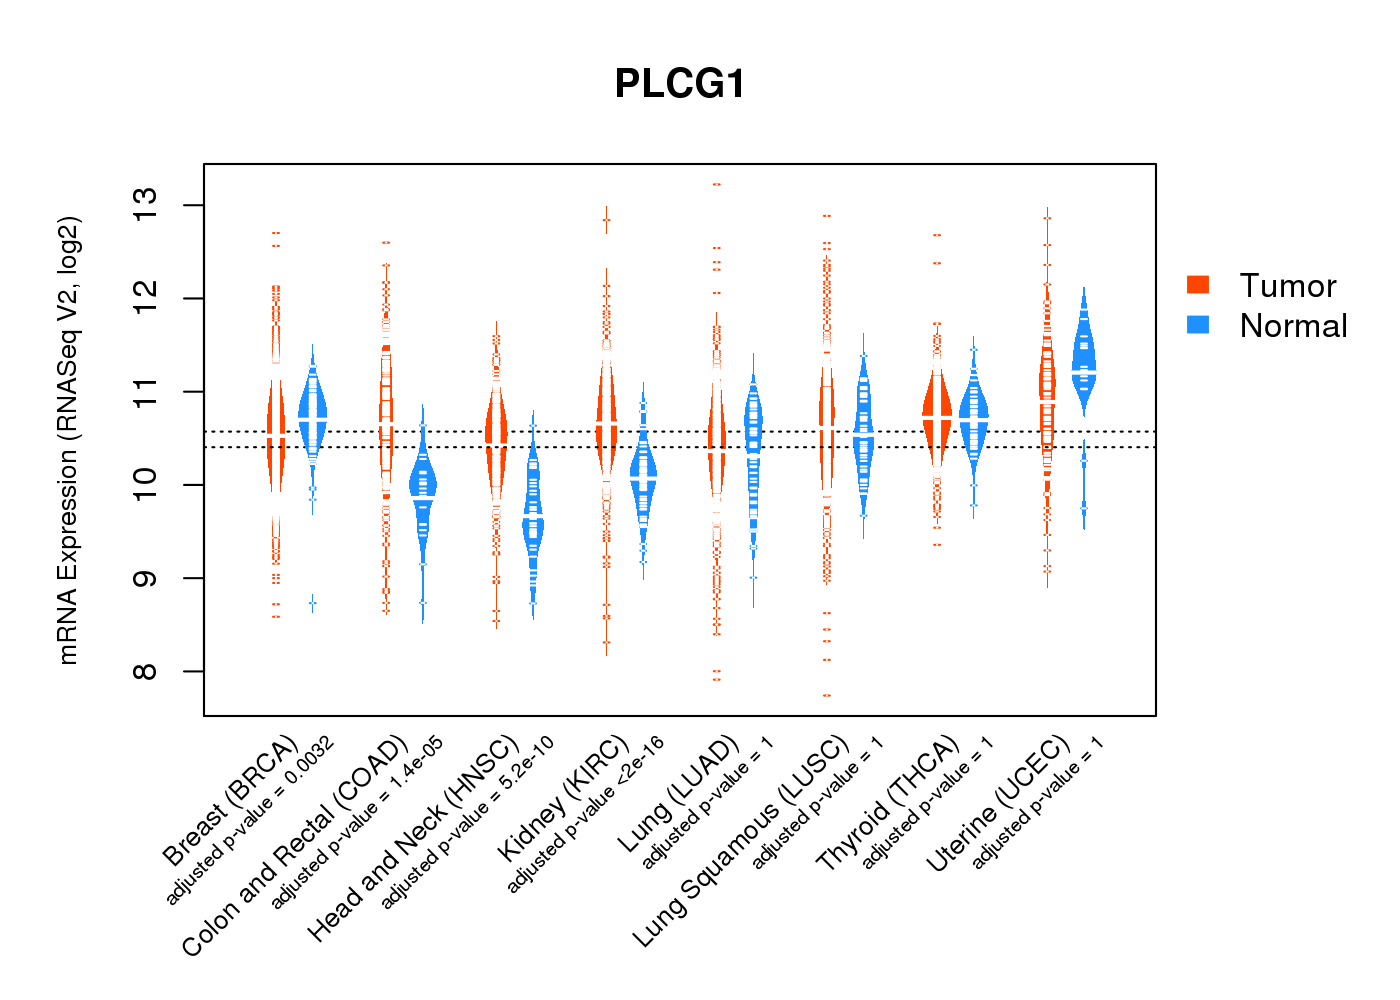
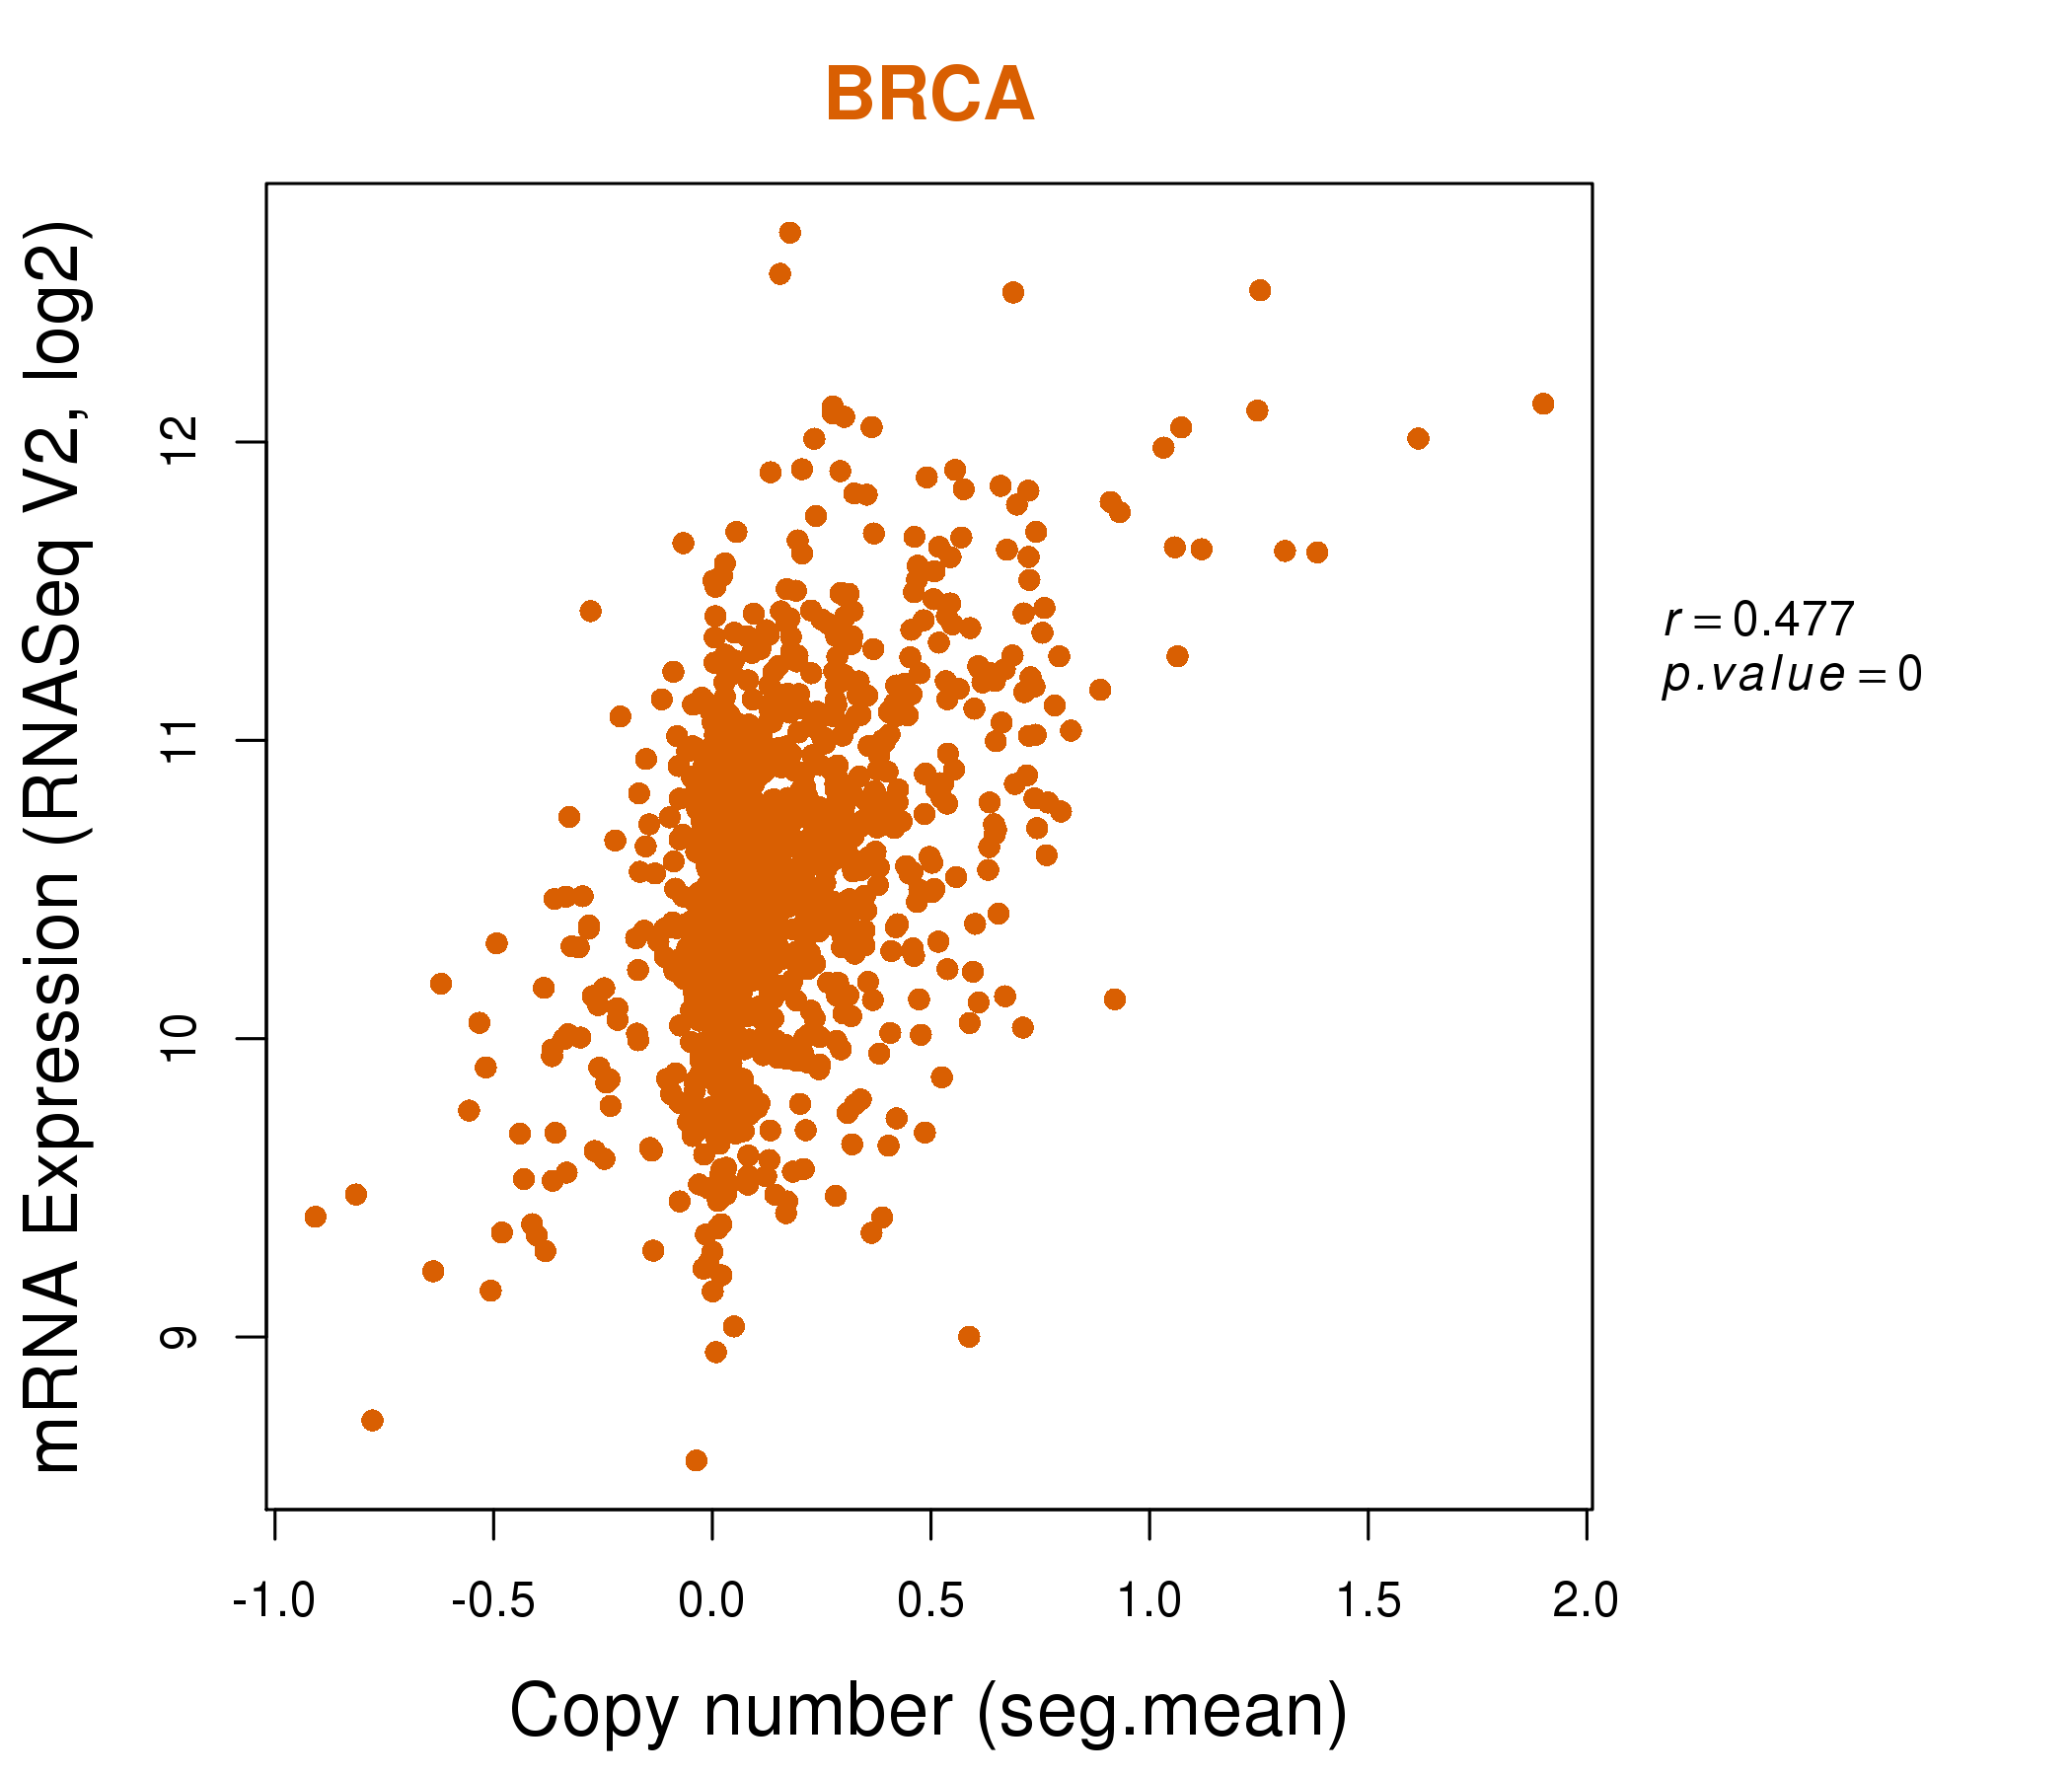
| * Normalized gene expression data of RNASeqV2 was extracted from TCGA using R package TCGA-Assembler. The URLs of all public data files on TCGA DCC data server were gathered at Jan-05-2015. Only eight cancer types have enough normal control samples for differential expression analysis. (t test, adjusted p<0.05 (using Benjamini-Hochberg FDR)) |
 |
| Top |
| * This plots show the correlation between CNV and gene expression. |
: Open all plots for all cancer types
 |
|
 |
|

| Top |
| Gene-Gene Network Information |
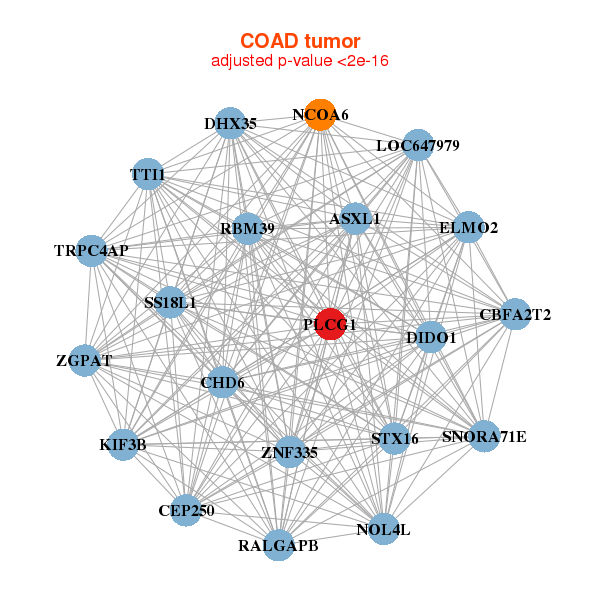
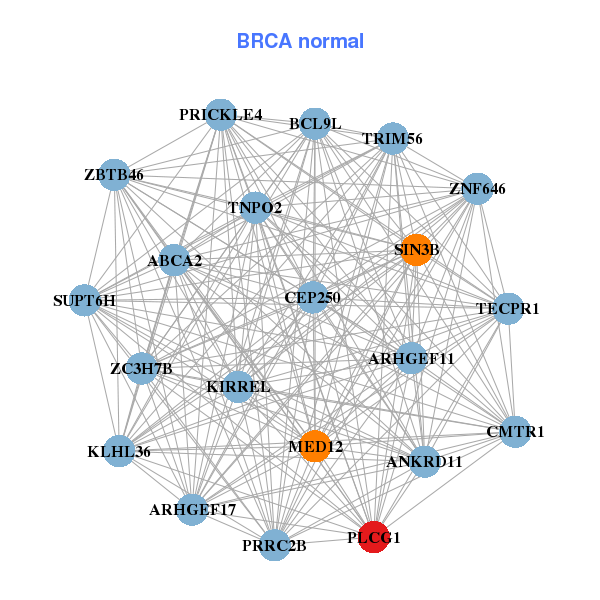
| * Co-Expression network figures were drawn using R package igraph. Only the top 20 genes with the highest correlations were shown. Red circle: input gene, orange circle: cell metabolism gene, sky circle: other gene |
: Open all plots for all cancer types
 |
| ||||
| CABLES2,CCDC142,DHX35,DLGAP4,DNMT3A,DNMT3B,GPC2, KCNAB3,LPIN3,LY6G5B,NINL,PLCG1,RTEL1,SS18L1, TGIF2,TOP1P1,UCKL1,ZBTB46,ZCCHC18,ZNF335,ZNF512B | ABCA2,ANKRD11,ARHGEF11,ARHGEF17,PRRC2B,BCL9L,CEP250, CMTR1,KIRREL,KLHL36,MED12,PLCG1,PRICKLE4,SIN3B, SUPT6H,TECPR1,TNPO2,TRIM56,ZBTB46,ZC3H7B,ZNF646 | ||||
 |
| ||||
| ASXL1,NOL4L,CBFA2T2,CEP250,CHD6,DHX35,DIDO1, ELMO2,TTI1,KIF3B,LOC647979,NCOA6,PLCG1,RALGAPB, RBM39,SNORA71E,SS18L1,STX16,TRPC4AP,ZGPAT,ZNF335 | ASAP1,ASXL1,PRRC2B,CHD6,CLCN6,FAM193A,PIEZO1, HERC1,IQSEC1,LZTR1,KMT2A,OBSCN,PHF12,PHF2, PLCG1,POGZ,TNRC6A,TRERF1,ZNF37BP,ZNF516,ZNF589 |

| * Co-Expression network figures were drawn using R package igraph. Only the top 20 genes with the highest correlations were shown. Red circle: input gene, orange circle: cell metabolism gene, sky circle: other gene |
: Open all plots for all cancer types
| Top |
: Open all interacting genes' information including KEGG pathway for all interacting genes from DAVID
| Top |
| Pharmacological Information for PLCG1 |
| DB Category | DB Name | DB's ID and Url link |
| Chemistry | BindingDB | P19174; -. |
| Chemistry | ChEMBL | CHEMBL3964; -. |
| Organism-specific databases | PharmGKB | PA33392; -. |
| Organism-specific databases | CTD | 5335; -. |
| * Gene Centered Interaction Network. |
 |
| * Drug Centered Interaction Network. |
| DrugBank ID | Target Name | Drug Groups | Generic Name | Drug Centered Network | Drug Structure |
| DB00171 | phospholipase C, gamma 1 | approved; nutraceutical | Adenosine triphosphate |  |  |
| DB00131 | phospholipase C, gamma 1 | approved; nutraceutical | Adenosine monophosphate | 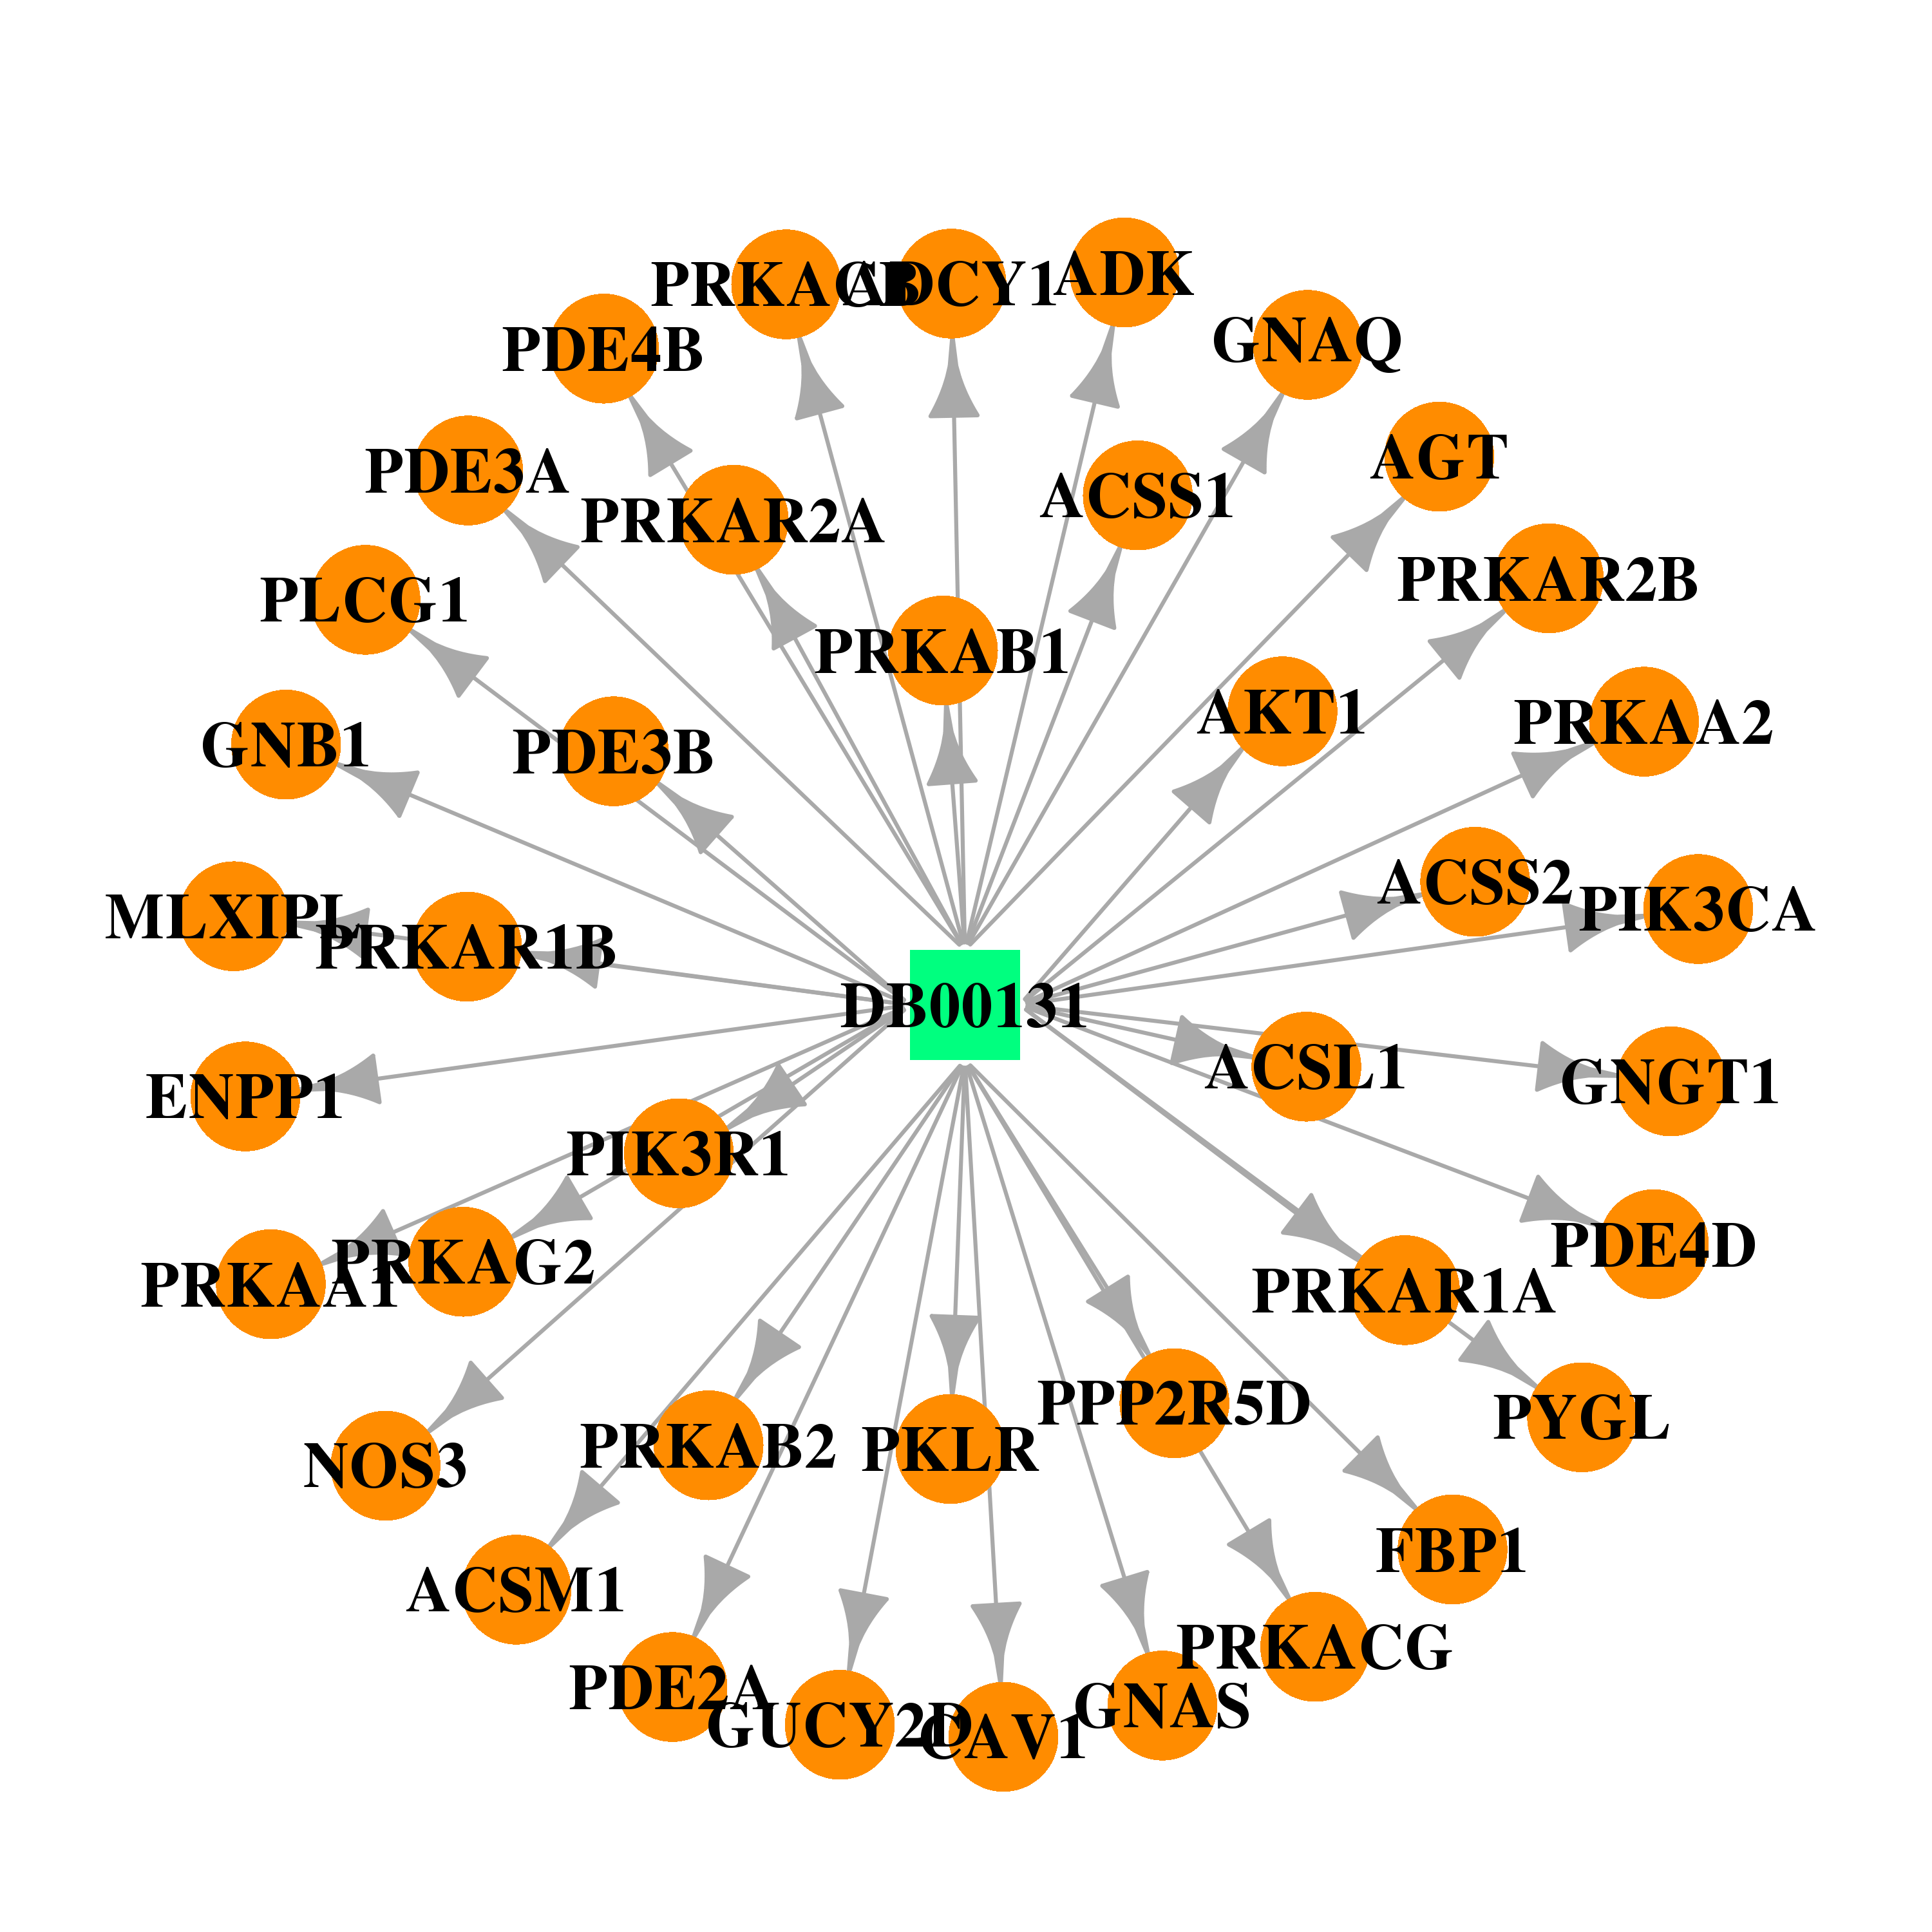 |  |
| DB00125 | phospholipase C, gamma 1 | approved; nutraceutical | L-Arginine |  |  |
| DB00155 | phospholipase C, gamma 1 | approved; nutraceutical | L-Citrulline | 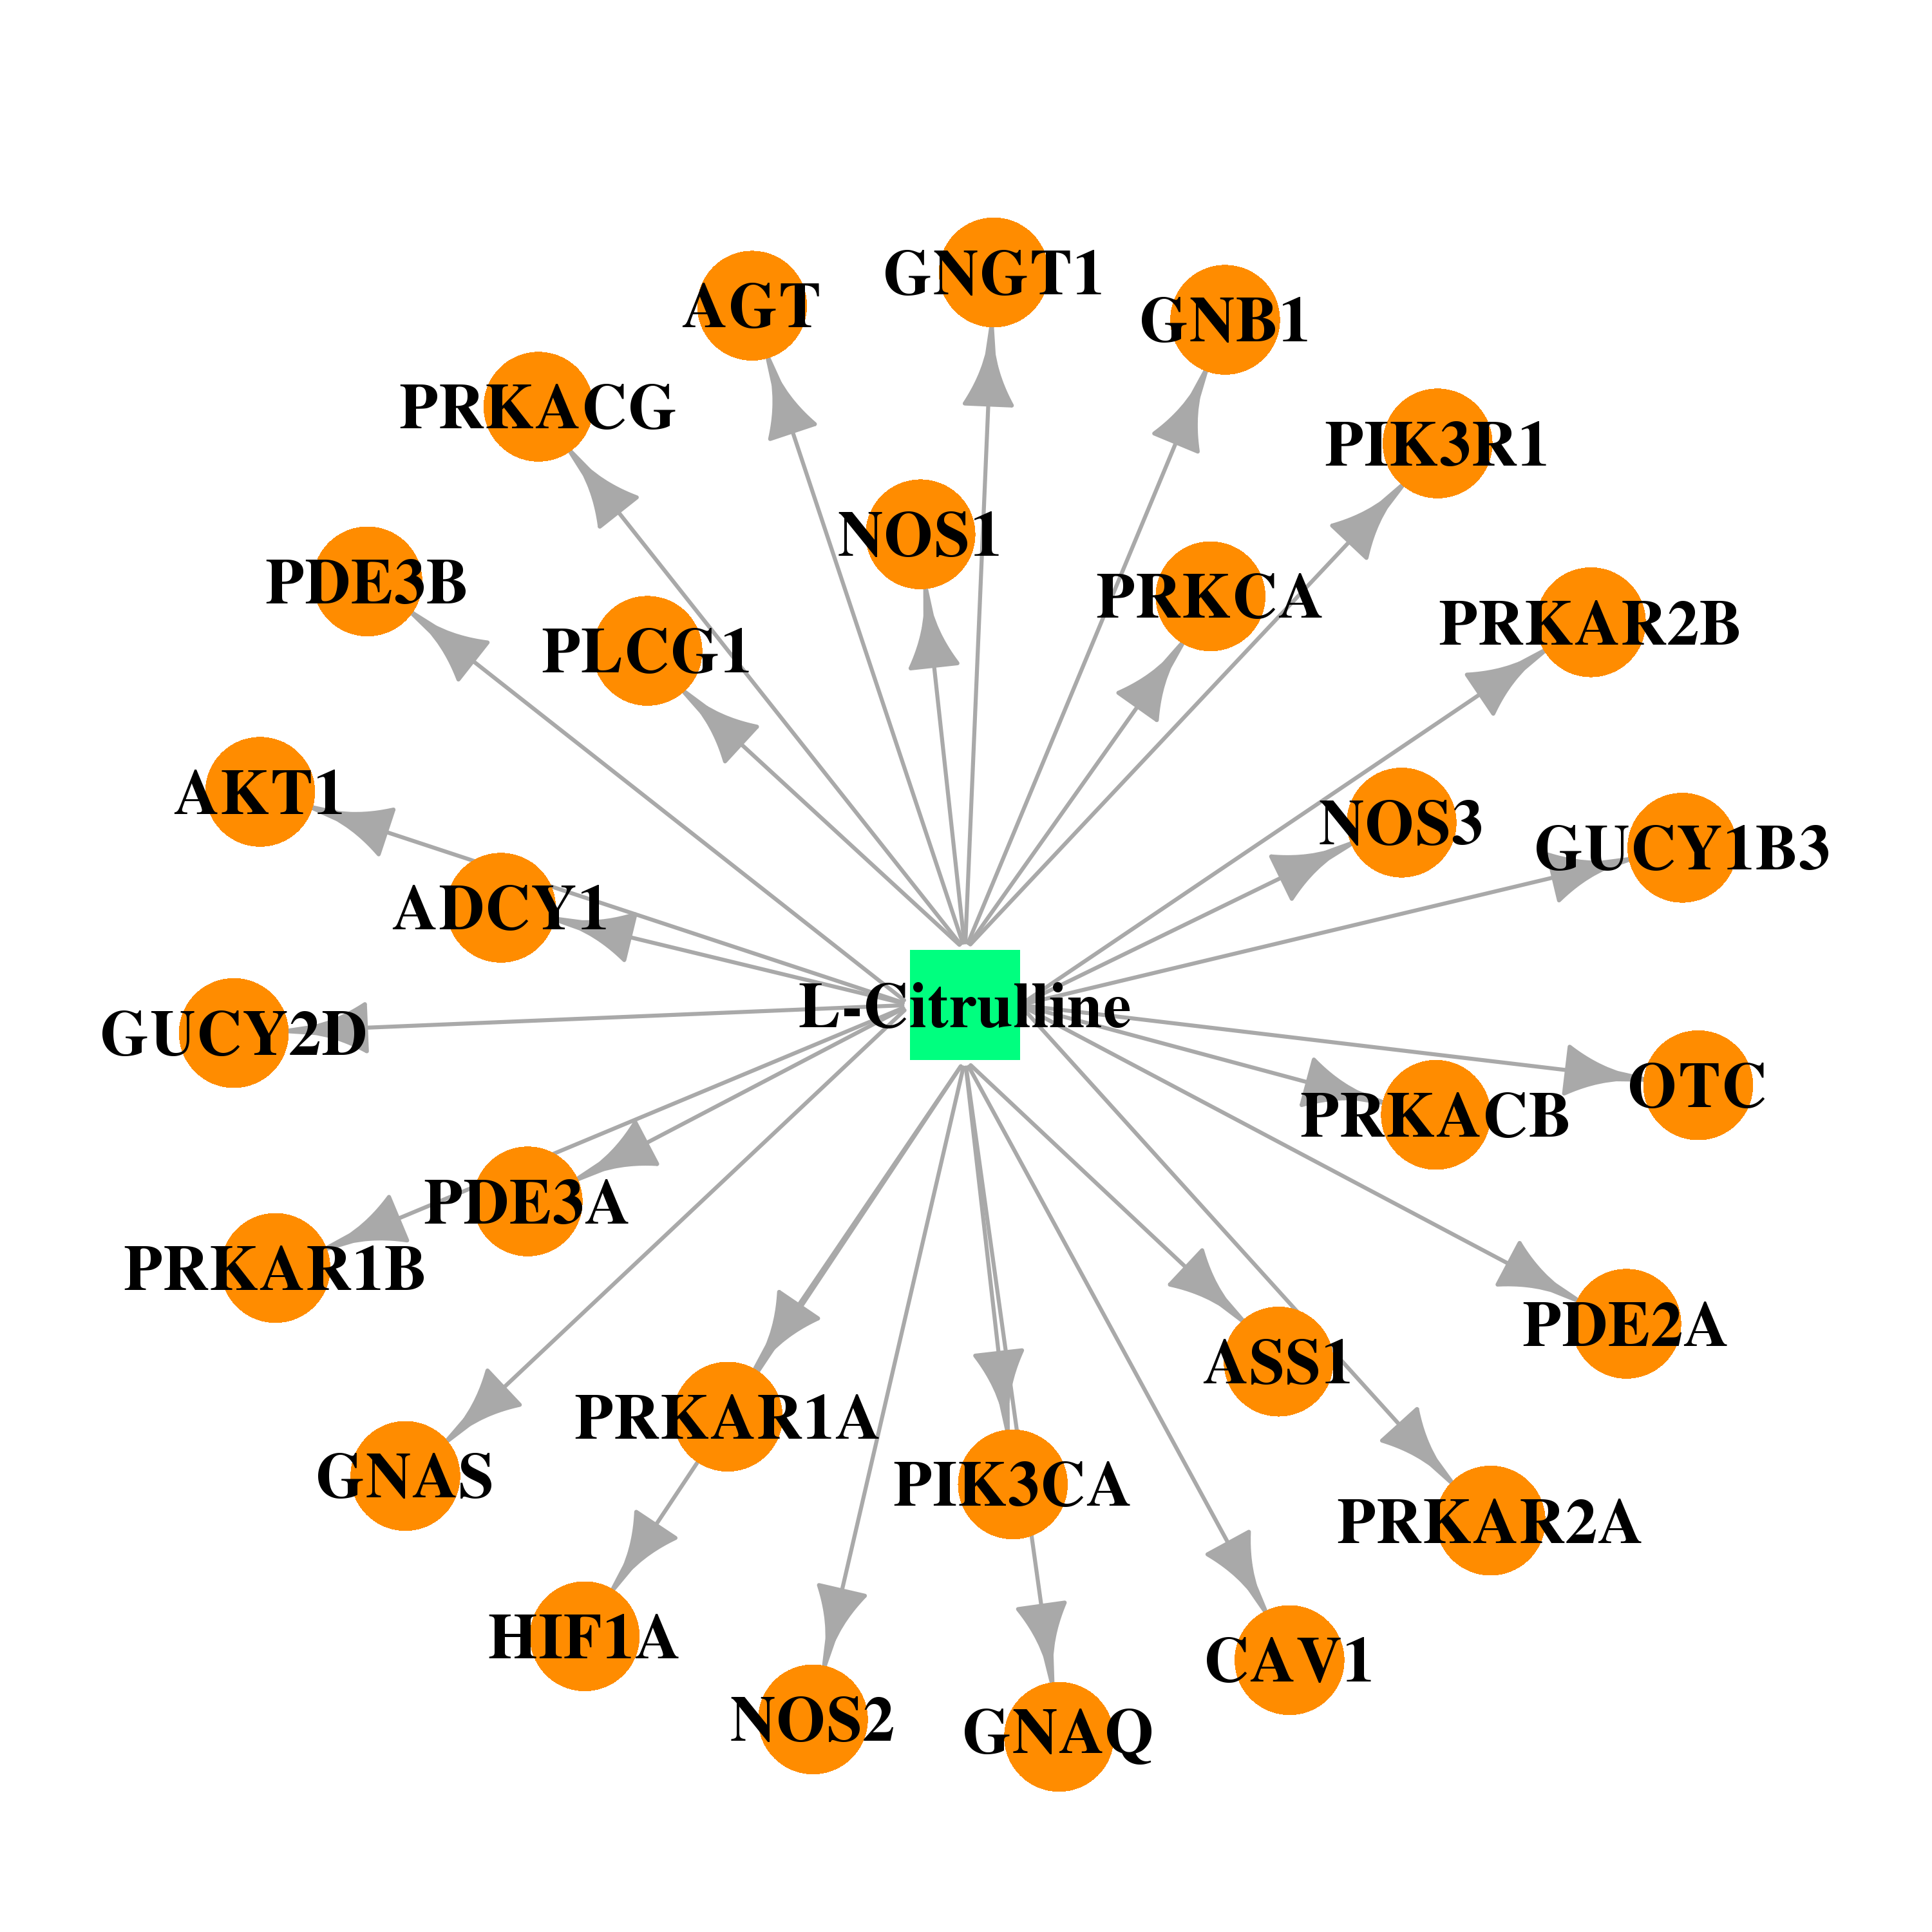 |  |
| DB00435 | phospholipase C, gamma 1 | approved | Nitric Oxide | 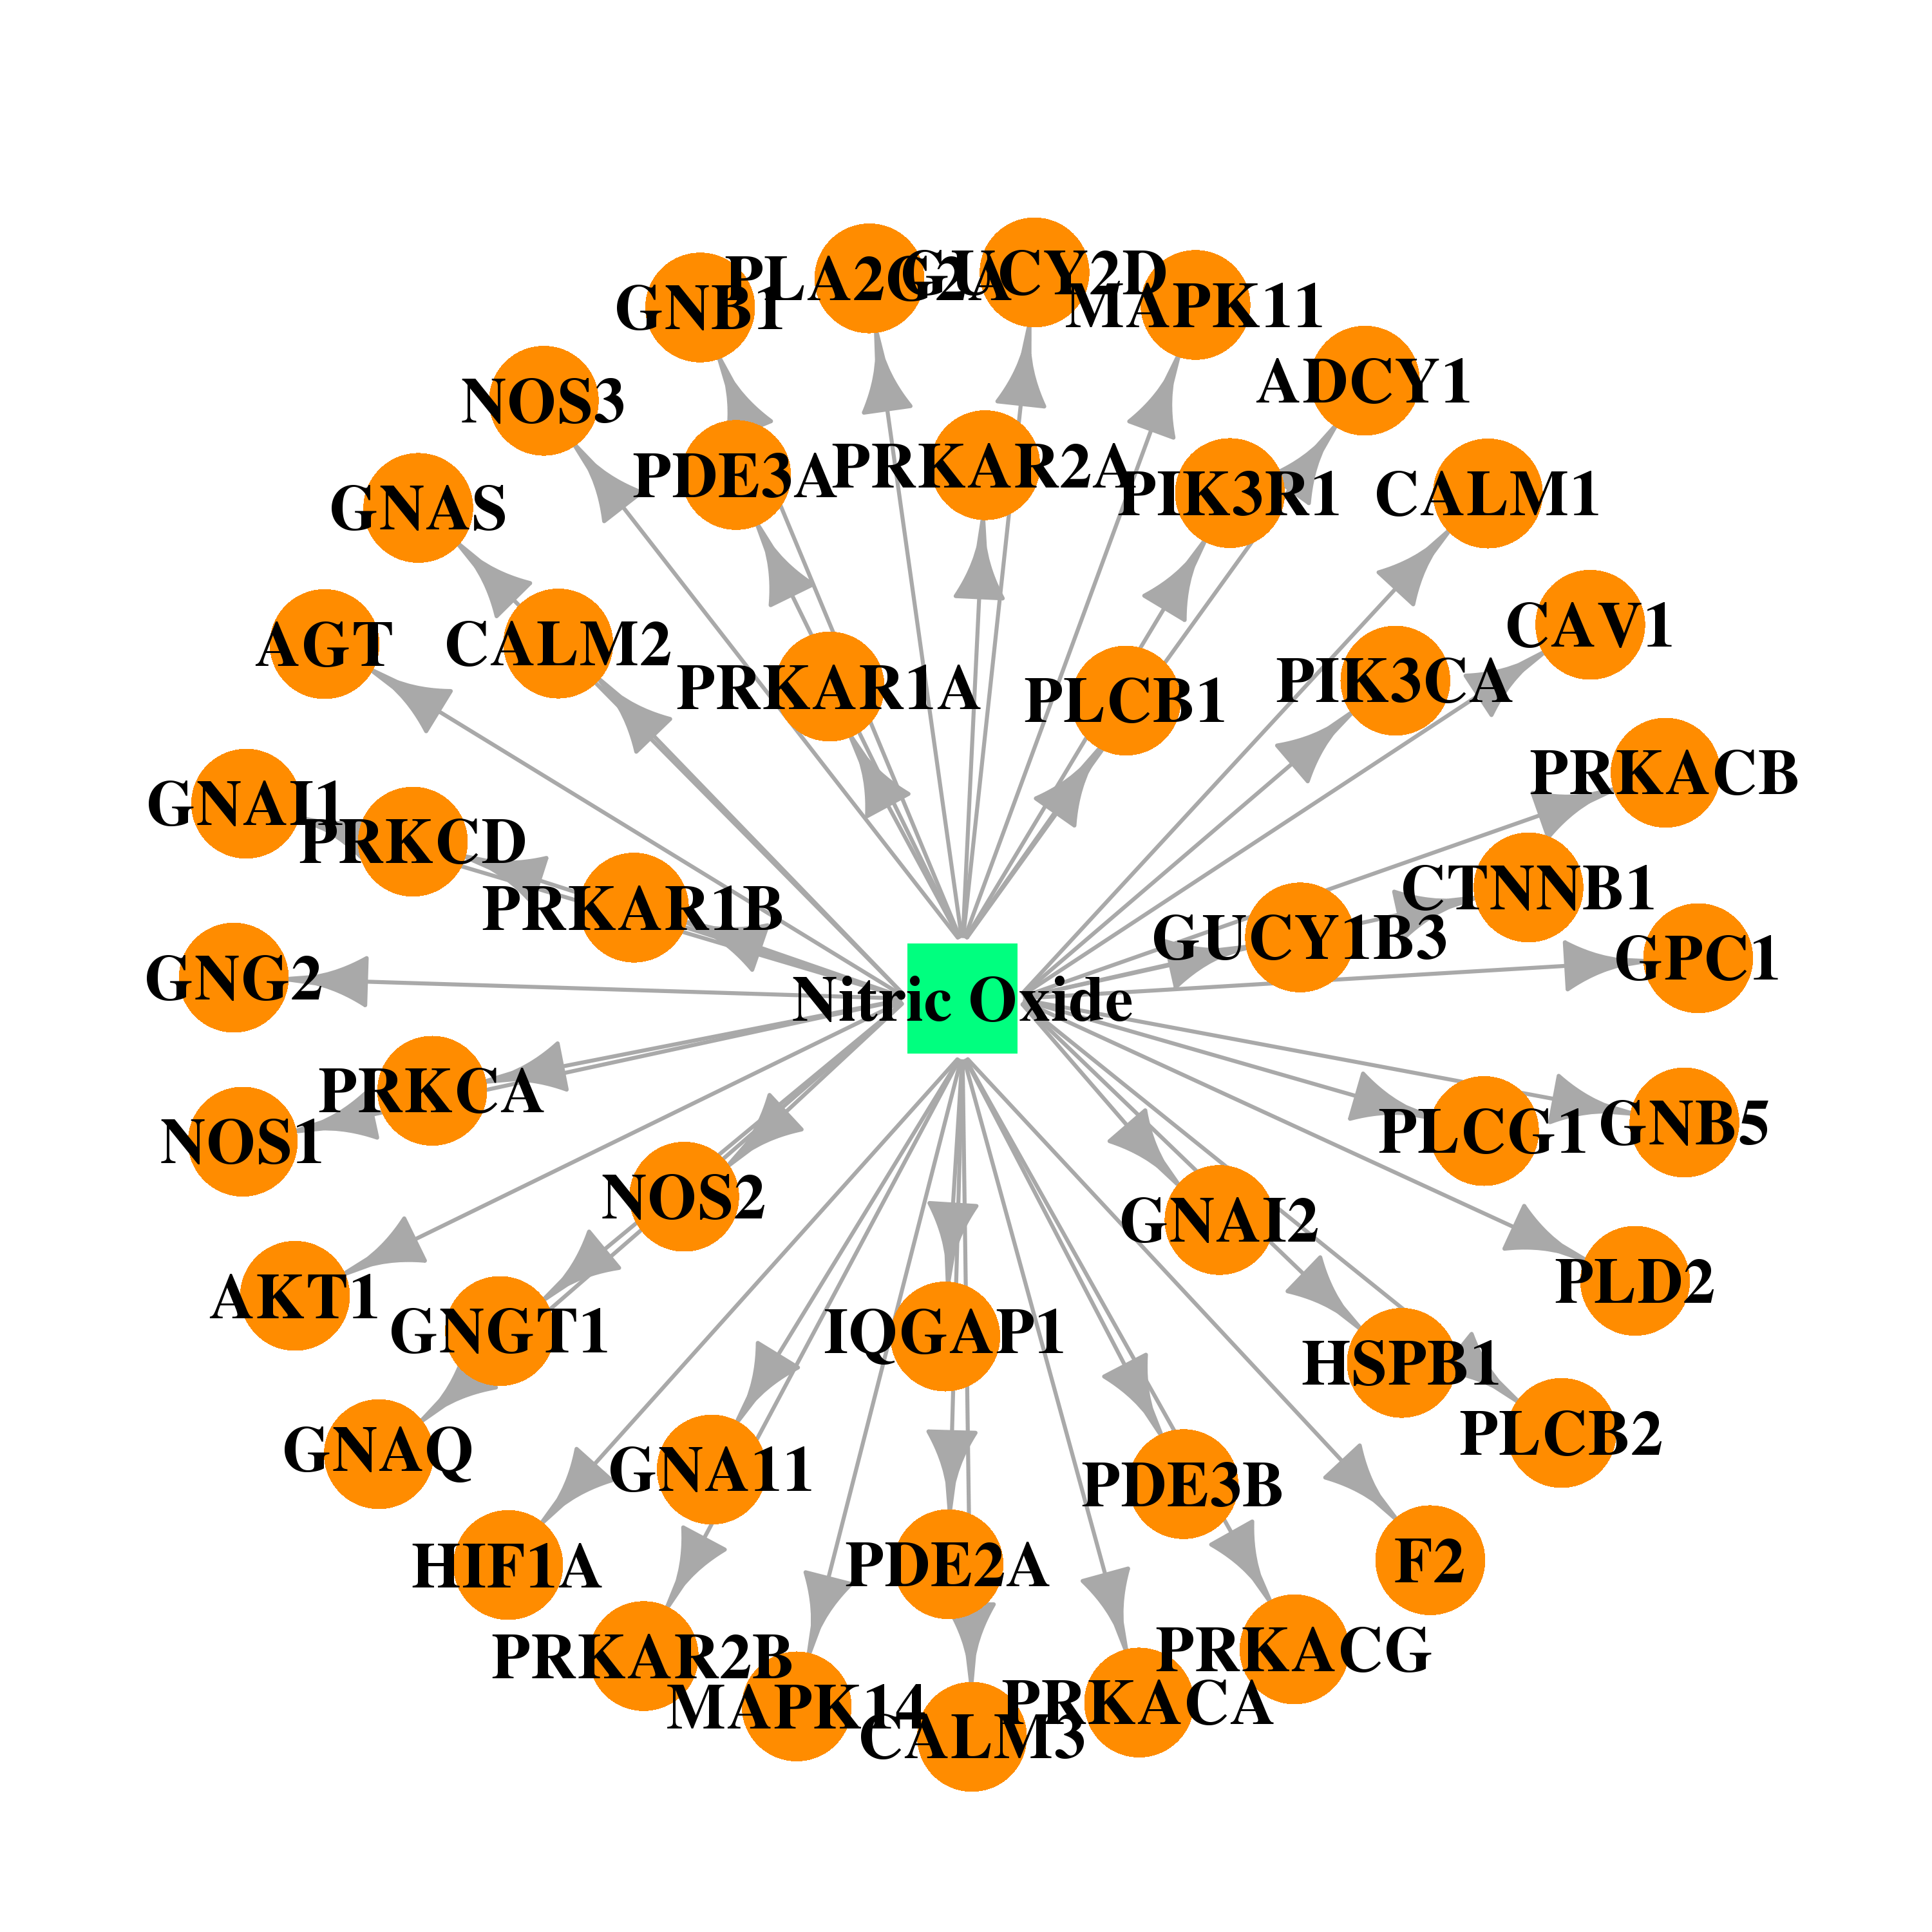 |  |
| DB00608 | phospholipase C, gamma 1 | approved | Chloroquine |  |  |
| DB00864 | phospholipase C, gamma 1 | approved; investigational | Tacrolimus |  |  |
| Top |
| Cross referenced IDs for PLCG1 |
| * We obtained these cross-references from Uniprot database. It covers 150 different DBs, 18 categories. http://www.uniprot.org/help/cross_references_section |
: Open all cross reference information
|
Copyright © 2016-Present - The Univsersity of Texas Health Science Center at Houston @ |