|
||||||||||||||||||||||||||||||||||||||||||||||||||||||||||||||||||||||||||||||||||||||||||||||||||||||||||||||||||||||||||||||||||||||||||||||||||||||||||||||||||||||||||||||||||||||||||||||||||||||||||||||||||||||||||||||||||||||||||||||||||||||||||||||||||||||||||||||||||||||||||||||||||||||||||||||||||||||||||
| |
| Phenotypic Information (metabolism pathway, cancer, disease, phenome) |
| |
| |
| Gene-Gene Network Information: Co-Expression Network, Interacting Genes & KEGG |
| |
|


| Gene Summary for PANK1 |
| Basic gene info. | Gene symbol | PANK1 |
| Gene name | pantothenate kinase 1 | |
| Synonyms | PANK | |
| Cytomap | UCSC genome browser: 10q23.31 | |
| Genomic location | chr10 :91339253-91403648 | |
| Type of gene | protein-coding | |
| RefGenes | NM_138316.3, NM_148977.2,NM_148978.2, | |
| Ensembl id | ENSG00000152782 | |
| Description | pantothenic acid kinase 1 | |
| Modification date | 20141207 | |
| dbXrefs | MIM : 606160 | |
| HGNC : HGNC | ||
| Ensembl : ENSG00000152782 | ||
| HPRD : 07549 | ||
| Protein | UniProt: go to UniProt's Cross Reference DB Table | |
| Expression | CleanEX: HS_PANK1 | |
| BioGPS: 53354 | ||
| Gene Expression Atlas: ENSG00000152782 | ||
| The Human Protein Atlas: ENSG00000152782 | ||
| Pathway | NCI Pathway Interaction Database: PANK1 | |
| KEGG: PANK1 | ||
| REACTOME: PANK1 | ||
| ConsensusPathDB | ||
| Pathway Commons: PANK1 | ||
| Metabolism | MetaCyc: PANK1 | |
| HUMANCyc: PANK1 | ||
| Regulation | Ensembl's Regulation: ENSG00000152782 | |
| miRBase: chr10 :91,339,253-91,403,648 | ||
| TargetScan: NM_138316 | ||
| cisRED: ENSG00000152782 | ||
| Context | iHOP: PANK1 | |
| cancer metabolism search in PubMed: PANK1 | ||
| UCL Cancer Institute: PANK1 | ||
| Assigned class in ccmGDB | C | |
| Top |
| Phenotypic Information for PANK1(metabolism pathway, cancer, disease, phenome) |
| Cancer | CGAP: PANK1 |
| Familial Cancer Database: PANK1 | |
| * This gene is included in those cancer gene databases. |
|
|
|
|
|
|
| ||||||||||||||||||||||||||||||||||||||||||||||||||||||||||||||||||||||||||||||||||||||||||||||||||||||||||||||||||||||||||||||||||||||||||||||||||||||||||||||||||||||||||||||||||||||||||||||||||||||||||||||||||||||||||||||||||||||||||||||||||||||||||||||||||||||||||||||||||||||||||||||||||||||||||||||||||||
Oncogene 1 | Significant driver gene in | |||||||||||||||||||||||||||||||||||||||||||||||||||||||||||||||||||||||||||||||||||||||||||||||||||||||||||||||||||||||||||||||||||||||||||||||||||||||||||||||||||||||||||||||||||||||||||||||||||||||||||||||||||||||||||||||||||||||||||||||||||||||||||||||||||||||||||||||||||||||||||||||||||||||||||||||||||||||||
| cf) number; DB name 1 Oncogene; http://nar.oxfordjournals.org/content/35/suppl_1/D721.long, 2 Tumor Suppressor gene; https://bioinfo.uth.edu/TSGene/, 3 Cancer Gene Census; http://www.nature.com/nrc/journal/v4/n3/abs/nrc1299.html, 4 CancerGenes; http://nar.oxfordjournals.org/content/35/suppl_1/D721.long, 5 Network of Cancer Gene; http://ncg.kcl.ac.uk/index.php, 1Therapeutic Vulnerabilities in Cancer; http://cbio.mskcc.org/cancergenomics/statius/ |
| REACTOME_METABOLISM_OF_VITAMINS_AND_COFACTORS | |
| OMIM | |
| Orphanet | |
| Disease | KEGG Disease: PANK1 |
| MedGen: PANK1 (Human Medical Genetics with Condition) | |
| ClinVar: PANK1 | |
| Phenotype | MGI: PANK1 (International Mouse Phenotyping Consortium) |
| PhenomicDB: PANK1 | |
| Mutations for PANK1 |
| * Under tables are showing count per each tissue to give us broad intuition about tissue specific mutation patterns.You can go to the detailed page for each mutation database's web site. |
| - Statistics for Tissue and Mutation type | Top |
 |
| - For Inter-chromosomal Variations |
| There's no inter-chromosomal structural variation. |
| - For Intra-chromosomal Variations |
| * Intra-chromosomal variantions includes 'intrachromosomal amplicon to amplicon', 'intrachromosomal amplicon to non-amplified dna', 'intrachromosomal deletion', 'intrachromosomal fold-back inversion', 'intrachromosomal inversion', 'intrachromosomal tandem duplication', 'Intrachromosomal unknown type', 'intrachromosomal with inverted orientation', 'intrachromosomal with non-inverted orientation'. |
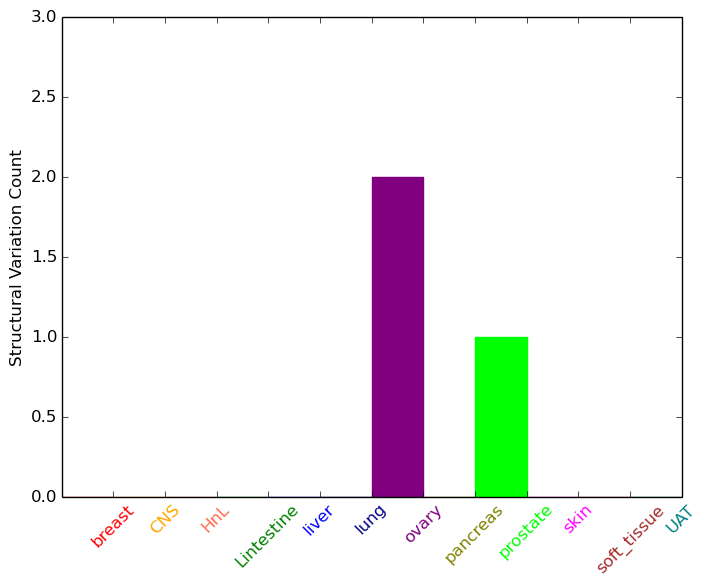 |
| Sample | Symbol_a | Chr_a | Start_a | End_a | Symbol_b | Chr_b | Start_b | End_b |
| ovary | PANK1 | chr10 | 91363208 | 91363228 | chr10 | 90871883 | 90871903 | |
| ovary | PANK1 | chr10 | 91397926 | 91397946 | PANK1 | chr10 | 91376960 | 91376980 |
| prostate | PANK1 | chr10 | 91378441 | 91380441 | chr10 | 93641450 | 93643450 |
| cf) Tissue number; Tissue name (1;Breast, 2;Central_nervous_system, 3;Haematopoietic_and_lymphoid_tissue, 4;Large_intestine, 5;Liver, 6;Lung, 7;Ovary, 8;Pancreas, 9;Prostate, 10;Skin, 11;Soft_tissue, 12;Upper_aerodigestive_tract) |
| * From mRNA Sanger sequences, Chitars2.0 arranged chimeric transcripts. This table shows PANK1 related fusion information. |
| ID | Head Gene | Tail Gene | Accession | Gene_a | qStart_a | qEnd_a | Chromosome_a | tStart_a | tEnd_a | Gene_a | qStart_a | qEnd_a | Chromosome_a | tStart_a | tEnd_a |
| BF825680 | TRDMT1 | 16 | 264 | 10 | 17185783 | 17186032 | PANK1 | 256 | 339 | 10 | 91344093 | 91344176 | |
| BF827370 | TRDMT1 | 22 | 271 | 10 | 17185783 | 17186032 | PANK1 | 263 | 346 | 10 | 91344093 | 91344176 | |
| BF827371 | TRDMT1 | 7 | 256 | 10 | 17185783 | 17186032 | PANK1 | 248 | 331 | 10 | 91344093 | 91344176 | |
| BF827381 | TRDMT1 | 14 | 259 | 10 | 17185783 | 17186032 | PANK1 | 251 | 334 | 10 | 91344093 | 91344176 | |
| BF827382 | TRDMT1 | 3 | 252 | 10 | 17185783 | 17186032 | PANK1 | 244 | 327 | 10 | 91344093 | 91344176 | |
| Top |
| Mutation type/ Tissue ID | brca | cns | cerv | endome | haematopo | kidn | Lintest | liver | lung | ns | ovary | pancre | prost | skin | stoma | thyro | urina | |||
| Total # sample | 1 | 1 | 1 | 1 | ||||||||||||||||
| GAIN (# sample) | ||||||||||||||||||||
| LOSS (# sample) | 1 | 1 | 1 | 1 |
| cf) Tissue ID; Tissue type (1; Breast, 2; Central_nervous_system, 3; Cervix, 4; Endometrium, 5; Haematopoietic_and_lymphoid_tissue, 6; Kidney, 7; Large_intestine, 8; Liver, 9; Lung, 10; NS, 11; Ovary, 12; Pancreas, 13; Prostate, 14; Skin, 15; Stomach, 16; Thyroid, 17; Urinary_tract) |
| Top |
|
 |
| Top |
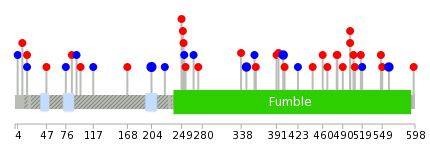
| Stat. for Non-Synonymous SNVs (# total SNVs=18) | (# total SNVs=14) |
 |  |
(# total SNVs=3) | (# total SNVs=1) |
 |  |
| Top |
| * When you move the cursor on each content, you can see more deailed mutation information on the Tooltip. Those are primary_site,primary_histology,mutation(aa),pubmedID. |
| GRCh37 position | Mutation(aa) | Unique sampleID count |
| chr10:91359120-91359120 | p.K400fs*23 | 3 |
| chr10:91404448-91404448 | p.L204L | 3 |
| chr10:91359116-91359116 | p.P401P | 2 |
| chr10:91348469-91348469 | p.L559L | 2 |
| chr10:91371471-91371471 | p.F346F | 2 |
| chr10:91371688-91371688 | p.R274Q | 1 |
| chr10:91353048-91353048 | p.R506Q | 1 |
| chr10:91404709-91404709 | p.E117E | 1 |
| chr10:91371708-91371708 | p.V267V | 1 |
| chr10:91353062-91353062 | p.M501I | 1 |
| Top |
|
 |
| Point Mutation/ Tissue ID | 1 | 2 | 3 | 4 | 5 | 6 | 7 | 8 | 9 | 10 | 11 | 12 | 13 | 14 | 15 | 16 | 17 | 18 | 19 | 20 |
| # sample | 2 | 1 | 1 | 4 | 2 | 2 | 5 | 2 | 1 | 3 | 2 | 4 | ||||||||
| # mutation | 2 | 1 | 1 | 4 | 2 | 2 | 5 | 2 | 1 | 3 | 2 | 5 | ||||||||
| nonsynonymous SNV | 2 | 1 | 1 | 3 | 1 | 3 | 1 | 1 | 2 | 2 | 3 | |||||||||
| synonymous SNV | 1 | 2 | 1 | 2 | 1 | 1 | 2 |
| cf) Tissue ID; Tissue type (1; BLCA[Bladder Urothelial Carcinoma], 2; BRCA[Breast invasive carcinoma], 3; CESC[Cervical squamous cell carcinoma and endocervical adenocarcinoma], 4; COAD[Colon adenocarcinoma], 5; GBM[Glioblastoma multiforme], 6; Glioma Low Grade, 7; HNSC[Head and Neck squamous cell carcinoma], 8; KICH[Kidney Chromophobe], 9; KIRC[Kidney renal clear cell carcinoma], 10; KIRP[Kidney renal papillary cell carcinoma], 11; LAML[Acute Myeloid Leukemia], 12; LUAD[Lung adenocarcinoma], 13; LUSC[Lung squamous cell carcinoma], 14; OV[Ovarian serous cystadenocarcinoma ], 15; PAAD[Pancreatic adenocarcinoma], 16; PRAD[Prostate adenocarcinoma], 17; SKCM[Skin Cutaneous Melanoma], 18:STAD[Stomach adenocarcinoma], 19:THCA[Thyroid carcinoma], 20:UCEC[Uterine Corpus Endometrial Carcinoma]) |
| Top |
| * We represented just top 10 SNVs. When you move the cursor on each content, you can see more deailed mutation information on the Tooltip. Those are primary_site, primary_histology, mutation(aa), pubmedID. |
| Genomic Position | Mutation(aa) | Unique sampleID count |
| chr10:91371471 | p.L275L,PANK1 | 2 |
| chr10:91348469 | p.F121F,PANK1 | 2 |
| chr10:91405006 | p.D482N,PANK1 | 1 |
| chr10:91353063 | p.A98V | 1 |
| chr10:91353589 | p.G481E,PANK1 | 1 |
| chr10:91371496 | p.G85E | 1 |
| chr10:91353613 | p.L474L,PANK1 | 1 |
| chr10:91371688 | p.A70A | 1 |
| chr10:91353615 | p.D467N,PANK1 | 1 |
| chr10:91371750 | p.A18A | 1 |
| * Copy number data were extracted from TCGA using R package TCGA-Assembler. The URLs of all public data files on TCGA DCC data server were gathered on Jan-05-2015. Function ProcessCNAData in TCGA-Assembler package was used to obtain gene-level copy number value which is calculated as the average copy number of the genomic region of a gene. |
 |
| cf) Tissue ID[Tissue type]: BLCA[Bladder Urothelial Carcinoma], BRCA[Breast invasive carcinoma], CESC[Cervical squamous cell carcinoma and endocervical adenocarcinoma], COAD[Colon adenocarcinoma], GBM[Glioblastoma multiforme], Glioma Low Grade, HNSC[Head and Neck squamous cell carcinoma], KICH[Kidney Chromophobe], KIRC[Kidney renal clear cell carcinoma], KIRP[Kidney renal papillary cell carcinoma], LAML[Acute Myeloid Leukemia], LUAD[Lung adenocarcinoma], LUSC[Lung squamous cell carcinoma], OV[Ovarian serous cystadenocarcinoma ], PAAD[Pancreatic adenocarcinoma], PRAD[Prostate adenocarcinoma], SKCM[Skin Cutaneous Melanoma], STAD[Stomach adenocarcinoma], THCA[Thyroid carcinoma], UCEC[Uterine Corpus Endometrial Carcinoma] |
| Top |
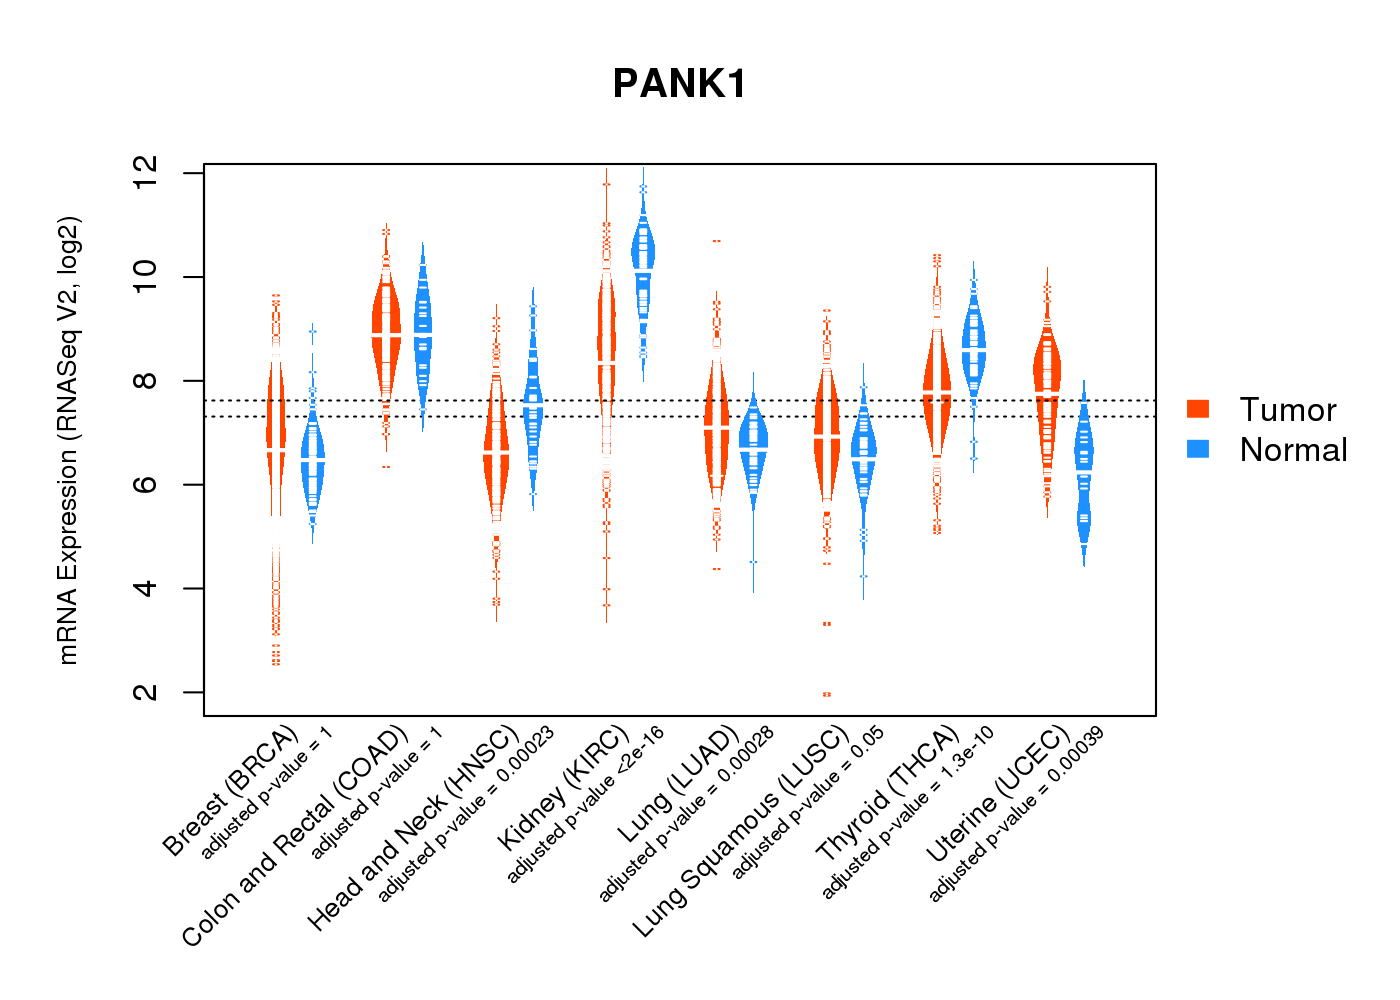
| Gene Expression for PANK1 |
| * CCLE gene expression data were extracted from CCLE_Expression_Entrez_2012-10-18.res: Gene-centric RMA-normalized mRNA expression data. |
 |
| * Normalized gene expression data of RNASeqV2 was extracted from TCGA using R package TCGA-Assembler. The URLs of all public data files on TCGA DCC data server were gathered at Jan-05-2015. Only eight cancer types have enough normal control samples for differential expression analysis. (t test, adjusted p<0.05 (using Benjamini-Hochberg FDR)) |
 |
| Top |
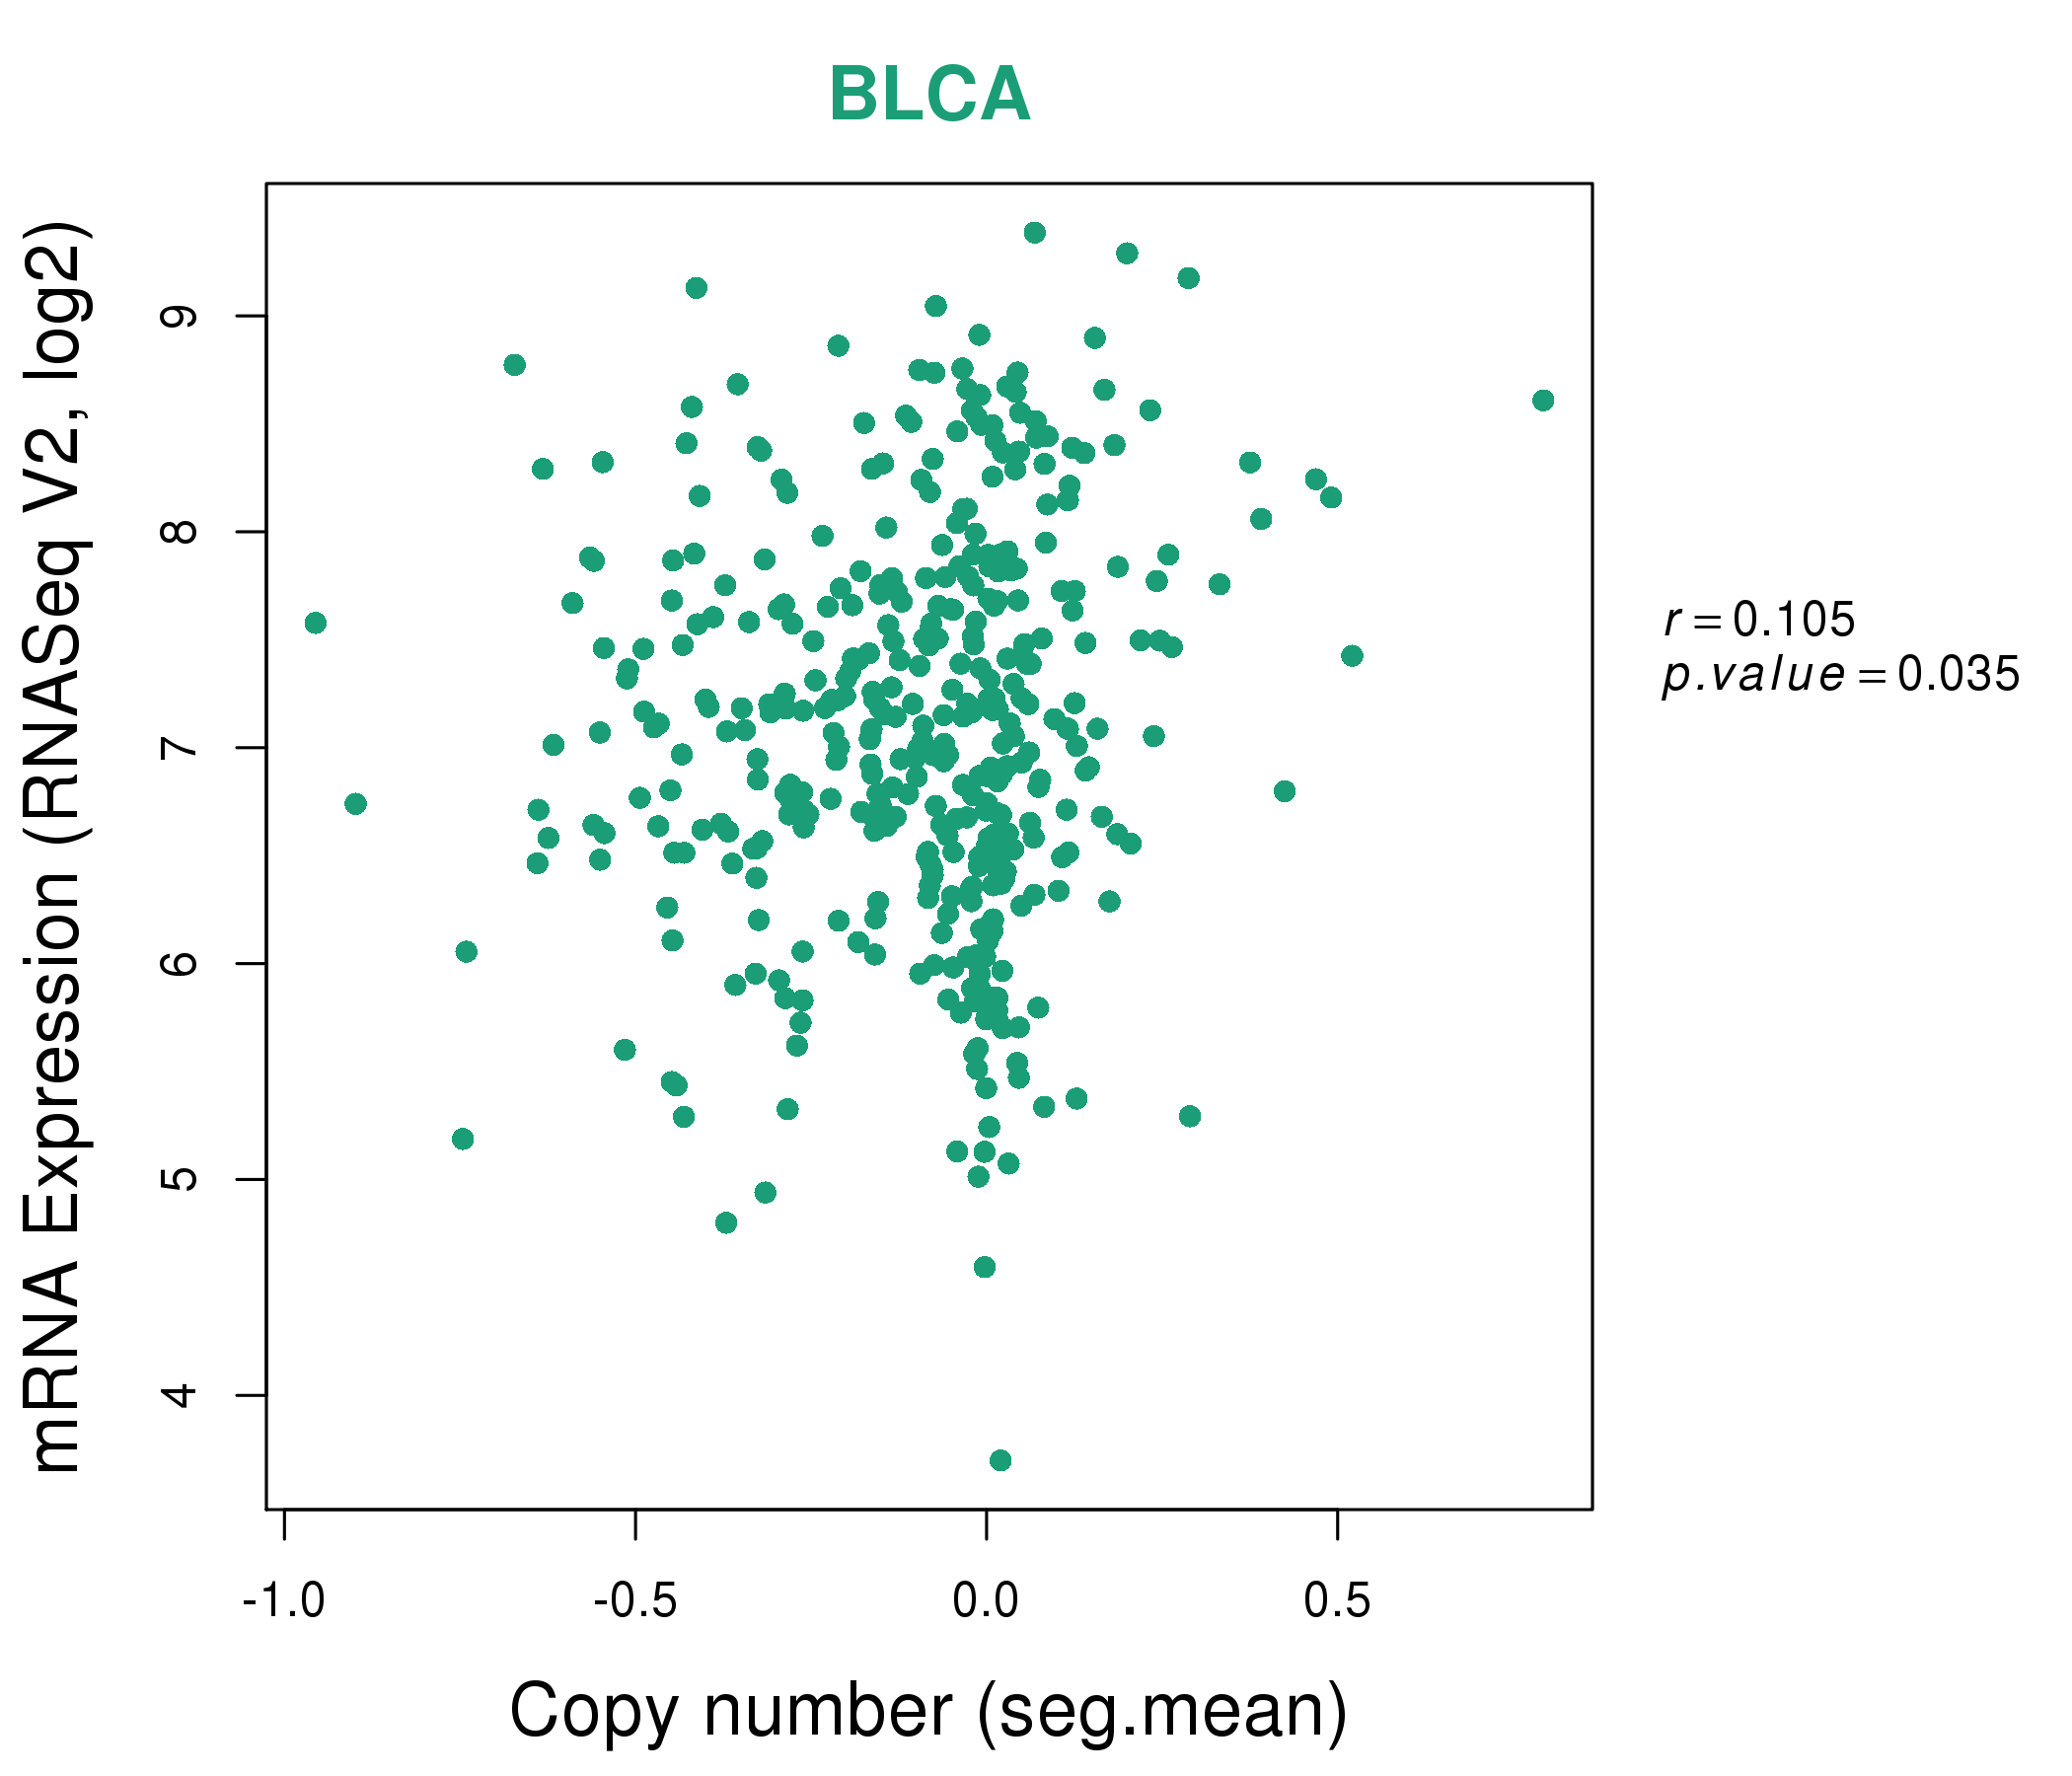
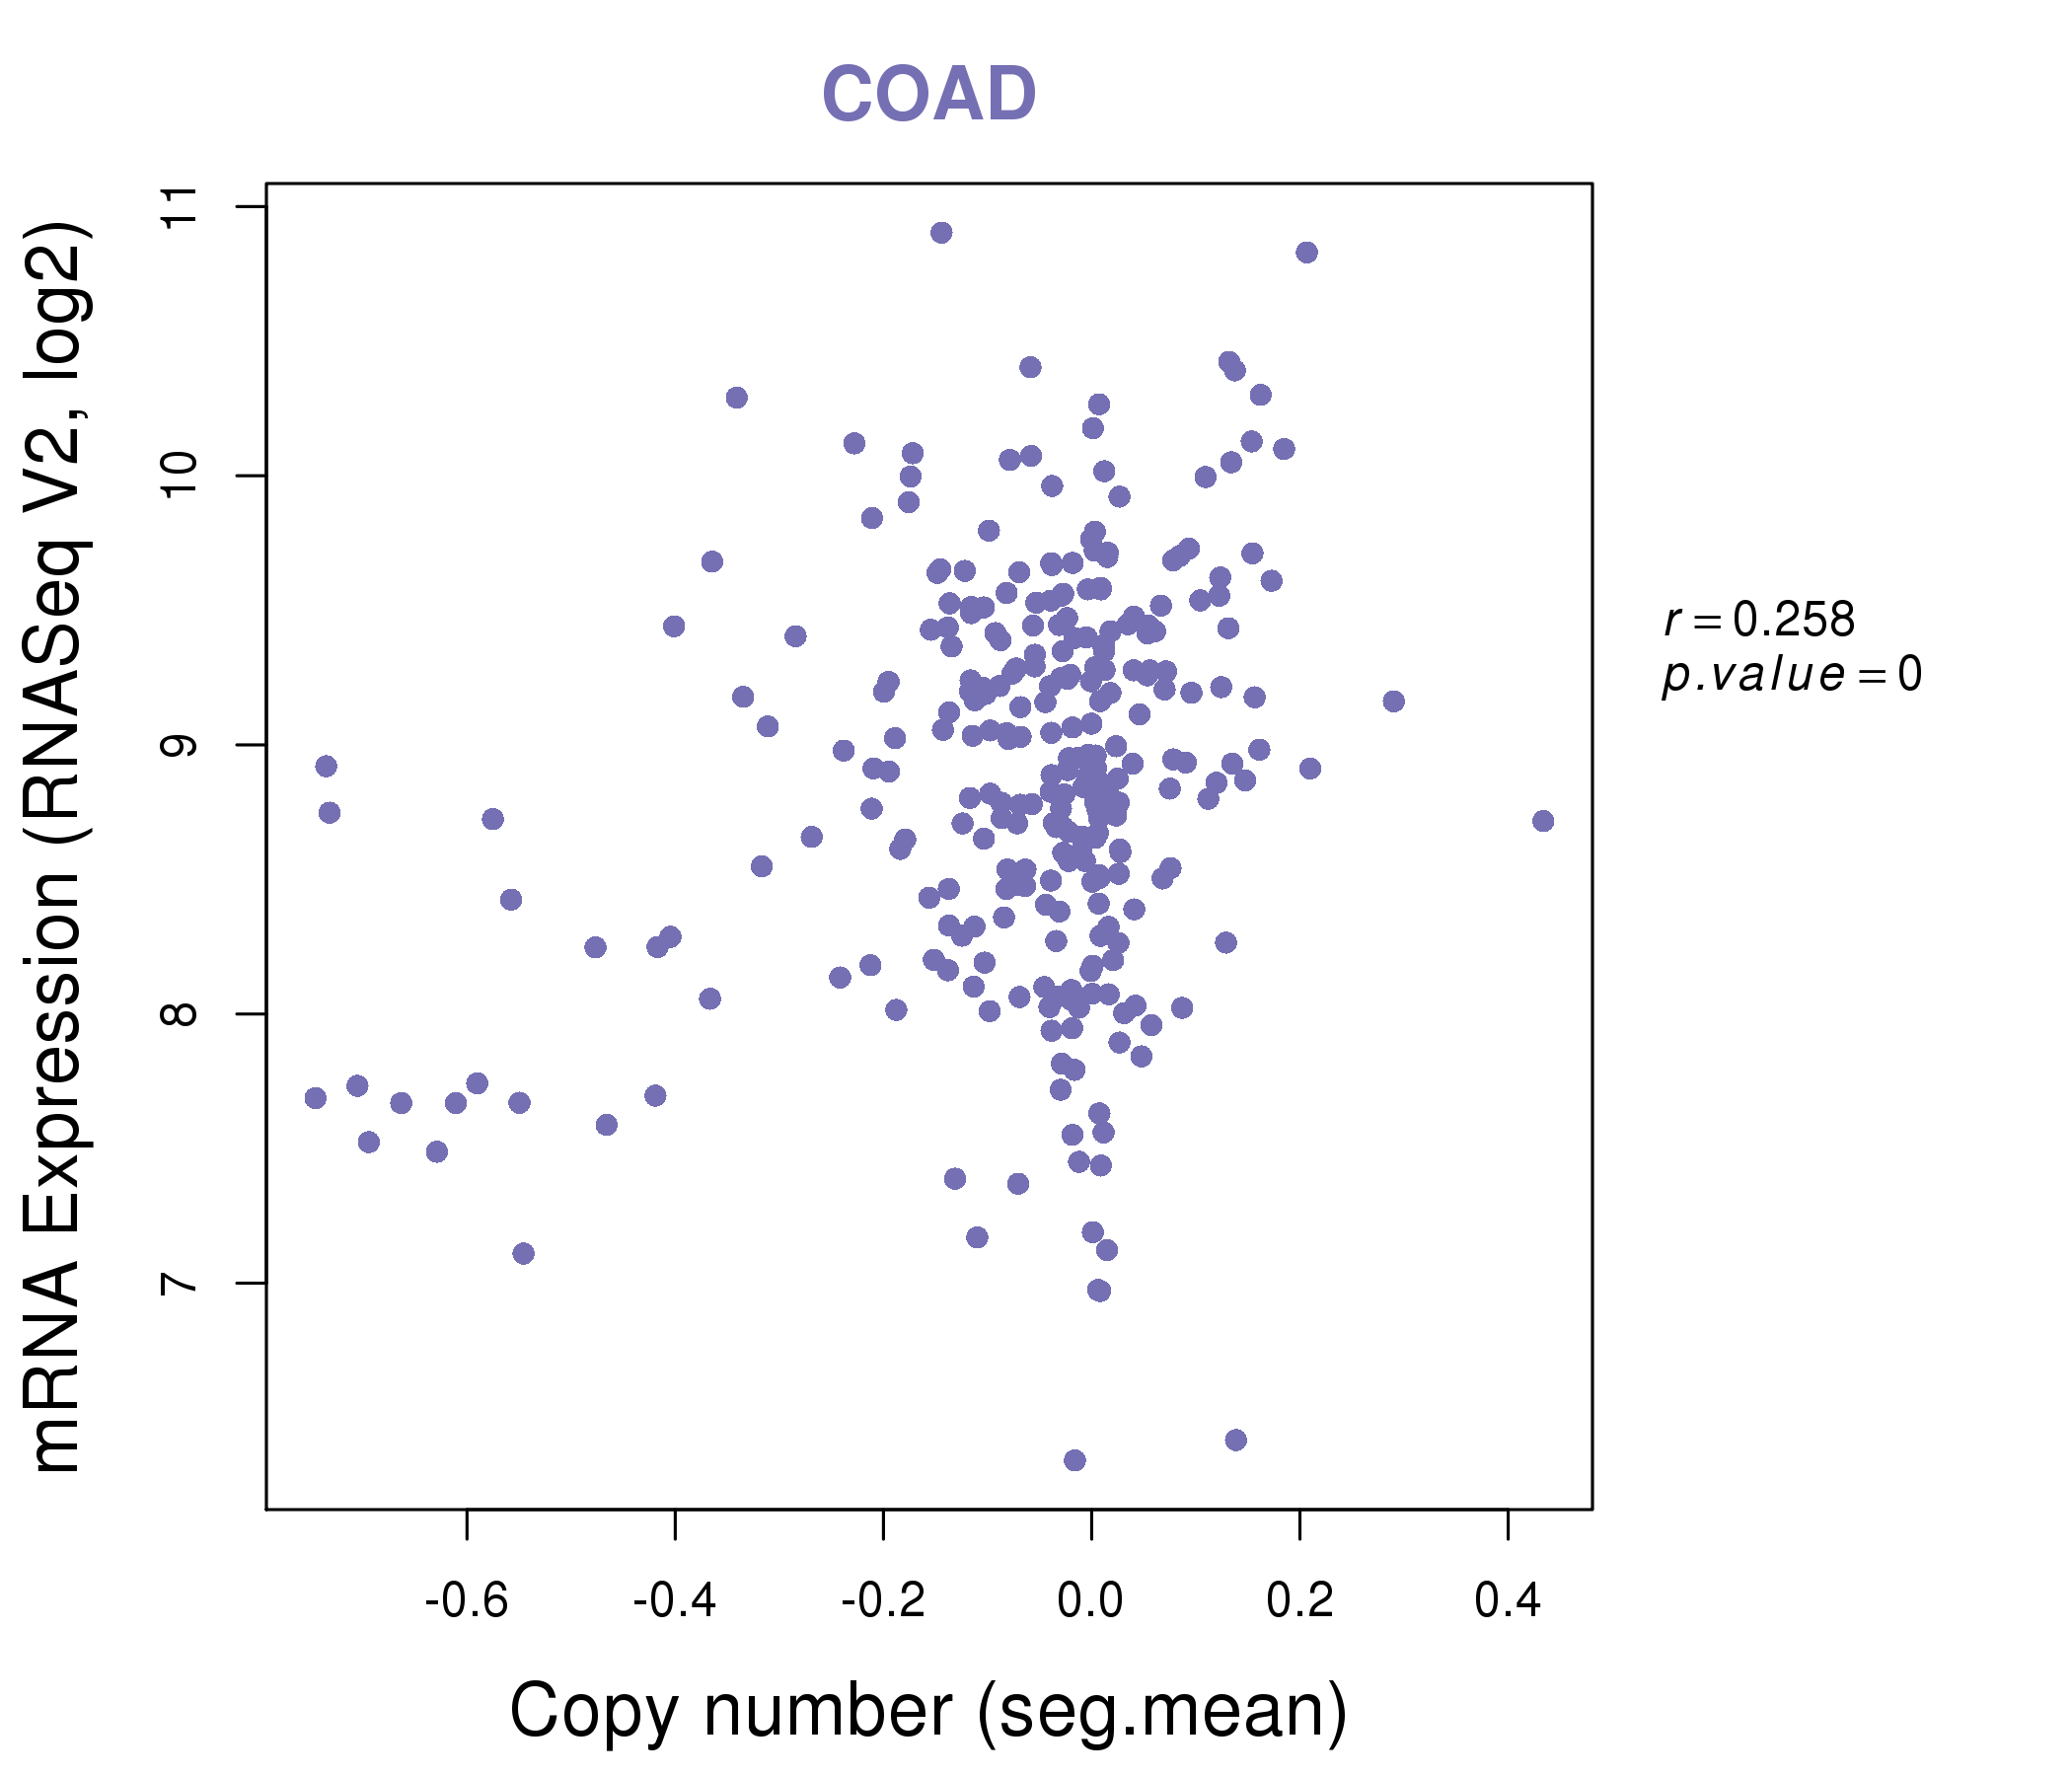
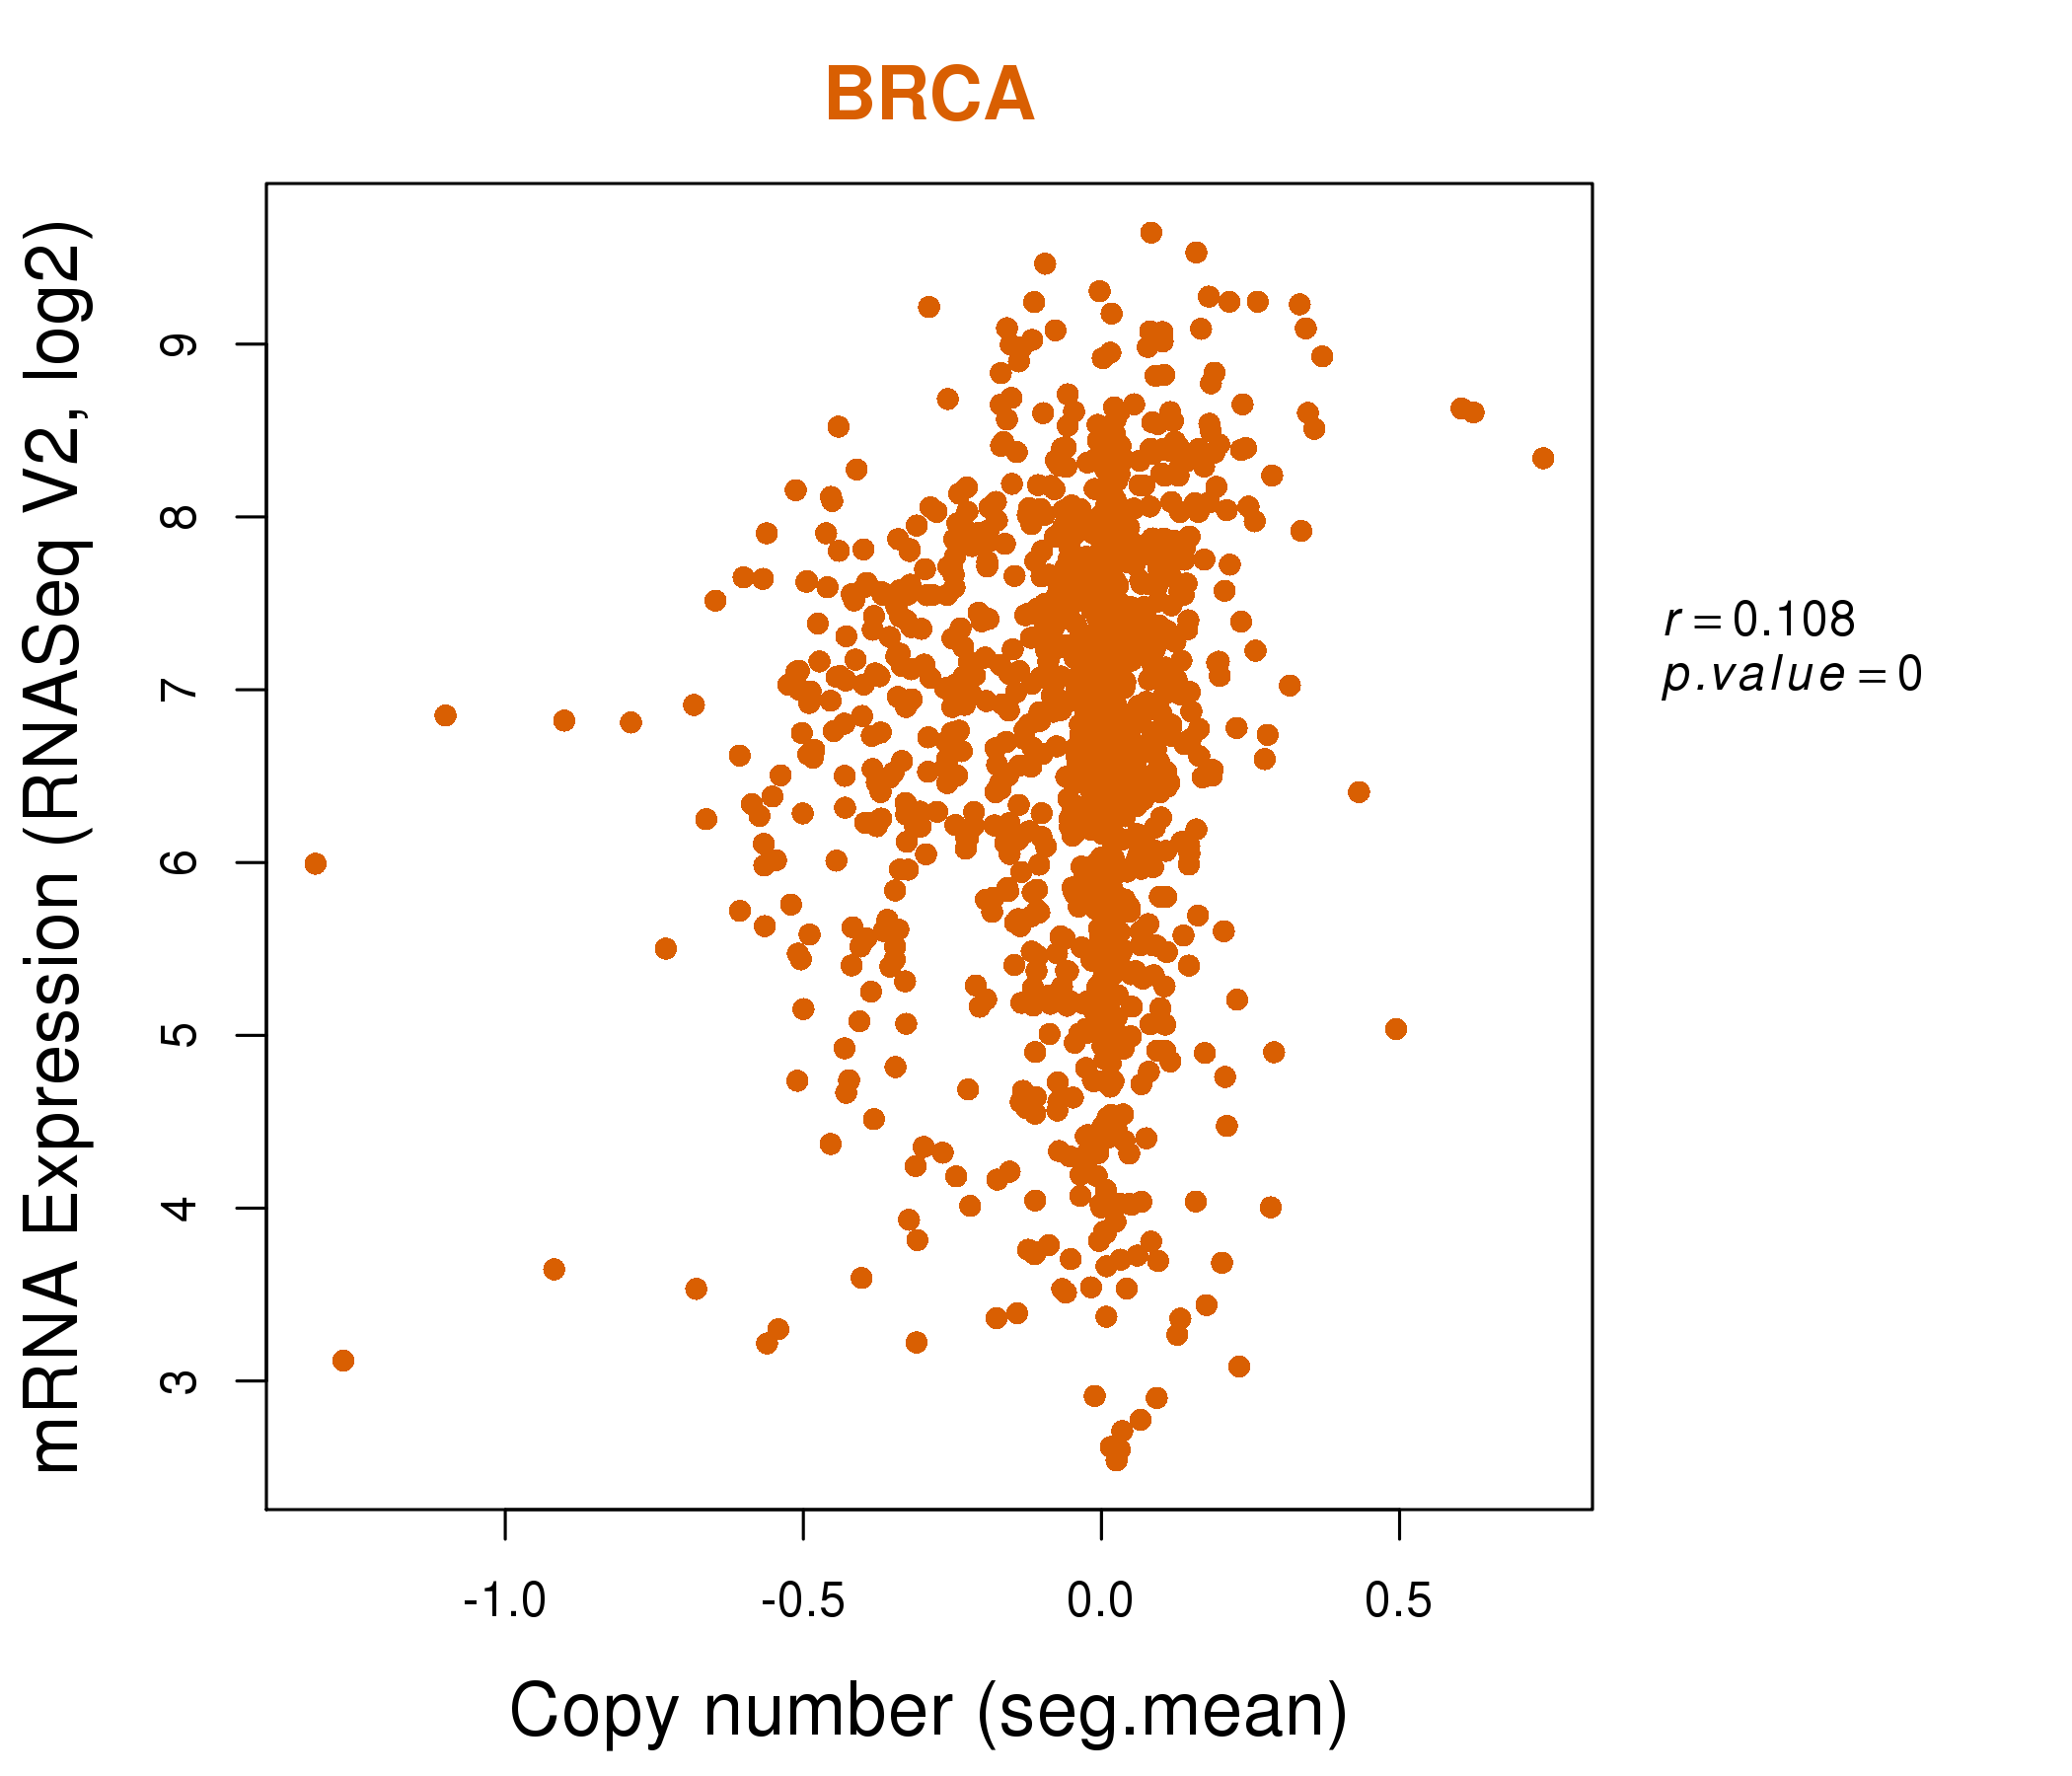
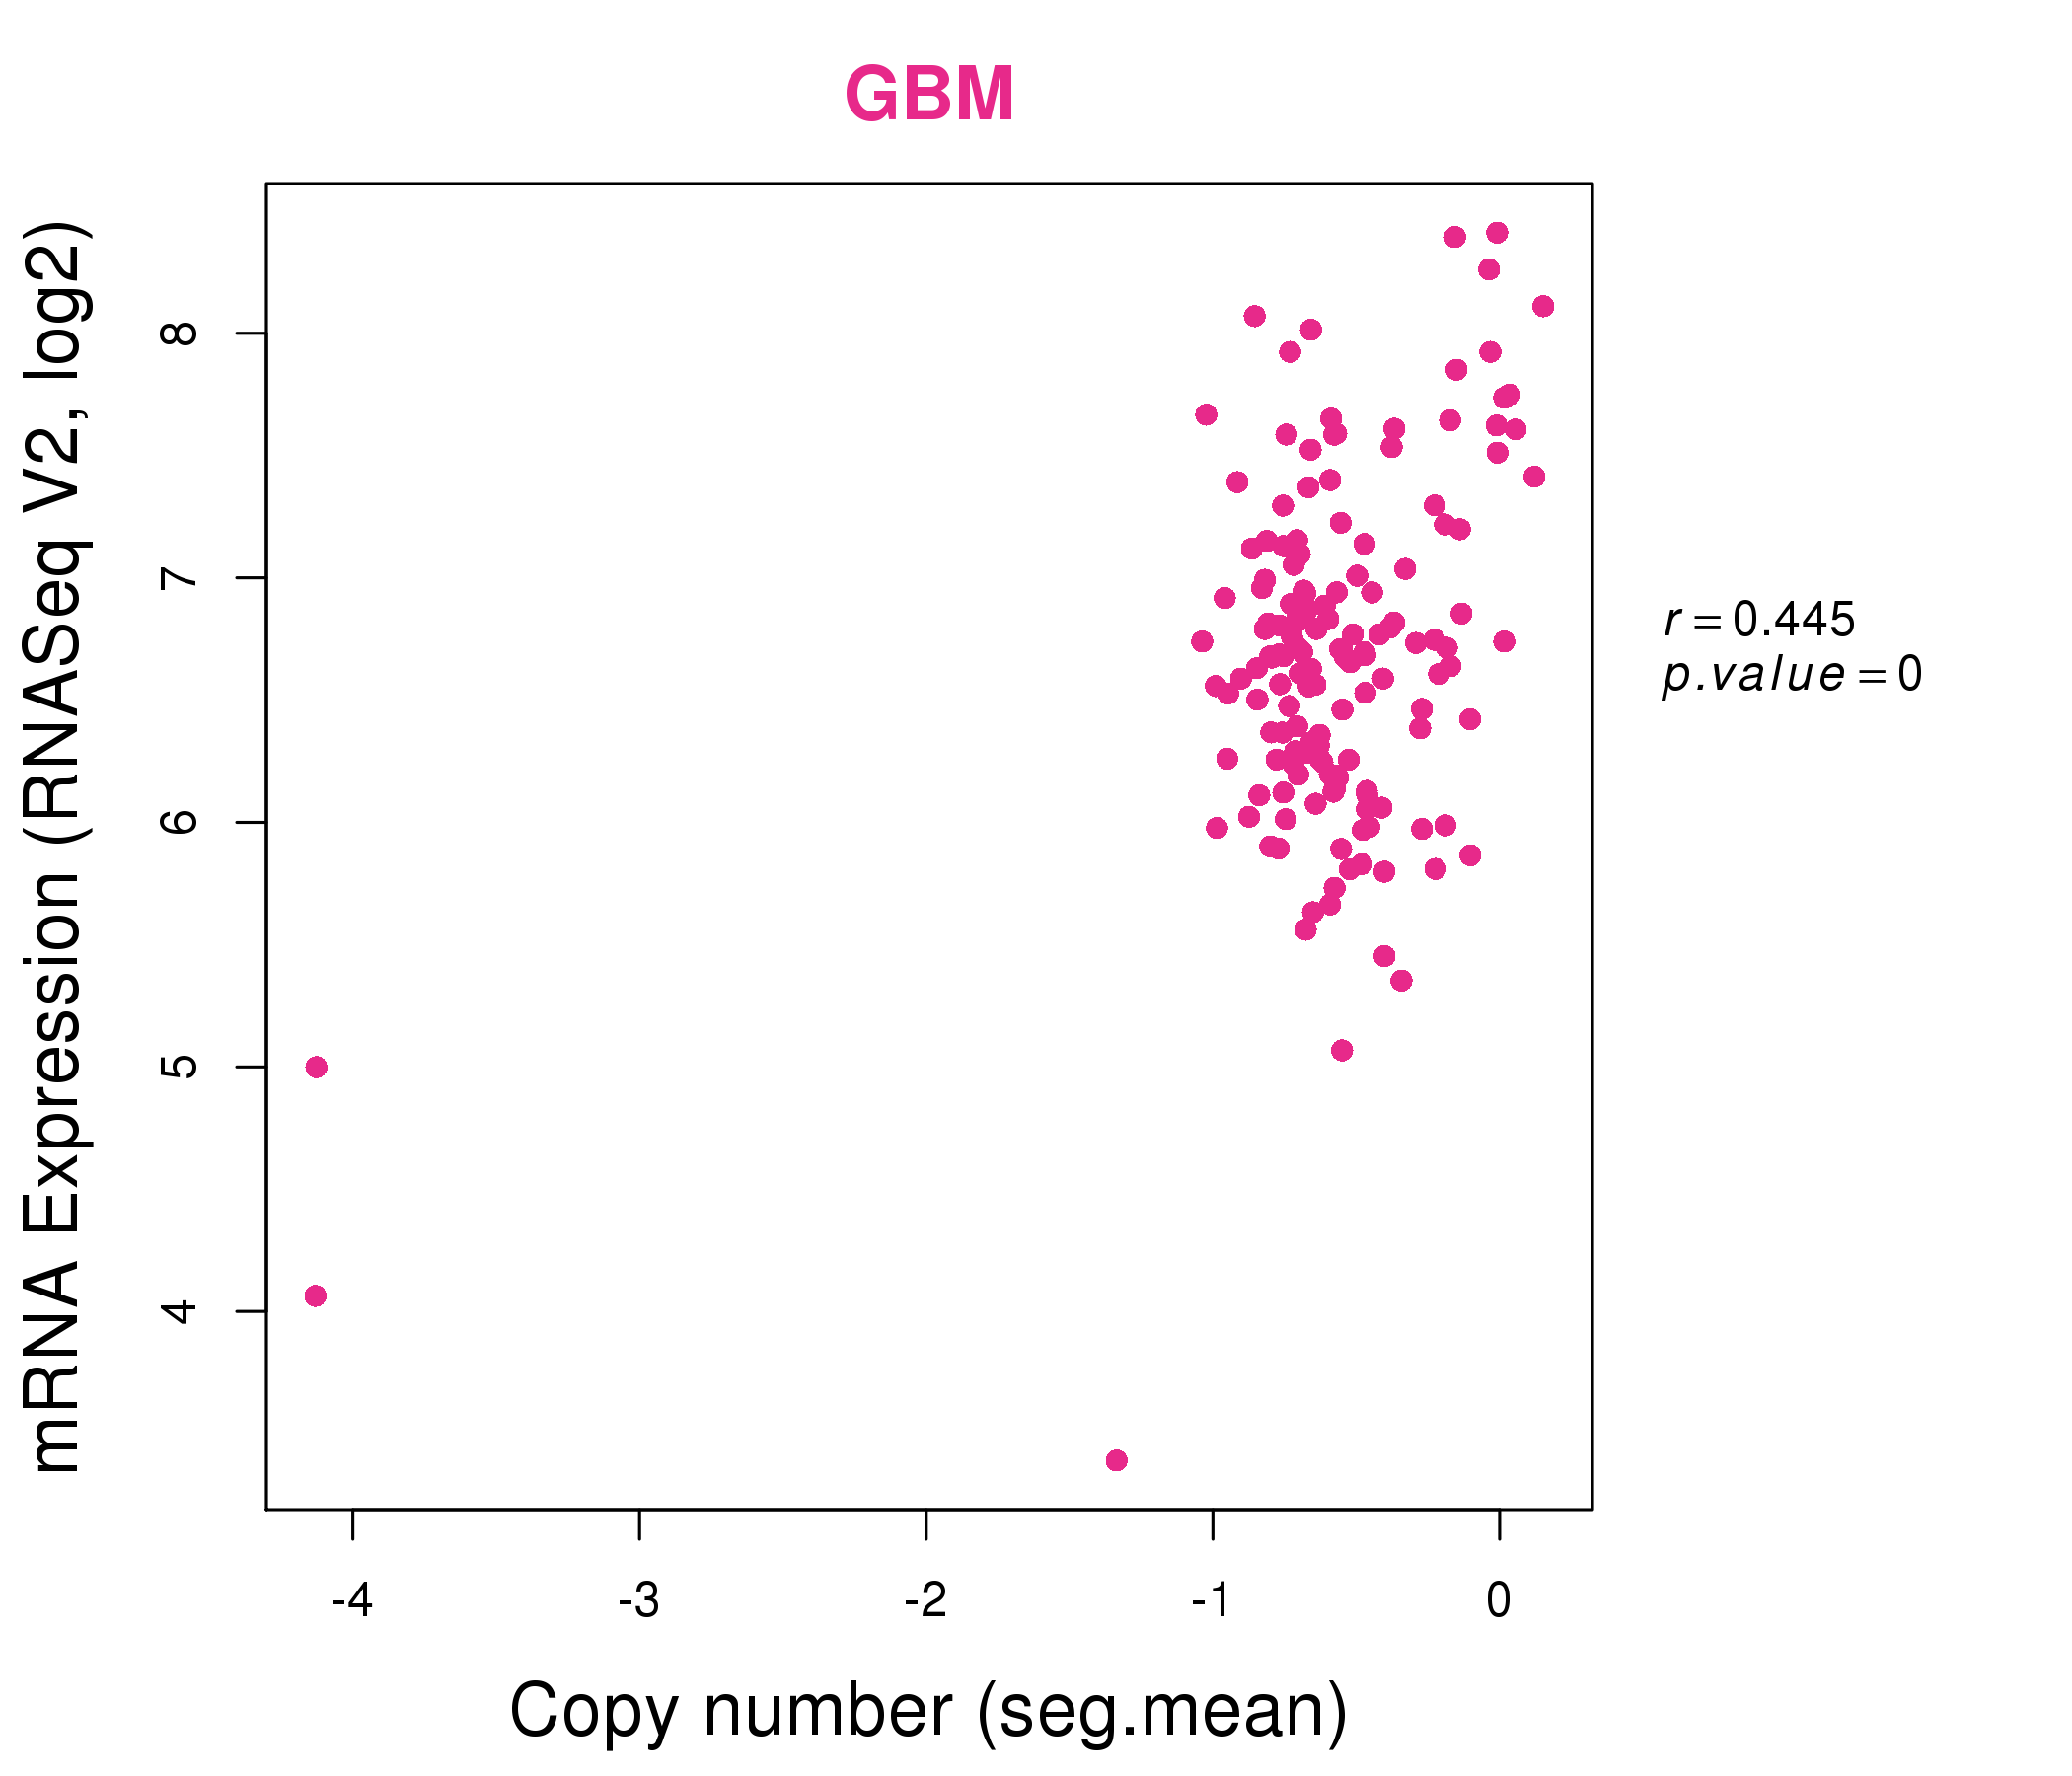
| * This plots show the correlation between CNV and gene expression. |
: Open all plots for all cancer types
 |
|
 |
|
| Top |
| Gene-Gene Network Information |
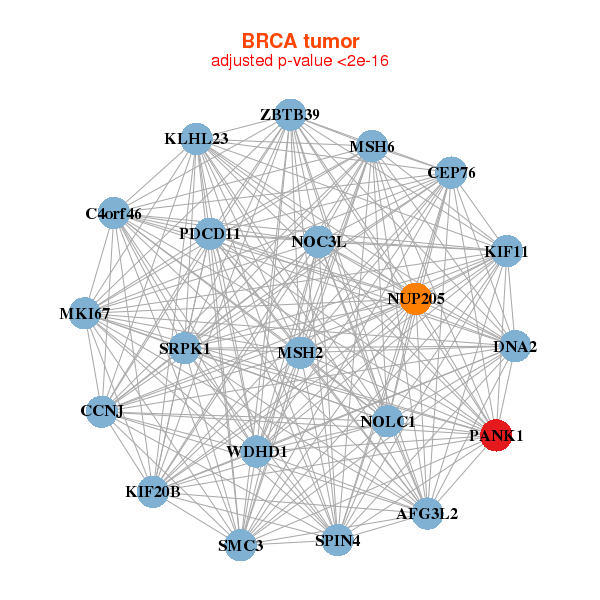
| * Co-Expression network figures were drawn using R package igraph. Only the top 20 genes with the highest correlations were shown. Red circle: input gene, orange circle: cell metabolism gene, sky circle: other gene |
: Open all plots for all cancer types
 |
|
| AFG3L2,C4orf46,CCNJ,CEP76,DNA2,KIF11,KIF20B, KLHL23,MKI67,MSH2,MSH6,NOC3L,NOLC1,NUP205, PANK1,PDCD11,SMC3,SPIN4,SRPK1,WDHD1,ZBTB39 | FAM210A,CEP85,CPEB3,CUL4A,DTNA,FREM2,GFM2, GRSF1,GUF1,IPO7,KIF1B,NPEPPS,PADI2,PANK1, PCBD2,PHKB,PPARGC1A,SIX4,UBE2G1,USP38,XPO4 |
 |
|
| A1CF,ATE1,AVL9,DDC,DNMBP,EIF4EBP2,ENTPD5, EPB41L4B,MPP7,NAPEPLD,PANK1,PARG,PLAGL2,PRKAR2A, ROCK2,SEMA5A,SLC26A2,STOX1,TACC2,UGT2A3,ZNRF2 | ACVR1B,ADCY6,CAPN5,CDC42BPG,DENND1C,DNM2,GPRIN2, IL17RE,IRF6,ITPKA,LSR,OAF,PANK1,SHROOM1, SLC26A6,SPATA2,SPIRE2,TMUB2,UCK2,USP54,VIPR1 |


| * Co-Expression network figures were drawn using R package igraph. Only the top 20 genes with the highest correlations were shown. Red circle: input gene, orange circle: cell metabolism gene, sky circle: other gene |
: Open all plots for all cancer types
| Top |
: Open all interacting genes' information including KEGG pathway for all interacting genes from DAVID
| Top |
| Pharmacological Information for PANK1 |
| There's no related Drug. |
| Top |
| Cross referenced IDs for PANK1 |
| * We obtained these cross-references from Uniprot database. It covers 150 different DBs, 18 categories. http://www.uniprot.org/help/cross_references_section |
: Open all cross reference information
|
Copyright © 2016-Present - The Univsersity of Texas Health Science Center at Houston @ |