|
||||||||||||||||||||||||||||||||||||||||||||||||||||||||||||||||||||||||||||||||||||||||||||||||||||||||||||||||||||||||||||||||||||||||||||||||||||||||||||||||||||||||||||||||||||||||||||||||||||||||||||||||||||||||||||||||||||||||||||||||||||||||||||||||||||||||||||||||||||||||||||||||||||||||||||||||||||||||||
| |
| Phenotypic Information (metabolism pathway, cancer, disease, phenome) |
| |
| |
| Gene-Gene Network Information: Co-Expression Network, Interacting Genes & KEGG |
| |
|


| Gene Summary for PLCG2 |
| Basic gene info. | Gene symbol | PLCG2 |
| Gene name | phospholipase C, gamma 2 (phosphatidylinositol-specific) | |
| Synonyms | APLAID|FCAS3|PLC-IV|PLC-gamma-2 | |
| Cytomap | UCSC genome browser: 16q24.1 | |
| Genomic location | chr16 :81812898-81991899 | |
| Type of gene | protein-coding | |
| RefGenes | NM_002661.4, | |
| Ensembl id | ENSG00000197943 | |
| Description | 1-phosphatidylinositol 4,5-bisphosphate phosphodiesterase gamma-2phosphoinositide phospholipase C-gamma-2phospholipase C-IV | |
| Modification date | 20141207 | |
| dbXrefs | MIM : 600220 | |
| HGNC : HGNC | ||
| Ensembl : ENSG00000197943 | ||
| Ensembl : ENSG00000261218 | ||
| HPRD : 02570 | ||
| Protein | UniProt: P16885 go to UniProt's Cross Reference DB Table | |
| Expression | CleanEX: HS_PLCG2 | |
| BioGPS: 5336 | ||
| Gene Expression Atlas: ENSG00000197943 | ||
| The Human Protein Atlas: ENSG00000197943 | ||
| Pathway | NCI Pathway Interaction Database: PLCG2 | |
| KEGG: PLCG2 | ||
| REACTOME: PLCG2 | ||
| ConsensusPathDB | ||
| Pathway Commons: PLCG2 | ||
| Metabolism | MetaCyc: PLCG2 | |
| HUMANCyc: PLCG2 | ||
| Regulation | Ensembl's Regulation: ENSG00000197943 | |
| miRBase: chr16 :81,812,898-81,991,899 | ||
| TargetScan: NM_002661 | ||
| cisRED: ENSG00000197943 | ||
| Context | iHOP: PLCG2 | |
| cancer metabolism search in PubMed: PLCG2 | ||
| UCL Cancer Institute: PLCG2 | ||
| Assigned class in ccmGDB | B - This gene belongs to cancer gene. | |
| Top |
| Phenotypic Information for PLCG2(metabolism pathway, cancer, disease, phenome) |
| Cancer | CGAP: PLCG2 |
| Familial Cancer Database: PLCG2 | |
| * This gene is included in those cancer gene databases. |
|
|
|
|
|
| . | ||||||||||||||||||||||||||||||||||||||||||||||||||||||||||||||||||||||||||||||||||||||||||||||||||||||||||||||||||||||||||||||||||||||||||||||||||||||||||||||||||||||||||||||||||||||||||||||||||||||||||||||||||||||||||||||||||||||||||||||||||||||||||||||||||||||||||||||||||||||||||||||||||||||||||||||||||||
Oncogene 1 | Significant driver gene in | |||||||||||||||||||||||||||||||||||||||||||||||||||||||||||||||||||||||||||||||||||||||||||||||||||||||||||||||||||||||||||||||||||||||||||||||||||||||||||||||||||||||||||||||||||||||||||||||||||||||||||||||||||||||||||||||||||||||||||||||||||||||||||||||||||||||||||||||||||||||||||||||||||||||||||||||||||||||||
| cf) number; DB name 1 Oncogene; http://nar.oxfordjournals.org/content/35/suppl_1/D721.long, 2 Tumor Suppressor gene; https://bioinfo.uth.edu/TSGene/, 3 Cancer Gene Census; http://www.nature.com/nrc/journal/v4/n3/abs/nrc1299.html, 4 CancerGenes; http://nar.oxfordjournals.org/content/35/suppl_1/D721.long, 5 Network of Cancer Gene; http://ncg.kcl.ac.uk/index.php, 1Therapeutic Vulnerabilities in Cancer; http://cbio.mskcc.org/cancergenomics/statius/ |
| KEGG_INOSITOL_PHOSPHATE_METABOLISM KEGG_FC_GAMMA_R_MEDIATED_PHAGOCYTOSIS | |
| OMIM | 600220; gene. 614468; phenotype. 614878; phenotype. |
| Orphanet | 300359; PLCG2-associated antibody deficiency and immune dysregulation. 324530; Autoinflammation and PLCG2-associated antibody deficiency and immune dysregulation. |
| Disease | KEGG Disease: PLCG2 |
| MedGen: PLCG2 (Human Medical Genetics with Condition) | |
| ClinVar: PLCG2 | |
| Phenotype | MGI: PLCG2 (International Mouse Phenotyping Consortium) |
| PhenomicDB: PLCG2 | |
| Mutations for PLCG2 |
| * Under tables are showing count per each tissue to give us broad intuition about tissue specific mutation patterns.You can go to the detailed page for each mutation database's web site. |
| - Statistics for Tissue and Mutation type | Top |
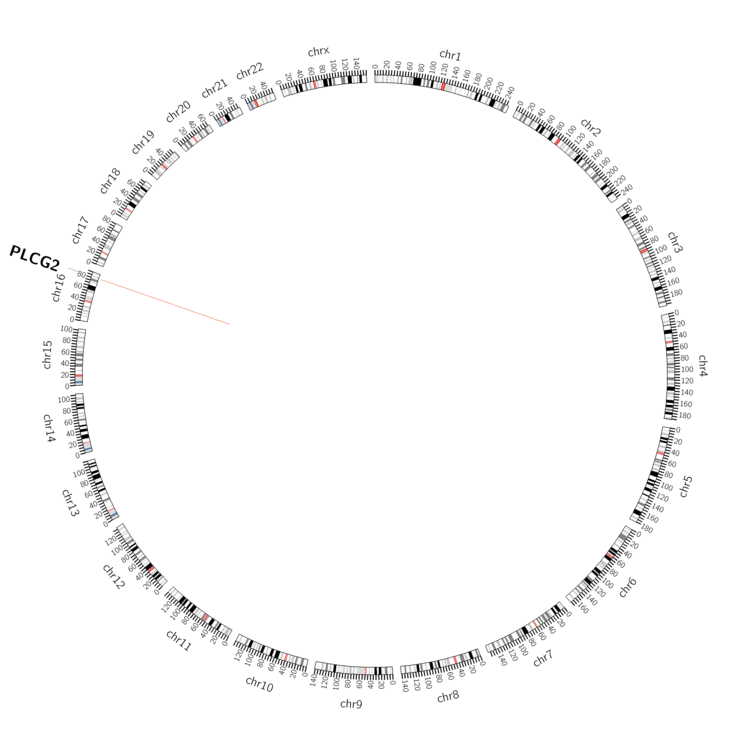 |
| - For Inter-chromosomal Variations |
| There's no inter-chromosomal structural variation. |
| - For Intra-chromosomal Variations |
| * Intra-chromosomal variantions includes 'intrachromosomal amplicon to amplicon', 'intrachromosomal amplicon to non-amplified dna', 'intrachromosomal deletion', 'intrachromosomal fold-back inversion', 'intrachromosomal inversion', 'intrachromosomal tandem duplication', 'Intrachromosomal unknown type', 'intrachromosomal with inverted orientation', 'intrachromosomal with non-inverted orientation'. |
 |
| Sample | Symbol_a | Chr_a | Start_a | End_a | Symbol_b | Chr_b | Start_b | End_b |
| ovary | PLCG2 | chr16 | 81934762 | 81934782 | PLCG2 | chr16 | 81940434 | 81940454 |
| cf) Tissue number; Tissue name (1;Breast, 2;Central_nervous_system, 3;Haematopoietic_and_lymphoid_tissue, 4;Large_intestine, 5;Liver, 6;Lung, 7;Ovary, 8;Pancreas, 9;Prostate, 10;Skin, 11;Soft_tissue, 12;Upper_aerodigestive_tract) |
| * From mRNA Sanger sequences, Chitars2.0 arranged chimeric transcripts. This table shows PLCG2 related fusion information. |
| ID | Head Gene | Tail Gene | Accession | Gene_a | qStart_a | qEnd_a | Chromosome_a | tStart_a | tEnd_a | Gene_a | qStart_a | qEnd_a | Chromosome_a | tStart_a | tEnd_a |
| Top |
| Mutation type/ Tissue ID | brca | cns | cerv | endome | haematopo | kidn | Lintest | liver | lung | ns | ovary | pancre | prost | skin | stoma | thyro | urina | |||
| Total # sample | 2 | 1 | 1 | |||||||||||||||||
| GAIN (# sample) | 1 | |||||||||||||||||||
| LOSS (# sample) | 2 | 1 |
| cf) Tissue ID; Tissue type (1; Breast, 2; Central_nervous_system, 3; Cervix, 4; Endometrium, 5; Haematopoietic_and_lymphoid_tissue, 6; Kidney, 7; Large_intestine, 8; Liver, 9; Lung, 10; NS, 11; Ovary, 12; Pancreas, 13; Prostate, 14; Skin, 15; Stomach, 16; Thyroid, 17; Urinary_tract) |
| Top |
|
 |
| Top |
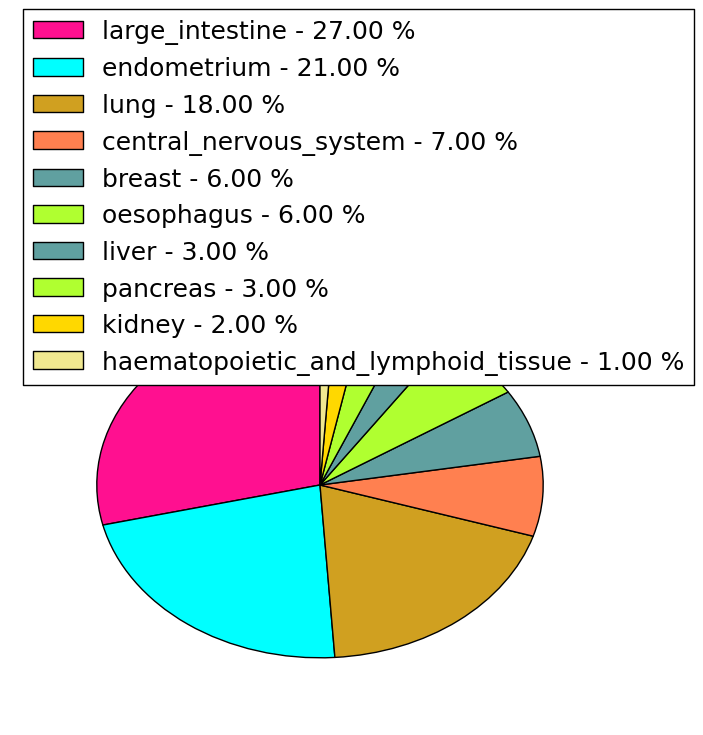
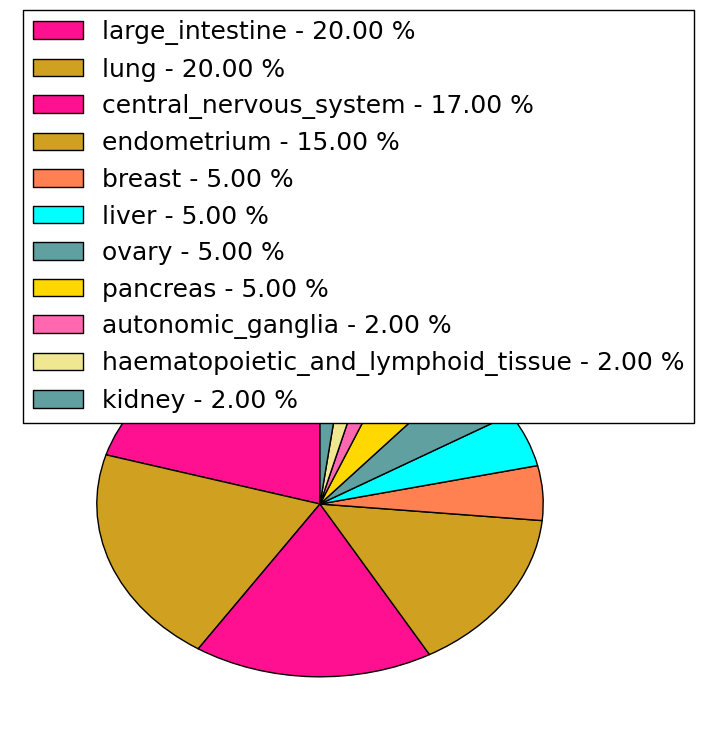
| Stat. for Non-Synonymous SNVs (# total SNVs=130) | (# total SNVs=40) |
 |  |
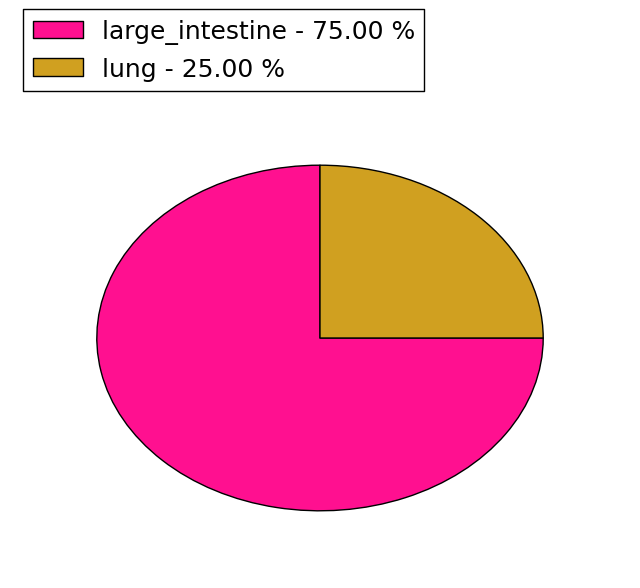
(# total SNVs=4) | (# total SNVs=1) |
 |  |
| Top |
| * When you move the cursor on each content, you can see more deailed mutation information on the Tooltip. Those are primary_site,primary_histology,mutation(aa),pubmedID. |
| GRCh37 position | Mutation(aa) | Unique sampleID count |
| chr16:81934316-81934316 | p.T431T | 4 |
| chr16:81944272-81944272 | p.F627F | 3 |
| chr16:81902829-81902829 | p.R164* | 3 |
| chr16:81968079-81968079 | p.E929K | 3 |
| chr16:81942093-81942093 | p.E544K | 3 |
| chr16:81934352-81934352 | p.S443S | 3 |
| chr16:81929430-81929430 | p.P364H | 2 |
| chr16:81888096-81888096 | p.D81Y | 2 |
| chr16:81904518-81904518 | p.L209H | 2 |
| chr16:81969848-81969848 | p.D973N | 2 |
| Top |
|
 |
| Point Mutation/ Tissue ID | 1 | 2 | 3 | 4 | 5 | 6 | 7 | 8 | 9 | 10 | 11 | 12 | 13 | 14 | 15 | 16 | 17 | 18 | 19 | 20 |
| # sample | 4 | 4 | 3 | 18 | 7 | 6 | 2 | 2 | 12 | 6 | 2 | 2 | 24 | 14 | 1 | 23 | ||||
| # mutation | 4 | 4 | 3 | 20 | 7 | 6 | 2 | 2 | 13 | 7 | 2 | 2 | 36 | 17 | 1 | 35 | ||||
| nonsynonymous SNV | 2 | 3 | 3 | 15 | 3 | 3 | 1 | 2 | 9 | 6 | 1 | 1 | 21 | 10 | 1 | 27 | ||||
| synonymous SNV | 2 | 1 | 5 | 4 | 3 | 1 | 4 | 1 | 1 | 1 | 15 | 7 | 8 |
| cf) Tissue ID; Tissue type (1; BLCA[Bladder Urothelial Carcinoma], 2; BRCA[Breast invasive carcinoma], 3; CESC[Cervical squamous cell carcinoma and endocervical adenocarcinoma], 4; COAD[Colon adenocarcinoma], 5; GBM[Glioblastoma multiforme], 6; Glioma Low Grade, 7; HNSC[Head and Neck squamous cell carcinoma], 8; KICH[Kidney Chromophobe], 9; KIRC[Kidney renal clear cell carcinoma], 10; KIRP[Kidney renal papillary cell carcinoma], 11; LAML[Acute Myeloid Leukemia], 12; LUAD[Lung adenocarcinoma], 13; LUSC[Lung squamous cell carcinoma], 14; OV[Ovarian serous cystadenocarcinoma ], 15; PAAD[Pancreatic adenocarcinoma], 16; PRAD[Prostate adenocarcinoma], 17; SKCM[Skin Cutaneous Melanoma], 18:STAD[Stomach adenocarcinoma], 19:THCA[Thyroid carcinoma], 20:UCEC[Uterine Corpus Endometrial Carcinoma]) |
| Top |
| * We represented just top 10 SNVs. When you move the cursor on each content, you can see more deailed mutation information on the Tooltip. Those are primary_site, primary_histology, mutation(aa), pubmedID. |
| Genomic Position | Mutation(aa) | Unique sampleID count |
| chr16:81944272 | p.T431T | 3 |
| chr16:81934316 | p.E929K | 3 |
| chr16:81968079 | p.F627F | 3 |
| chr16:81942093 | p.S443S | 2 |
| chr16:81972454 | p.D81N | 2 |
| chr16:81969848 | p.D973N | 2 |
| chr16:81941355 | p.S338S | 2 |
| chr16:81888096 | p.Q511H | 2 |
| chr16:81927341 | p.P1083S | 2 |
| chr16:81819622 | p.L10I | 2 |
| * Copy number data were extracted from TCGA using R package TCGA-Assembler. The URLs of all public data files on TCGA DCC data server were gathered on Jan-05-2015. Function ProcessCNAData in TCGA-Assembler package was used to obtain gene-level copy number value which is calculated as the average copy number of the genomic region of a gene. |
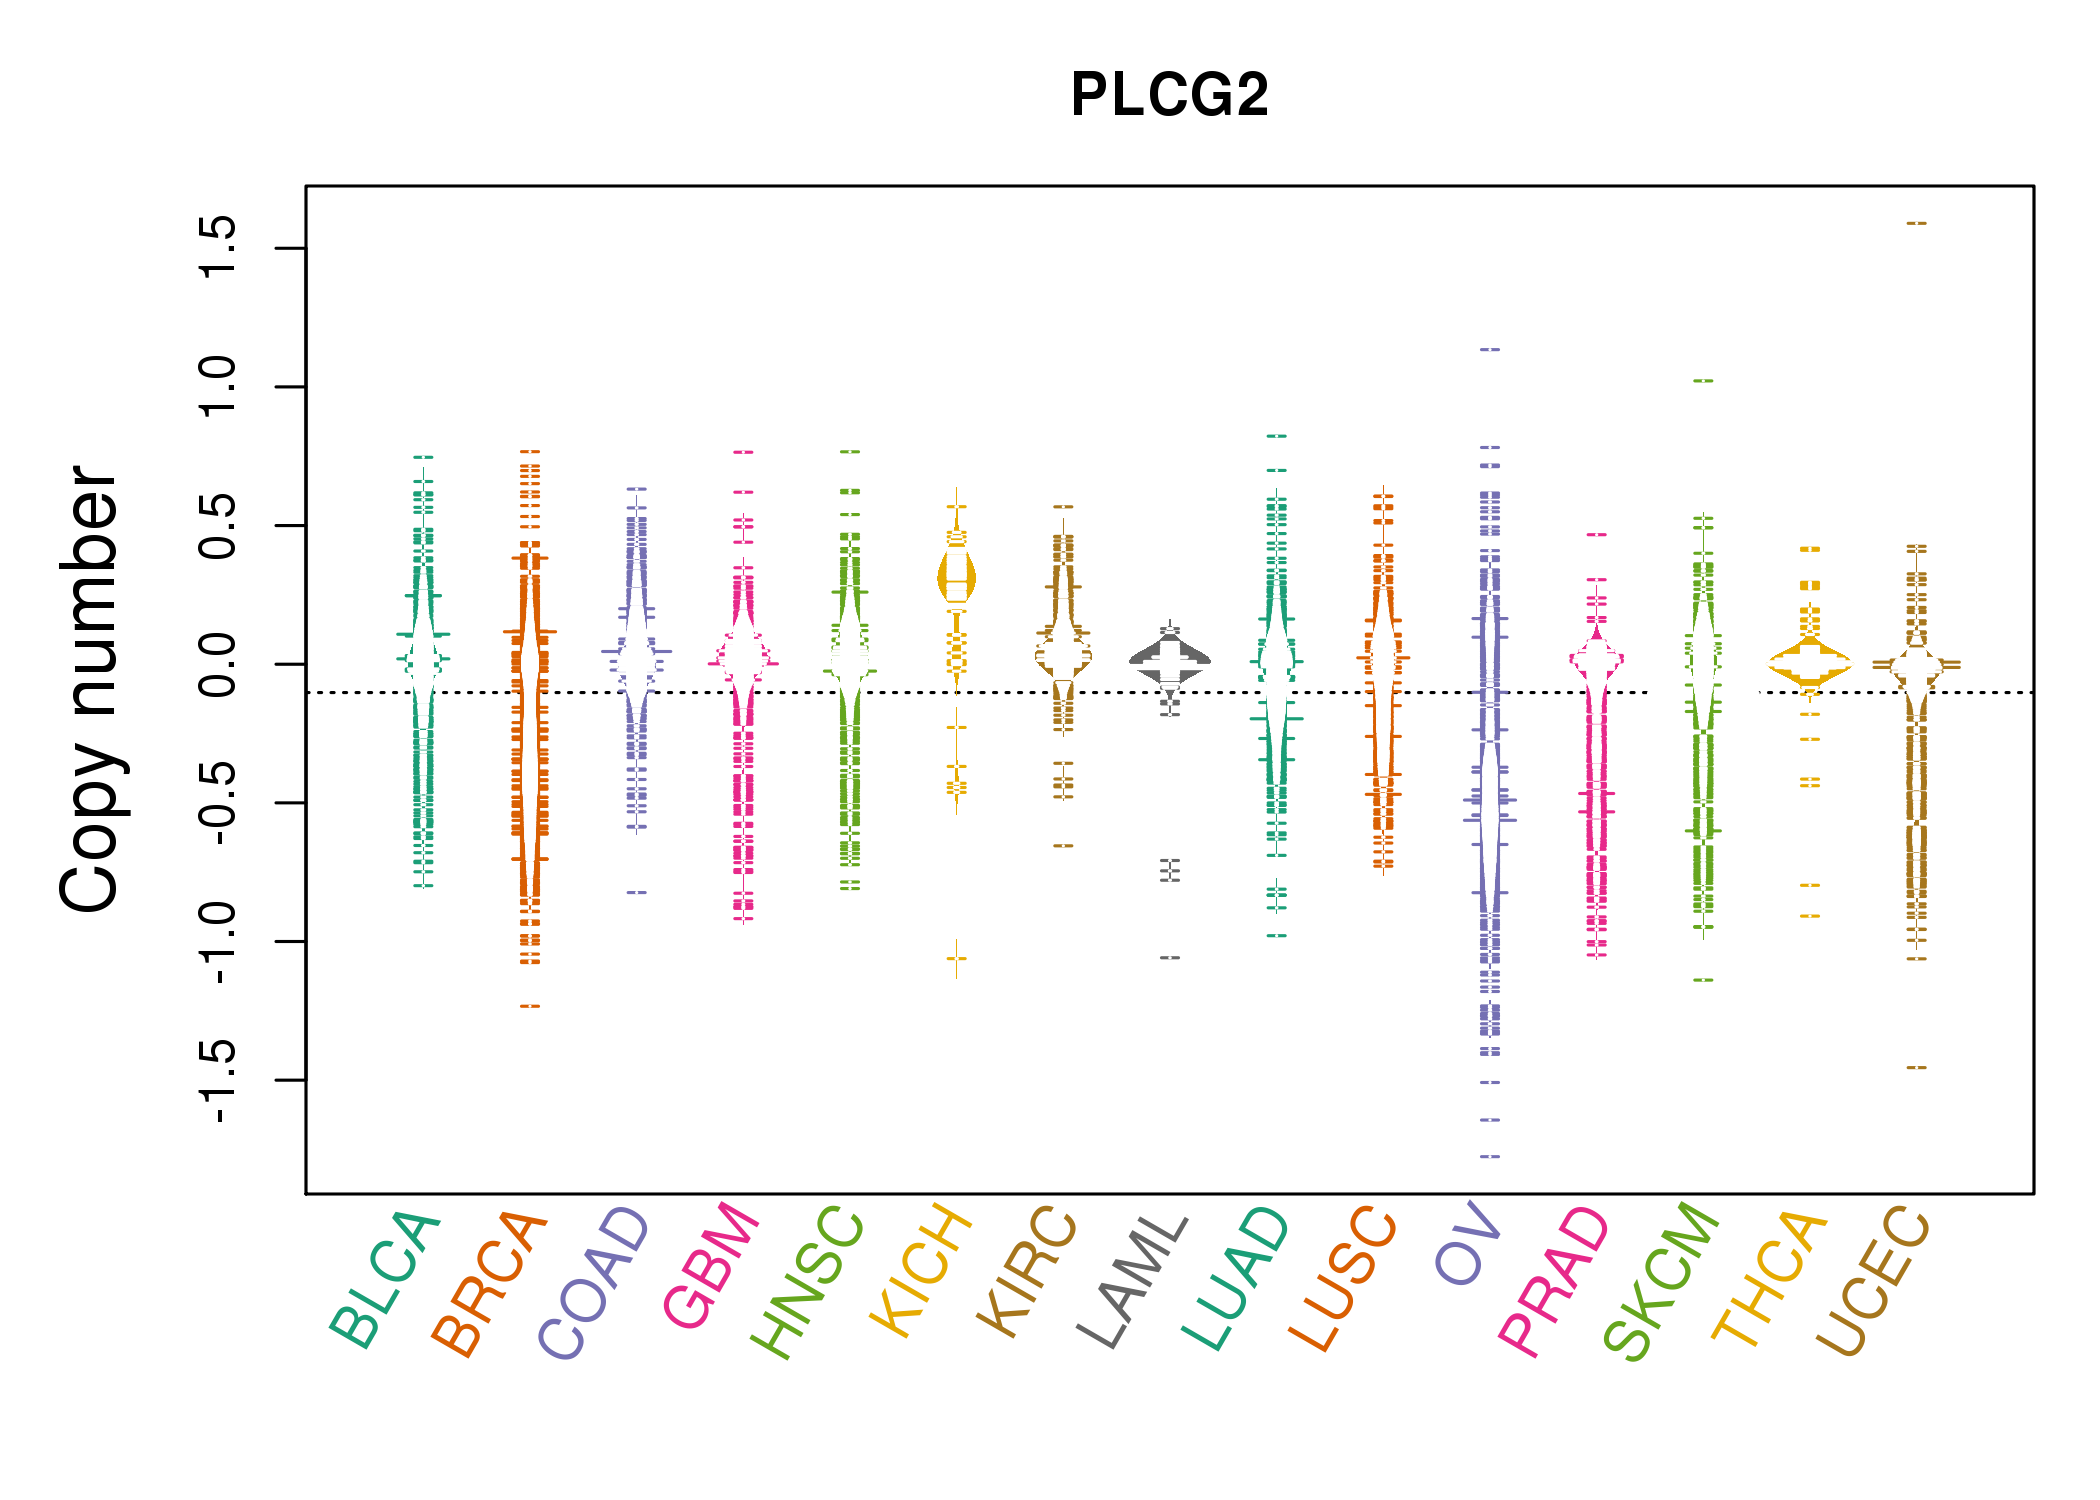 |
| cf) Tissue ID[Tissue type]: BLCA[Bladder Urothelial Carcinoma], BRCA[Breast invasive carcinoma], CESC[Cervical squamous cell carcinoma and endocervical adenocarcinoma], COAD[Colon adenocarcinoma], GBM[Glioblastoma multiforme], Glioma Low Grade, HNSC[Head and Neck squamous cell carcinoma], KICH[Kidney Chromophobe], KIRC[Kidney renal clear cell carcinoma], KIRP[Kidney renal papillary cell carcinoma], LAML[Acute Myeloid Leukemia], LUAD[Lung adenocarcinoma], LUSC[Lung squamous cell carcinoma], OV[Ovarian serous cystadenocarcinoma ], PAAD[Pancreatic adenocarcinoma], PRAD[Prostate adenocarcinoma], SKCM[Skin Cutaneous Melanoma], STAD[Stomach adenocarcinoma], THCA[Thyroid carcinoma], UCEC[Uterine Corpus Endometrial Carcinoma] |
| Top |
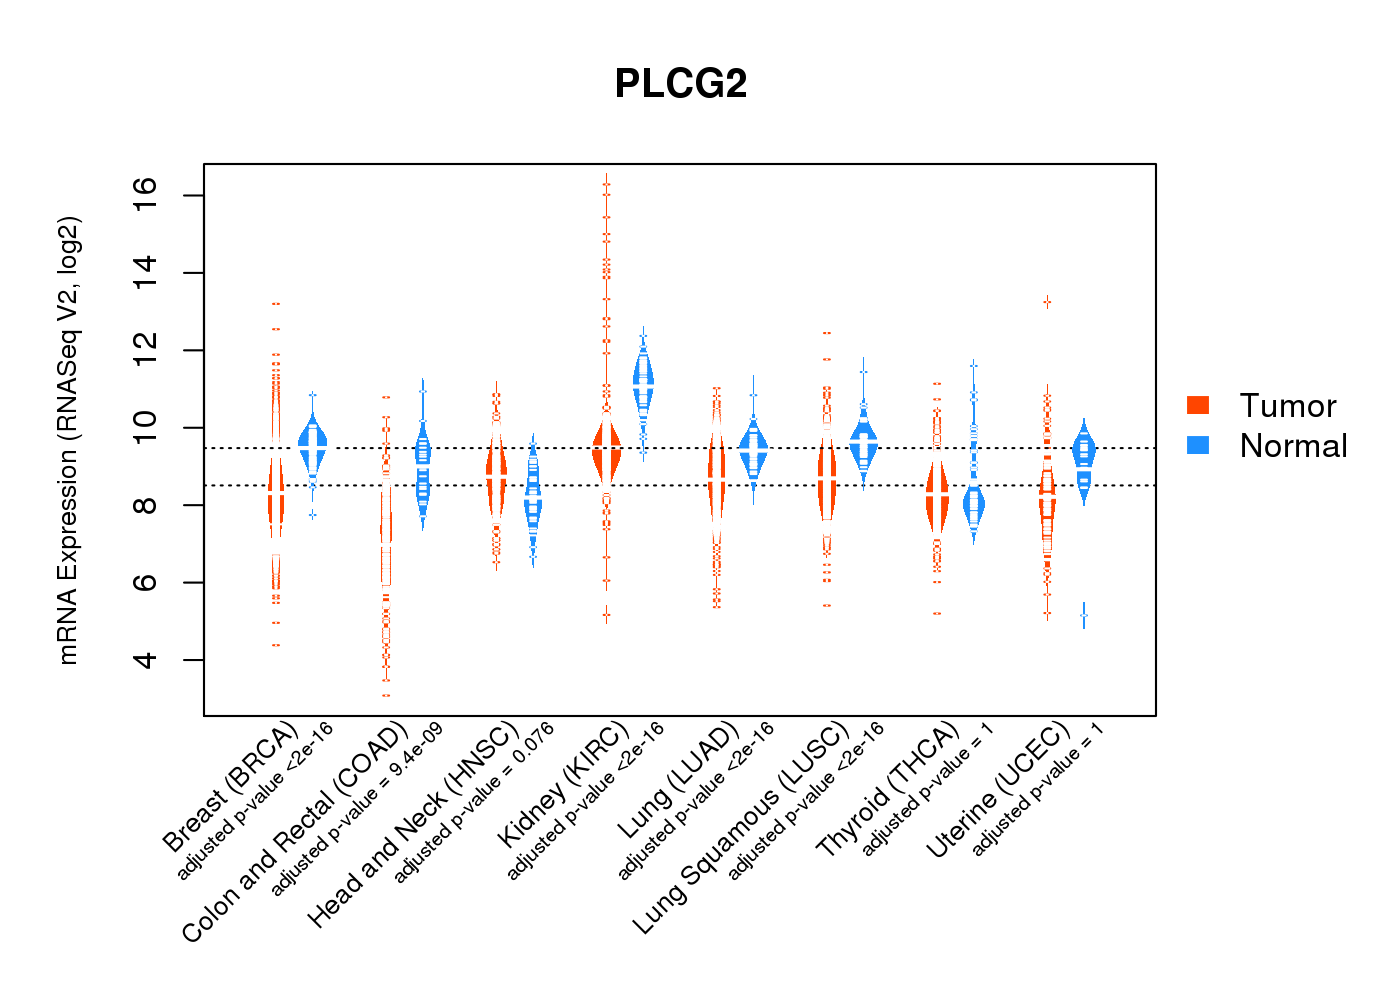
| Gene Expression for PLCG2 |
| * CCLE gene expression data were extracted from CCLE_Expression_Entrez_2012-10-18.res: Gene-centric RMA-normalized mRNA expression data. |
 |
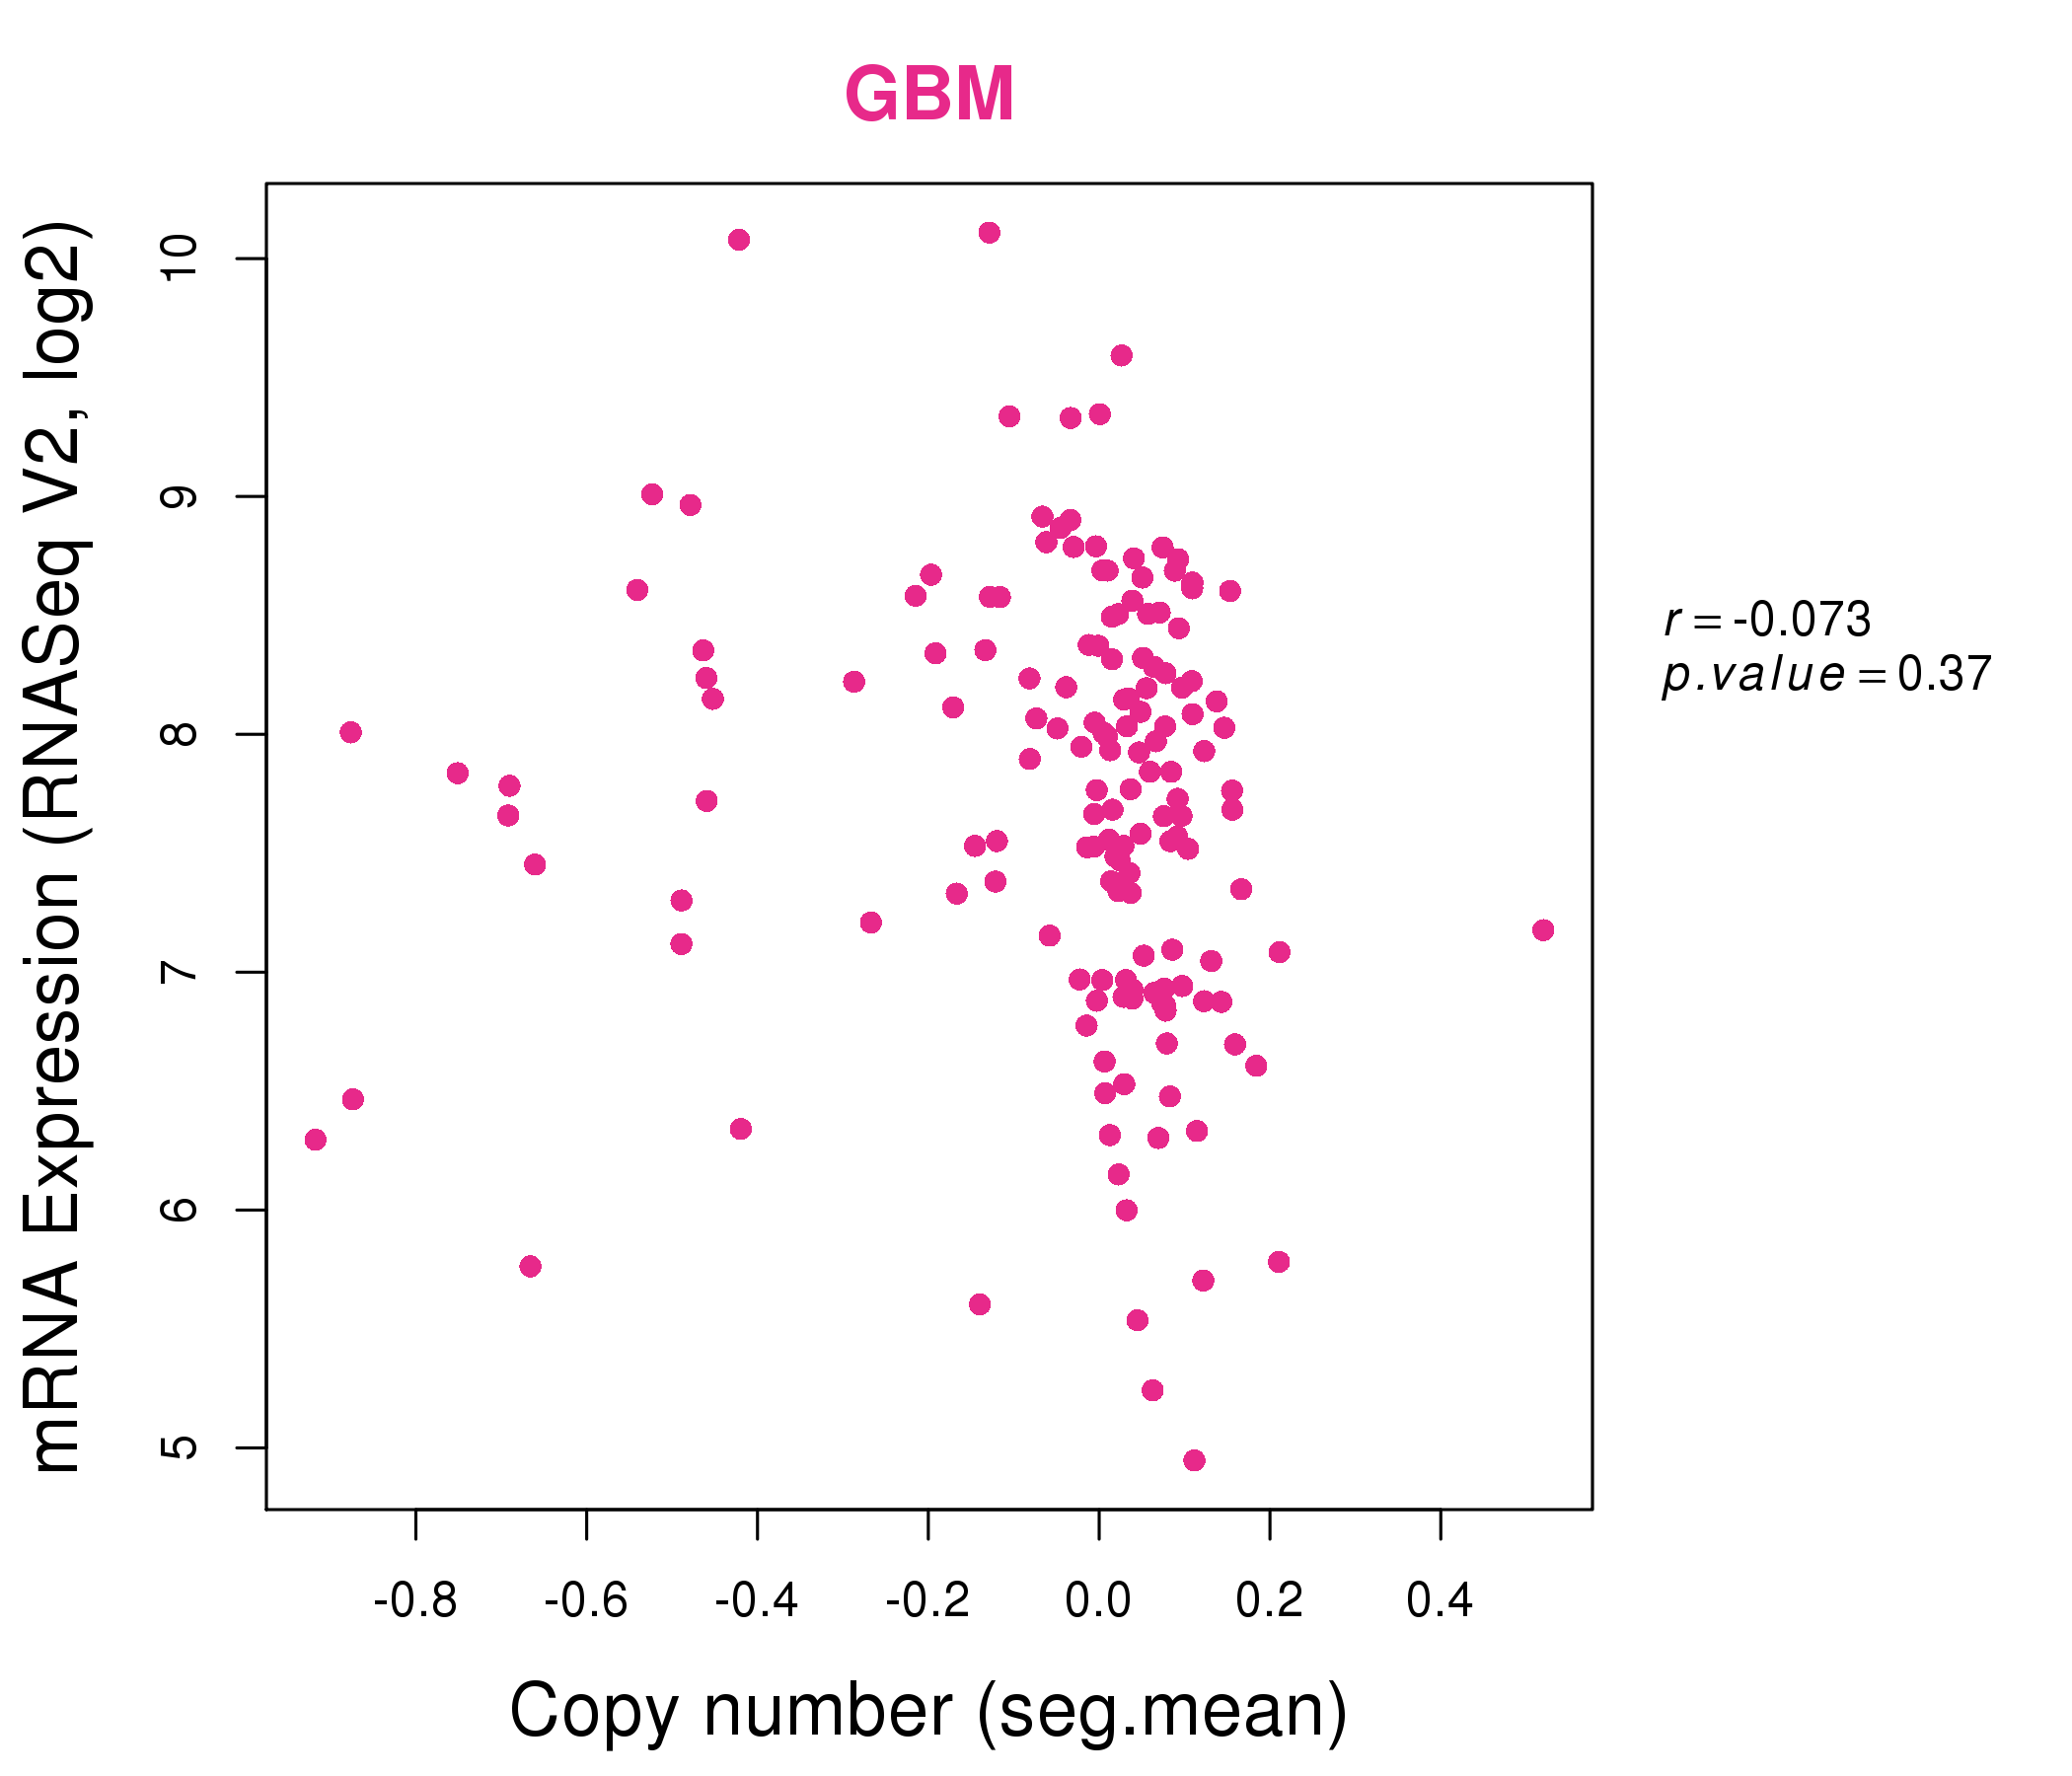
| * Normalized gene expression data of RNASeqV2 was extracted from TCGA using R package TCGA-Assembler. The URLs of all public data files on TCGA DCC data server were gathered at Jan-05-2015. Only eight cancer types have enough normal control samples for differential expression analysis. (t test, adjusted p<0.05 (using Benjamini-Hochberg FDR)) |
 |
| Top |
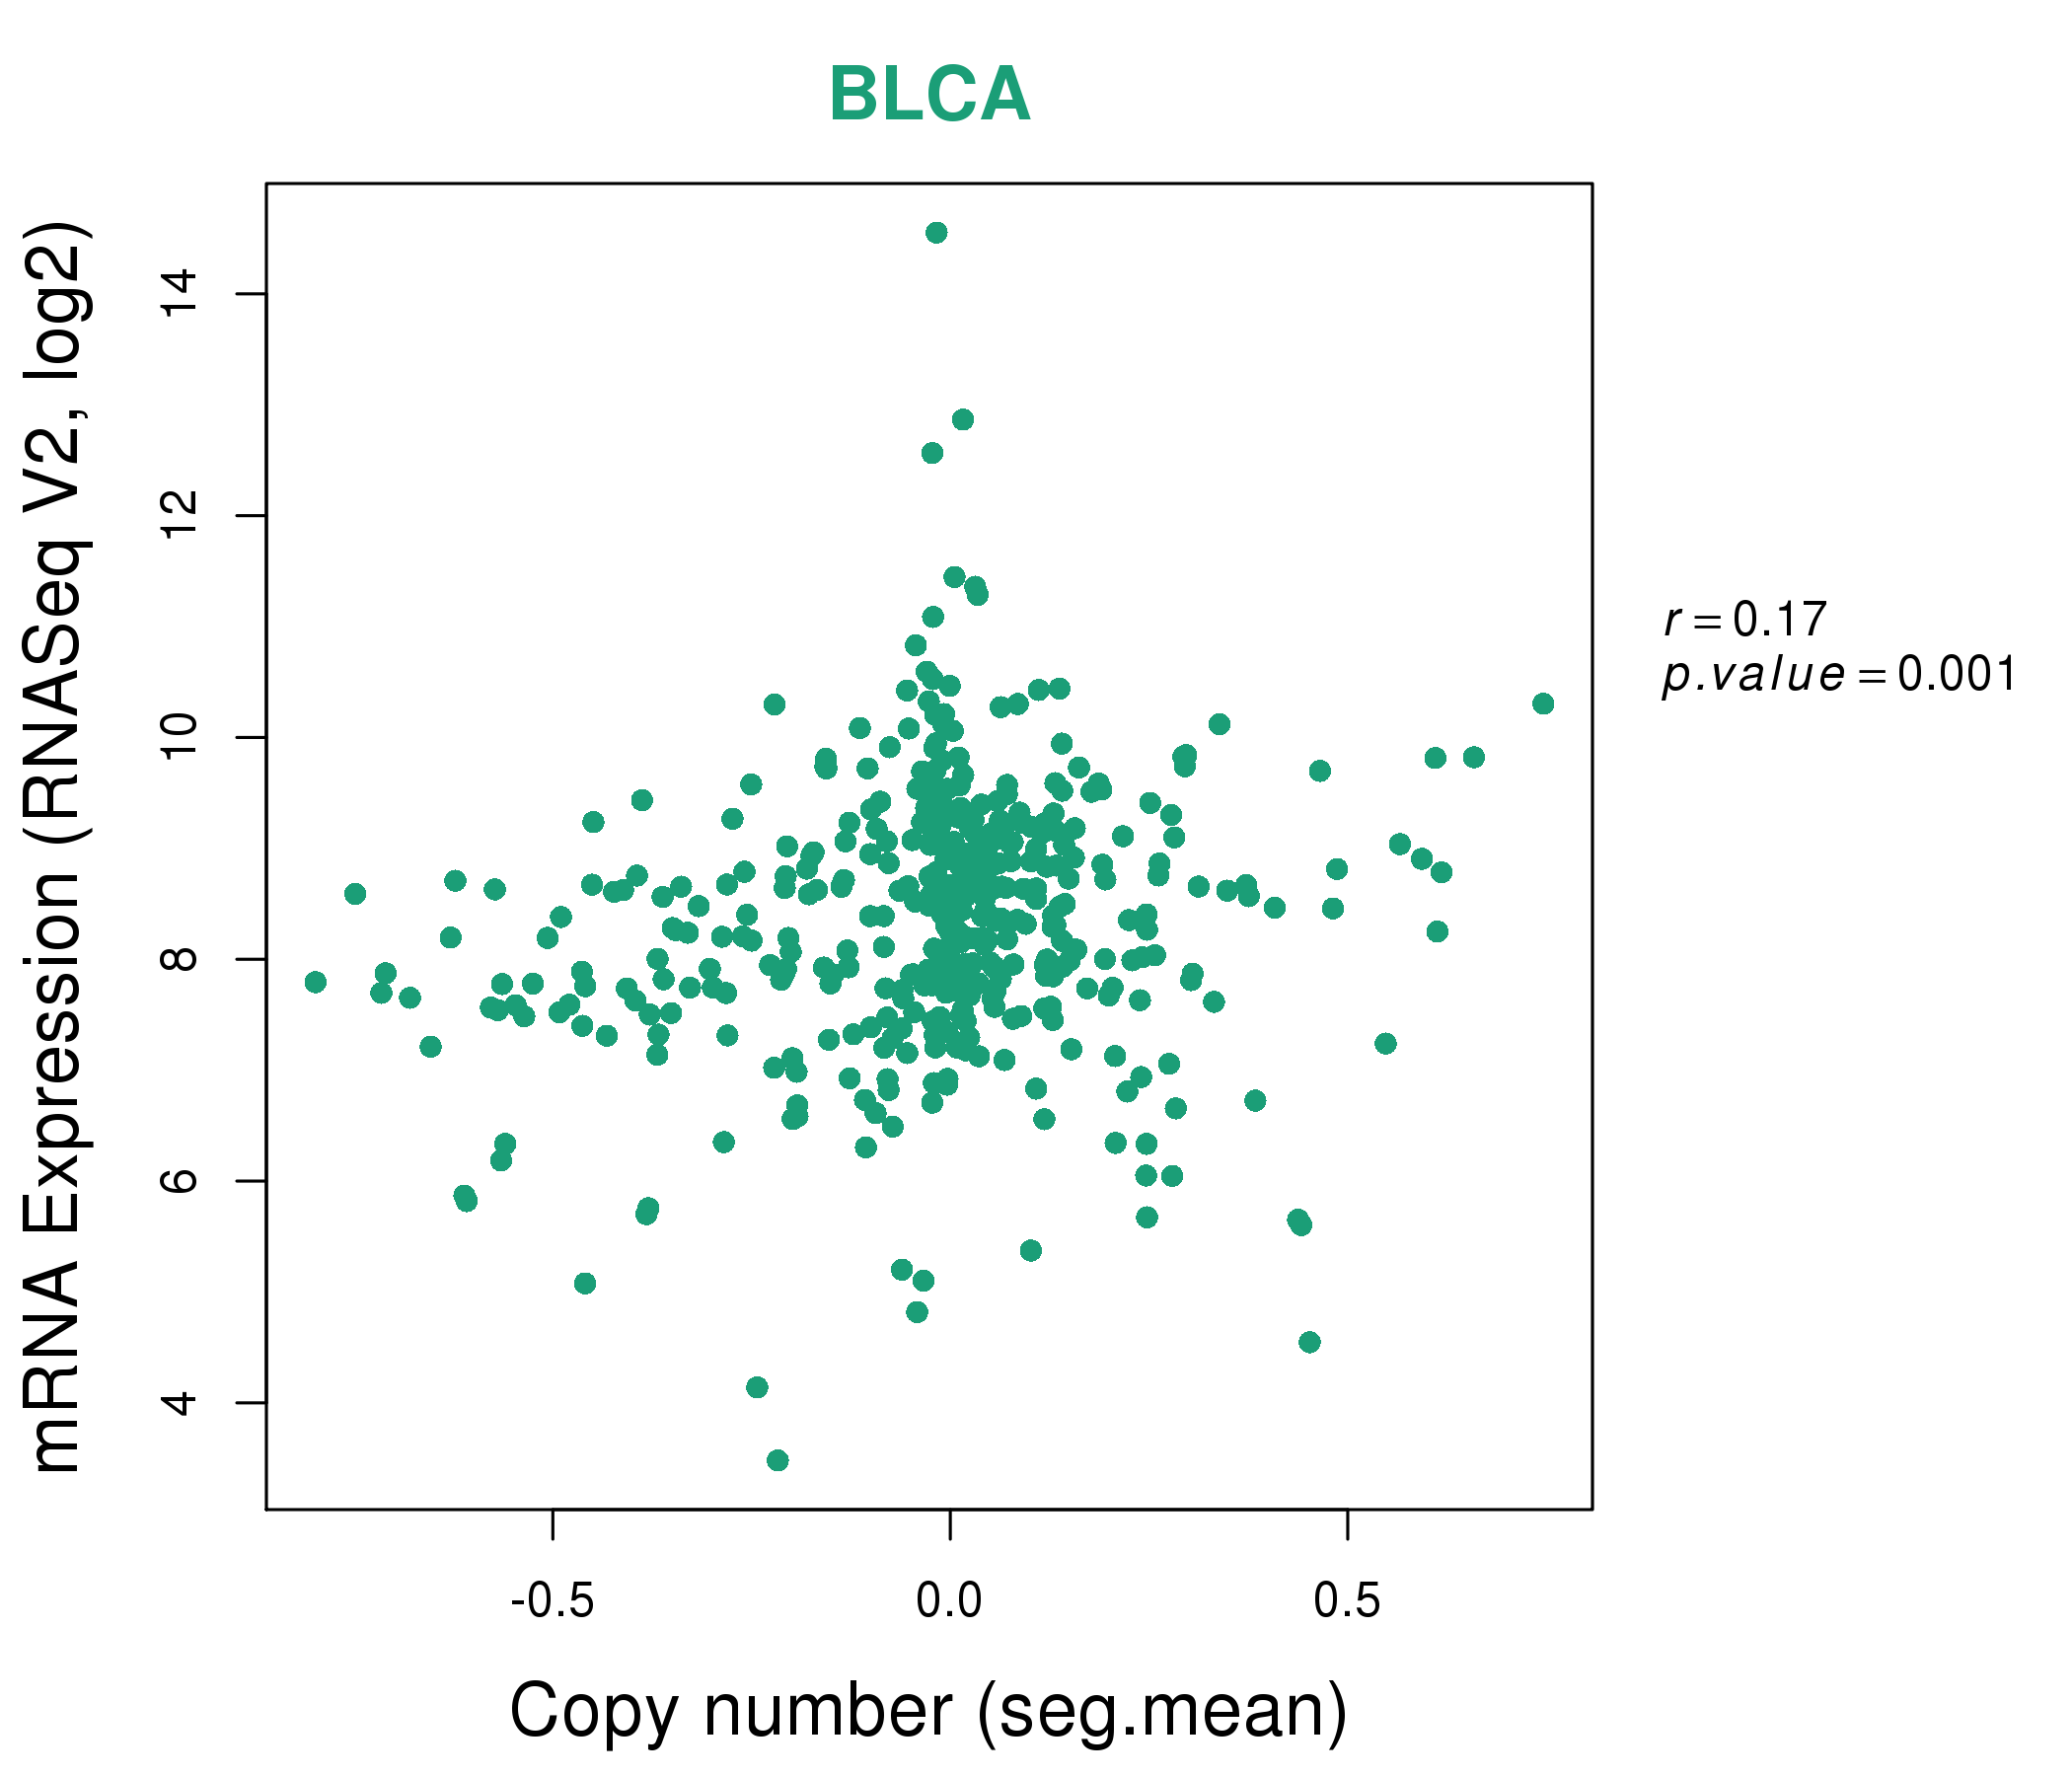
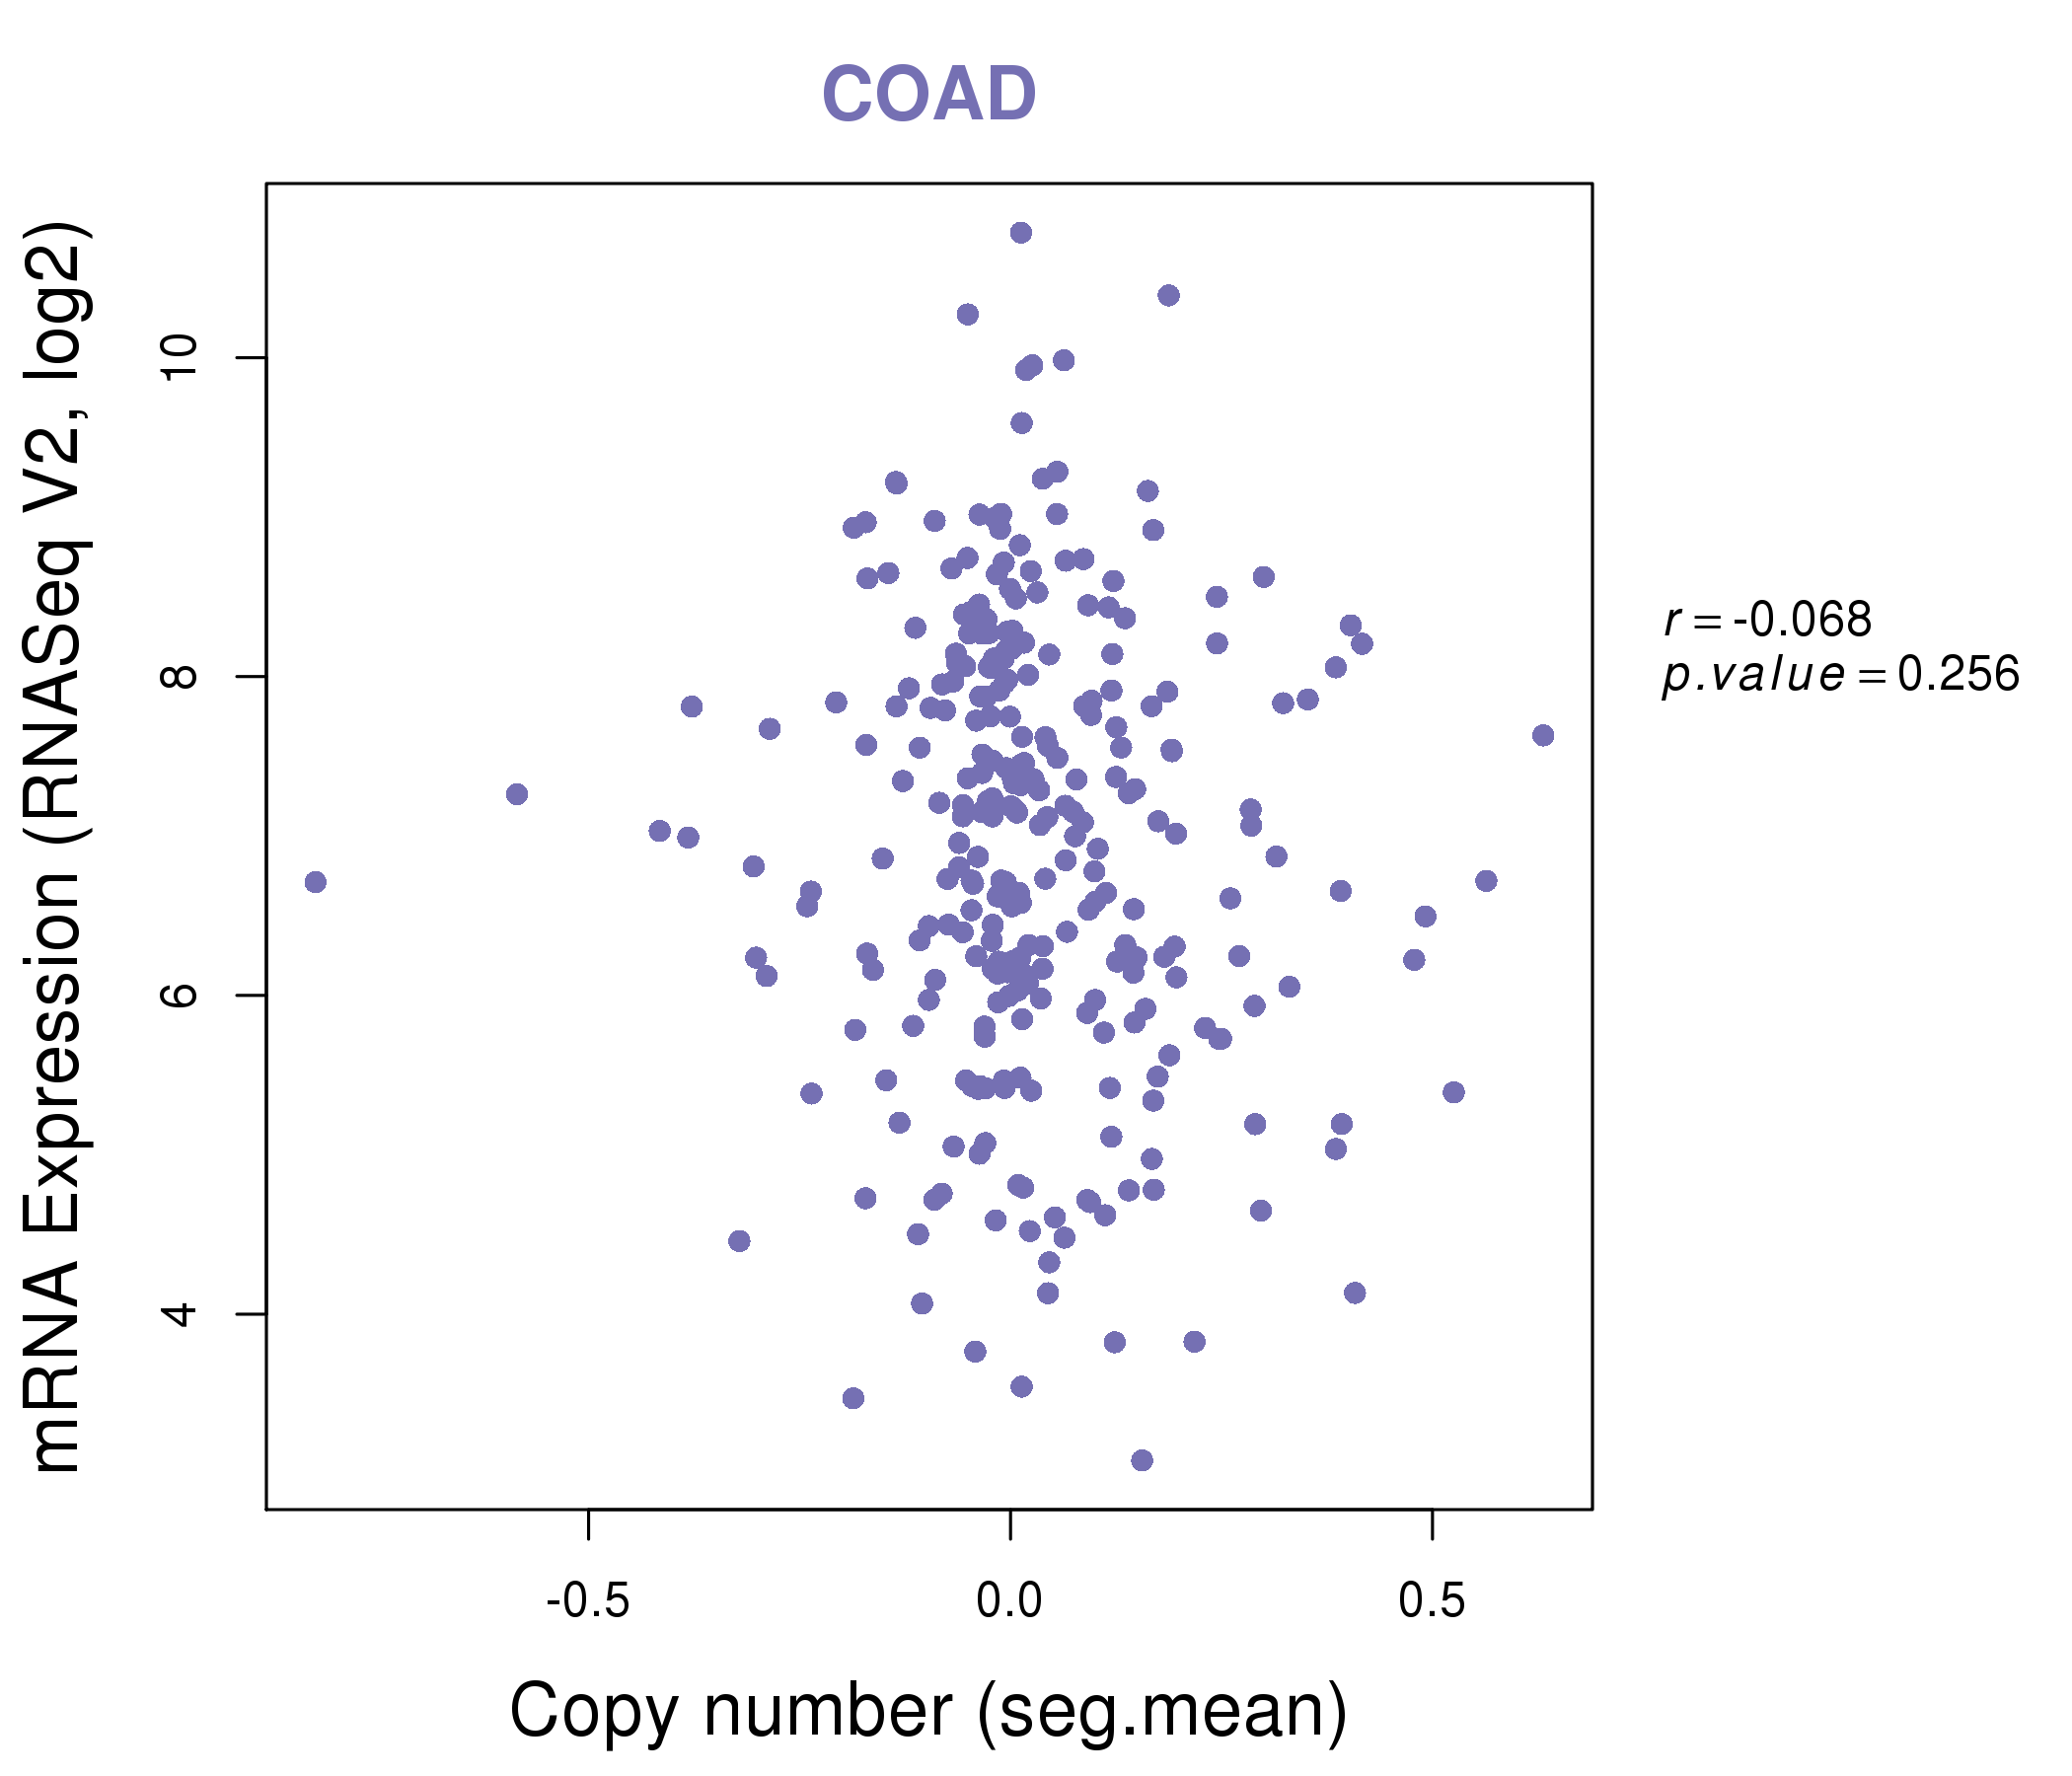
| * This plots show the correlation between CNV and gene expression. |
: Open all plots for all cancer types
 |
|
 |
|

| Top |
| Gene-Gene Network Information |
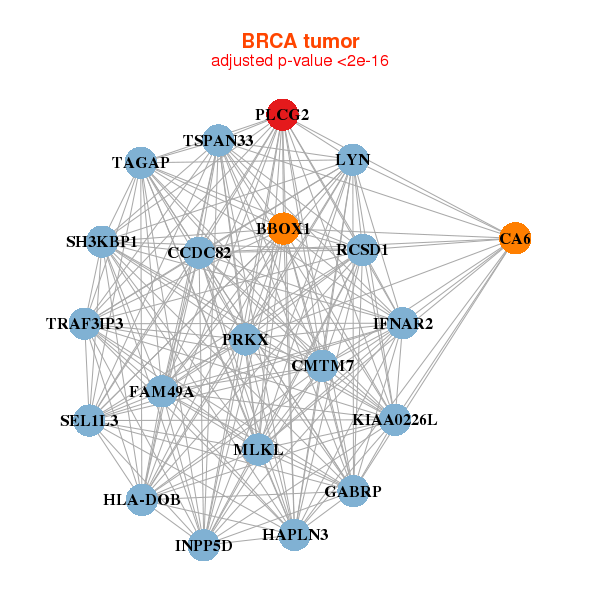
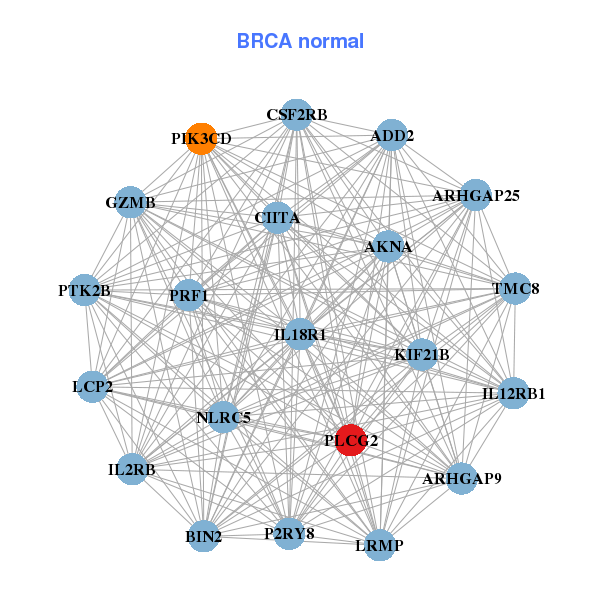
| * Co-Expression network figures were drawn using R package igraph. Only the top 20 genes with the highest correlations were shown. Red circle: input gene, orange circle: cell metabolism gene, sky circle: other gene |
: Open all plots for all cancer types
 |
|
| BBOX1,KIAA0226L,CA6,CCDC82,CMTM7,FAM49A,GABRP, HAPLN3,HLA-DOB,IFNAR2,INPP5D,LYN,MLKL,PLCG2, PRKX,RCSD1,SEL1L3,SH3KBP1,TAGAP,TRAF3IP3,TSPAN33 | ADD2,AKNA,ARHGAP25,ARHGAP9,BIN2,CIITA,CSF2RB, GZMB,IL12RB1,IL18R1,IL2RB,KIF21B,LCP2,LRMP, NLRC5,P2RY8,PIK3CD,PLCG2,PRF1,PTK2B,TMC8 |
 |
|
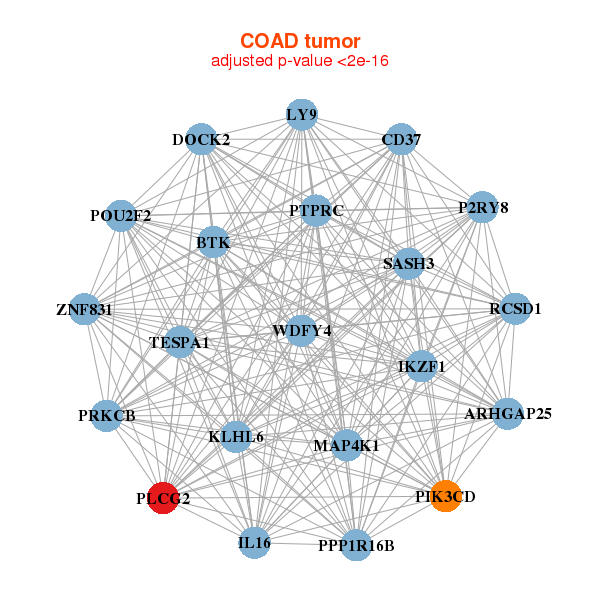
| ARHGAP25,BTK,CD37,DOCK2,IKZF1,IL16,TESPA1, KLHL6,LY9,MAP4K1,P2RY8,PIK3CD,PLCG2,POU2F2, PPP1R16B,PRKCB,PTPRC,RCSD1,SASH3,WDFY4,ZNF831 | BEND4,NUGGC,CD79A,CYFIP2,DOCK8,DOK3,DTX1, IGLL1,INPP5D,KCNK12,KLHL6,LRMP,NUP210,P2RY8, PIK3CG,PLCG2,POU2AF1,RFTN1,SH2B2,TLR9,WDFY4 |
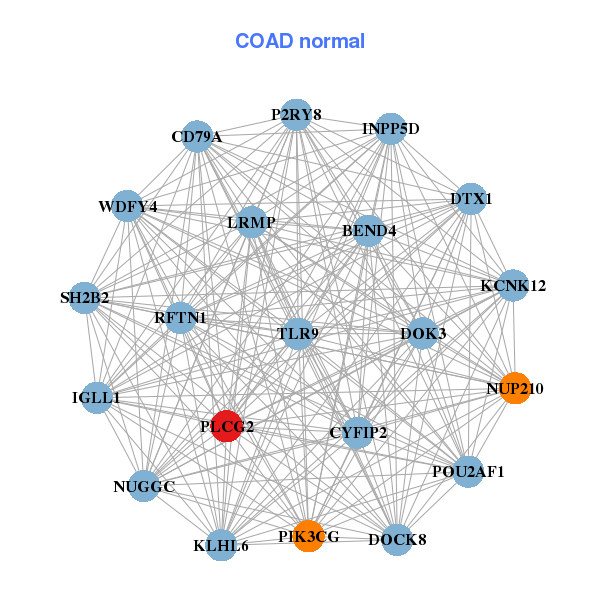
| * Co-Expression network figures were drawn using R package igraph. Only the top 20 genes with the highest correlations were shown. Red circle: input gene, orange circle: cell metabolism gene, sky circle: other gene |
: Open all plots for all cancer types
| Top |
: Open all interacting genes' information including KEGG pathway for all interacting genes from DAVID
| Top |
| Pharmacological Information for PLCG2 |
| There's no related Drug. |
| Top |
| Cross referenced IDs for PLCG2 |
| * We obtained these cross-references from Uniprot database. It covers 150 different DBs, 18 categories. http://www.uniprot.org/help/cross_references_section |
: Open all cross reference information
|
Copyright © 2016-Present - The Univsersity of Texas Health Science Center at Houston @ |