|
||||||||||||||||||||
| |
| Phenotypic Information (metabolism pathway, cancer, disease, phenome) |
| |
| |
| Gene-Gene Network Information: Co-Expression Network, Interacting Genes & KEGG |
| |
|


| Gene Summary for PMM1 |
| Basic gene info. | Gene symbol | PMM1 |
| Gene name | phosphomannomutase 1 | |
| Synonyms | Sec53 | |
| Cytomap | UCSC genome browser: 22q13.2 | |
| Genomic location | chr22 :41972889-41985871 | |
| Type of gene | protein-coding | |
| RefGenes | NM_002676.2, | |
| Ensembl id | ENSG00000100417 | |
| Description | PMM 1PMMH-22brain glucose-1,6-bisphosphatase | |
| Modification date | 20141207 | |
| dbXrefs | MIM : 601786 | |
| HGNC : HGNC | ||
| Ensembl : ENSG00000100417 | ||
| HPRD : 03473 | ||
| Vega : OTTHUMG00000150972 | ||
| Protein | UniProt: go to UniProt's Cross Reference DB Table | |
| Expression | CleanEX: HS_PMM1 | |
| BioGPS: 5372 | ||
| Gene Expression Atlas: ENSG00000100417 | ||
| The Human Protein Atlas: ENSG00000100417 | ||
| Pathway | NCI Pathway Interaction Database: PMM1 | |
| KEGG: PMM1 | ||
| REACTOME: PMM1 | ||
| ConsensusPathDB | ||
| Pathway Commons: PMM1 | ||
| Metabolism | MetaCyc: PMM1 | |
| HUMANCyc: PMM1 | ||
| Regulation | Ensembl's Regulation: ENSG00000100417 | |
| miRBase: chr22 :41,972,889-41,985,871 | ||
| TargetScan: NM_002676 | ||
| cisRED: ENSG00000100417 | ||
| Context | iHOP: PMM1 | |
| cancer metabolism search in PubMed: PMM1 | ||
| UCL Cancer Institute: PMM1 | ||
| Assigned class in ccmGDB | C | |
| Top |
| Phenotypic Information for PMM1(metabolism pathway, cancer, disease, phenome) |
| Cancer | CGAP: PMM1 |
| Familial Cancer Database: PMM1 | |
| * This gene is included in those cancer gene databases. |
|
|
|
|
|
|
| ||||||||||||||
Oncogene 1 | Significant driver gene in | |||||||||||||||||||
| cf) number; DB name 1 Oncogene; http://nar.oxfordjournals.org/content/35/suppl_1/D721.long, 2 Tumor Suppressor gene; https://bioinfo.uth.edu/TSGene/, 3 Cancer Gene Census; http://www.nature.com/nrc/journal/v4/n3/abs/nrc1299.html, 4 CancerGenes; http://nar.oxfordjournals.org/content/35/suppl_1/D721.long, 5 Network of Cancer Gene; http://ncg.kcl.ac.uk/index.php, 1Therapeutic Vulnerabilities in Cancer; http://cbio.mskcc.org/cancergenomics/statius/ |
| KEGG_FRUCTOSE_AND_MANNOSE_METABOLISM KEGG_AMINO_SUGAR_AND_NUCLEOTIDE_SUGAR_METABOLISM REACTOME_METABOLISM_OF_PROTEINS | |
| OMIM | |
| Orphanet | |
| Disease | KEGG Disease: PMM1 |
| MedGen: PMM1 (Human Medical Genetics with Condition) | |
| ClinVar: PMM1 | |
| Phenotype | MGI: PMM1 (International Mouse Phenotyping Consortium) |
| PhenomicDB: PMM1 | |
| Mutations for PMM1 |
| * Under tables are showing count per each tissue to give us broad intuition about tissue specific mutation patterns.You can go to the detailed page for each mutation database's web site. |
| There's no structural variation information in COSMIC data for this gene. |
| * From mRNA Sanger sequences, Chitars2.0 arranged chimeric transcripts. This table shows PMM1 related fusion information. |
| ID | Head Gene | Tail Gene | Accession | Gene_a | qStart_a | qEnd_a | Chromosome_a | tStart_a | tEnd_a | Gene_a | qStart_a | qEnd_a | Chromosome_a | tStart_a | tEnd_a |
| Top |
| There's no copy number variation information in COSMIC data for this gene. |
| Top |
|
 |
| Top |
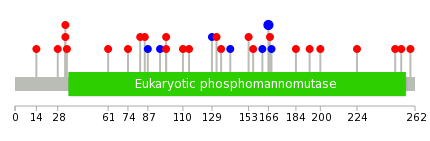
| Stat. for Non-Synonymous SNVs (# total SNVs=18) | (# total SNVs=5) |
 |  |
(# total SNVs=0) | (# total SNVs=0) |
| Top |
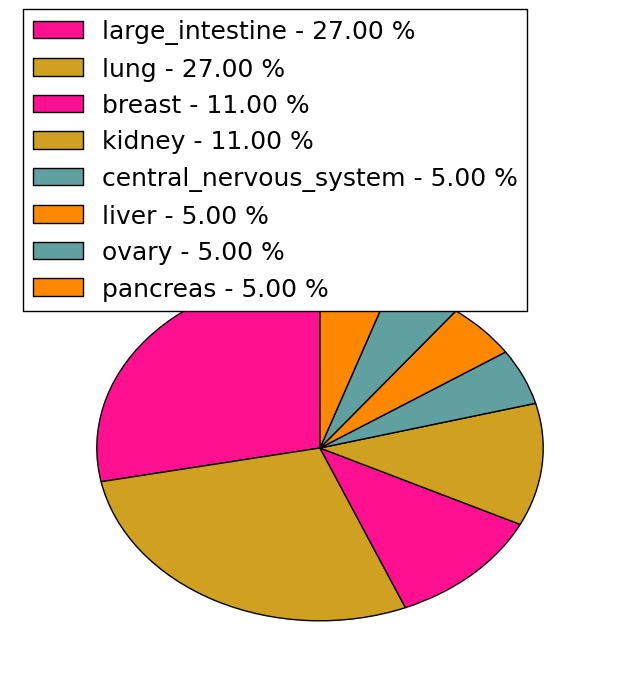
| * When you move the cursor on each content, you can see more deailed mutation information on the Tooltip. Those are primary_site,primary_histology,mutation(aa),pubmedID. |
| GRCh37 position | Mutation(aa) | Unique sampleID count |
| chr22:41974862-41974862 | p.F166F | 3 |
| chr22:41982188-41982188 | p.P33S | 2 |
| chr22:41974874-41974874 | p.I162I | 1 |
| chr22:41980364-41980364 | p.H99Y | 1 |
| chr22:41973335-41973335 | p.A259V | 1 |
| chr22:41985728-41985728 | p.R28G | 1 |
| chr22:41979970-41979970 | p.L156P | 1 |
| chr22:41980374-41980374 | p.T95T | 1 |
| chr22:41973354-41973354 | p.I253V | 1 |
| chr22:41985770-41985770 | p.V14L | 1 |
| Top |
|
 |
| Point Mutation/ Tissue ID | 1 | 2 | 3 | 4 | 5 | 6 | 7 | 8 | 9 | 10 | 11 | 12 | 13 | 14 | 15 | 16 | 17 | 18 | 19 | 20 |
| # sample | 3 | 6 | 1 | 1 | 1 | 1 | 3 | 1 | 2 | 3 | 1 | |||||||||
| # mutation | 4 | 6 | 1 | 1 | 1 | 1 | 3 | 1 | 2 | 3 | 1 | |||||||||
| nonsynonymous SNV | 3 | 5 | 1 | 1 | 1 | 2 | 1 | 1 | 2 | |||||||||||
| synonymous SNV | 1 | 1 | 1 | 1 | 1 | 1 | 1 |
| cf) Tissue ID; Tissue type (1; BLCA[Bladder Urothelial Carcinoma], 2; BRCA[Breast invasive carcinoma], 3; CESC[Cervical squamous cell carcinoma and endocervical adenocarcinoma], 4; COAD[Colon adenocarcinoma], 5; GBM[Glioblastoma multiforme], 6; Glioma Low Grade, 7; HNSC[Head and Neck squamous cell carcinoma], 8; KICH[Kidney Chromophobe], 9; KIRC[Kidney renal clear cell carcinoma], 10; KIRP[Kidney renal papillary cell carcinoma], 11; LAML[Acute Myeloid Leukemia], 12; LUAD[Lung adenocarcinoma], 13; LUSC[Lung squamous cell carcinoma], 14; OV[Ovarian serous cystadenocarcinoma ], 15; PAAD[Pancreatic adenocarcinoma], 16; PRAD[Prostate adenocarcinoma], 17; SKCM[Skin Cutaneous Melanoma], 18:STAD[Stomach adenocarcinoma], 19:THCA[Thyroid carcinoma], 20:UCEC[Uterine Corpus Endometrial Carcinoma]) |
| Top |
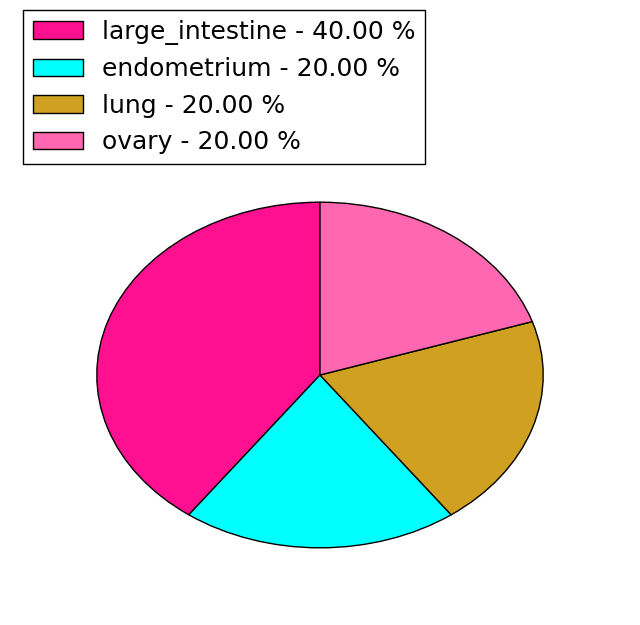
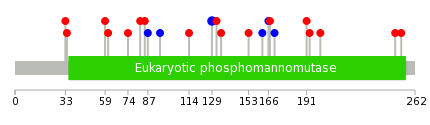
| * We represented just top 10 SNVs. When you move the cursor on each content, you can see more deailed mutation information on the Tooltip. Those are primary_site, primary_histology, mutation(aa), pubmedID. |
| Genomic Position | Mutation(aa) | Unique sampleID count |
| chr22:41980050 | p.I129I | 2 |
| chr22:41980034 | p.T95T | 1 |
| chr22:41982185 | p.H87H | 1 |
| chr22:41973354 | p.I253V | 1 |
| chr22:41980043 | p.Y85D | 1 |
| chr22:41982188 | p.R249Q | 1 |
| chr22:41973365 | p.T82M | 1 |
| chr22:41973879 | p.Y200C | 1 |
| chr22:41980319 | p.D74H | 1 |
| chr22:41973900 | p.P193R | 1 |
| * Copy number data were extracted from TCGA using R package TCGA-Assembler. The URLs of all public data files on TCGA DCC data server were gathered on Jan-05-2015. Function ProcessCNAData in TCGA-Assembler package was used to obtain gene-level copy number value which is calculated as the average copy number of the genomic region of a gene. |
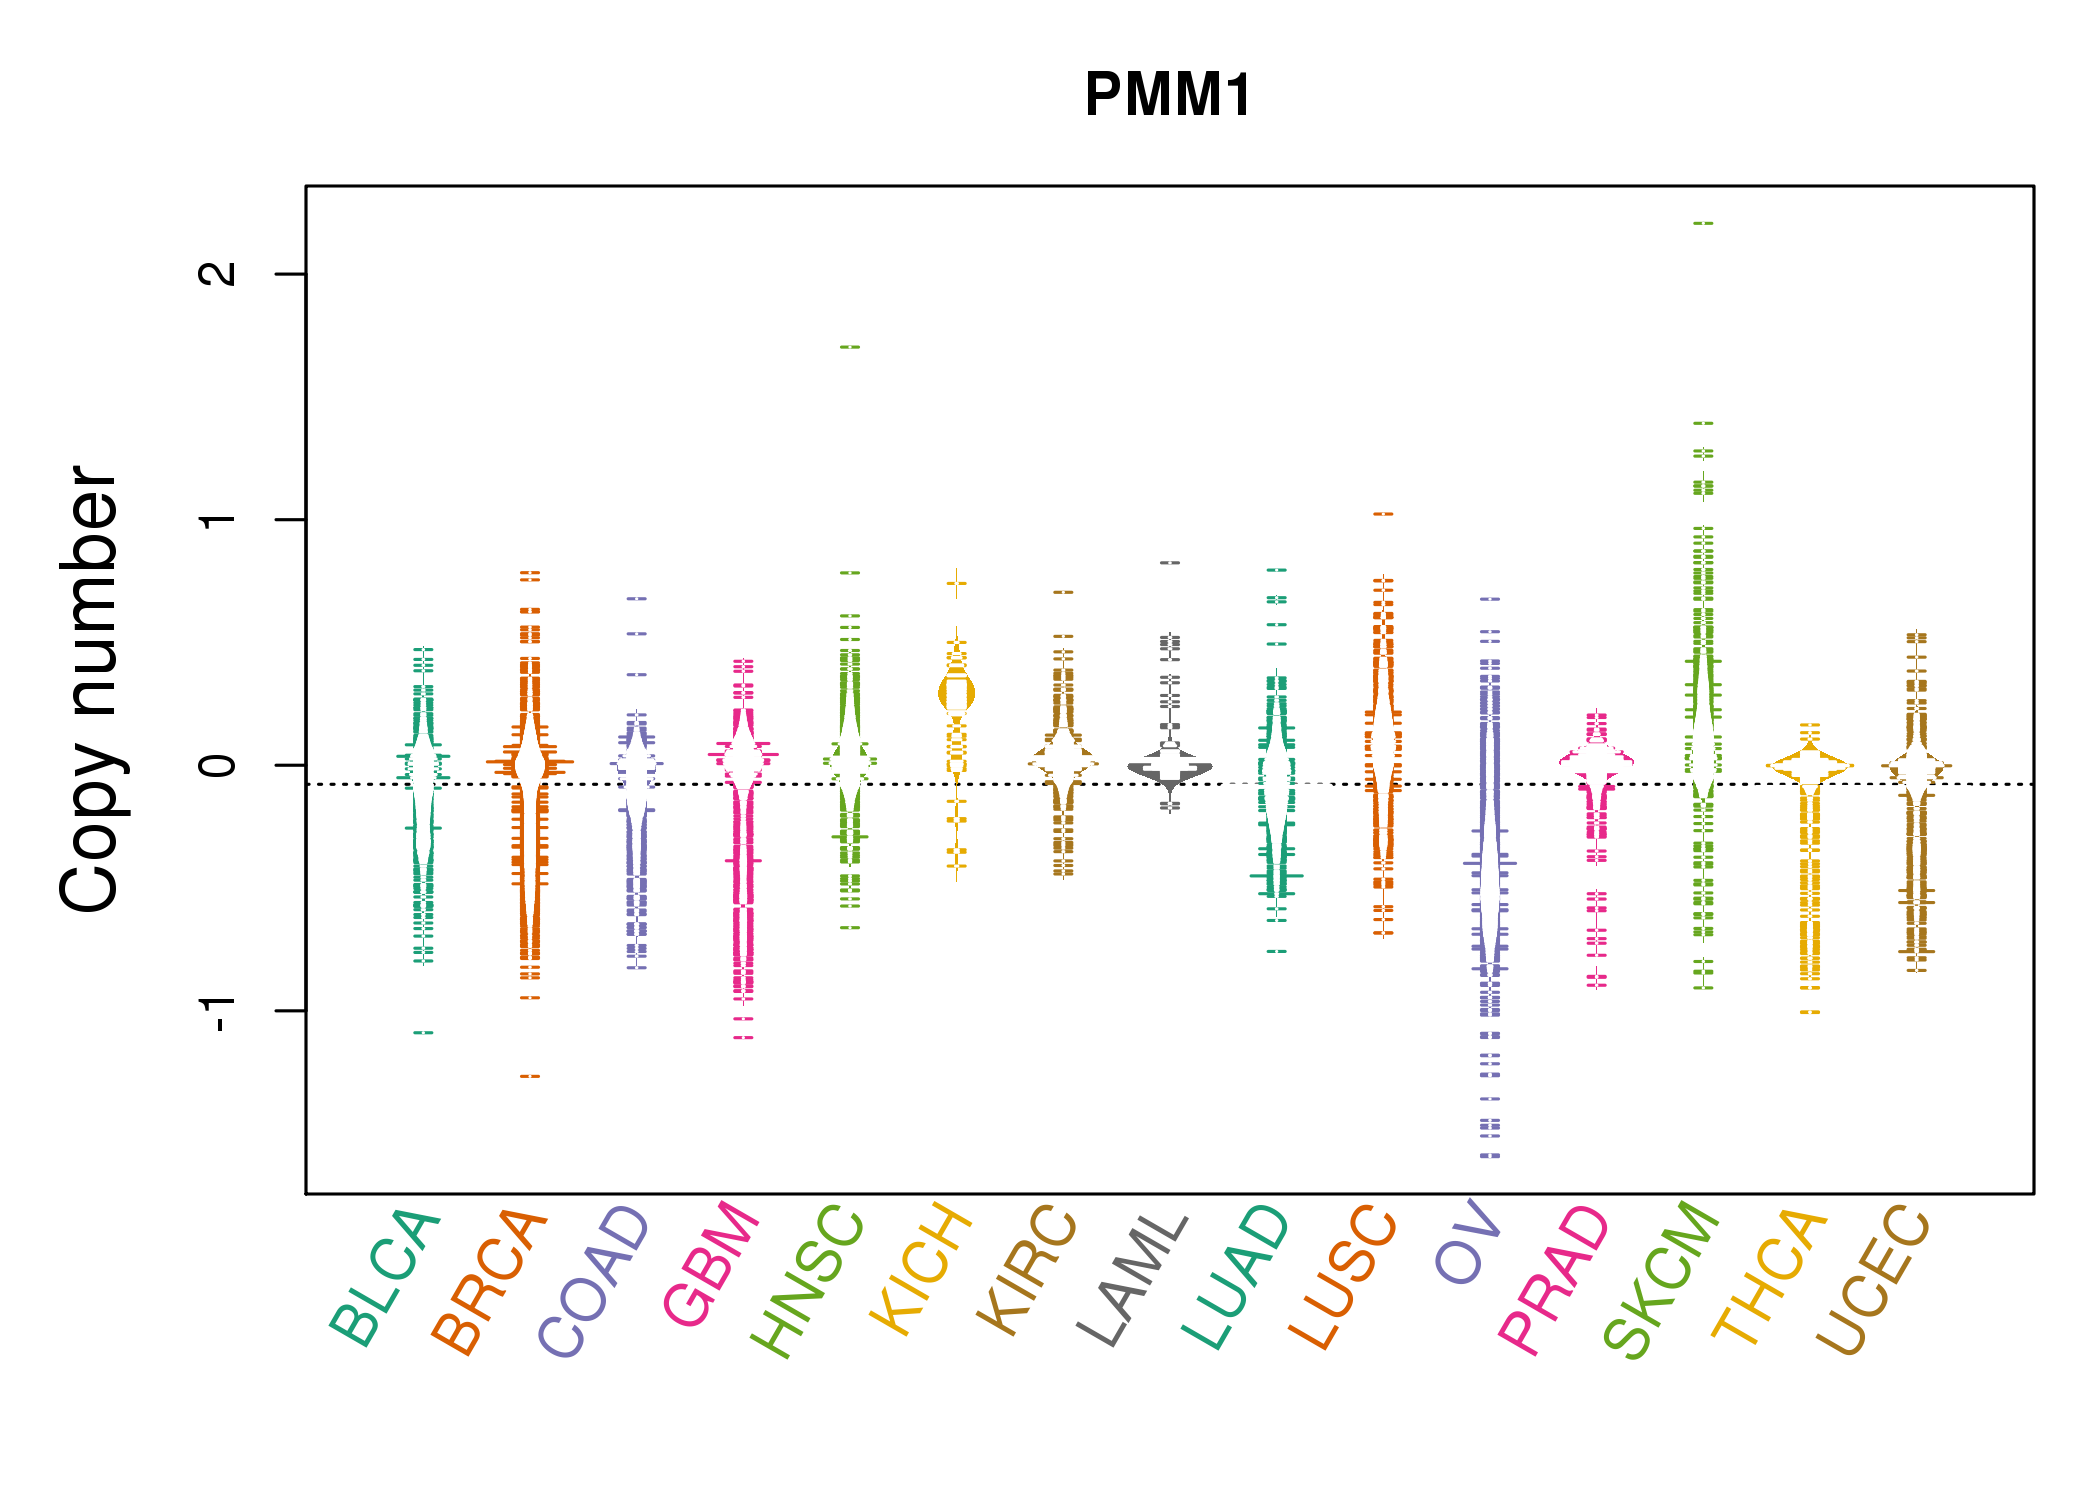 |
| cf) Tissue ID[Tissue type]: BLCA[Bladder Urothelial Carcinoma], BRCA[Breast invasive carcinoma], CESC[Cervical squamous cell carcinoma and endocervical adenocarcinoma], COAD[Colon adenocarcinoma], GBM[Glioblastoma multiforme], Glioma Low Grade, HNSC[Head and Neck squamous cell carcinoma], KICH[Kidney Chromophobe], KIRC[Kidney renal clear cell carcinoma], KIRP[Kidney renal papillary cell carcinoma], LAML[Acute Myeloid Leukemia], LUAD[Lung adenocarcinoma], LUSC[Lung squamous cell carcinoma], OV[Ovarian serous cystadenocarcinoma ], PAAD[Pancreatic adenocarcinoma], PRAD[Prostate adenocarcinoma], SKCM[Skin Cutaneous Melanoma], STAD[Stomach adenocarcinoma], THCA[Thyroid carcinoma], UCEC[Uterine Corpus Endometrial Carcinoma] |
| Top |
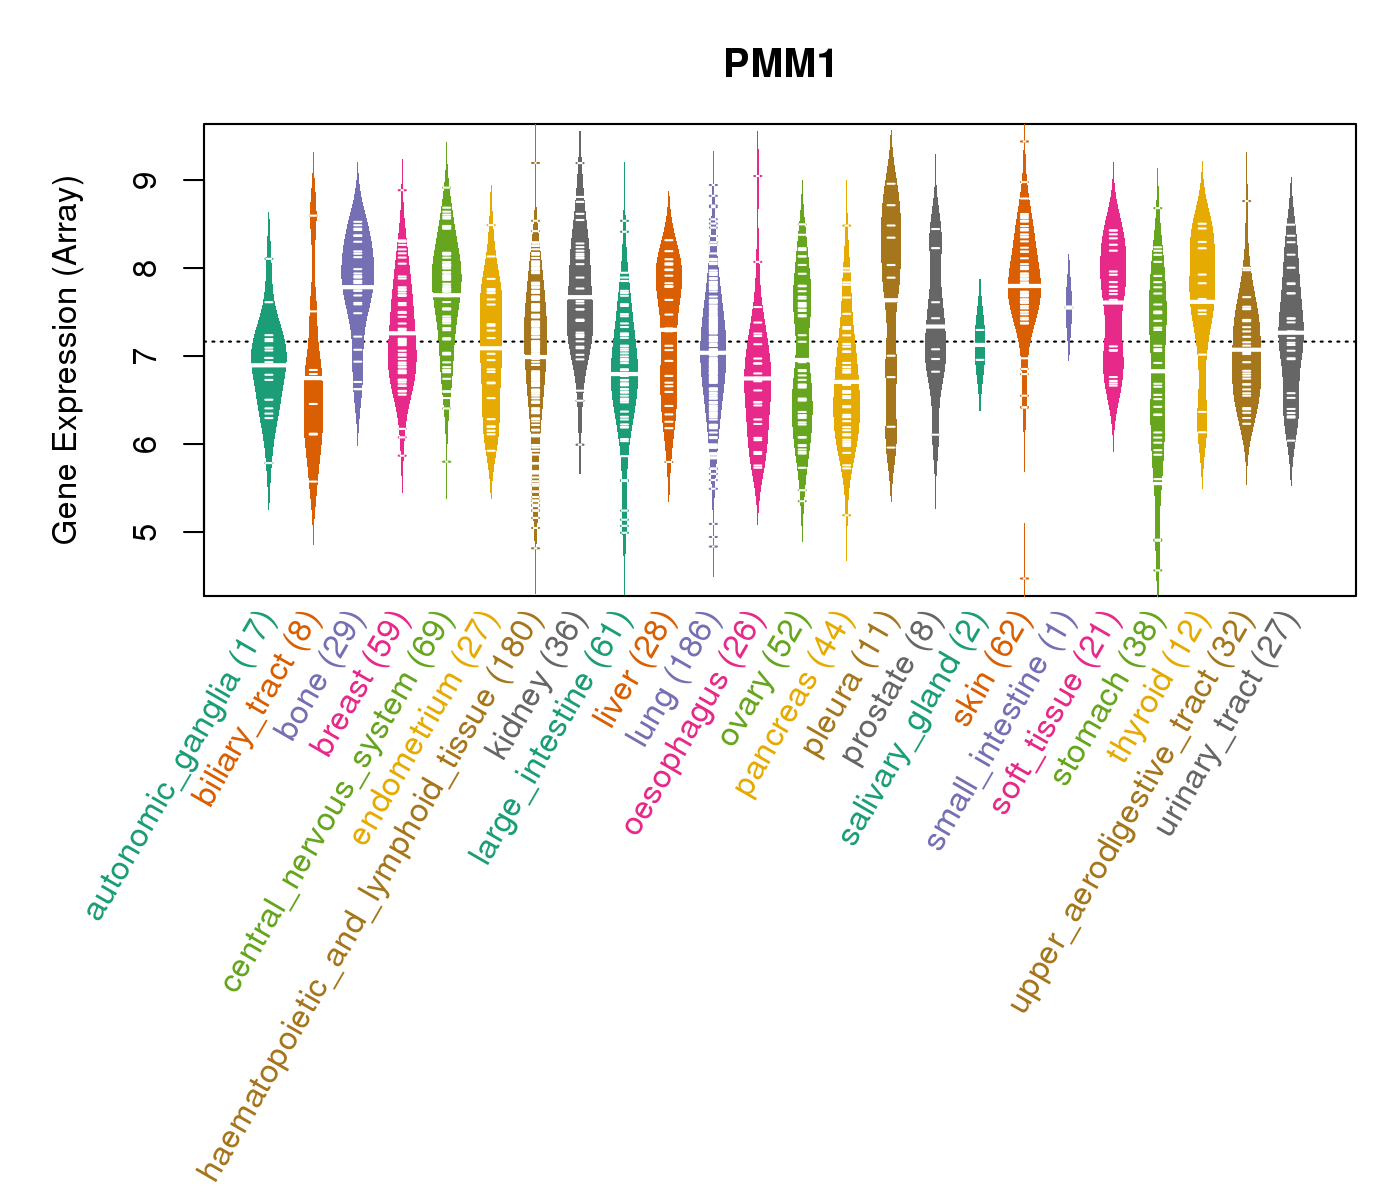
| Gene Expression for PMM1 |
| * CCLE gene expression data were extracted from CCLE_Expression_Entrez_2012-10-18.res: Gene-centric RMA-normalized mRNA expression data. |
 |
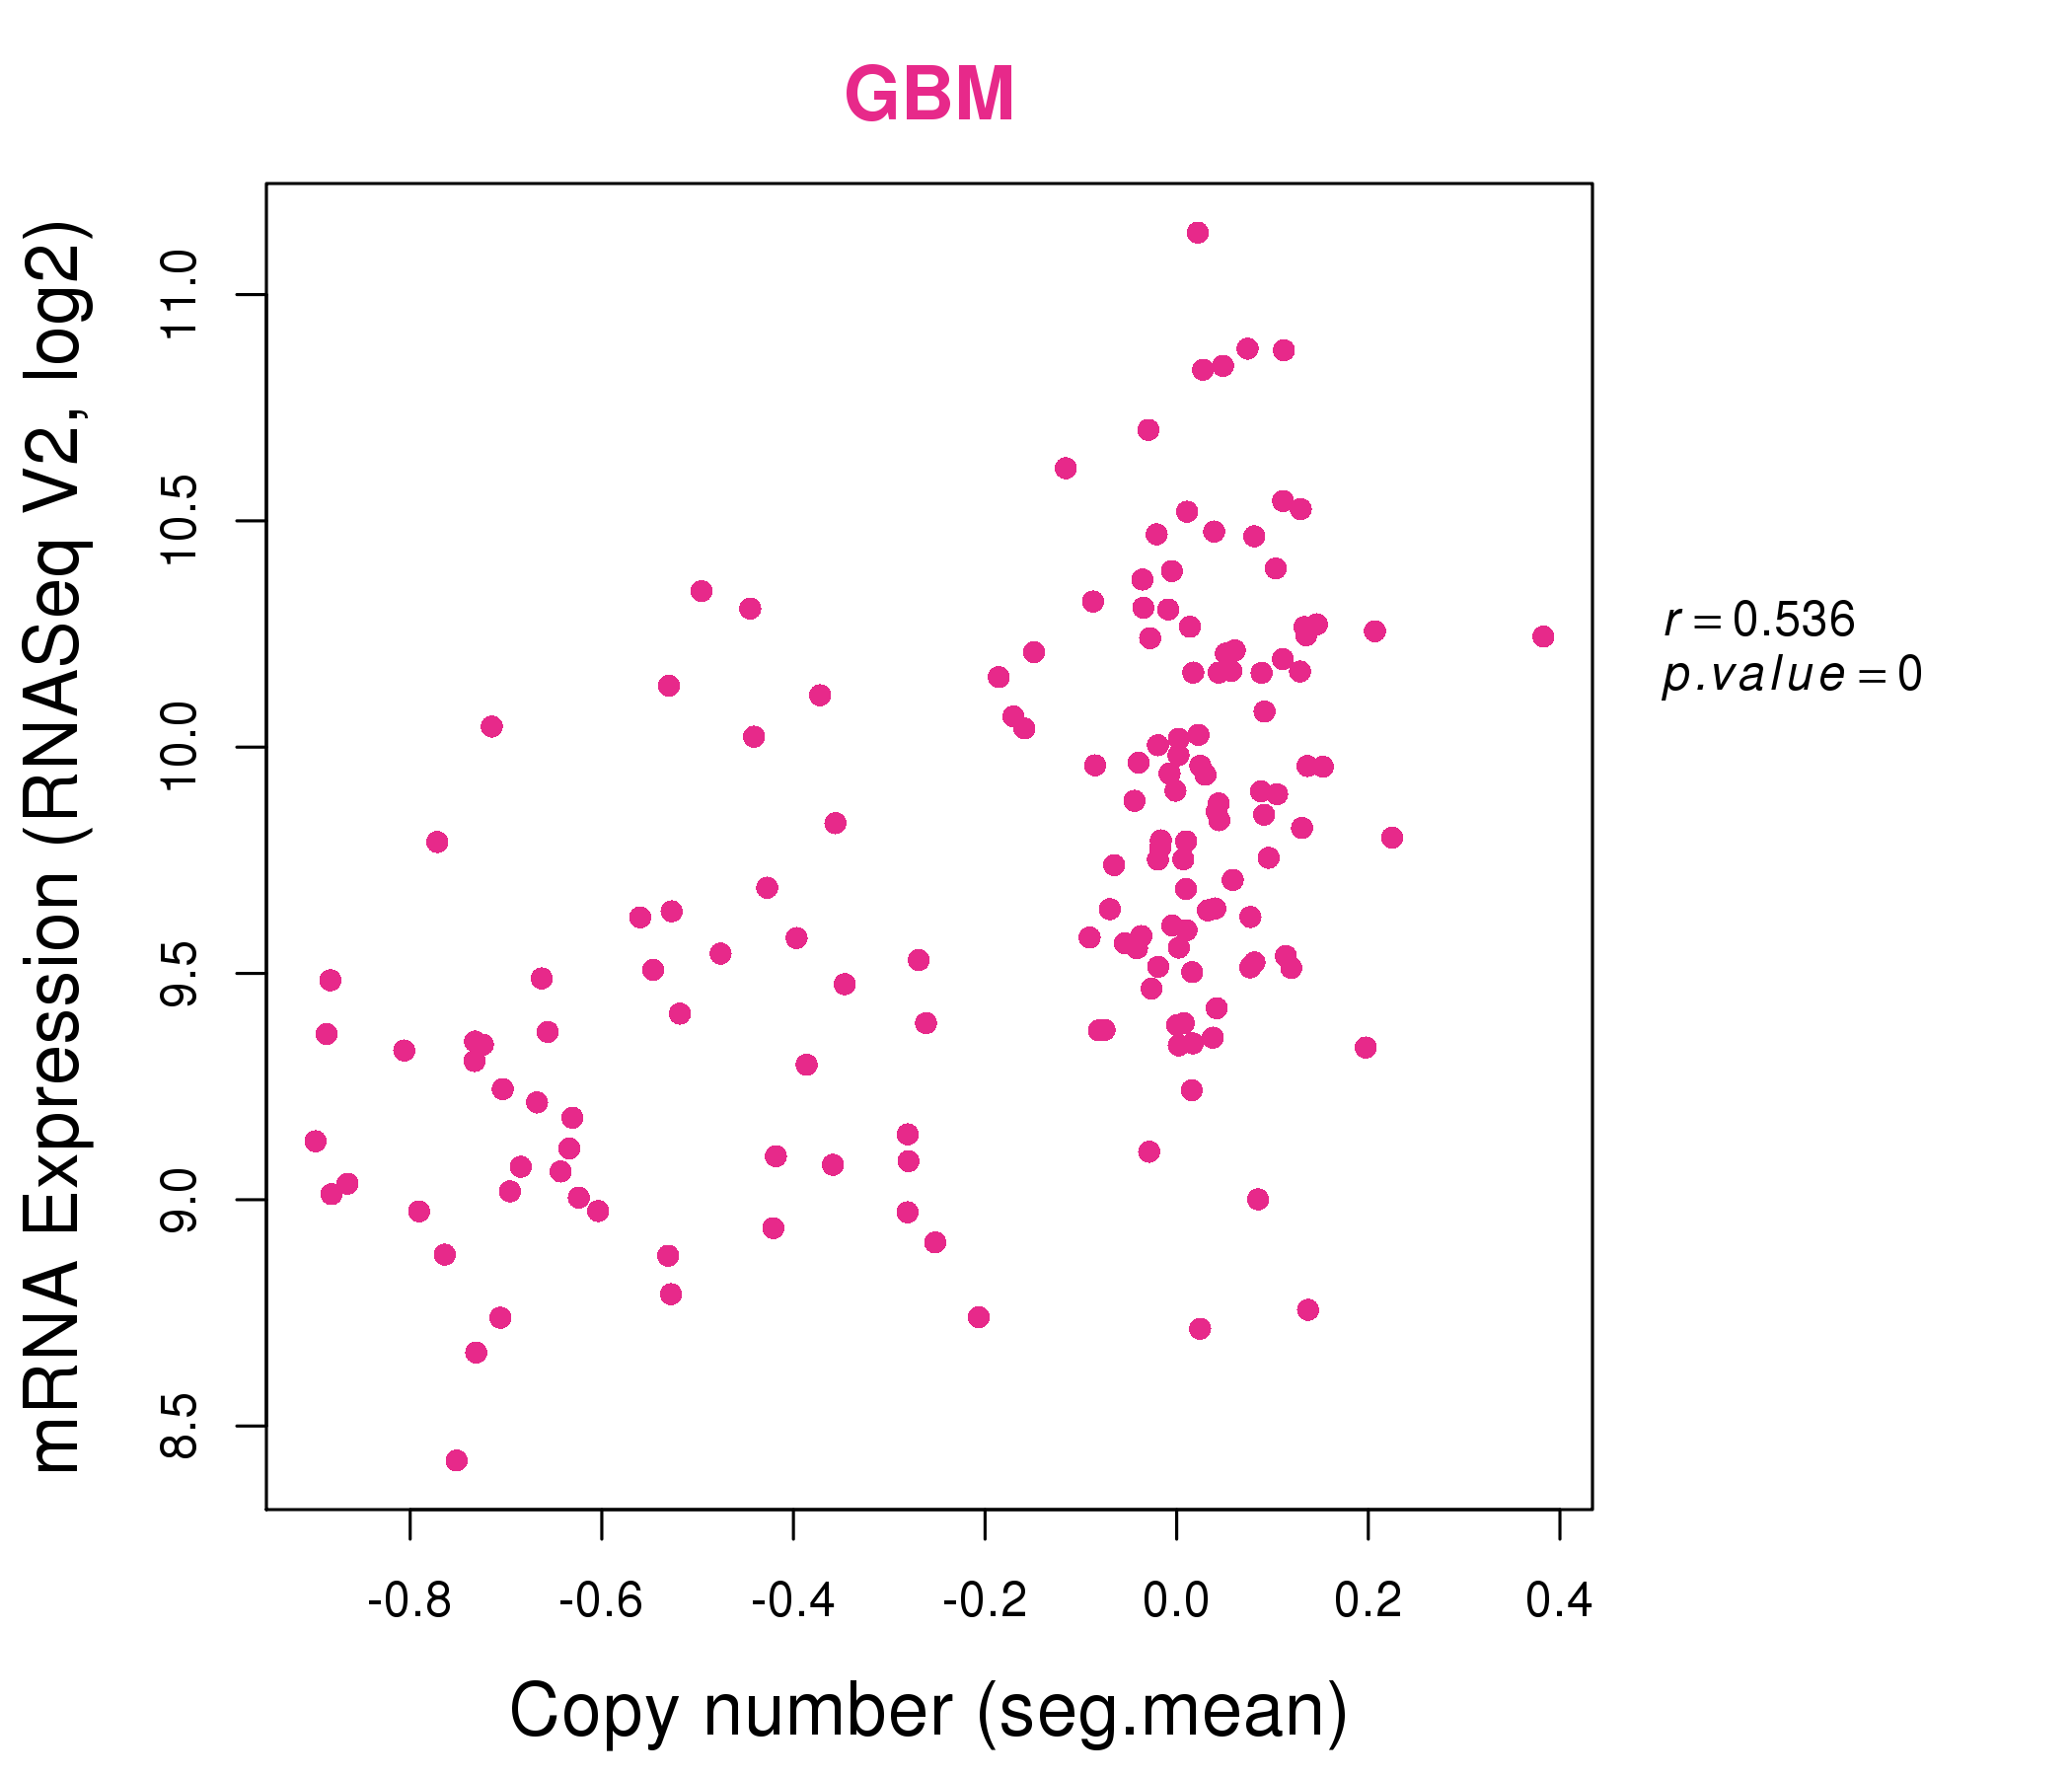
| * Normalized gene expression data of RNASeqV2 was extracted from TCGA using R package TCGA-Assembler. The URLs of all public data files on TCGA DCC data server were gathered at Jan-05-2015. Only eight cancer types have enough normal control samples for differential expression analysis. (t test, adjusted p<0.05 (using Benjamini-Hochberg FDR)) |
 |
| Top |
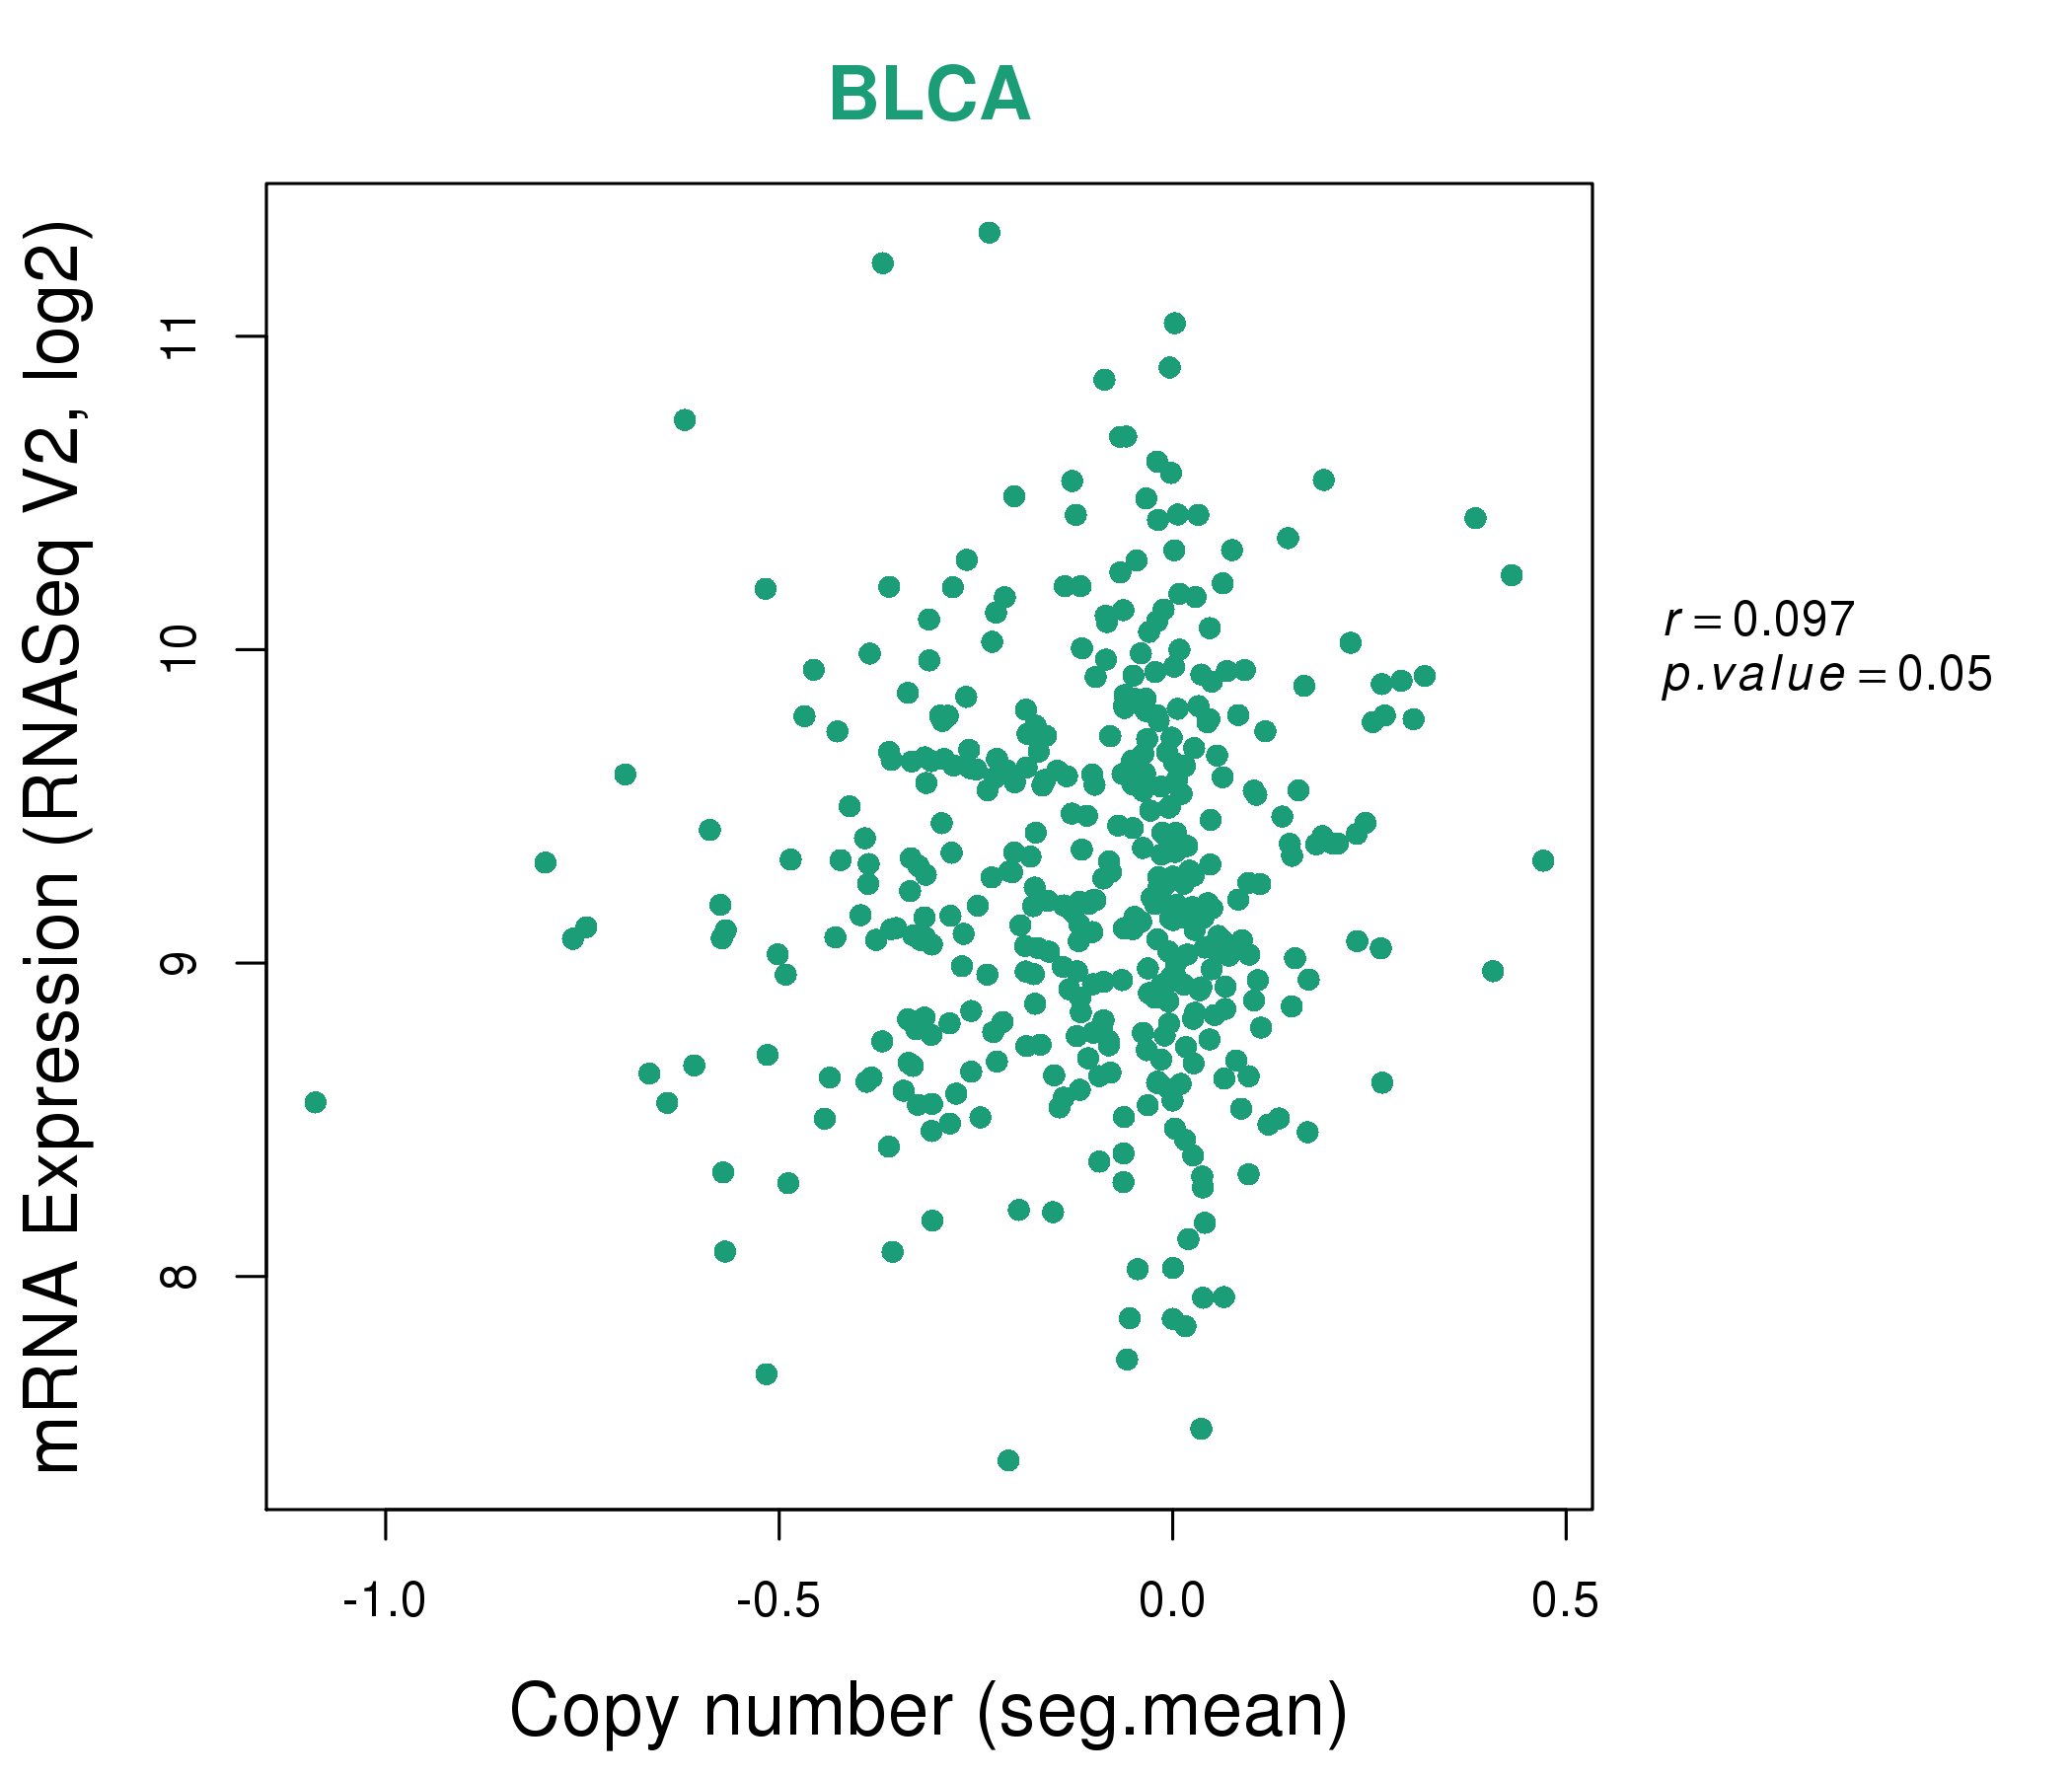
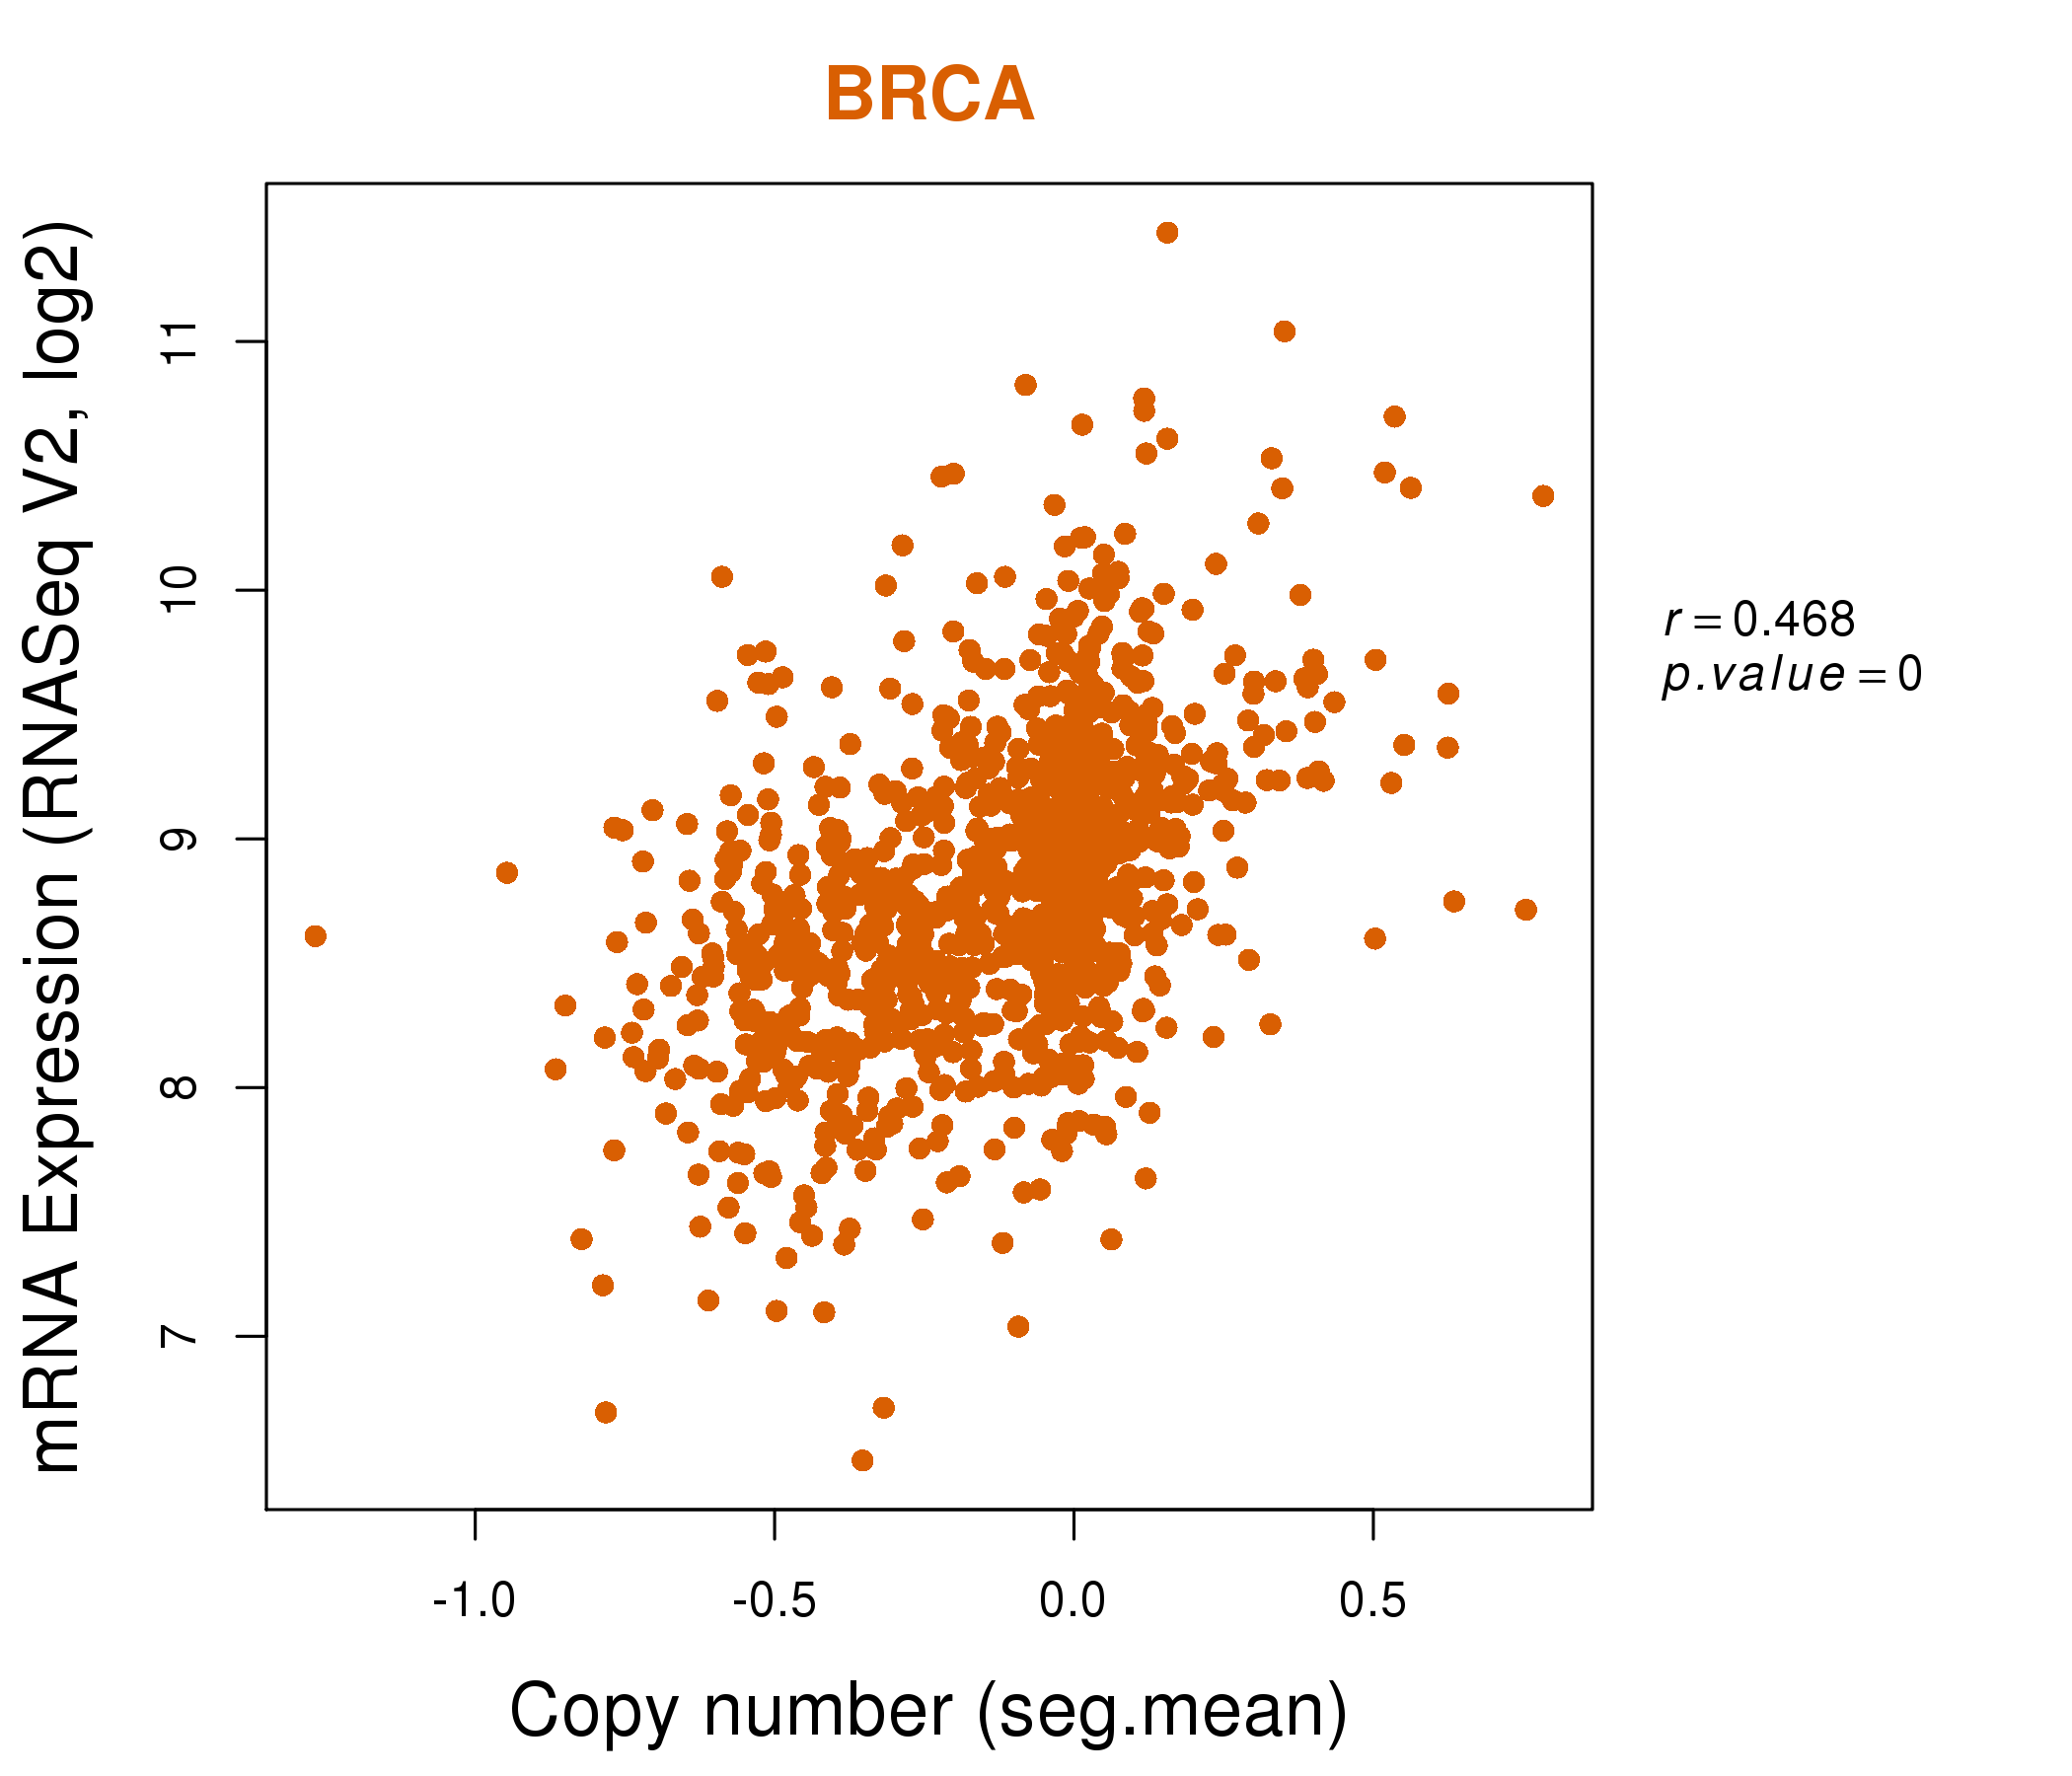
| * This plots show the correlation between CNV and gene expression. |
: Open all plots for all cancer types
 |
|
 |
|
| Top |
| Gene-Gene Network Information |
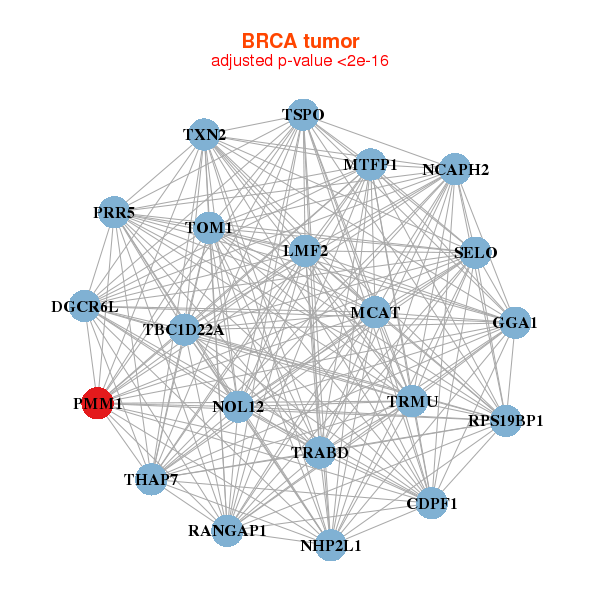
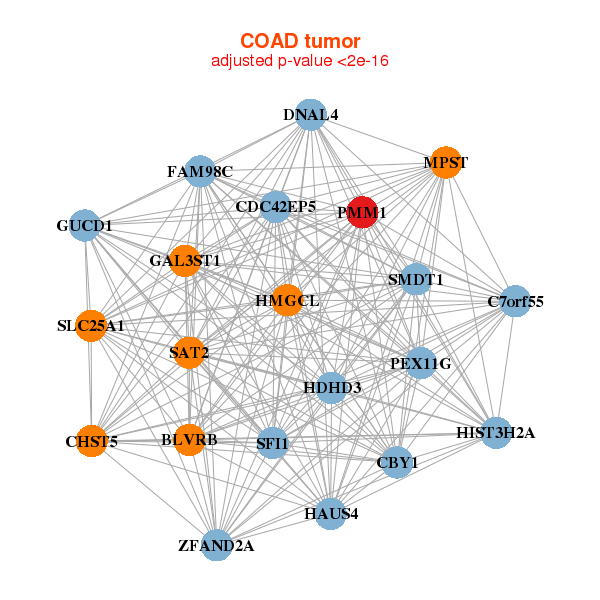
| * Co-Expression network figures were drawn using R package igraph. Only the top 20 genes with the highest correlations were shown. Red circle: input gene, orange circle: cell metabolism gene, sky circle: other gene |
: Open all plots for all cancer types
 |
|
| CDPF1,DGCR6L,GGA1,LMF2,MCAT,MTFP1,NCAPH2, NHP2L1,NOL12,PMM1,PRR5,RANGAP1,RPS19BP1,SELO, TBC1D22A,THAP7,TOM1,TRABD,TRMU,TSPO,TXN2 | ACSM2A,ACSM2B,ALDH1L1,ASS1,BMP3,TBATA,C17orf53, IZUMO4,ECHDC3,GCDH,GLUL,GLYCTK,MOCS1,NDRG4, NTSR2,PCYT2,PDZD7,PMM1,PXMP2,RASL10B,TMEM120A |
 |
|
| BLVRB,GUCD1,SMDT1,C7orf55,CBY1,CDC42EP5,CHST5, DNAL4,FAM98C,GAL3ST1,HAUS4,HDHD3,HIST3H2A,HMGCL, MPST,PEX11G,PMM1,SAT2,SFI1,SLC25A1,ZFAND2A | ABCD4,ADPRHL1,C11orf52,CCDC28A,CCNDBP1,DHRS3,FAM132A, FIBP,FMO5,GPR108,KIAA2013,KLC4,LOC151534,PMM1, RAB17,SEPHS2,STARD3,TMEM120A,TNNC2,TPRG1L,ZFAND2B |
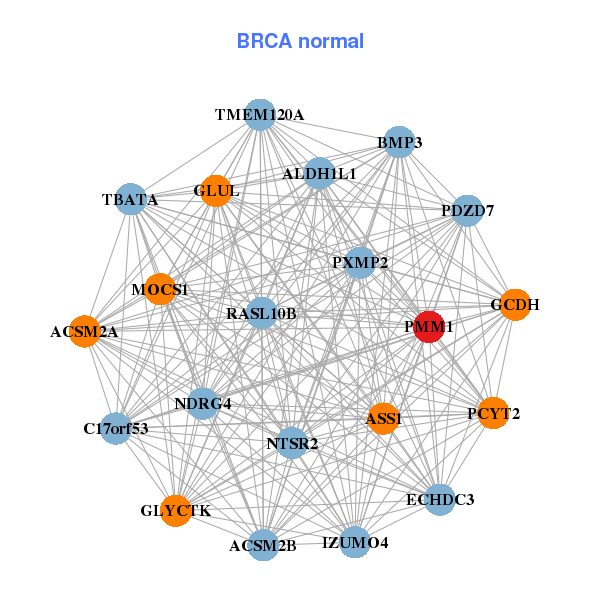
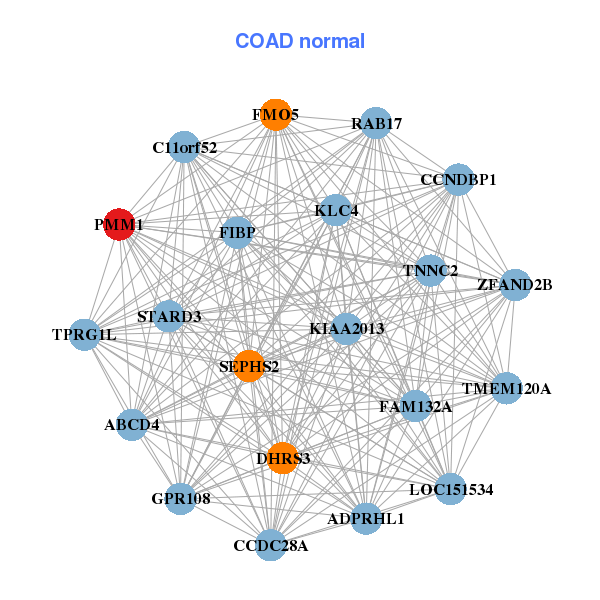
| * Co-Expression network figures were drawn using R package igraph. Only the top 20 genes with the highest correlations were shown. Red circle: input gene, orange circle: cell metabolism gene, sky circle: other gene |
: Open all plots for all cancer types
| Top |
: Open all interacting genes' information including KEGG pathway for all interacting genes from DAVID
| Top |
| Pharmacological Information for PMM1 |
| There's no related Drug. |
| Top |
| Cross referenced IDs for PMM1 |
| * We obtained these cross-references from Uniprot database. It covers 150 different DBs, 18 categories. http://www.uniprot.org/help/cross_references_section |
: Open all cross reference information
|
Copyright © 2016-Present - The Univsersity of Texas Health Science Center at Houston @ |