|
||||||||||||||||||||
| |
| Phenotypic Information (metabolism pathway, cancer, disease, phenome) |
| |
| |
| Gene-Gene Network Information: Co-Expression Network, Interacting Genes & KEGG |
| |
|


| Gene Summary for PNLIPRP2 |
| Basic gene info. | Gene symbol | PNLIPRP2 |
| Gene name | pancreatic lipase-related protein 2 | |
| Synonyms | PLRP2 | |
| Cytomap | UCSC genome browser: 10q25.3 | |
| Genomic location | chr10 :118380464-118404654 | |
| Type of gene | protein-coding | |
| RefGenes | NM_005396.4, NR_103727.1, | |
| Ensembl id | ENSG00000266200 | |
| Description | PL-RP2galactolipase | |
| Modification date | 20141207 | |
| dbXrefs | MIM : 604423 | |
| HGNC : HGNC | ||
| Ensembl : ENSG00000266200 | ||
| HPRD : 05110 | ||
| Vega : OTTHUMG00000181599 | ||
| Protein | UniProt: P54317 go to UniProt's Cross Reference DB Table | |
| Expression | CleanEX: HS_PNLIPRP2 | |
| BioGPS: 5408 | ||
| Gene Expression Atlas: ENSG00000266200 | ||
| The Human Protein Atlas: ENSG00000266200 | ||
| Pathway | NCI Pathway Interaction Database: PNLIPRP2 | |
| KEGG: PNLIPRP2 | ||
| REACTOME: PNLIPRP2 | ||
| ConsensusPathDB | ||
| Pathway Commons: PNLIPRP2 | ||
| Metabolism | MetaCyc: PNLIPRP2 | |
| HUMANCyc: PNLIPRP2 | ||
| Regulation | Ensembl's Regulation: ENSG00000266200 | |
| miRBase: chr10 :118,380,464-118,404,654 | ||
| TargetScan: NM_005396 | ||
| cisRED: ENSG00000266200 | ||
| Context | iHOP: PNLIPRP2 | |
| cancer metabolism search in PubMed: PNLIPRP2 | ||
| UCL Cancer Institute: PNLIPRP2 | ||
| Assigned class in ccmGDB | A - This gene has a literature evidence and it belongs to cancer gene. | |
| References showing role of PNLIPRP2 in cancer cell metabolism | 1. Zhang G, He P, Tan H, Budhu A, Gaedcke J, et al. (2013) Integration of metabolomics and transcriptomics revealed a fatty acid network exerting growth inhibitory effects in human pancreatic cancer. Clinical cancer research 19: 4983-4993. go to article | |
| Top |
| Phenotypic Information for PNLIPRP2(metabolism pathway, cancer, disease, phenome) |
| Cancer | CGAP: PNLIPRP2 |
| Familial Cancer Database: PNLIPRP2 | |
| * This gene is included in those cancer gene databases. |
|
|
|
|
|
| . | ||||||||||||||
Oncogene 1 | Significant driver gene in | |||||||||||||||||||
| cf) number; DB name 1 Oncogene; http://nar.oxfordjournals.org/content/35/suppl_1/D721.long, 2 Tumor Suppressor gene; https://bioinfo.uth.edu/TSGene/, 3 Cancer Gene Census; http://www.nature.com/nrc/journal/v4/n3/abs/nrc1299.html, 4 CancerGenes; http://nar.oxfordjournals.org/content/35/suppl_1/D721.long, 5 Network of Cancer Gene; http://ncg.kcl.ac.uk/index.php, 1Therapeutic Vulnerabilities in Cancer; http://cbio.mskcc.org/cancergenomics/statius/ |
| KEGG_GLYCEROLIPID_METABOLISM REACTOME_METABOLISM_OF_LIPIDS_AND_LIPOPROTEINS | |
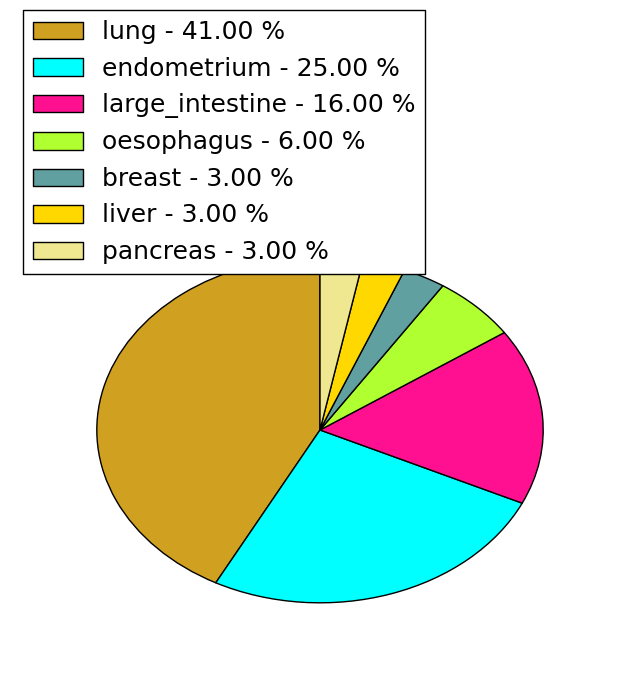
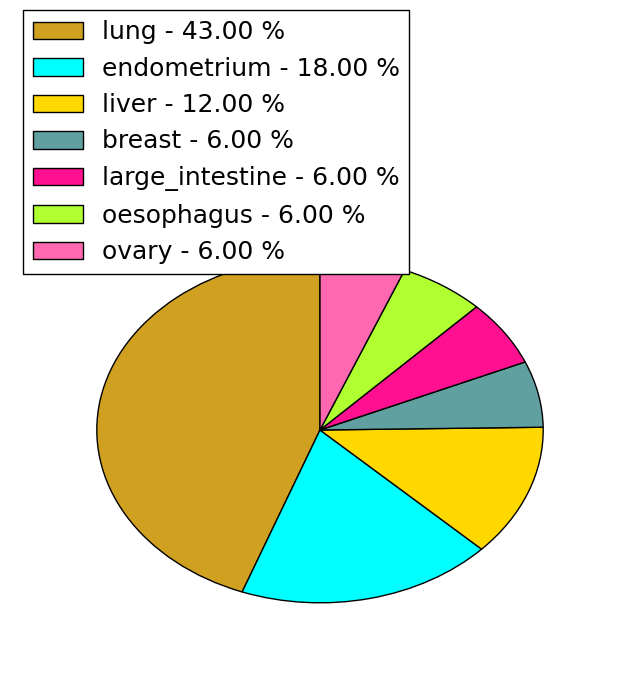
| Mutations for PNLIPRP2 |
| * Under tables are showing count per each tissue to give us broad intuition about tissue specific mutation patterns.You can go to the detailed page for each mutation database's web site. |
| There's no structural variation information in COSMIC data for this gene. |
| * From mRNA Sanger sequences, Chitars2.0 arranged chimeric transcripts. This table shows PNLIPRP2 related fusion information. |
| ID | Head Gene | Tail Gene | Accession | Gene_a | qStart_a | qEnd_a | Chromosome_a | tStart_a | tEnd_a | Gene_a | qStart_a | qEnd_a | Chromosome_a | tStart_a | tEnd_a |
| Top |
| There's no copy number variation information in COSMIC data for this gene. |
| Top |
|
 |
| Top |
| Stat. for Non-Synonymous SNVs (# total SNVs=31) | (# total SNVs=16) |
 |  |
(# total SNVs=1) | (# total SNVs=0) |
 |
| Top |
| * When you move the cursor on each content, you can see more deailed mutation information on the Tooltip. Those are primary_site,primary_histology,mutation(aa),pubmedID. |
| GRCh37 position | Mutation(aa) | Unique sampleID count |
| chr10:118386478-118386478 | p.A145V | 3 |
| chr10:118386491-118386491 | p.F149L | 2 |
| chr10:118404543-118404543 | p.? | 2 |
| chr10:118396421-118396421 | p.F354F | 2 |
| chr10:118404581-118404581 | p.N460N | 2 |
| chr10:118385499-118385499 | p.F83I | 2 |
| chr10:118383471-118383471 | p.Y22S | 1 |
| chr10:118389529-118389529 | p.V218A | 1 |
| chr10:118385511-118385511 | p.R87C | 1 |
| chr10:118394431-118394431 | p.F299F | 1 |
| Top |
|
 |
| Point Mutation/ Tissue ID | 1 | 2 | 3 | 4 | 5 | 6 | 7 | 8 | 9 | 10 | 11 | 12 | 13 | 14 | 15 | 16 | 17 | 18 | 19 | 20 |
| # sample | ||||||||||||||||||||
| # mutation | ||||||||||||||||||||
| nonsynonymous SNV | ||||||||||||||||||||
| synonymous SNV |
| cf) Tissue ID; Tissue type (1; BLCA[Bladder Urothelial Carcinoma], 2; BRCA[Breast invasive carcinoma], 3; CESC[Cervical squamous cell carcinoma and endocervical adenocarcinoma], 4; COAD[Colon adenocarcinoma], 5; GBM[Glioblastoma multiforme], 6; Glioma Low Grade, 7; HNSC[Head and Neck squamous cell carcinoma], 8; KICH[Kidney Chromophobe], 9; KIRC[Kidney renal clear cell carcinoma], 10; KIRP[Kidney renal papillary cell carcinoma], 11; LAML[Acute Myeloid Leukemia], 12; LUAD[Lung adenocarcinoma], 13; LUSC[Lung squamous cell carcinoma], 14; OV[Ovarian serous cystadenocarcinoma ], 15; PAAD[Pancreatic adenocarcinoma], 16; PRAD[Prostate adenocarcinoma], 17; SKCM[Skin Cutaneous Melanoma], 18:STAD[Stomach adenocarcinoma], 19:THCA[Thyroid carcinoma], 20:UCEC[Uterine Corpus Endometrial Carcinoma]) |
| Top |
| * We represented just top 10 SNVs. When you move the cursor on each content, you can see more deailed mutation information on the Tooltip. Those are primary_site, primary_histology, mutation(aa), pubmedID. |
| Genomic Position | Mutation(aa) | Unique sampleID count |
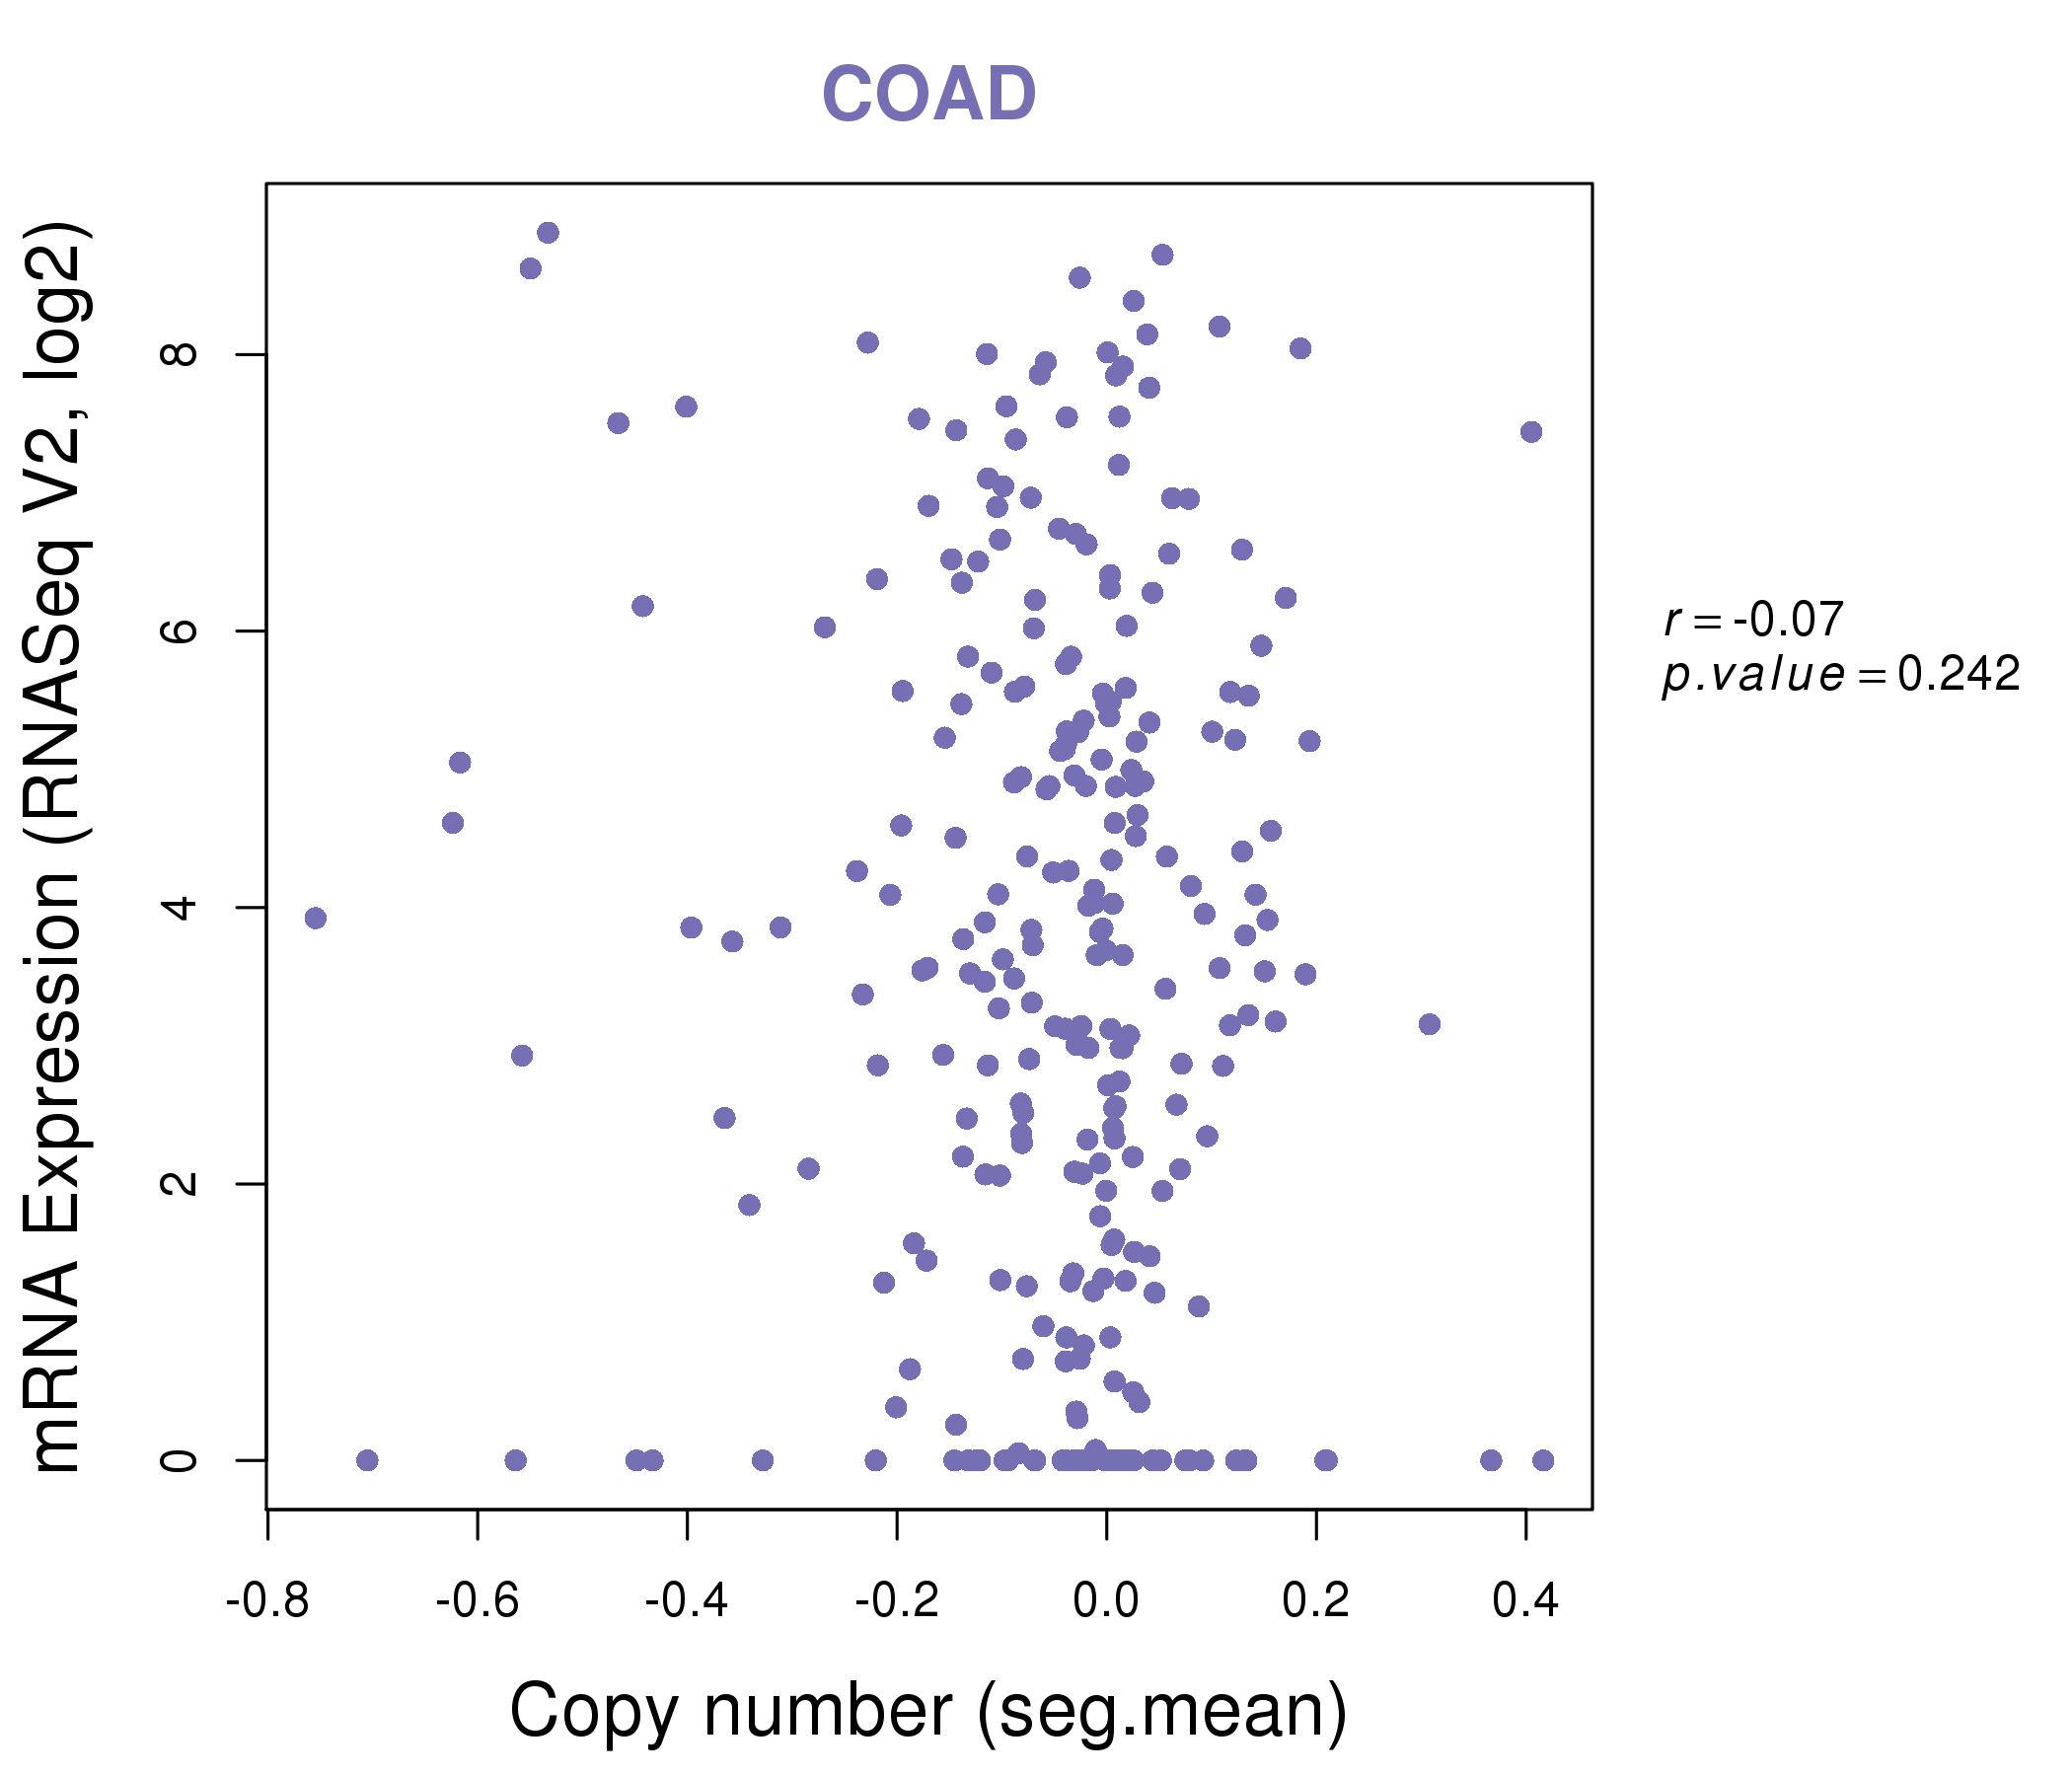
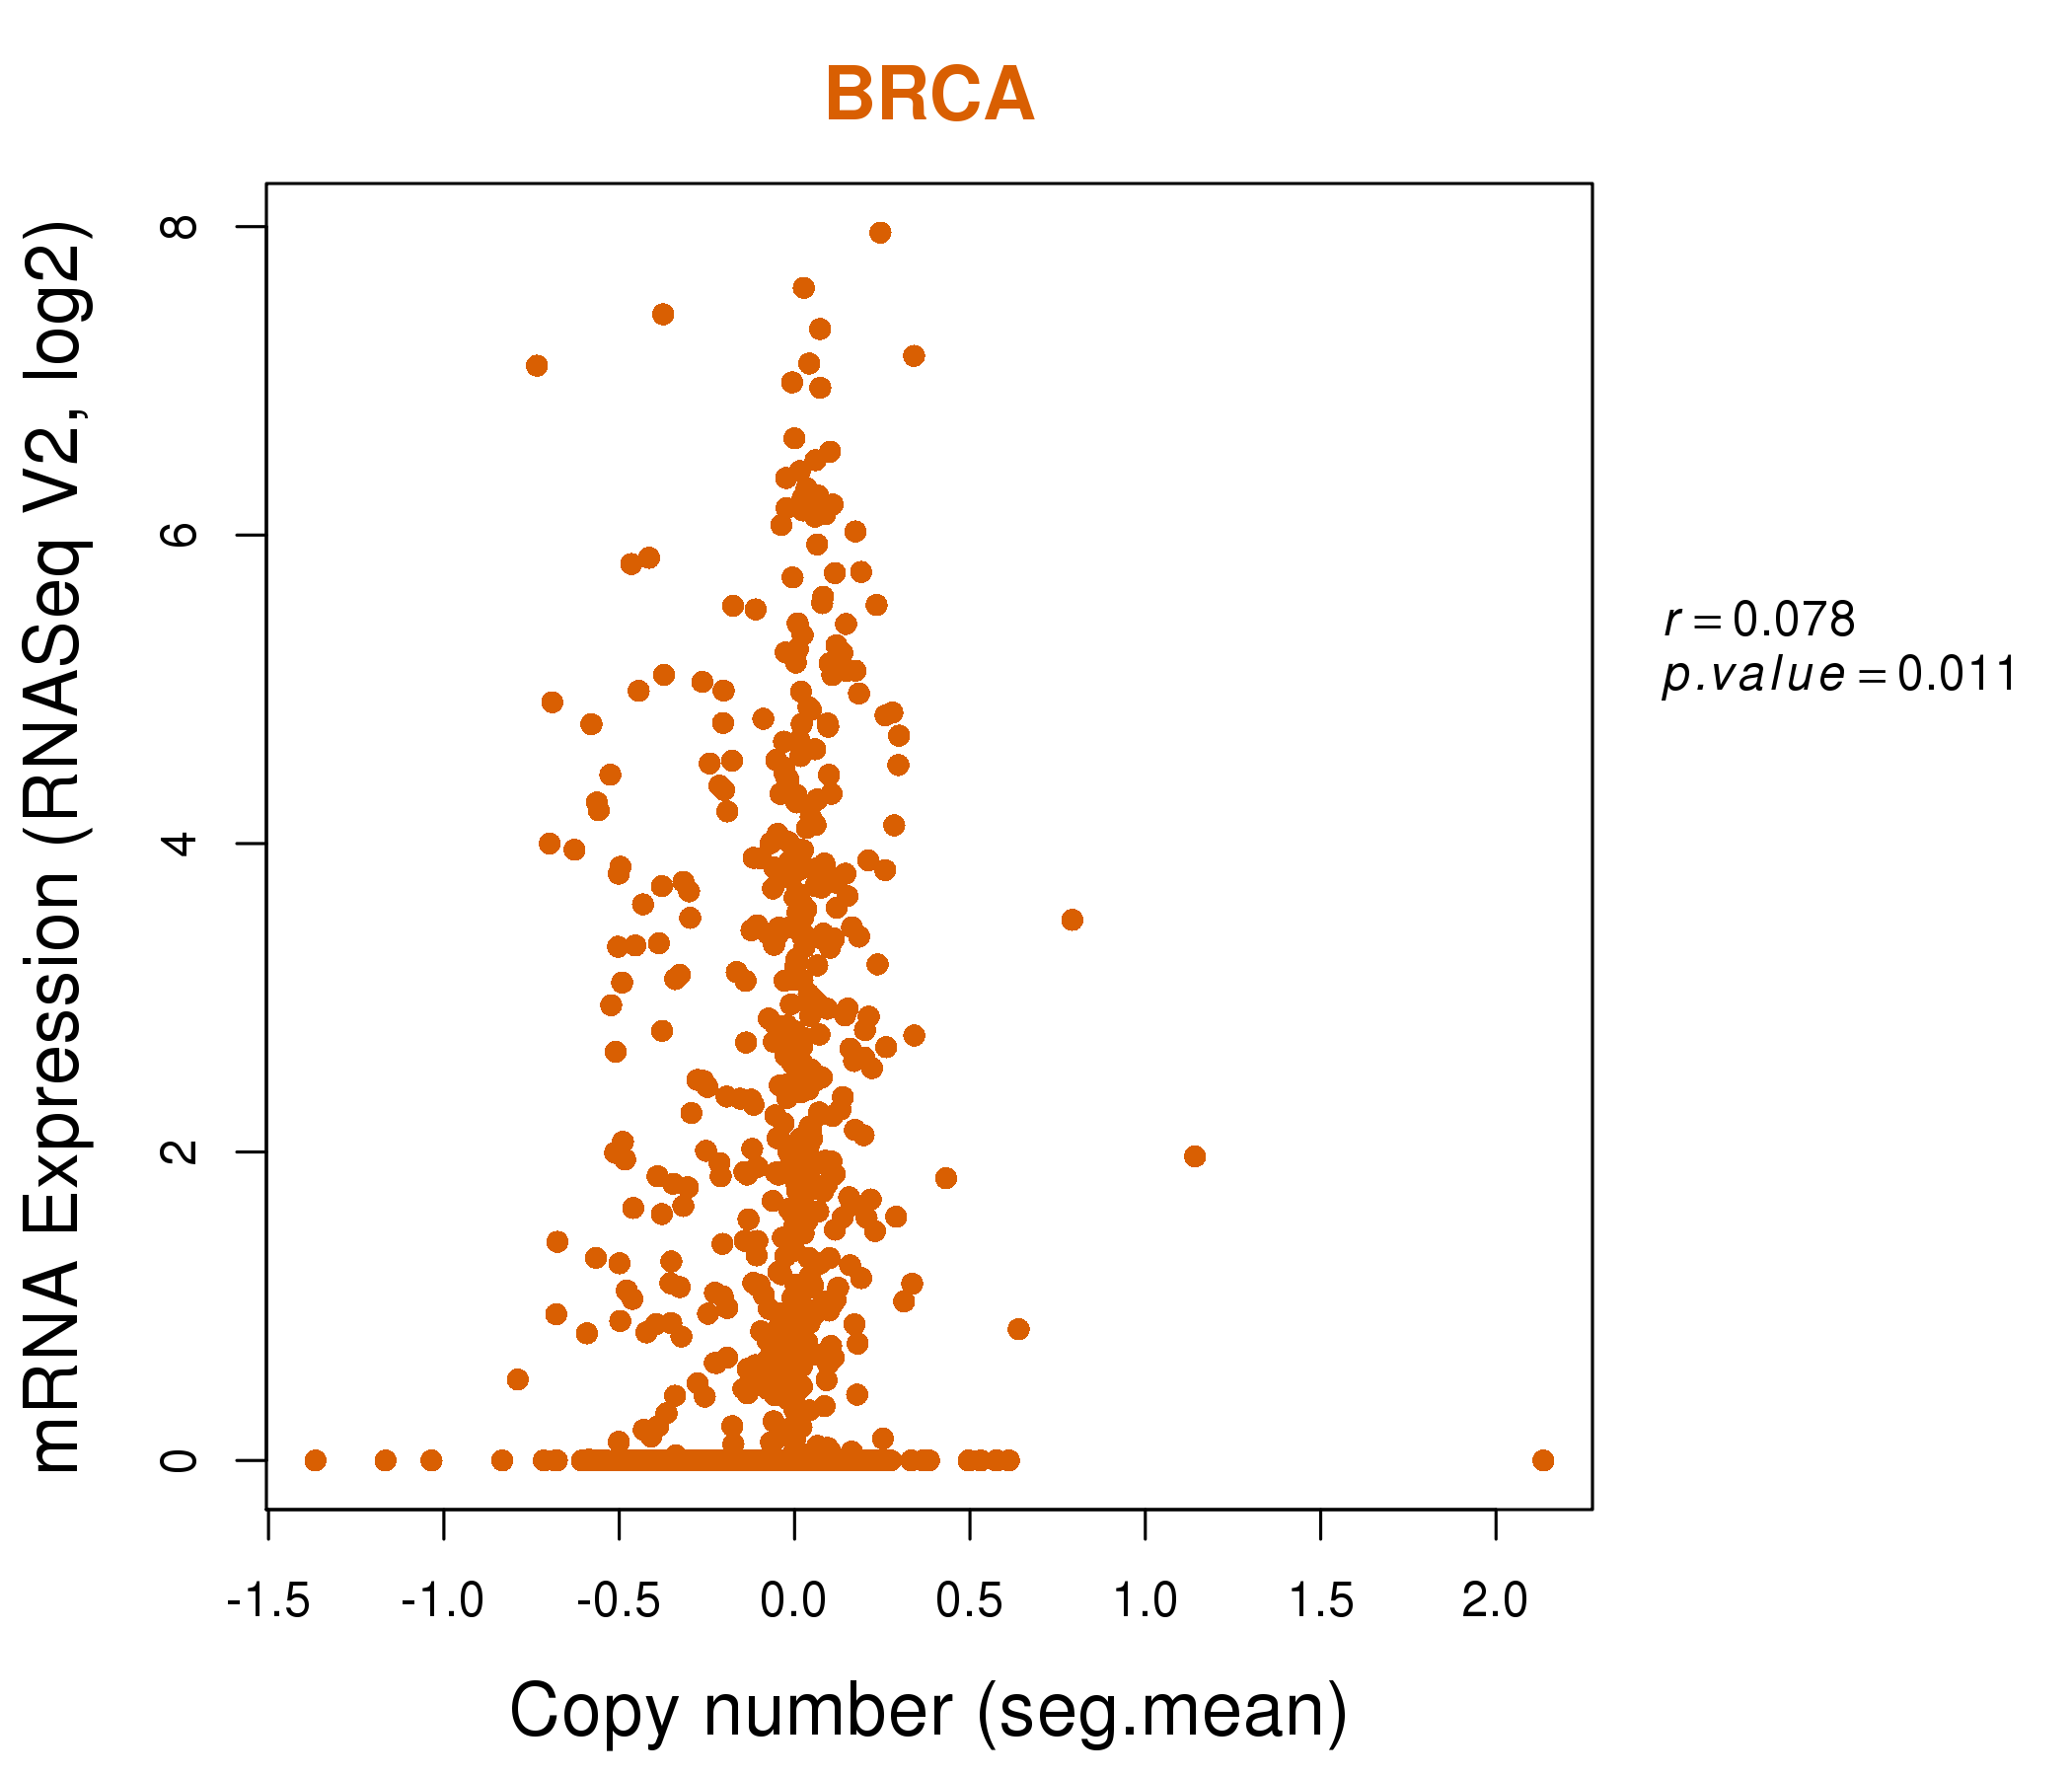
| * Copy number data were extracted from TCGA using R package TCGA-Assembler. The URLs of all public data files on TCGA DCC data server were gathered on Jan-05-2015. Function ProcessCNAData in TCGA-Assembler package was used to obtain gene-level copy number value which is calculated as the average copy number of the genomic region of a gene. |
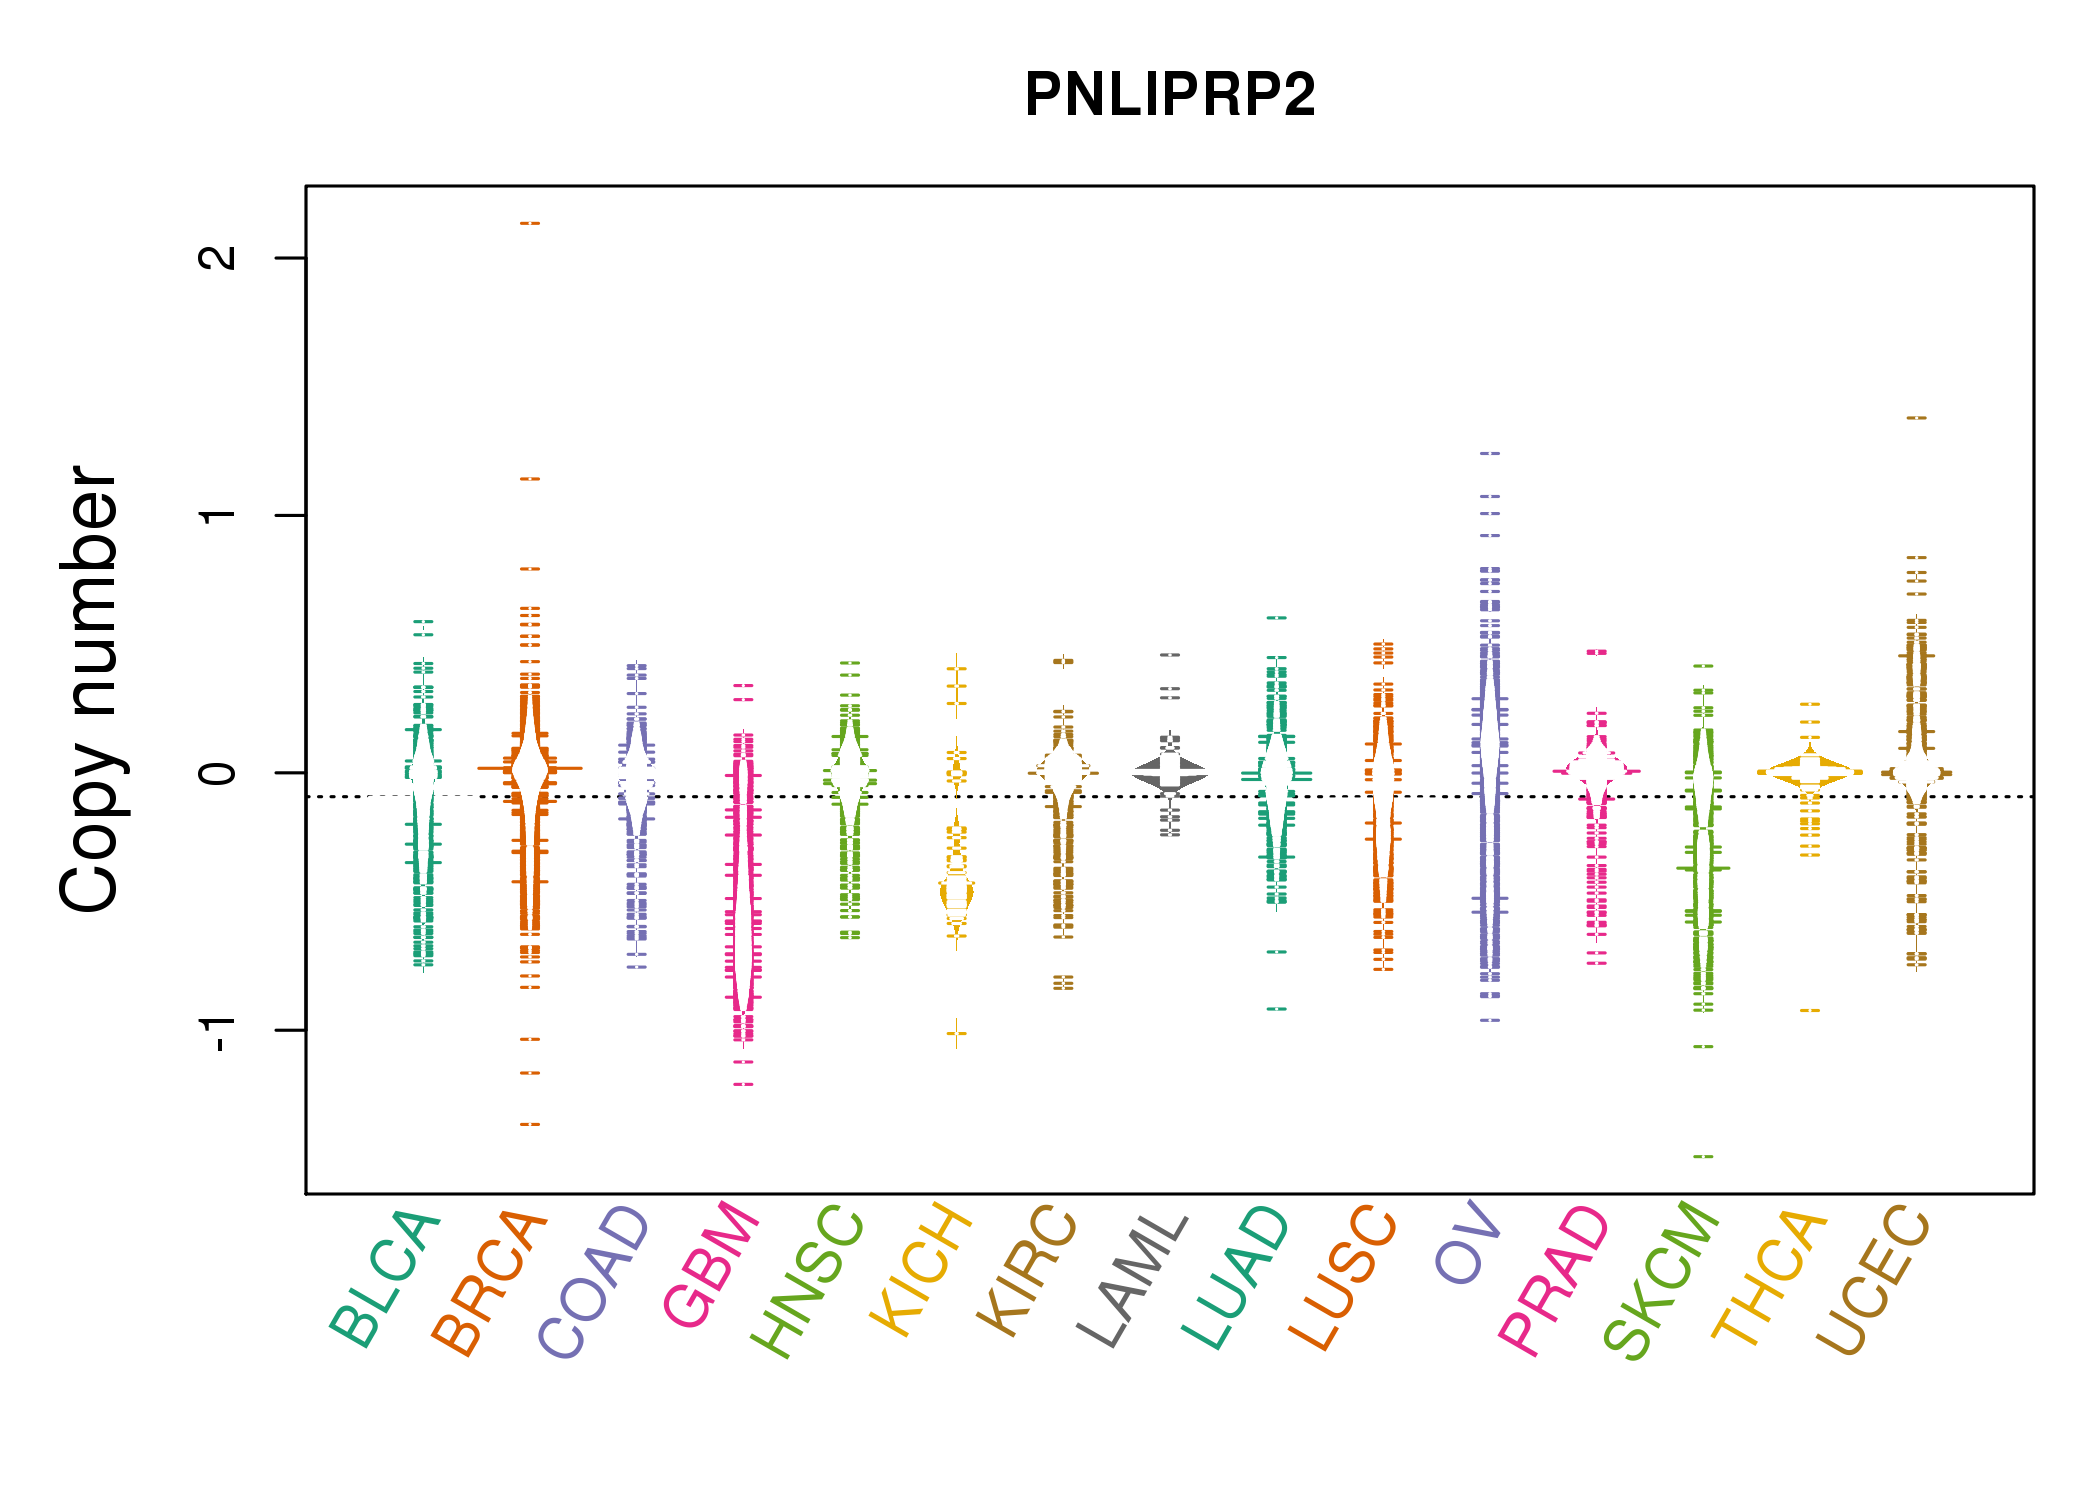 |
| cf) Tissue ID[Tissue type]: BLCA[Bladder Urothelial Carcinoma], BRCA[Breast invasive carcinoma], CESC[Cervical squamous cell carcinoma and endocervical adenocarcinoma], COAD[Colon adenocarcinoma], GBM[Glioblastoma multiforme], Glioma Low Grade, HNSC[Head and Neck squamous cell carcinoma], KICH[Kidney Chromophobe], KIRC[Kidney renal clear cell carcinoma], KIRP[Kidney renal papillary cell carcinoma], LAML[Acute Myeloid Leukemia], LUAD[Lung adenocarcinoma], LUSC[Lung squamous cell carcinoma], OV[Ovarian serous cystadenocarcinoma ], PAAD[Pancreatic adenocarcinoma], PRAD[Prostate adenocarcinoma], SKCM[Skin Cutaneous Melanoma], STAD[Stomach adenocarcinoma], THCA[Thyroid carcinoma], UCEC[Uterine Corpus Endometrial Carcinoma] |
| Top |
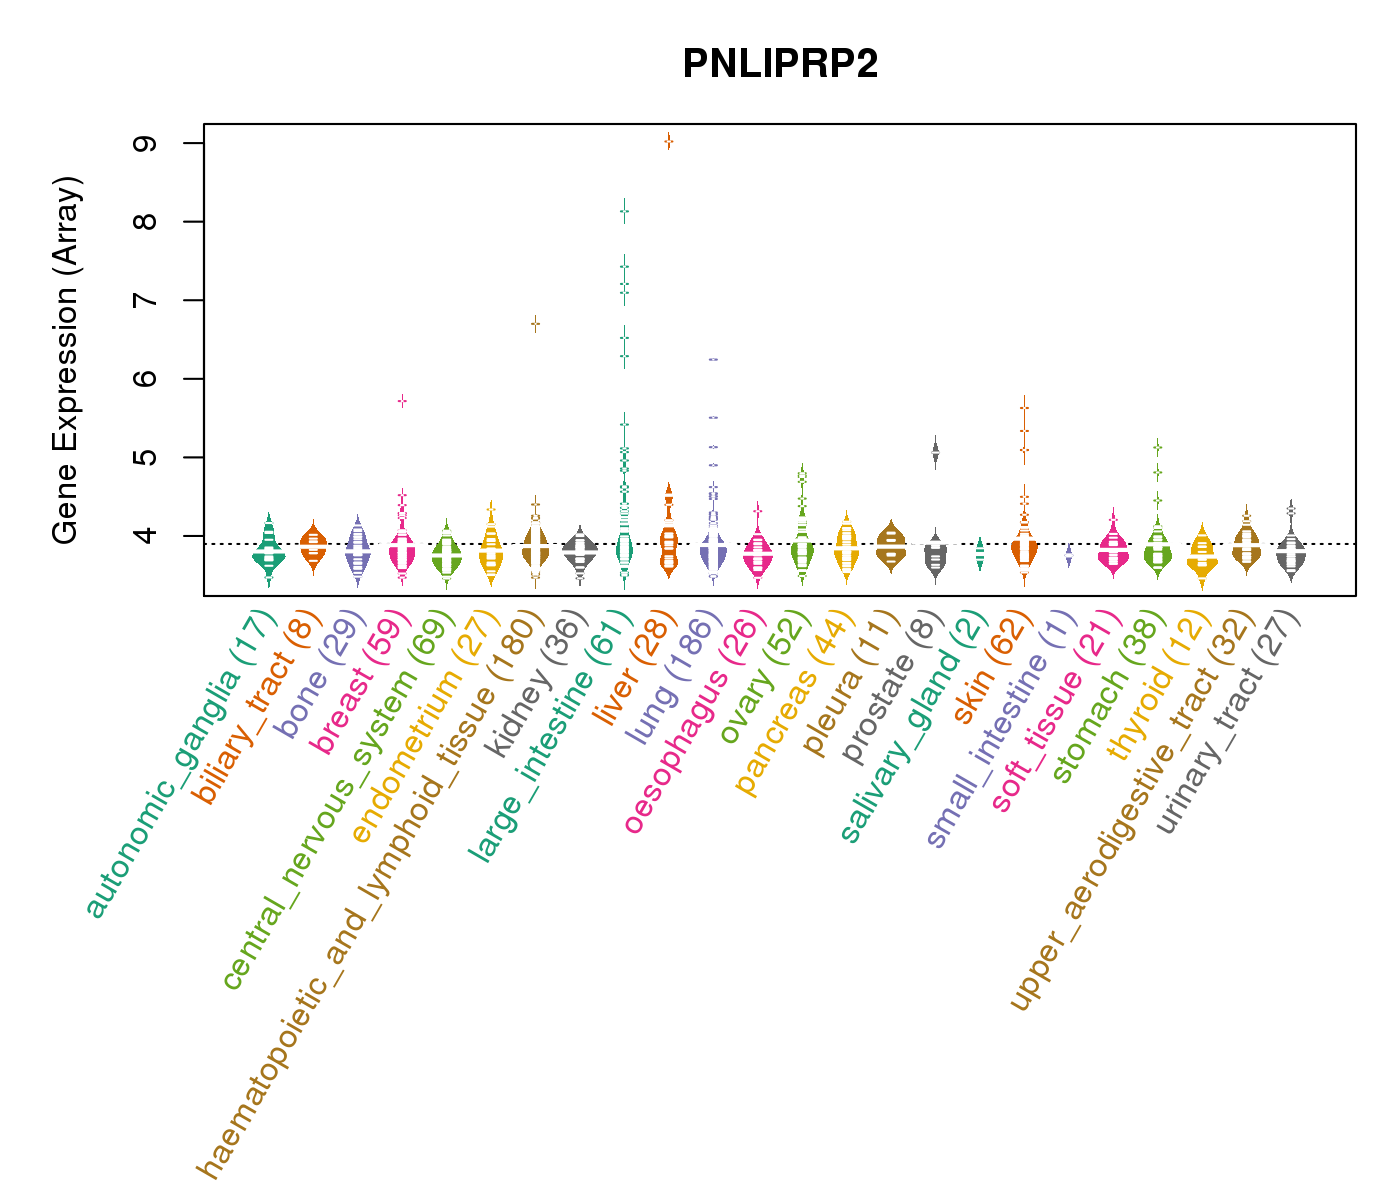
| Gene Expression for PNLIPRP2 |
| * CCLE gene expression data were extracted from CCLE_Expression_Entrez_2012-10-18.res: Gene-centric RMA-normalized mRNA expression data. |
 |
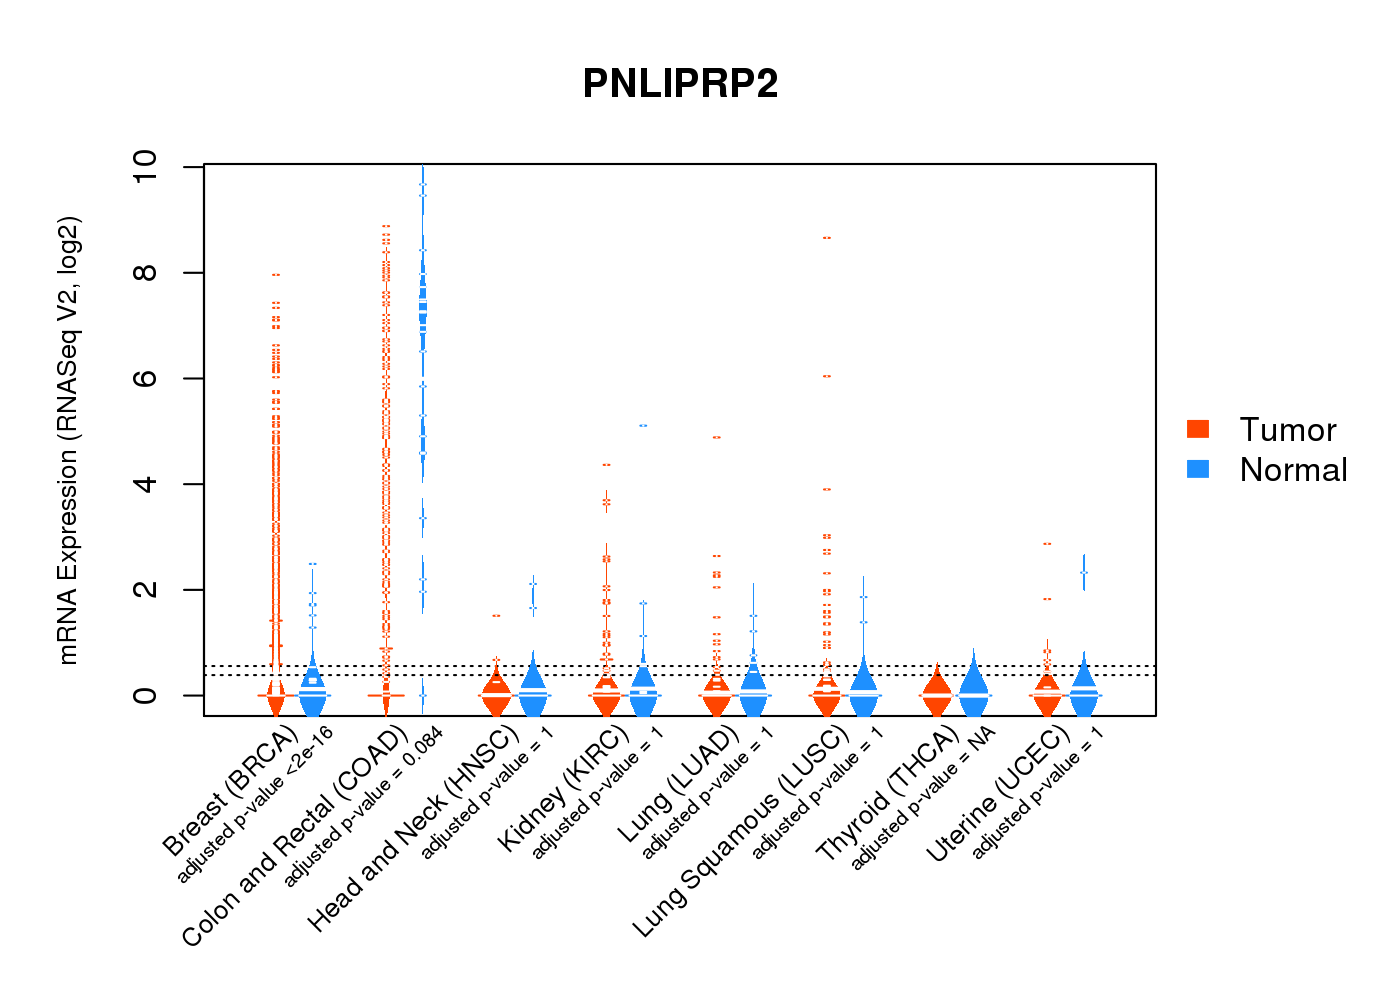
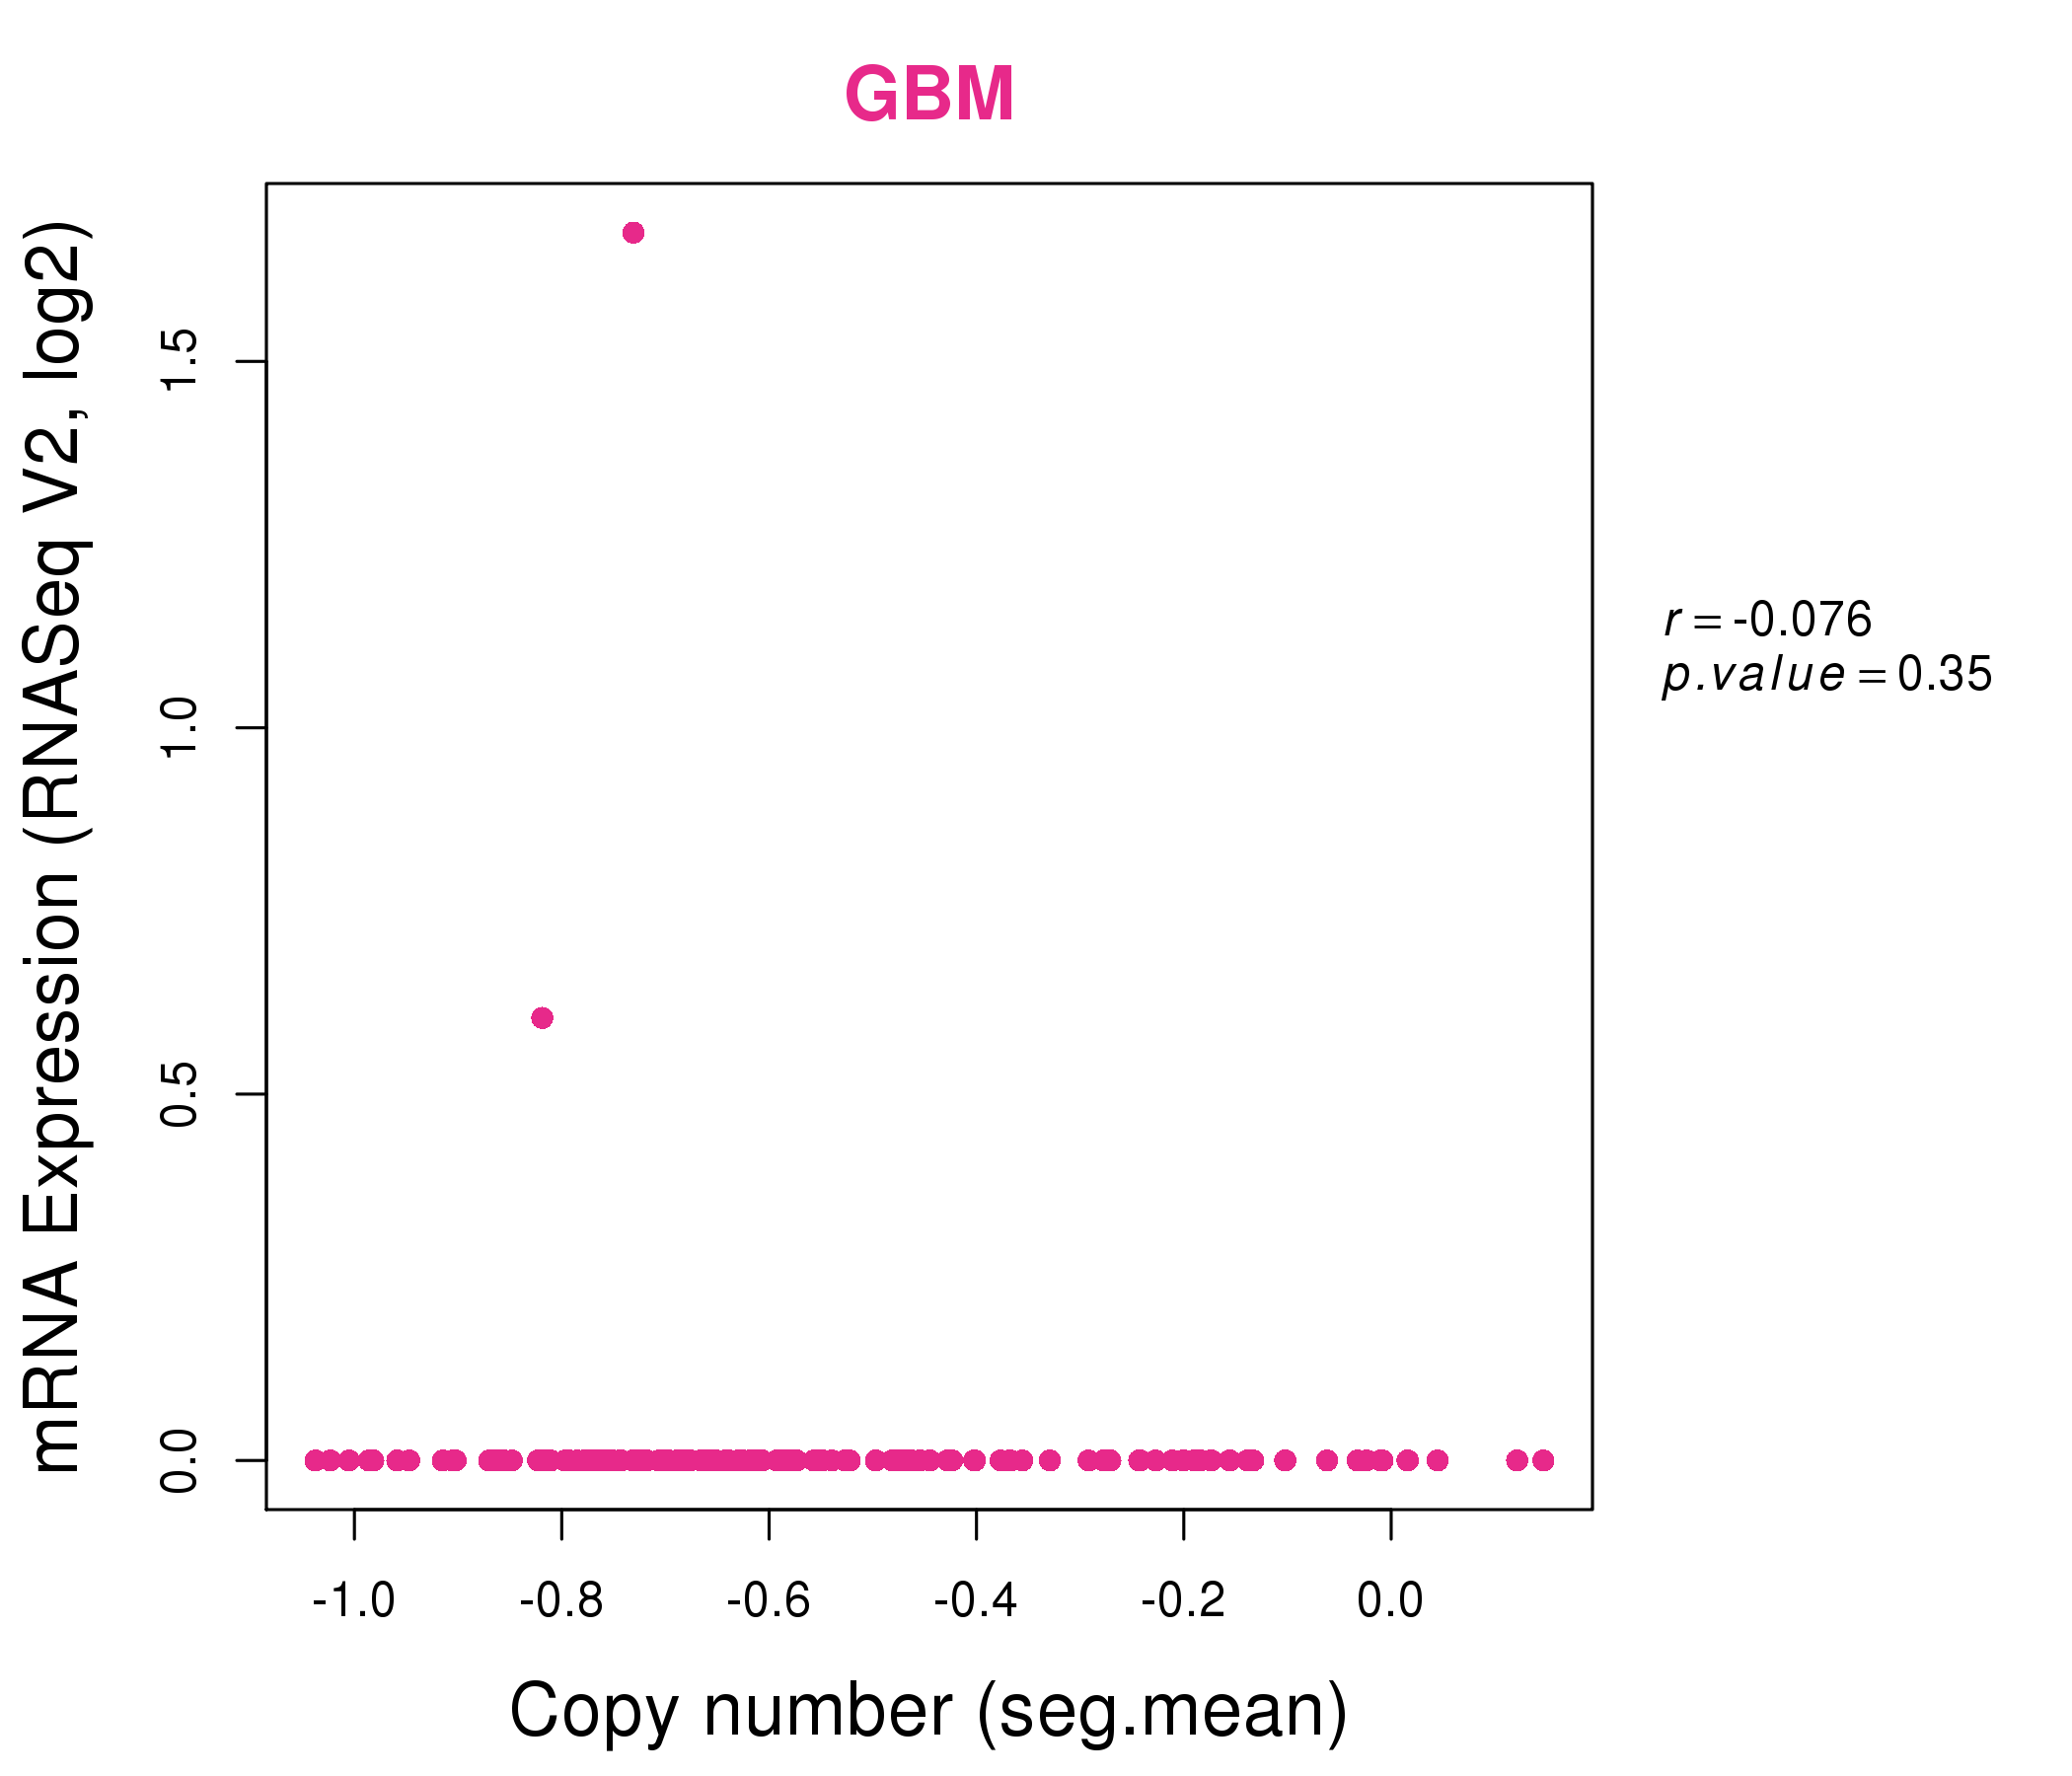
| * Normalized gene expression data of RNASeqV2 was extracted from TCGA using R package TCGA-Assembler. The URLs of all public data files on TCGA DCC data server were gathered at Jan-05-2015. Only eight cancer types have enough normal control samples for differential expression analysis. (t test, adjusted p<0.05 (using Benjamini-Hochberg FDR)) |
 |
| Top |
| * This plots show the correlation between CNV and gene expression. |
: Open all plots for all cancer types
 |
|
 |
|
| Top |
| Gene-Gene Network Information |
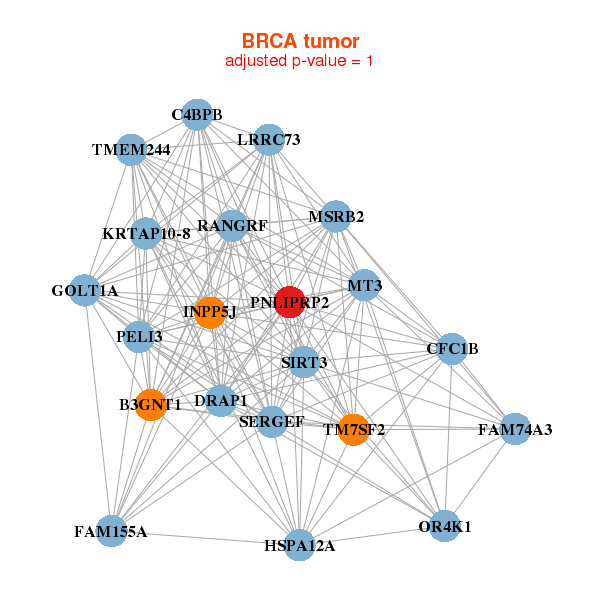
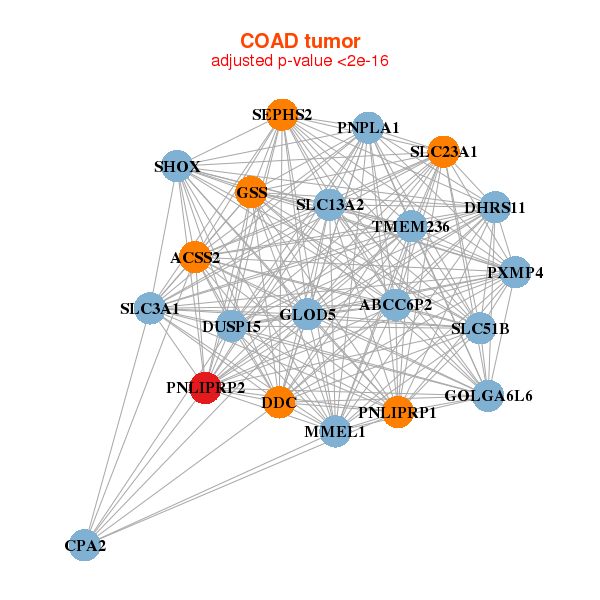
| * Co-Expression network figures were drawn using R package igraph. Only the top 20 genes with the highest correlations were shown. Red circle: input gene, orange circle: cell metabolism gene, sky circle: other gene |
: Open all plots for all cancer types
 |
| ||||
| B3GNT1,C4BPB,LRRC73,TMEM244,CFC1B,DRAP1,FAM155A, FAM74A3,GOLT1A,HSPA12A,INPP5J,KRTAP10-8,MSRB2,MT3, OR4K1,PELI3,PNLIPRP2,RANGRF,SERGEF,SIRT3,TM7SF2 | AKAP5,ASTL,BNIPL,DCT,DYTN,ESR1,FAM47A, FGF3,IGDCC3,KRTAP5-8,LUZP2,NCAM2,NDP,OR4M1, PNLIPRP2,POF1B,SMCP,SPATA19,SPOCK3,SULT1E1,WNT5A | ||||
 |
| ||||
| ABCC6P2,ACSS2,CPA2,DDC,DHRS11,DUSP15,TMEM236, GLOD5,GOLGA6L6,GSS,MMEL1,SLC51B,PNLIPRP1,PNLIPRP2, PNPLA1,PXMP4,SEPHS2,SHOX,SLC13A2,SLC23A1,SLC3A1 | ALDOC,AQP3,CCDC108,CREB3L3,DNASE1,F11,GPR112, KCNH6,KCNJ3,MLXIPL,MUC17,NR0B2,PFKFB4,PLB1, PNLIP,PNLIPRP2,PRODH,REEP6,SI,VNN1,ZNF488 |
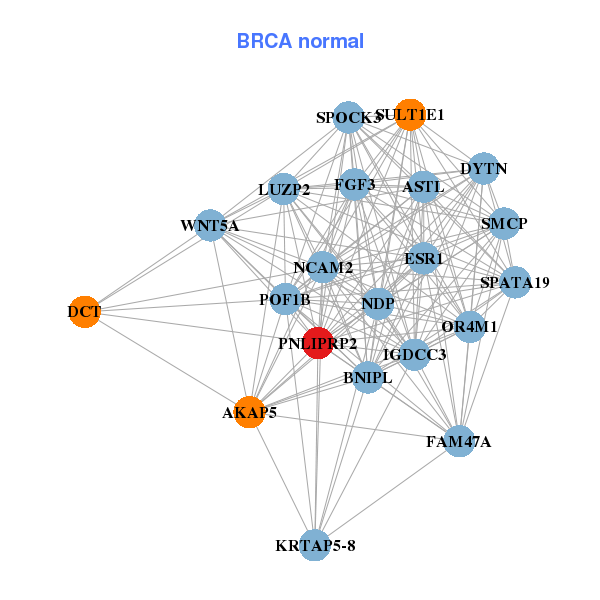
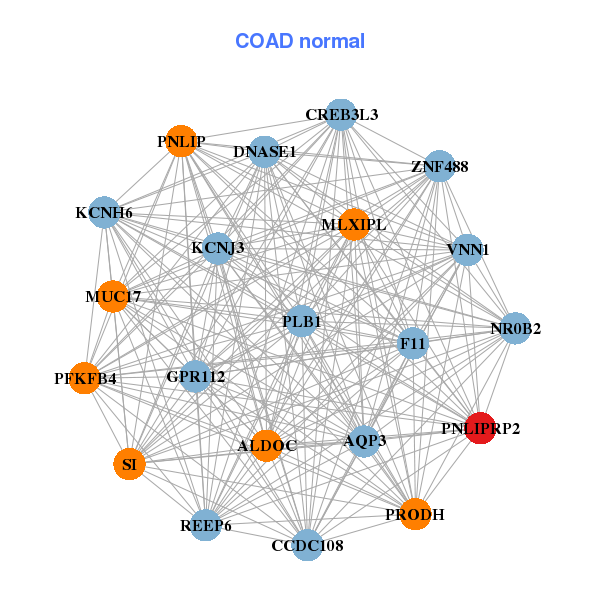
| * Co-Expression network figures were drawn using R package igraph. Only the top 20 genes with the highest correlations were shown. Red circle: input gene, orange circle: cell metabolism gene, sky circle: other gene |
: Open all plots for all cancer types
| Top |
: Open all interacting genes' information including KEGG pathway for all interacting genes from DAVID
| Top |
| Pharmacological Information for PNLIPRP2 |
| DB Category | DB Name | DB's ID and Url link |
| Chemistry | ChEMBL | CHEMBL2169728; -. |
| Organism-specific databases | PharmGKB | PA33480; -. |
| Organism-specific databases | CTD | 5408; -. |
| * Gene Centered Interaction Network. |
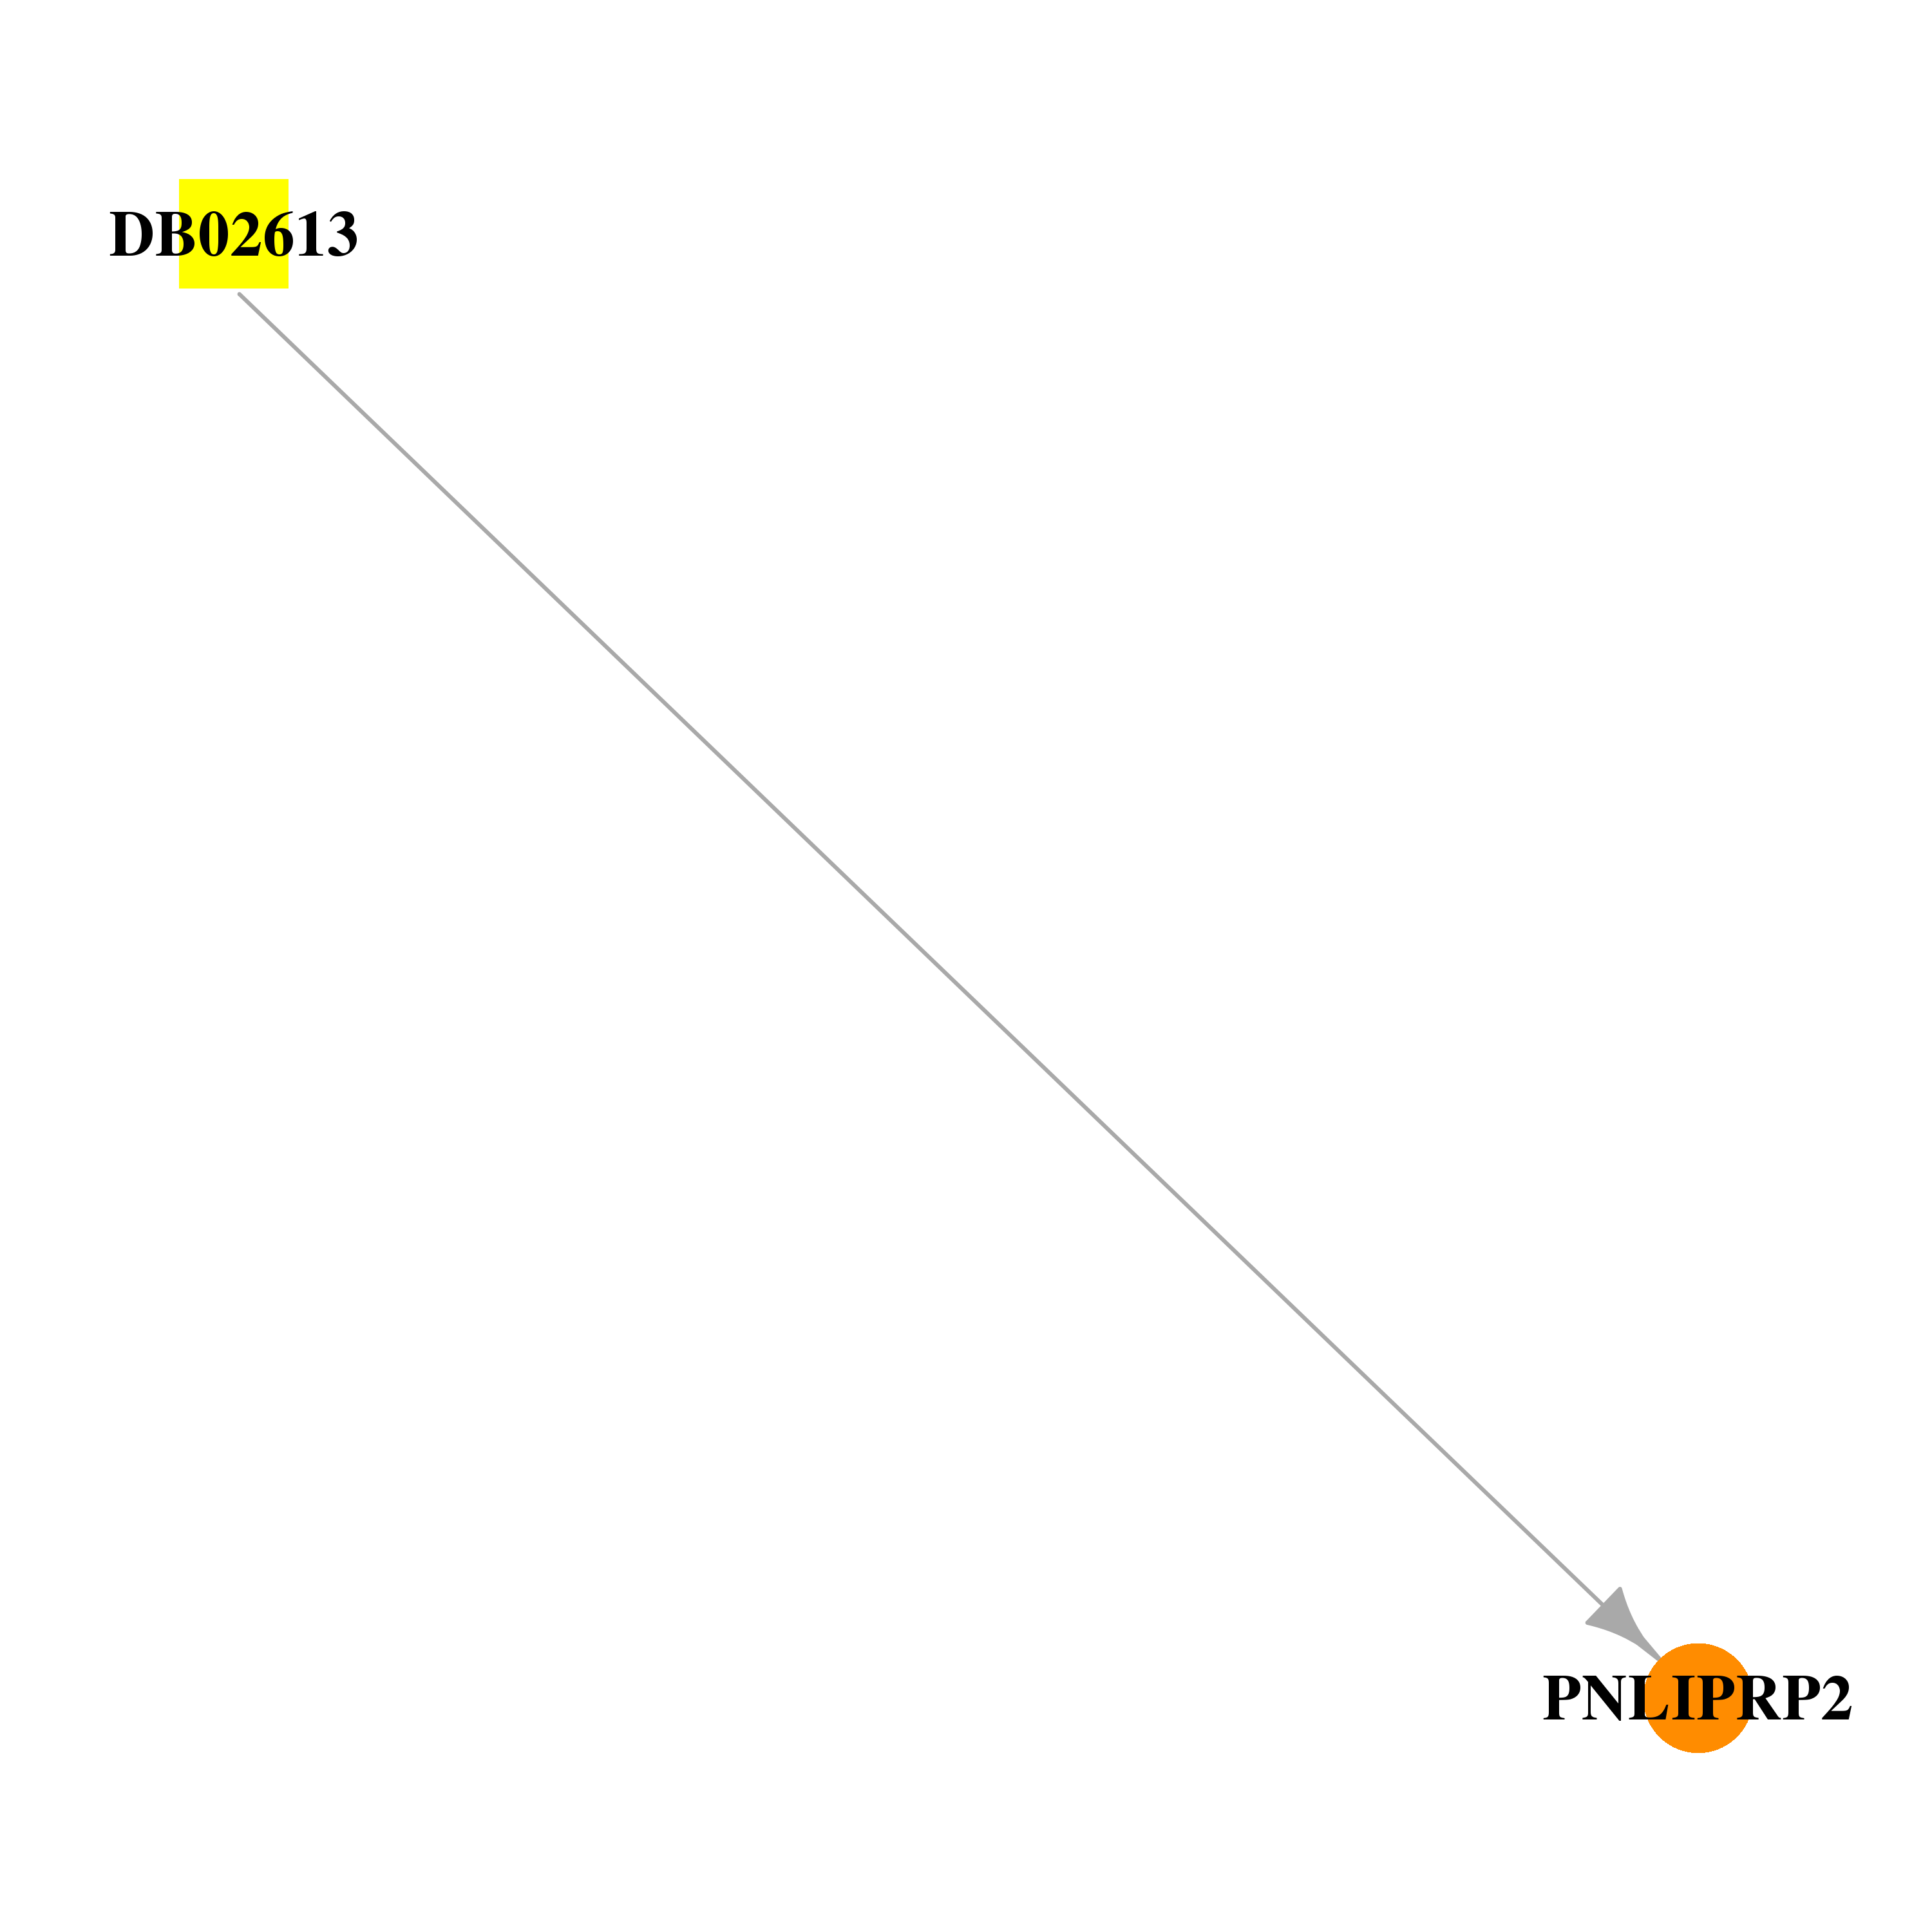 |
| * Drug Centered Interaction Network. |
| DrugBank ID | Target Name | Drug Groups | Generic Name | Drug Centered Network | Drug Structure |
| DB02613 | pancreatic lipase-related protein 2 | experimental | Decylamine-N,N-Dimethyl-N-Oxide | 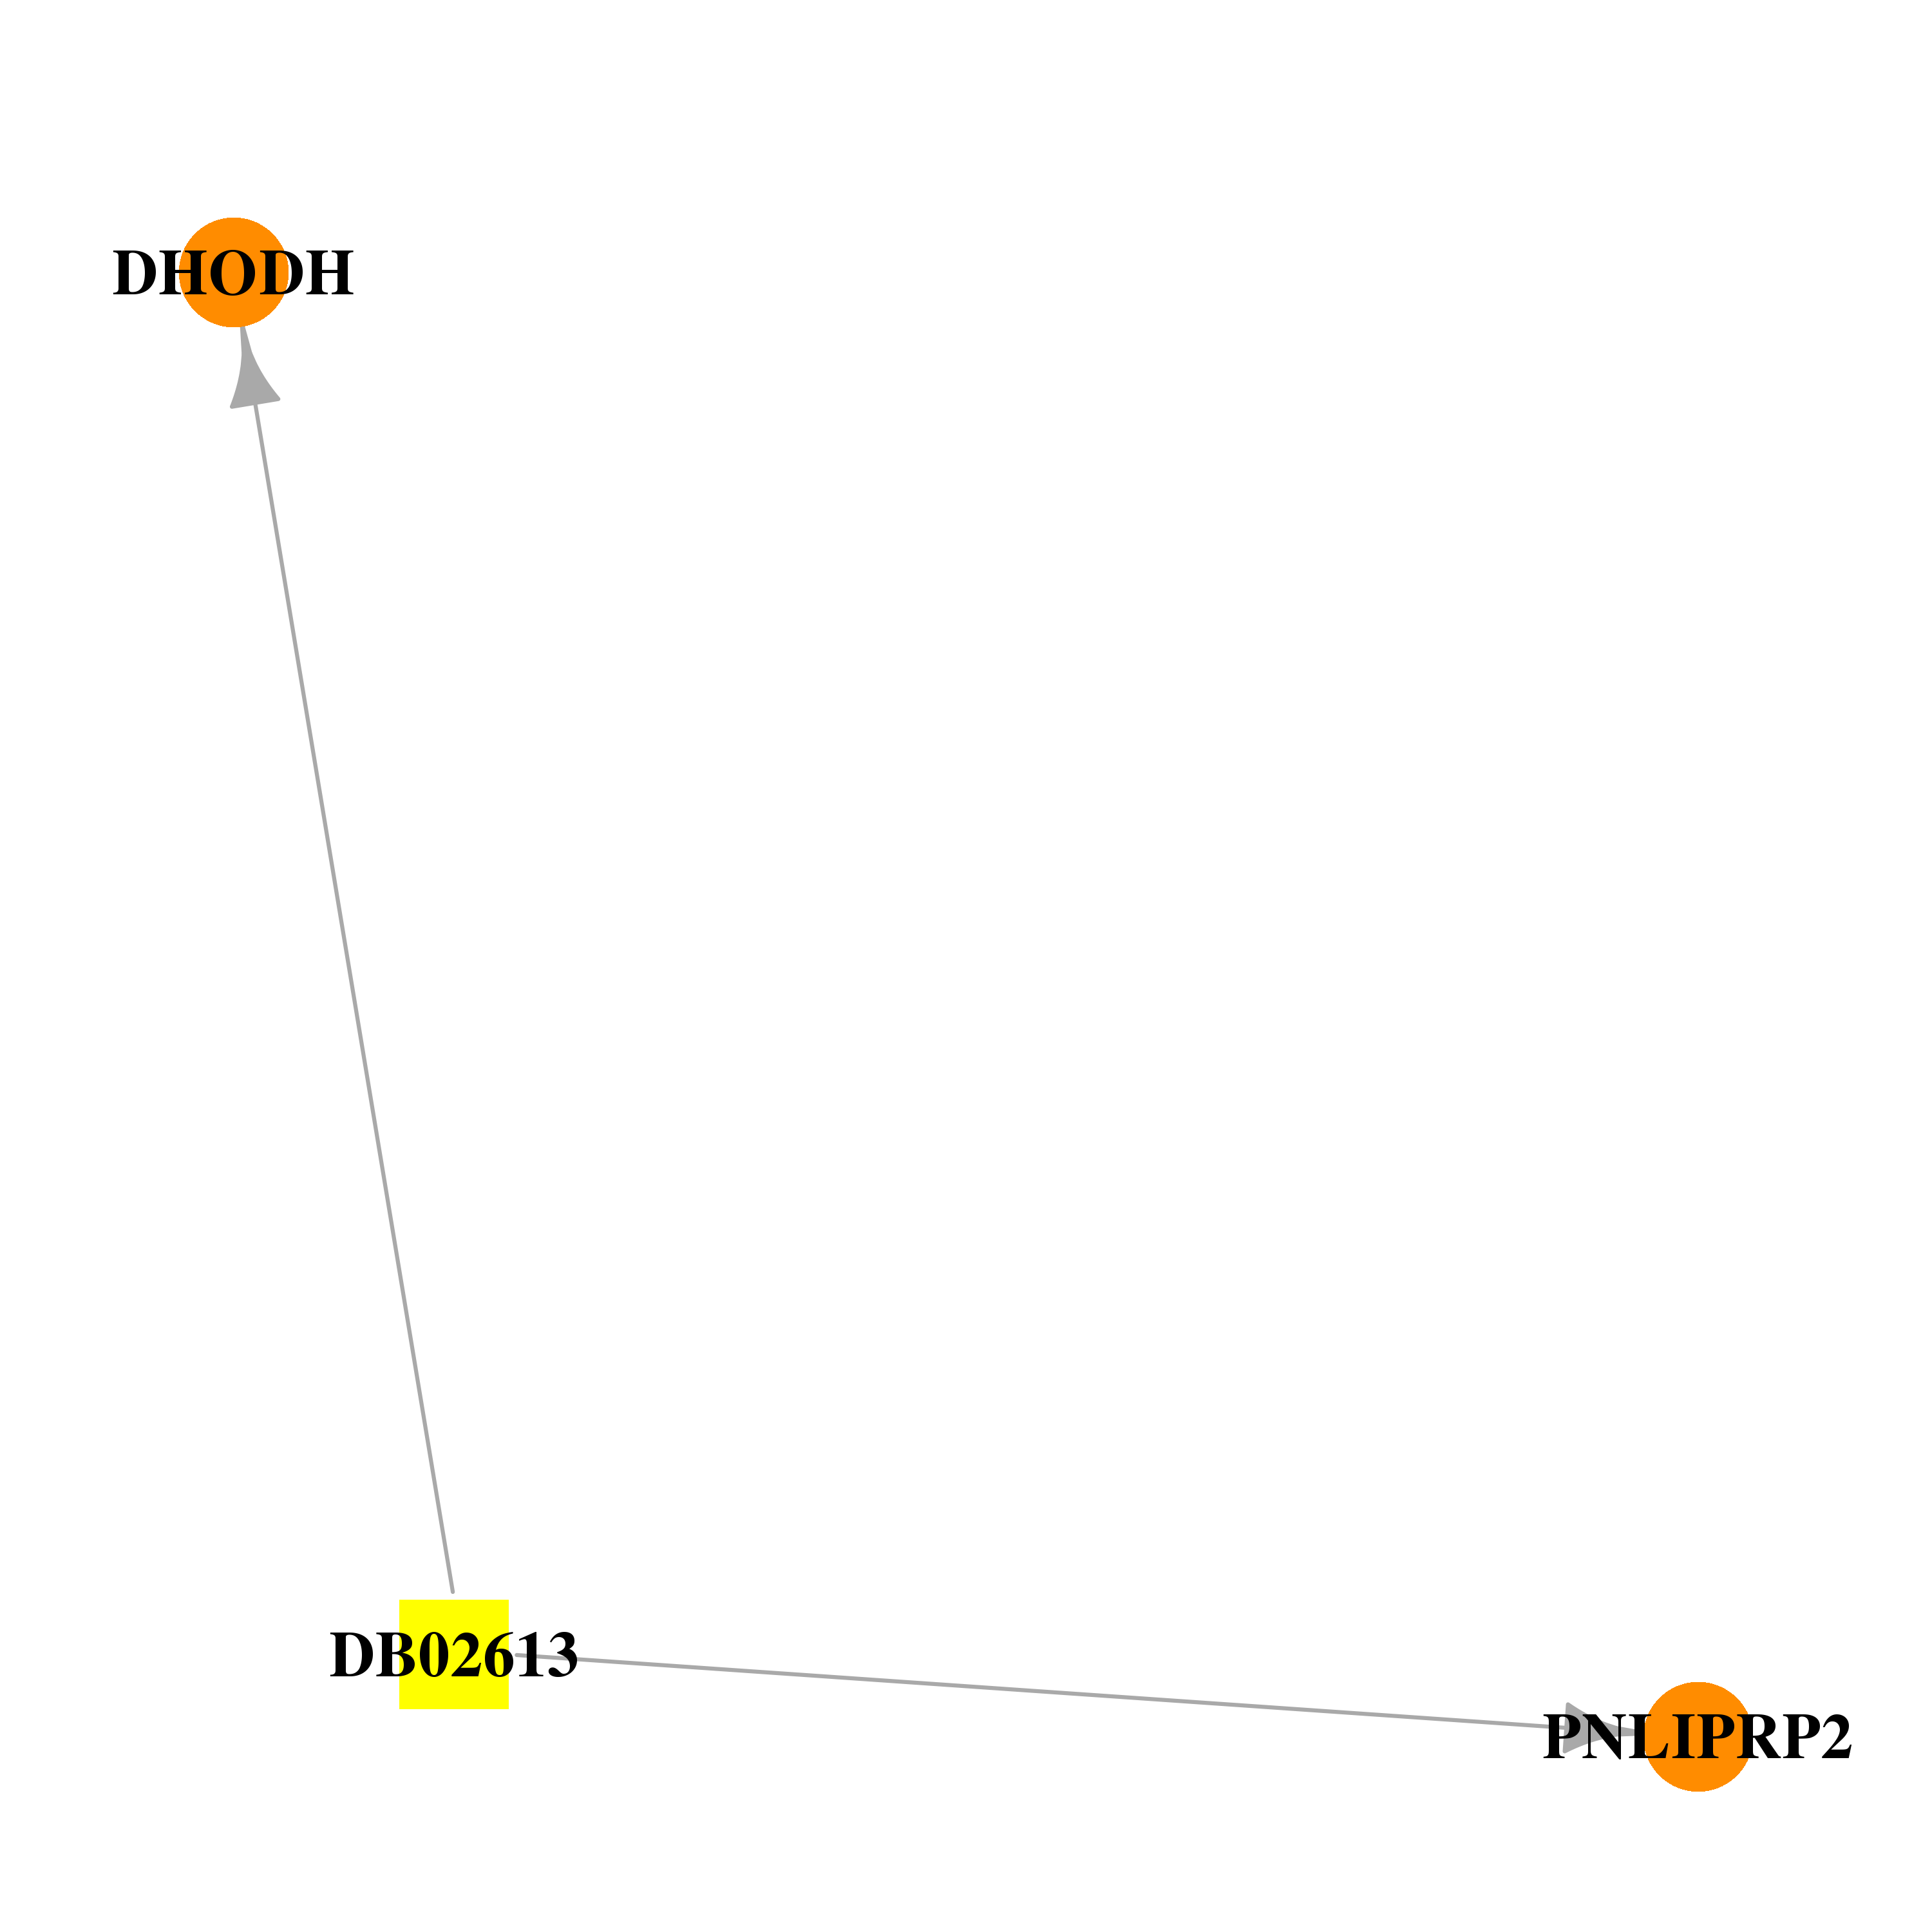 | 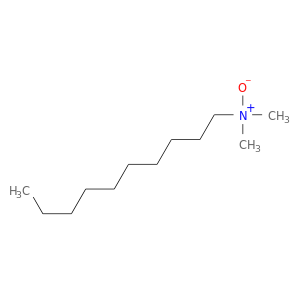 |
| Top |
| Cross referenced IDs for PNLIPRP2 |
| * We obtained these cross-references from Uniprot database. It covers 150 different DBs, 18 categories. http://www.uniprot.org/help/cross_references_section |
: Open all cross reference information
|
Copyright © 2016-Present - The Univsersity of Texas Health Science Center at Houston @ |