|
||||||||||||||||||||||||||||||||||||||||||||||||||||||||||||||||||||||||||||||||||||||||||||||||||||||||||||||||||||||||||||||||||||||||||||||||||||||||||||||||||||||||||||||||||||||||||||||||||||||||||||||||||||||||||||||||||||||||||||||||||||||||||||||||||||||||||||||||||||||||||||||||||||||||||||||||||||||||||
| |
| Phenotypic Information (metabolism pathway, cancer, disease, phenome) |
| |
| |
| Gene-Gene Network Information: Co-Expression Network, Interacting Genes & KEGG |
| |
|


| Gene Summary for NANS |
| Basic gene info. | Gene symbol | NANS |
| Gene name | N-acetylneuraminic acid synthase | |
| Synonyms | HEL-S-100|SAS | |
| Cytomap | UCSC genome browser: 9p24.1-p23 | |
| Genomic location | chr9 :100818958-100845365 | |
| Type of gene | protein-coding | |
| RefGenes | NM_018946.3, | |
| Ensembl id | ENSG00000095380 | |
| Description | N-acetylneuraminate synthaseN-acetylneuraminate-9-phosphate synthaseN-acetylneuraminic acid phosphate synthaseepididymis secretory protein Li 100sialic acid phosphate synthasesialic acid synthase | |
| Modification date | 20141207 | |
| dbXrefs | MIM : 605202 | |
| HGNC : HGNC | ||
| Ensembl : ENSG00000095380 | ||
| HPRD : 07285 | ||
| Vega : OTTHUMG00000020341 | ||
| Protein | UniProt: go to UniProt's Cross Reference DB Table | |
| Expression | CleanEX: HS_NANS | |
| BioGPS: 54187 | ||
| Gene Expression Atlas: ENSG00000095380 | ||
| The Human Protein Atlas: ENSG00000095380 | ||
| Pathway | NCI Pathway Interaction Database: NANS | |
| KEGG: NANS | ||
| REACTOME: NANS | ||
| ConsensusPathDB | ||
| Pathway Commons: NANS | ||
| Metabolism | MetaCyc: NANS | |
| HUMANCyc: NANS | ||
| Regulation | Ensembl's Regulation: ENSG00000095380 | |
| miRBase: chr9 :100,818,958-100,845,365 | ||
| TargetScan: NM_018946 | ||
| cisRED: ENSG00000095380 | ||
| Context | iHOP: NANS | |
| cancer metabolism search in PubMed: NANS | ||
| UCL Cancer Institute: NANS | ||
| Assigned class in ccmGDB | C | |
| Top |
| Phenotypic Information for NANS(metabolism pathway, cancer, disease, phenome) |
| Cancer | CGAP: NANS |
| Familial Cancer Database: NANS | |
| * This gene is included in those cancer gene databases. |
|
|
|
|
|
| . | ||||||||||||||||||||||||||||||||||||||||||||||||||||||||||||||||||||||||||||||||||||||||||||||||||||||||||||||||||||||||||||||||||||||||||||||||||||||||||||||||||||||||||||||||||||||||||||||||||||||||||||||||||||||||||||||||||||||||||||||||||||||||||||||||||||||||||||||||||||||||||||||||||||||||||||||||||||
Oncogene 1 | Significant driver gene in | |||||||||||||||||||||||||||||||||||||||||||||||||||||||||||||||||||||||||||||||||||||||||||||||||||||||||||||||||||||||||||||||||||||||||||||||||||||||||||||||||||||||||||||||||||||||||||||||||||||||||||||||||||||||||||||||||||||||||||||||||||||||||||||||||||||||||||||||||||||||||||||||||||||||||||||||||||||||||
| cf) number; DB name 1 Oncogene; http://nar.oxfordjournals.org/content/35/suppl_1/D721.long, 2 Tumor Suppressor gene; https://bioinfo.uth.edu/TSGene/, 3 Cancer Gene Census; http://www.nature.com/nrc/journal/v4/n3/abs/nrc1299.html, 4 CancerGenes; http://nar.oxfordjournals.org/content/35/suppl_1/D721.long, 5 Network of Cancer Gene; http://ncg.kcl.ac.uk/index.php, 1Therapeutic Vulnerabilities in Cancer; http://cbio.mskcc.org/cancergenomics/statius/ |
| KEGG_AMINO_SUGAR_AND_NUCLEOTIDE_SUGAR_METABOLISM | |
| OMIM | |
| Orphanet | |
| Disease | KEGG Disease: NANS |
| MedGen: NANS (Human Medical Genetics with Condition) | |
| ClinVar: NANS | |
| Phenotype | MGI: NANS (International Mouse Phenotyping Consortium) |
| PhenomicDB: NANS | |
| Mutations for NANS |
| * Under tables are showing count per each tissue to give us broad intuition about tissue specific mutation patterns.You can go to the detailed page for each mutation database's web site. |
| There's no structural variation information in COSMIC data for this gene. |
| * From mRNA Sanger sequences, Chitars2.0 arranged chimeric transcripts. This table shows NANS related fusion information. |
| ID | Head Gene | Tail Gene | Accession | Gene_a | qStart_a | qEnd_a | Chromosome_a | tStart_a | tEnd_a | Gene_a | qStart_a | qEnd_a | Chromosome_a | tStart_a | tEnd_a |
| AA421701 | NANS | 10 | 200 | 9 | 100845169 | 100845359 | LRRC41 | 196 | 522 | 1 | 46746954 | 46751256 | |
| Top |
| Mutation type/ Tissue ID | brca | cns | cerv | endome | haematopo | kidn | Lintest | liver | lung | ns | ovary | pancre | prost | skin | stoma | thyro | urina | |||
| Total # sample | 1 | |||||||||||||||||||
| GAIN (# sample) | 1 | |||||||||||||||||||
| LOSS (# sample) |
| cf) Tissue ID; Tissue type (1; Breast, 2; Central_nervous_system, 3; Cervix, 4; Endometrium, 5; Haematopoietic_and_lymphoid_tissue, 6; Kidney, 7; Large_intestine, 8; Liver, 9; Lung, 10; NS, 11; Ovary, 12; Pancreas, 13; Prostate, 14; Skin, 15; Stomach, 16; Thyroid, 17; Urinary_tract) |
| Top |
|
 |
| Top |
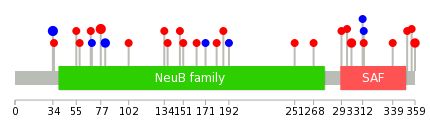
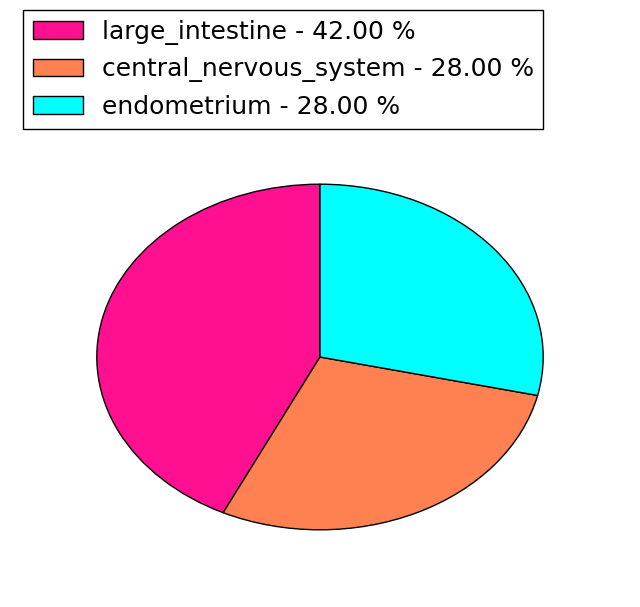
| Stat. for Non-Synonymous SNVs (# total SNVs=23) | (# total SNVs=7) |
 |  |
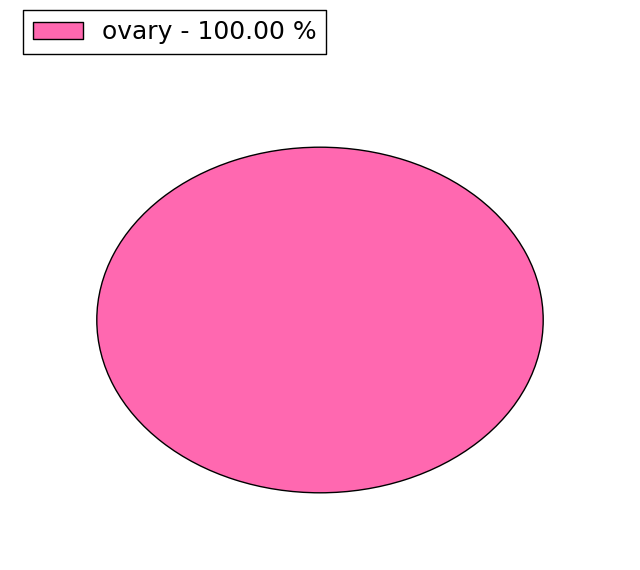
(# total SNVs=1) | (# total SNVs=0) |
 |
| Top |
| * When you move the cursor on each content, you can see more deailed mutation information on the Tooltip. Those are primary_site,primary_histology,mutation(aa),pubmedID. |
| GRCh37 position | Mutation(aa) | Unique sampleID count |
| chr9:100823160-100823160 | p.W77R | 3 |
| chr9:100819192-100819192 | p.D34D | 3 |
| chr9:100823174-100823174 | p.Y81Y | 2 |
| chr9:100845333-100845333 | p.S359F | 2 |
| chr9:100845161-100845161 | p.P302S | 2 |
| chr9:100823104-100823104 | p.L58Q | 1 |
| chr9:100840478-100840478 | p.R151H | 1 |
| chr9:100845193-100845193 | p.L312L | 1 |
| chr9:100823135-100823135 | p.E68D | 1 |
| chr9:100840514-100840514 | p.D163G | 1 |
| Top |
|
 |
| Point Mutation/ Tissue ID | 1 | 2 | 3 | 4 | 5 | 6 | 7 | 8 | 9 | 10 | 11 | 12 | 13 | 14 | 15 | 16 | 17 | 18 | 19 | 20 |
| # sample | 1 | 1 | 1 | 2 | 2 | 1 | 2 | 1 | 3 | 1 | 5 | |||||||||
| # mutation | 1 | 1 | 1 | 2 | 2 | 1 | 2 | 1 | 3 | 1 | 7 | |||||||||
| nonsynonymous SNV | 1 | 1 | 2 | 1 | 2 | 1 | 2 | 1 | 5 | |||||||||||
| synonymous SNV | 1 | 1 | 1 | 1 | 2 |
| cf) Tissue ID; Tissue type (1; BLCA[Bladder Urothelial Carcinoma], 2; BRCA[Breast invasive carcinoma], 3; CESC[Cervical squamous cell carcinoma and endocervical adenocarcinoma], 4; COAD[Colon adenocarcinoma], 5; GBM[Glioblastoma multiforme], 6; Glioma Low Grade, 7; HNSC[Head and Neck squamous cell carcinoma], 8; KICH[Kidney Chromophobe], 9; KIRC[Kidney renal clear cell carcinoma], 10; KIRP[Kidney renal papillary cell carcinoma], 11; LAML[Acute Myeloid Leukemia], 12; LUAD[Lung adenocarcinoma], 13; LUSC[Lung squamous cell carcinoma], 14; OV[Ovarian serous cystadenocarcinoma ], 15; PAAD[Pancreatic adenocarcinoma], 16; PRAD[Prostate adenocarcinoma], 17; SKCM[Skin Cutaneous Melanoma], 18:STAD[Stomach adenocarcinoma], 19:THCA[Thyroid carcinoma], 20:UCEC[Uterine Corpus Endometrial Carcinoma]) |
| Top |
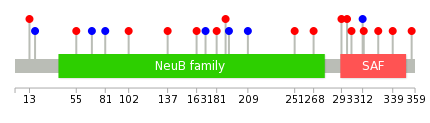
| * We represented just top 10 SNVs. When you move the cursor on each content, you can see more deailed mutation information on the Tooltip. Those are primary_site, primary_histology, mutation(aa), pubmedID. |
| Genomic Position | Mutation(aa) | Unique sampleID count |
| chr9:100823174 | p.V339A | 1 |
| chr9:100845135 | p.A102T | 1 |
| chr9:100823235 | p.K356Q | 1 |
| chr9:100845151 | p.T137I | 1 |
| chr9:100839261 | p.D163G | 1 |
| chr9:100845161 | p.I171I | 1 |
| chr9:100840514 | p.F181L | 1 |
| chr9:100845193 | p.P189Q | 1 |
| chr9:100840539 | p.P192P | 1 |
| chr9:100845195 | p.D209D | 1 |
| * Copy number data were extracted from TCGA using R package TCGA-Assembler. The URLs of all public data files on TCGA DCC data server were gathered on Jan-05-2015. Function ProcessCNAData in TCGA-Assembler package was used to obtain gene-level copy number value which is calculated as the average copy number of the genomic region of a gene. |
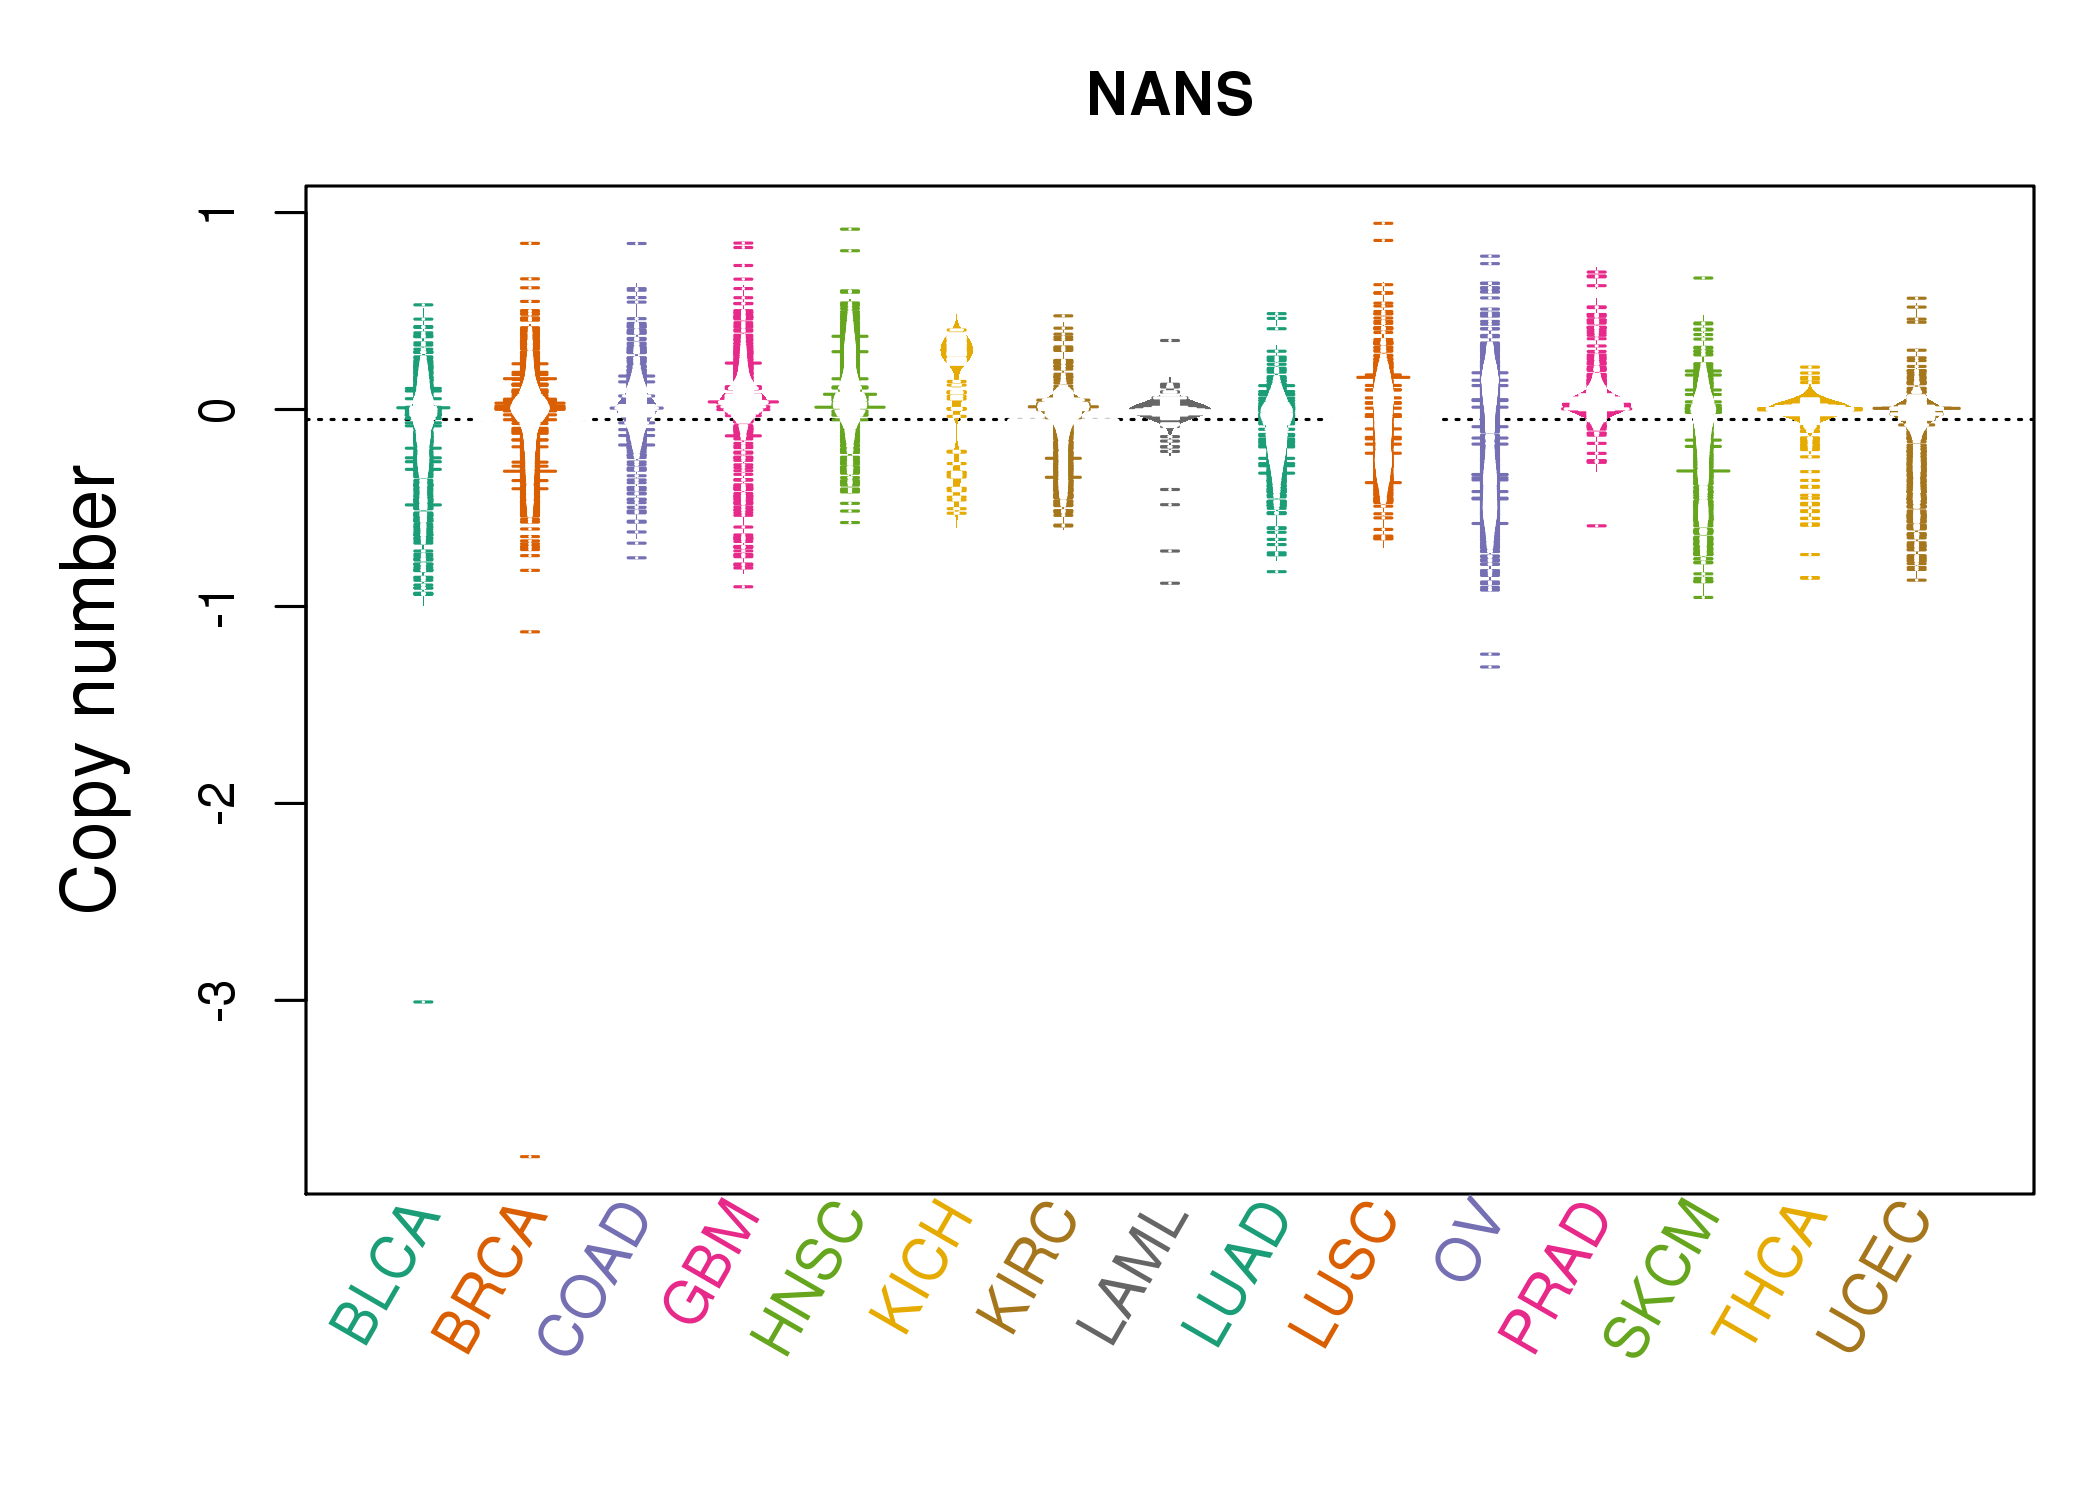 |
| cf) Tissue ID[Tissue type]: BLCA[Bladder Urothelial Carcinoma], BRCA[Breast invasive carcinoma], CESC[Cervical squamous cell carcinoma and endocervical adenocarcinoma], COAD[Colon adenocarcinoma], GBM[Glioblastoma multiforme], Glioma Low Grade, HNSC[Head and Neck squamous cell carcinoma], KICH[Kidney Chromophobe], KIRC[Kidney renal clear cell carcinoma], KIRP[Kidney renal papillary cell carcinoma], LAML[Acute Myeloid Leukemia], LUAD[Lung adenocarcinoma], LUSC[Lung squamous cell carcinoma], OV[Ovarian serous cystadenocarcinoma ], PAAD[Pancreatic adenocarcinoma], PRAD[Prostate adenocarcinoma], SKCM[Skin Cutaneous Melanoma], STAD[Stomach adenocarcinoma], THCA[Thyroid carcinoma], UCEC[Uterine Corpus Endometrial Carcinoma] |
| Top |
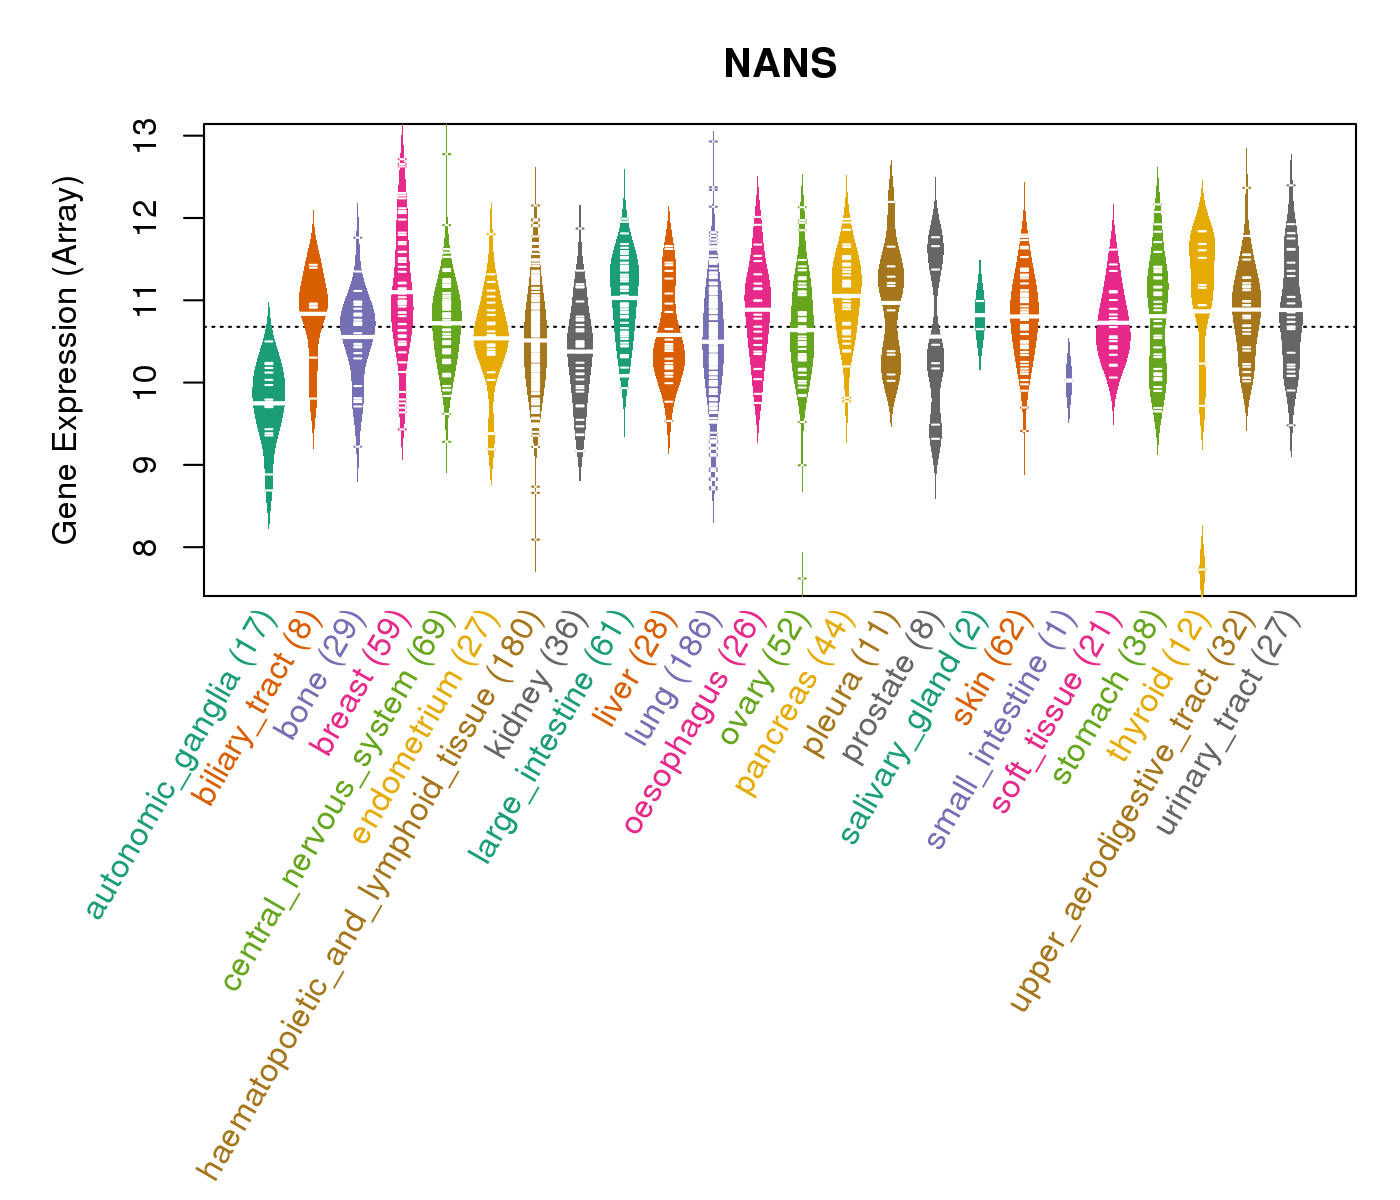
| Gene Expression for NANS |
| * CCLE gene expression data were extracted from CCLE_Expression_Entrez_2012-10-18.res: Gene-centric RMA-normalized mRNA expression data. |
 |
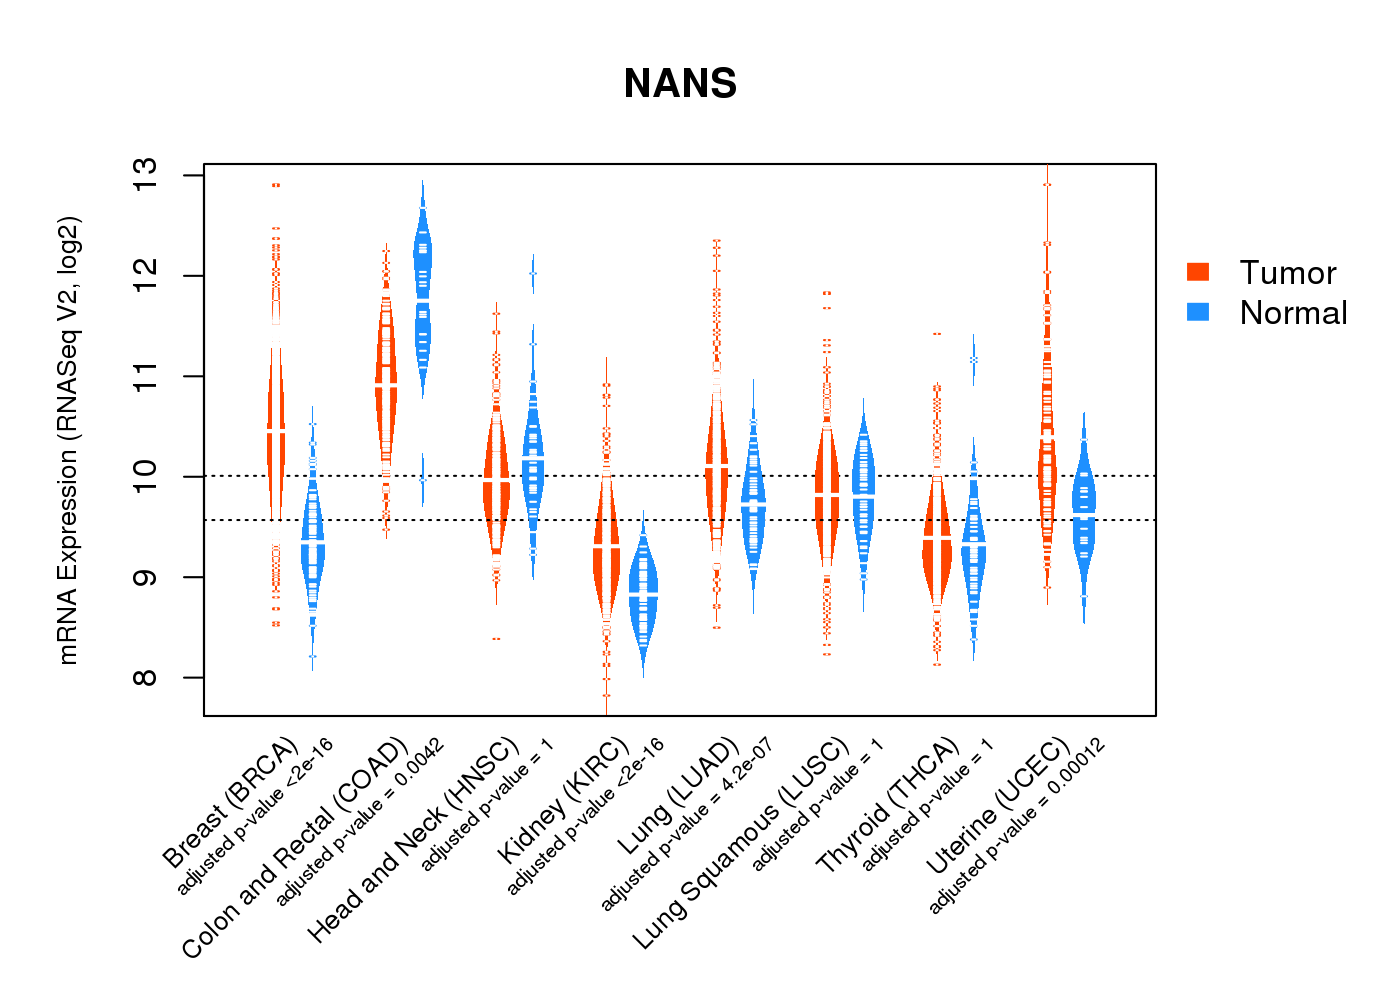
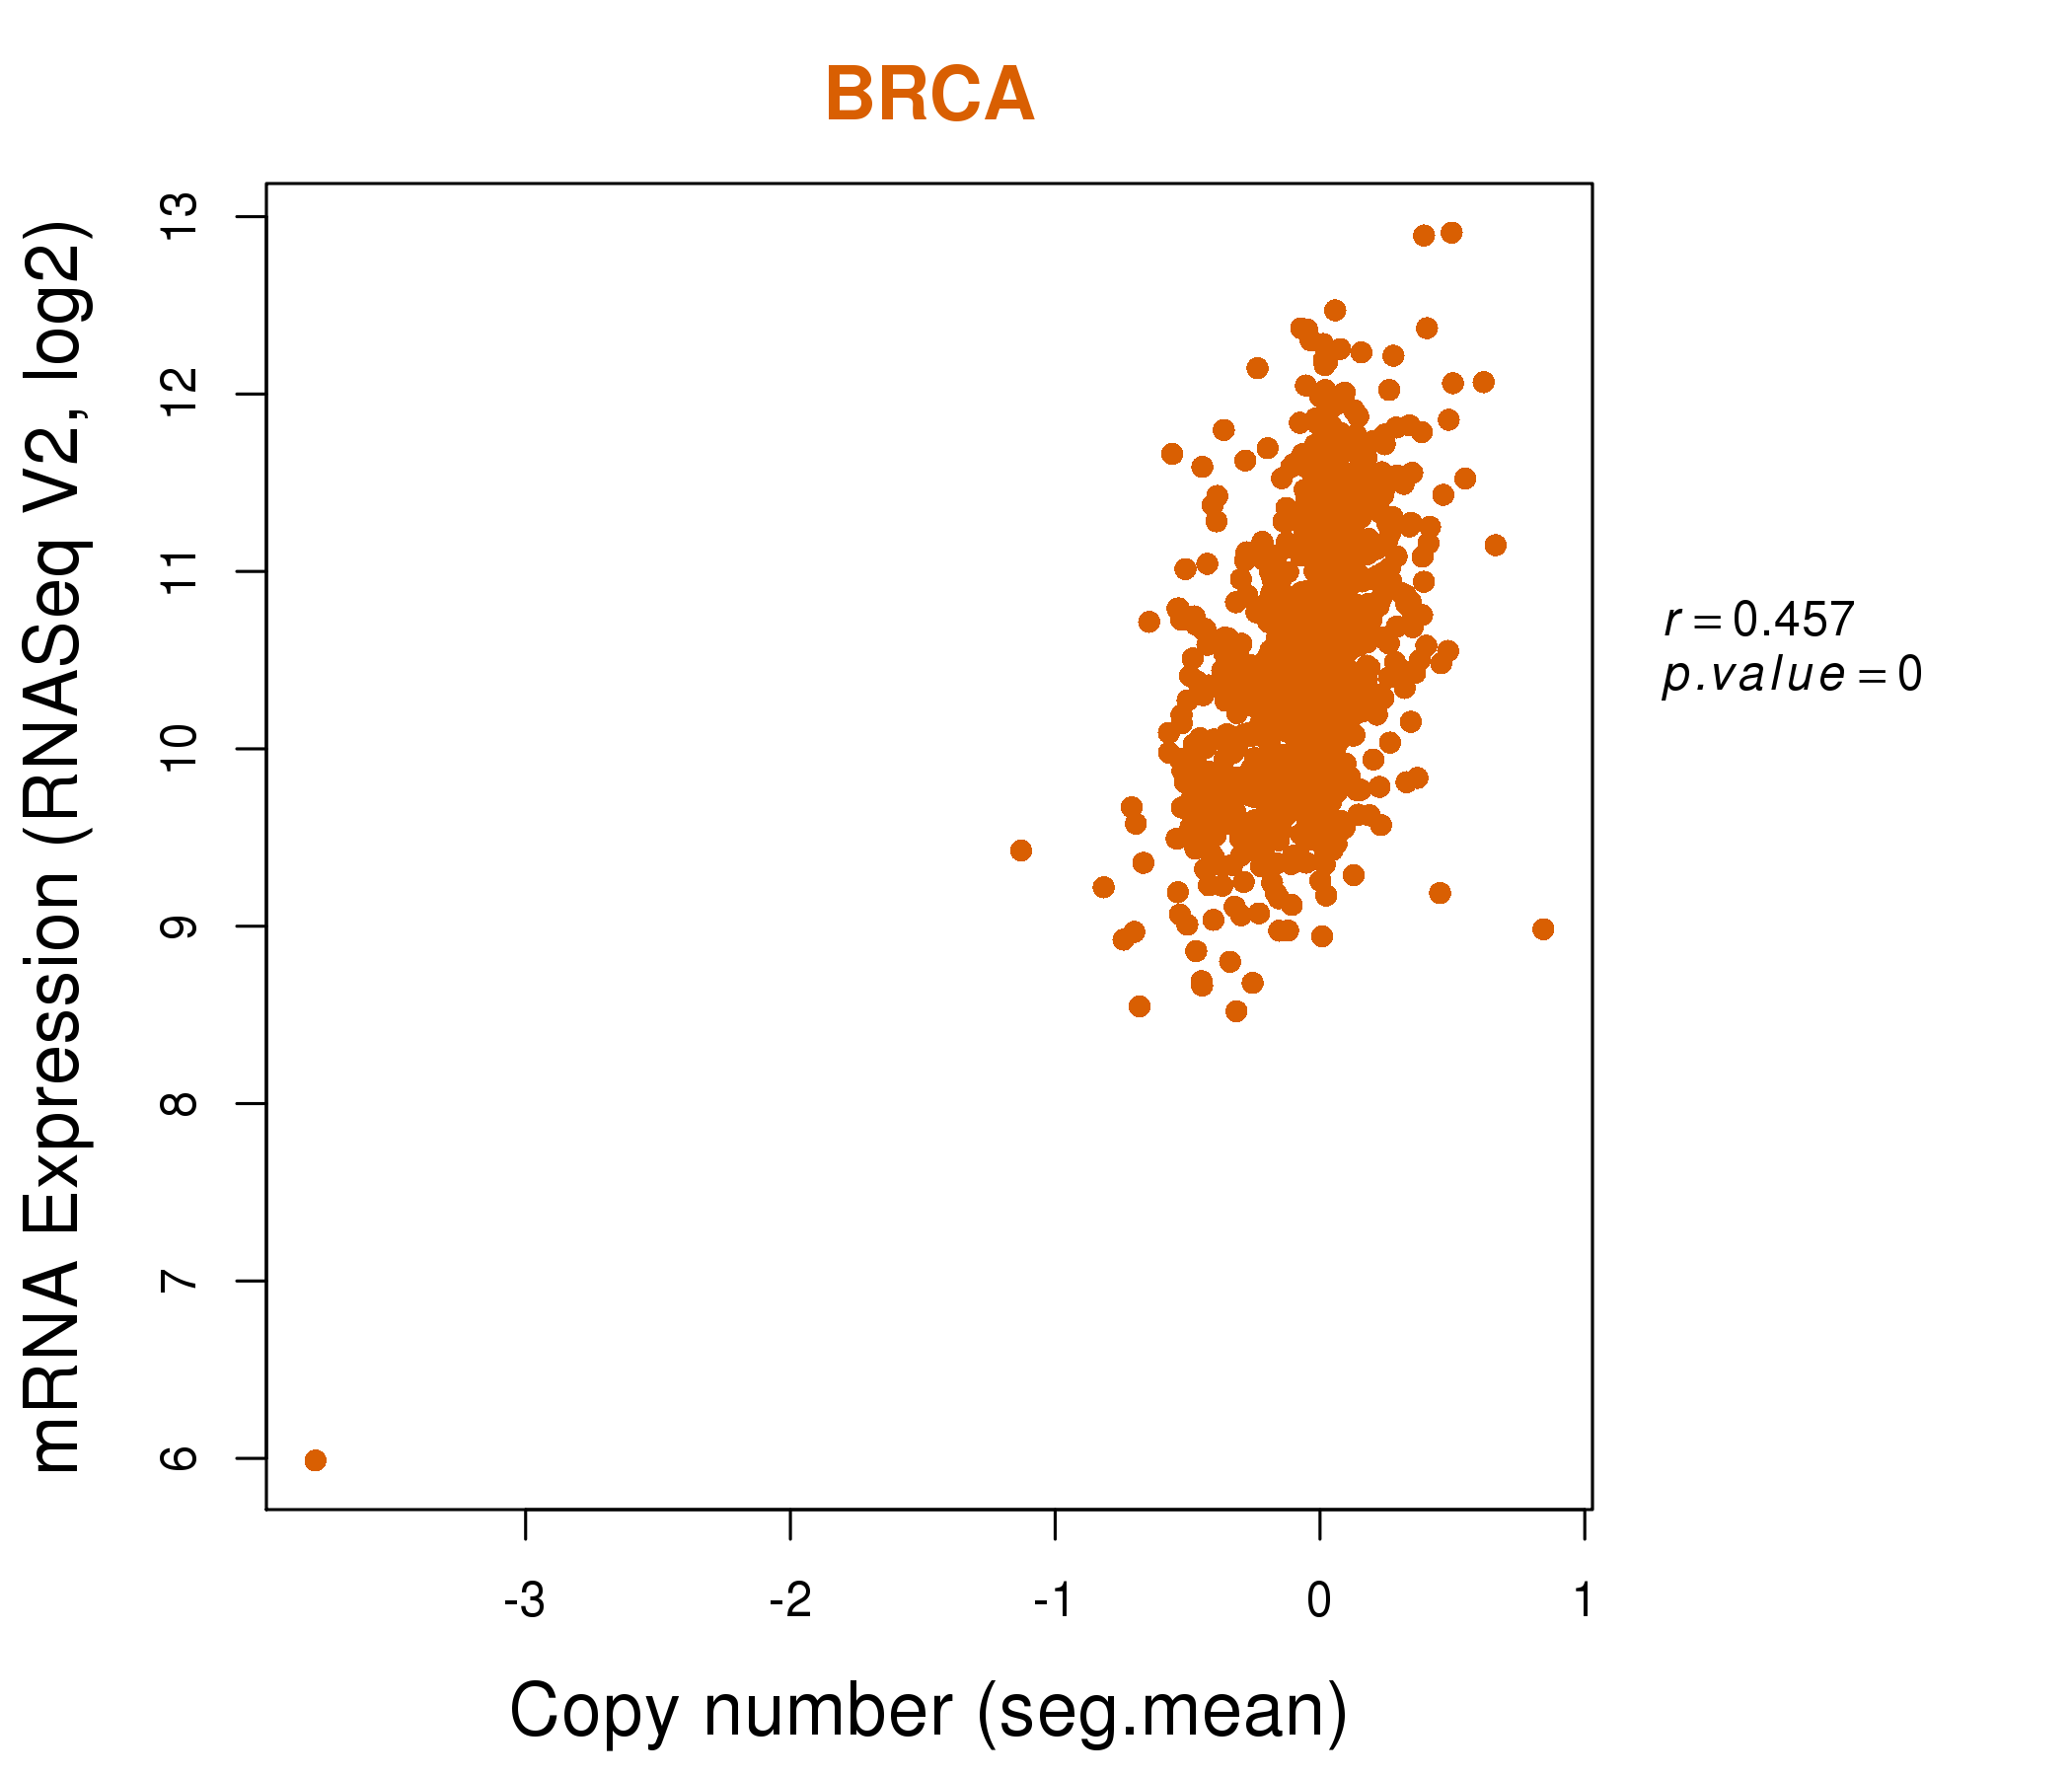
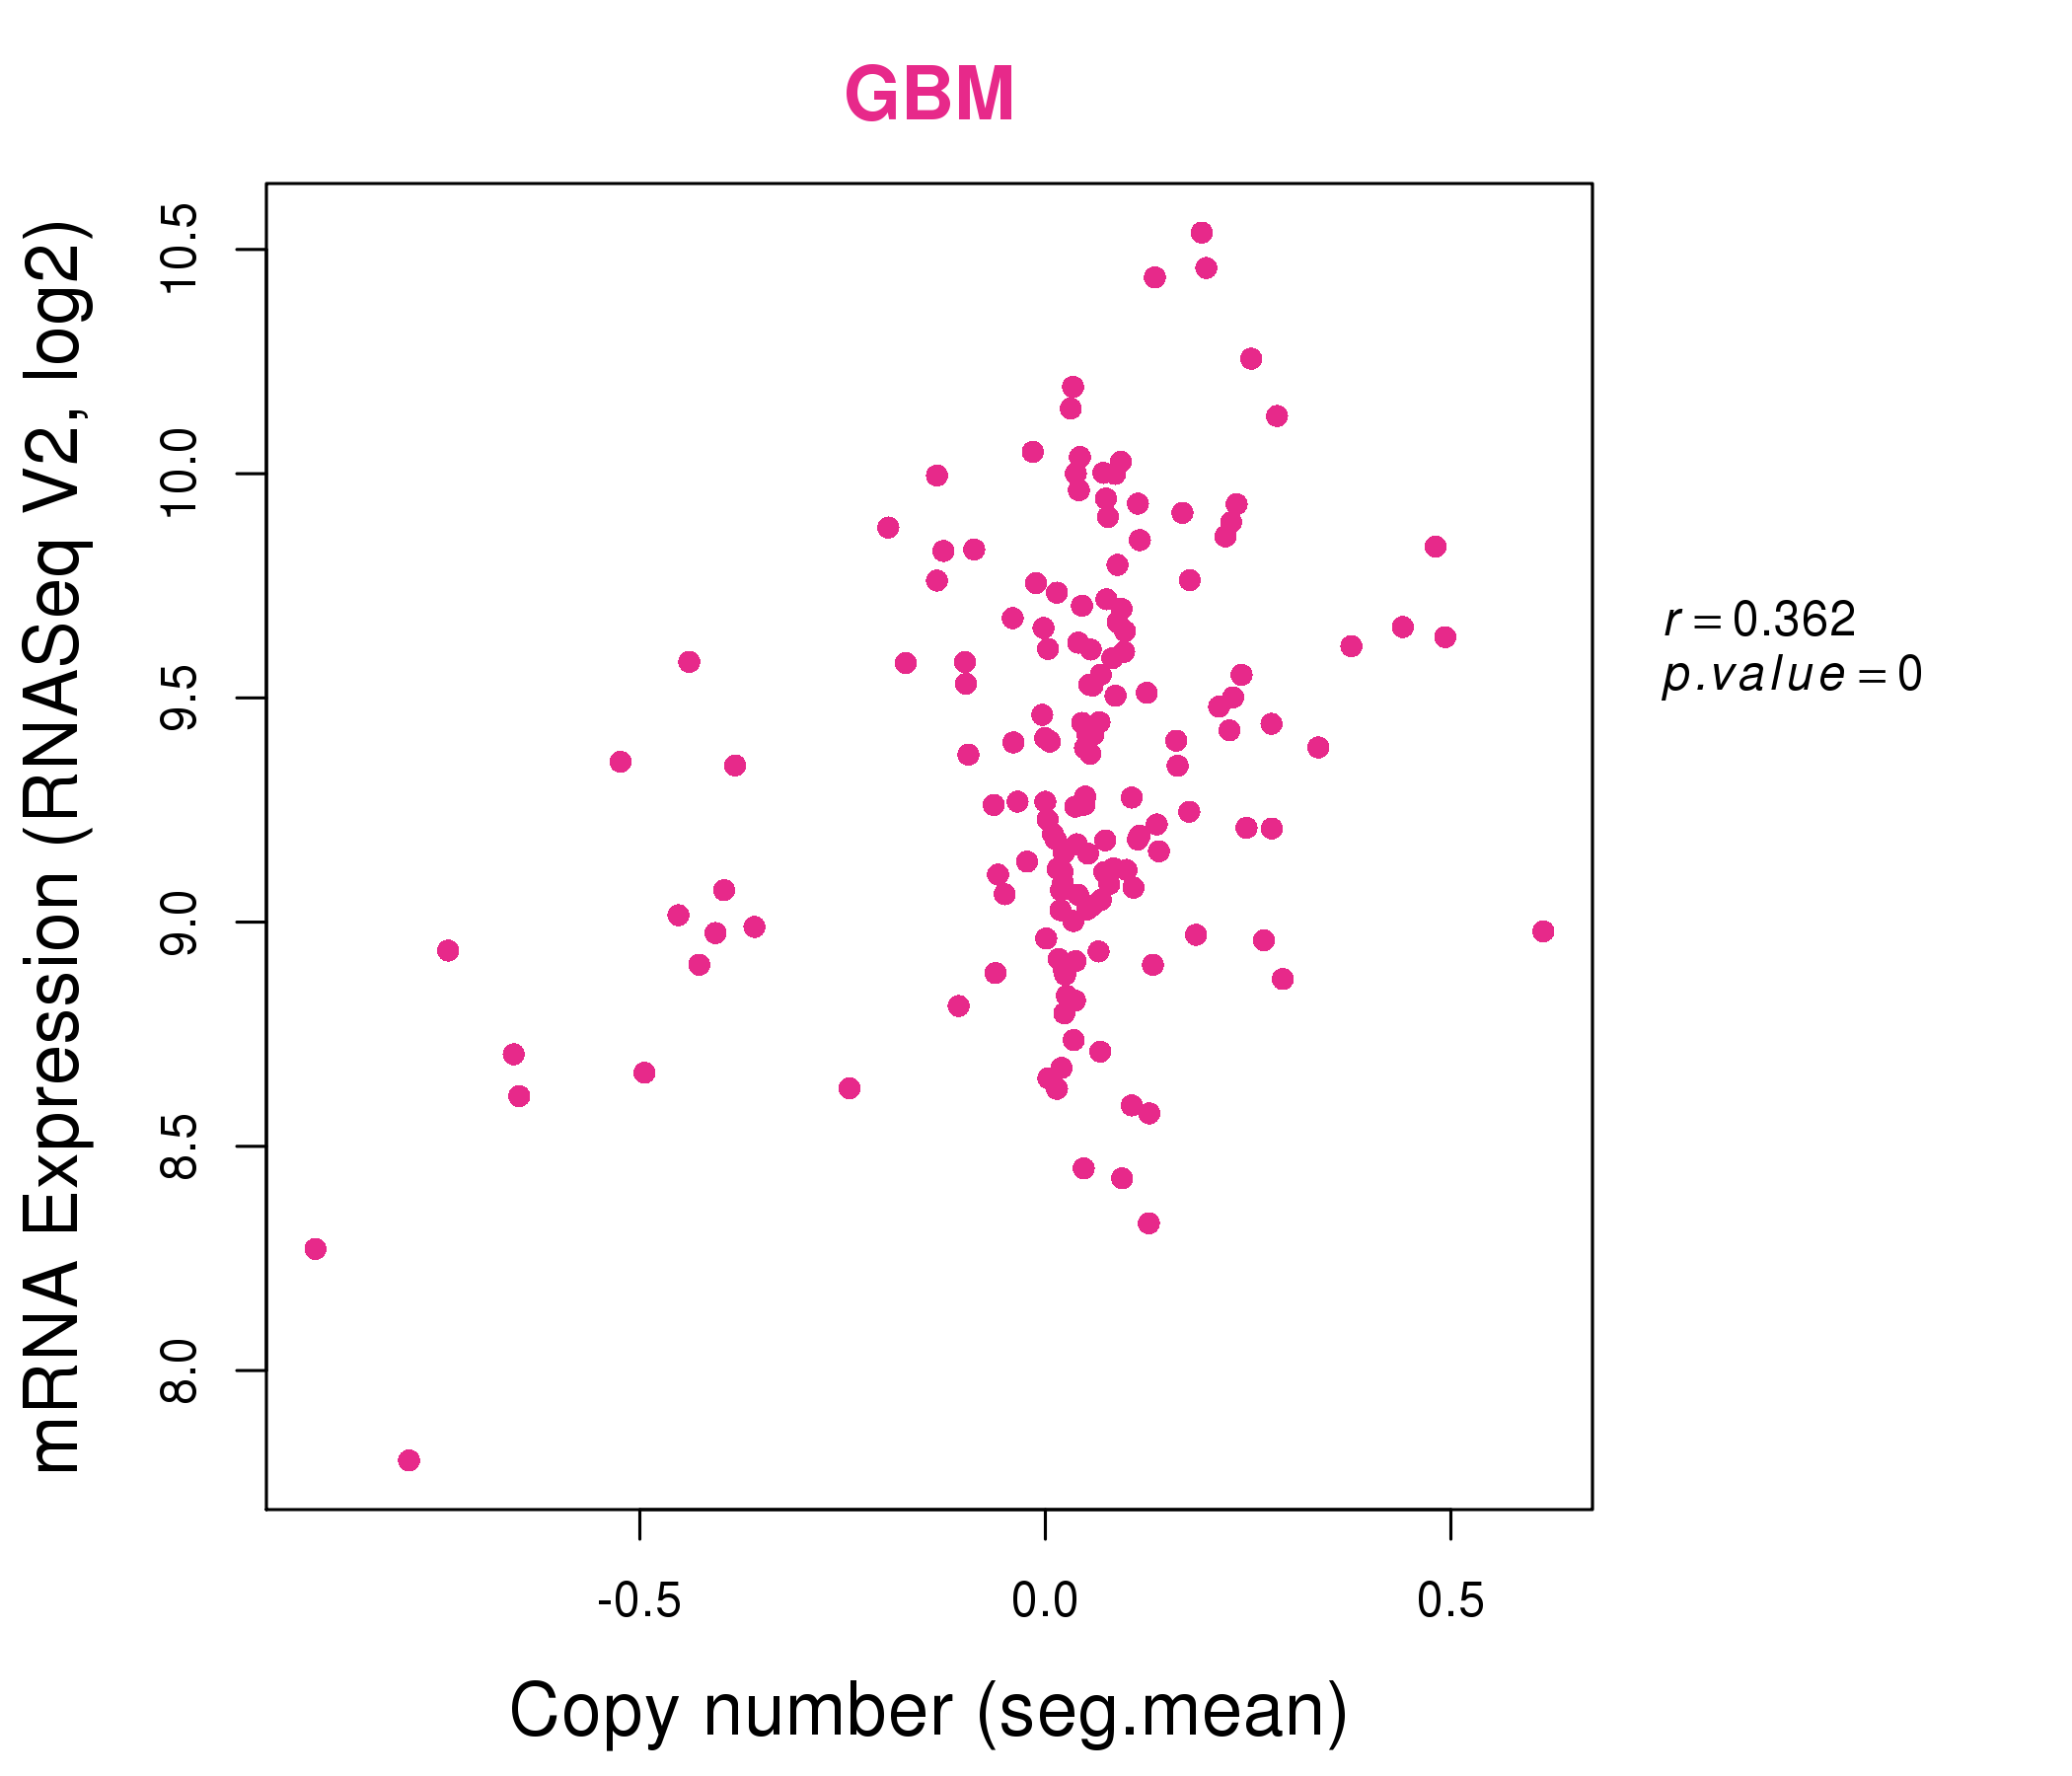
| * Normalized gene expression data of RNASeqV2 was extracted from TCGA using R package TCGA-Assembler. The URLs of all public data files on TCGA DCC data server were gathered at Jan-05-2015. Only eight cancer types have enough normal control samples for differential expression analysis. (t test, adjusted p<0.05 (using Benjamini-Hochberg FDR)) |
 |
| Top |
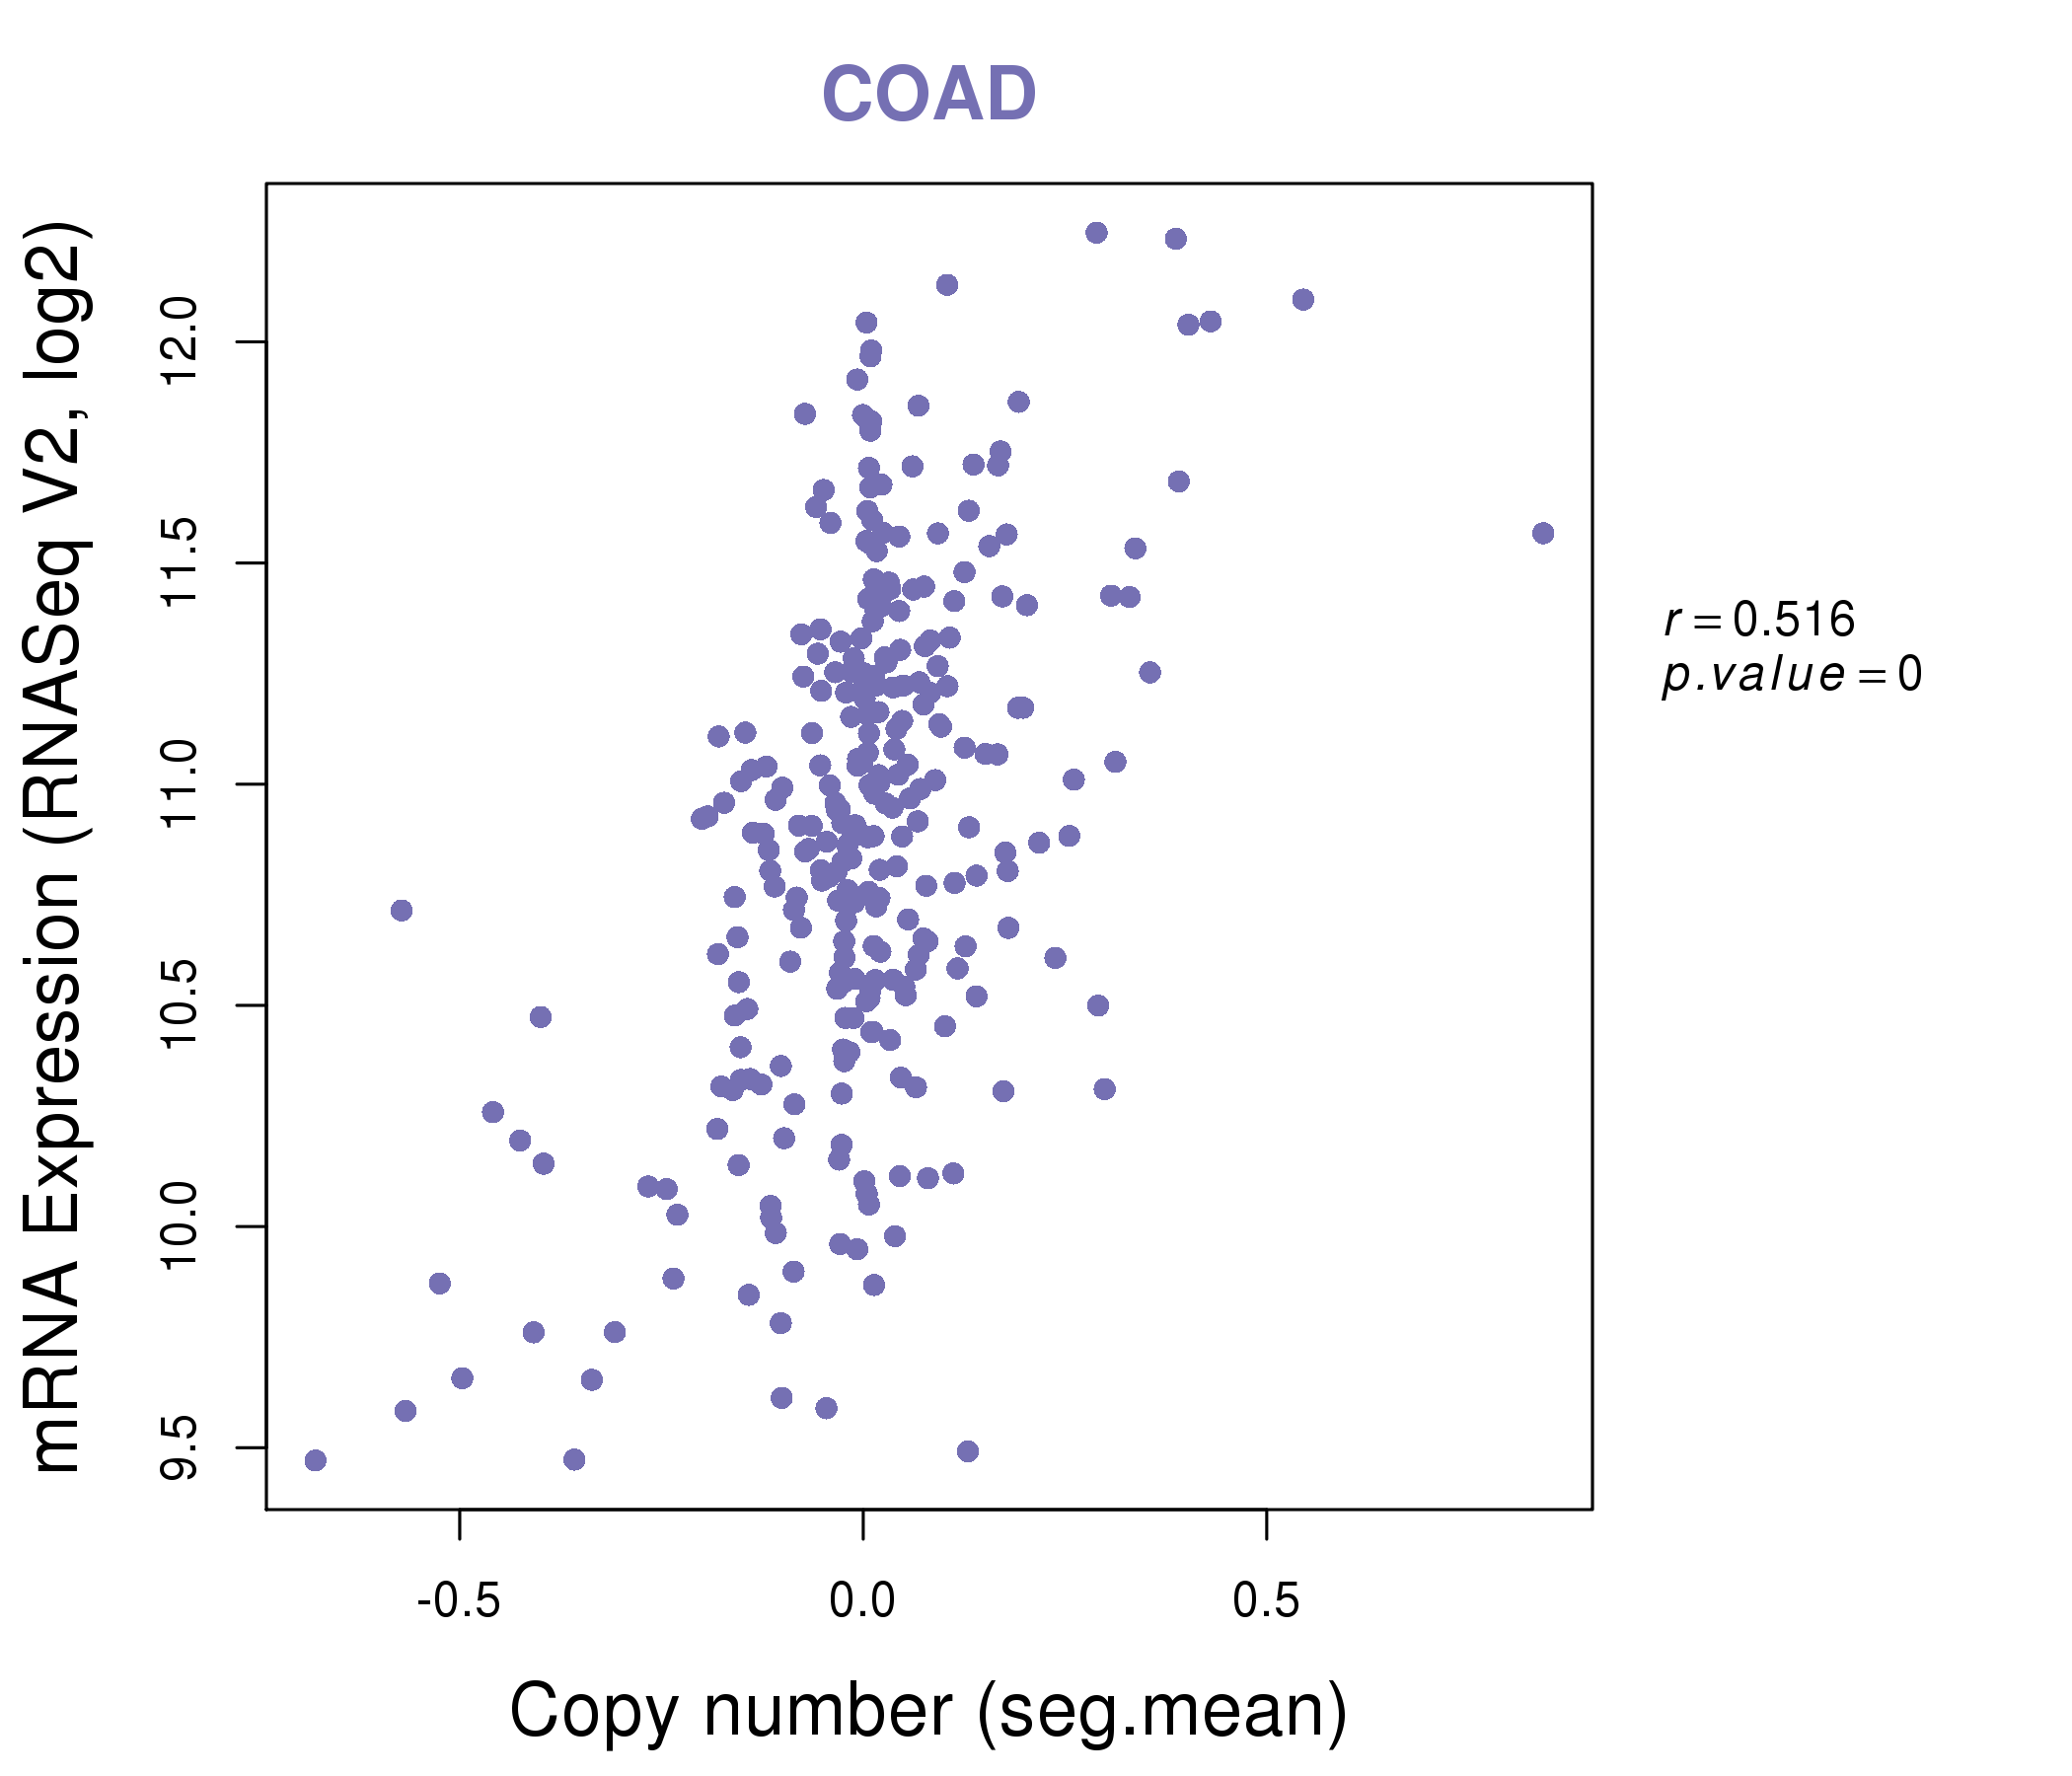
| * This plots show the correlation between CNV and gene expression. |
: Open all plots for all cancer types
 |
|
 |
|
| Top |
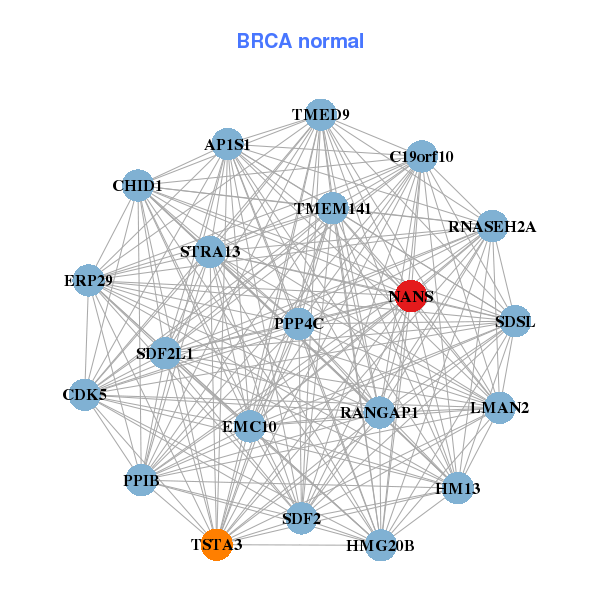
| Gene-Gene Network Information |
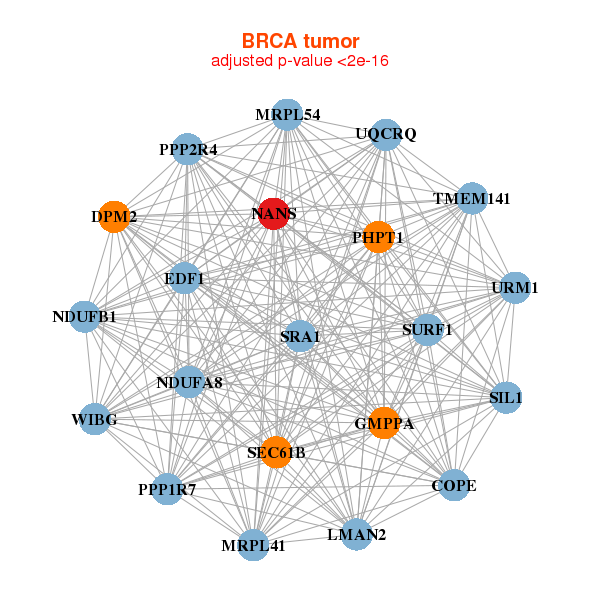
| * Co-Expression network figures were drawn using R package igraph. Only the top 20 genes with the highest correlations were shown. Red circle: input gene, orange circle: cell metabolism gene, sky circle: other gene |
: Open all plots for all cancer types
 |
|
| COPE,DPM2,EDF1,GMPPA,LMAN2,MRPL41,MRPL54, NANS,NDUFA8,NDUFB1,PHPT1,PPP1R7,PPP2R4,SEC61B, SIL1,SRA1,SURF1,TMEM141,UQCRQ,URM1,WIBG | AP1S1,C19orf10,EMC10,CDK5,CHID1,ERP29,HM13, HMG20B,LMAN2,NANS,PPIB,PPP4C,RANGAP1,RNASEH2A, SDF2,SDF2L1,SDSL,STRA13,TMED9,TMEM141,TSTA3 |
 |
|
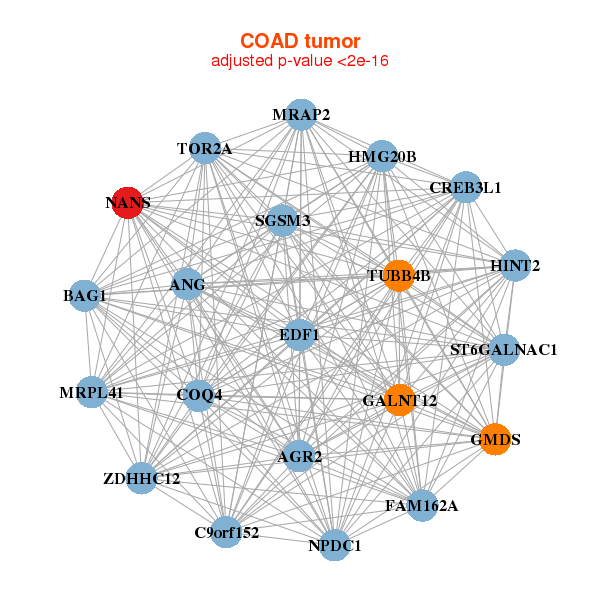
| AGR2,ANG,BAG1,C9orf152,COQ4,CREB3L1,EDF1, FAM162A,GALNT12,GMDS,HINT2,HMG20B,MRAP2,MRPL41, NANS,NPDC1,SGSM3,ST6GALNAC1,TOR2A,TUBB4B,ZDHHC12 | ARHGAP8,C9orf152,CREB3L1,FAM3D,FAS,GSTO2,HSBP1L1, IL1R2,MARCKSL1,MFSD6L,MRPS18A,NANS,PIGN,RXFP4, SGSM3,SLC35A2,SLC39A8,STARD10,SYNGR2,TMED3,TTC39A |
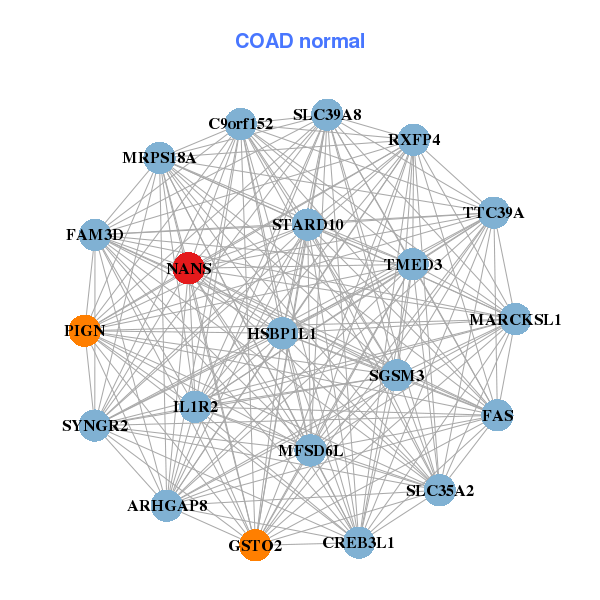
| * Co-Expression network figures were drawn using R package igraph. Only the top 20 genes with the highest correlations were shown. Red circle: input gene, orange circle: cell metabolism gene, sky circle: other gene |
: Open all plots for all cancer types
| Top |
: Open all interacting genes' information including KEGG pathway for all interacting genes from DAVID
| Top |
| Pharmacological Information for NANS |
| There's no related Drug. |
| Top |
| Cross referenced IDs for NANS |
| * We obtained these cross-references from Uniprot database. It covers 150 different DBs, 18 categories. http://www.uniprot.org/help/cross_references_section |
: Open all cross reference information
|
Copyright © 2016-Present - The Univsersity of Texas Health Science Center at Houston @ |